Industries > Aviation > Airport Security Market Report 2019-2029
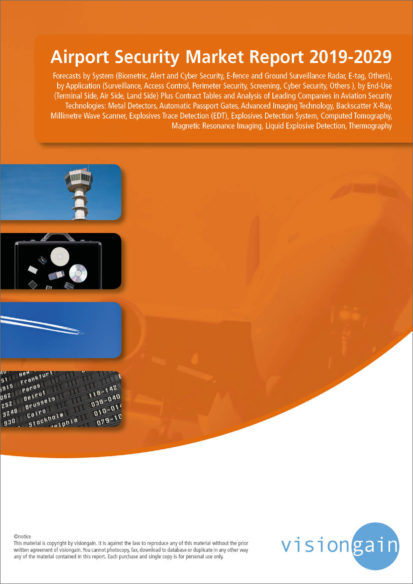
Airport Security Market Report 2019-2029
Forecasts by System (Biometric, Alert and Cyber Security, E-fence and Ground Surveillance Radar, E-tag, Others), by Application (Surveillance, Access Control, Perimeter Security, Screening, Cyber Security, Others ), by End-Use (Terminal Side, Air Side, Land Side) Plus Contract Tables and Analysis of Leading Companies in Aviation Security Technologies: Metal Detectors, Automatic Passport Gates, Advanced Imaging Technology, Backscatter X-Ray, Millimetre Wave Scanner, Explosives Trace Detection (EDT), Explosives Detection System, Computed Tomography, Magnetic Resonance Imaging, Liquid Explosive Detection, Thermography
The increase in security threats to airport infrastructures has led Visiongain to publish this timely report. The US$8.83bn airport security market is expected to flourish in the next few years. If you want to be part of this growing industry, then read on to discover how you can maximise your investment potential.
Airport security will continue to be in demand to counter the ongoing and dynamic threat to commercial air transport from terrorism and other criminal activity. The impacts that can result from a successful attack against aviation can be widespread and extremely damaging to the air transport industry and the wider economy. Therefore, it is in the interests of all stakeholders to ensure that security measures are implemented that can defend against a wide range of threats and that these are evaluated on a regular basis.
Airport security consists of a number of activities; screening of passengers, baggage and cargo, digital surveillance and monitoring, perimeter security, and access control. A variety of technologies have been developed and deployed to ensure that these tasks can be conducted to required standards, offering end-users high value. The industry continues to see technological innovation to facilitate greater detection accuracy and speed, integrated solutions, automation and effective responses. This report contains four submarkets and identifies key trends and opportunities for stakeholders in the airport security market.
• Do you need definitive airport security market data?
• Succinct airport security market analysis?
• Technological insight?
• Clear competitor analysis?
• Actionable business recommendations?
Report highlights
359 Tables, Charts, And Graphs
303 Airport Security Contracts, Projects And Programmes
Analysis Of Key Players In The Airport Security Market
• Analogic Corporation
• Bruker Corporation
• CEIA SpA
• G4S plc
• L3 Technologies
• OT-Morpho (IDEMIA)
• Nuctech Company Ltd
• OSI Systems Inc. / Rapiscan Systems Company
• Securitas AB
• Smiths Detection (Smiths Group Plc Division)
• SITA
• Hitachi Ltd.
• Thales Group
• The Brinks Co.
• Siemens AG
Global Airport Security market outlook and analysis from 2018-2029
Global Airport Security Submarket Forecasts 2019-2029
Global Airport Security Market Forecast by System 2019-2029
• Biometric System Forecast 2019-2029
• Alert and Cyber Security System Forecast 2019-2029
• E-fence and Ground Surveillance Radar System Forecast 2019-2029
• E-tag System Forecast 2019-2029
• Others Forecast 2019-2029
Global Airport Security Market Forecast by Application 2019-2029
• Surveillance Forecast 2019-2029
• Access Control Forecast 2019-2029
• Perimeter Security Forecast 2019-2029
• Screening Forecast 2019-2029
• Cyber Security Forecast 2019-2029
• Others Forecast 2019-2029
Global Airport Security Market Forecast by End-use 2019-2029
• Terminal Side Forecast 2019-2029
• Air Side Forecast 2019-2029
• Land Side Forecast 2019-2029
Global Airport Security Market Forecast by Geography 2019-2029
North America Airport Security Market Analysis and Forecast 2019 – 2029
• North America Airport Security Market Forecast by System 2019-2029
• North America Airport Security Market Forecast by Application 2019–2029
• North America Airport Security Market Analysis by End-use 2019-2029
• North America Airport Security Market Forecast by Country 2019-2029
• U.S. Airport Security Market Forecast 2019-2029
• Canada Airport Security Market Forecast 2019-2029
• Rest of North America Airport Security Market Forecast 2019-2029
Europe Airport Security Market Analysis and Forecast 2019 – 2029
• Europe Airport Security Market Forecast by System 2019-2029
• Europe Airport Security Market Forecast by Application 2019–2029
• Europe Airport Security Market Analysis by End-use 2019-2029
• Europe Airport Security Market Forecast by Country 2019-2029
• U.K. Airport Security Market Forecast 2019-2029
• Spain Airport Security Market Forecast 2019-2029
• Italy Airport Security Market Forecast 2019-2029
• Germany Airport Security Market Forecast 2019-2029
• Rest of Europe Airport Security Market Forecast 2019-2029
Asia Pacific Airport Security Market Analysis and Forecast 2019-2029
• Asia Pacific Airport Security Market Forecast by System 2019-2029
• Asia Pacific Airport Security Market Forecast by Application 2019–2029
• Asia Pacific Airport Security Market Analysis by End-use 2019-2029
• Asia Pacific Airport Security Market Forecast by Country 2019-2029
• China Airport Security Market Forecast 2019-2029
• Japan Airport Security Market Forecast 2019-2029
• India Airport Security Market Forecast 2019-2029
• Australasia Airport Security Market Forecast 2019-2029
• Rest of Asia Pacific Airport Security Market Forecast 2019-2029
Middle East and Africa Airport Security Market Analysis and Forecast 2019- 2029
• Middle East and Africa Airport Security Market Forecast by System 2019-2029
• Middle East and Africa Airport Security Market Forecast by Application 2019–2029
• Middle East and Africa Airport Security Market Analysis by End-use 2019-2029
• Middle East and Africa Airport Security Market Forecast by Country 2019-2029
• GCC Countries Airport Security Market Forecast 2019-2029
• South Africa Airport Security Market Forecast 2019-2029
• Rest of Middle East and Africa Airport Security Market Forecast 2019-2029
South America Airport Security Market Analysis and Forecast 2019-2029
• South America Airport Security Market Forecast by System 2019-2029
• South America Airport Security Market Forecast by Application 2019–2029
• South America Airport Security Market Analysis by End-use 2019-2029
• South America Airport Security Market Forecast by Country 2019-2029
• Brazil Airport Security Market Forecast 2019-2029
• Argentina Airport Security Market Forecast 2019-2029
• Rest of South America Airport Security Market Forecast 2019-2029
Key questions answered
• What does the future hold for the airport security industry?
• Where should you target your business strategy?
• Which applications should you focus upon?
• Which disruptive technologies should you invest in?
• Which companies should you form strategic alliances with?
• Which company is likely to success and why?
• What business models should you adopt?
• What industry trends should you be aware of?
Target audience
• Airport security vendors
• Physical security suppliers
• Biometrics specialists
• Equipment suppliers
• Electronics companies
• Technologists
• R&D staff
• Consultants
• Analysts
• CEO’s
• CIO’s
• COO’s
• Business development managers
• Investors
• Governments
• Agencies
• Industry organisations
• Banks
Visiongain is a trading partner with the US Federal Government
CCR Ref number: KD4R6
Do you have any custom requirements we can help you with? Any need for specific country, geo region, market segment or specific company information? Contact us today, we can discuss your needs and see how we can help: sara.peerun@visiongain.com
1. Report Overview
1.1 Global Airport Security Market Overview
1.2 Global Airport Security Market Segmentation
1.3 Why You Should Read This Report
1.4 How This Report Delivers
1.5 Key Questions Answered by This Analytical Report Include:
1.6 Who is This Report For?
1.7 Methodology
1.7.1 Secondary Research
1.7.2 Market Evaluation & Forecasting Methodology
1.8 Frequently Asked Questions (FAQ)
1.9 Associated Visiongain Reports
1.10 About Visiongain
2. Introduction to the Airport Security Market
2.1 Global Airport Security Market Structure
2.2 Airport Security Market Definition
2.2.1 An Overview of Airport Security
2.2.2 Who is Responsible for Aviation Security?
2.3 Introduction to Airport Security Technology
2.3.1 Advanced Imaging Technology
2.3.2 Backscatter X-Ray
2.3.3 Millimetre Wave Scanner
2.3.4 Explosives Trace Detection
2.3.5 Explosives Detection System
2.3.6 Computed Tomography
2.3.7 Magnetic Resonance Imaging
2.3.8 Liquid Explosive Detection
2.3.9 Biometrics
2.3.10 Thermography
2.3.11 Internet Protocol Video Surveillance
2.4 Types of Airport Security Technology
2.4.1 Full Body Scanners
2.4.2 Metal Detectors
2.4.3 Explosives Detection Machines
2.4.4 Explosives Trace Detection
2.4.5 Automatic Passport Gates
2.4.6 Identity Verification Cards
3. Global Airport Security Submarket Forecasts 2019-2029
3.1 Global Airport Security Market Forecast by System 2019-2029
3.2 Global Airport Security Market Forecast by Application 2019-2029
3.3 Global Airport Security Market Forecast by End-use 2019-2029
3.4 Global Airport Security Market Forecast by Geography 2019-2029
4. North America Airport Security Market Analysis and Forecast 2019 - 2029
4.1 North America Airport Security Market Forecast by System 2019-2029
4.2 North America Airport Security Market Forecast by Application 2019 – 2029
4.3 North America Airport Security Market Analysis by End-use 2019-2029
4.4 North America Airport Security Market Forecast by Country 2019-2029
4.4.1 U.S. Airport Security Market Forecast 2019-2029
4.4.2 Canada Airport Security Market Forecast 2019-2029
4.4.3 Rest of North America Airport Security Market Forecast 2019-2029
5. Europe Airport Security Market Analysis and Forecast 2019 - 2029
5.1 Europe Airport Security Market Forecast by System 2019-2029
5.2 Europe Airport Security Market Forecast by Application 2019 – 2029
5.3 Europe Airport Security Market Analysis by End-use 2019-2029
5.4 Europe Airport Security Market Forecast by Country 2019-2029
5.4.1 U.K. Airport Security Market Forecast 2019-2029
5.4.2 Spain Airport Security Market Forecast 2019-2029
5.4.3 Italy Airport Security Market Forecast 2019-2029
5.4.4 Germany Airport Security Market Forecast 2019-2029
5.4.5 Rest of Europe Airport Security Market Forecast 2019-2029
6. Asia Pacific Airport Security Market Analysis and Forecast 2019 - 2029
6.1 Asia Pacific Airport Security Market Forecast by System 2019-2029
6.2 Asia Pacific Airport Security Market Forecast by Application 2019 – 2029
6.3 Asia Pacific Airport Security Market Analysis by End-use 2019-2029
6.4 Asia Pacific Airport Security Market Forecast by Country 2019-2029
6.4.1 China Airport Security Market Forecast 2019-2029
6.4.2 Japan Airport Security Market Forecast 2019-2029
6.4.3 India Airport Security Market Forecast 2019-2029
6.4.4 Australasia Airport Security Market Forecast 2019-2029
6.4.5 Rest of Asia Pacific Airport Security Market Forecast 2019-2029
7. Middle East and Africa Airport Security Market Analysis and Forecast 2019 - 2029
7.1 Middle East and Africa Airport Security Market Forecast by System 2019-2029
7.2 Middle East and Africa Airport Security Market Forecast by Application 2019 – 2029
7.3 Middle East and Africa Airport Security Market Analysis by End-use 2019-2029
7.4 Middle East and Africa Airport Security Market Forecast by Country 2019-2029
7.4.1 GCC Countries Airport Security Market Forecast 2019-2029
7.4.2 South Africa Airport Security Market Forecast 2019-2029
7.4.3 Rest of Middle East and Africa Airport Security Market Forecast 2019-2029
8. South America Airport Security Market Analysis and Forecast 2019 - 2029
8.1 South America Airport Security Market Forecast by System 2019-2029
8.2 South America Airport Security Market Forecast by Application 2019 – 2029
8.3 South America Airport Security Market Analysis by End-use 2019-2029
8.4 South America Airport Security Market Forecast by Country 2019-2029
8.4.1 Brazil Airport Security Market Forecast 2019-2029
8.4.2 Argentina Airport Security Market Forecast 2019-2029
8.4.3 Rest of South America Airport Security Market Forecast 2019-2029
9. Leading Airport Security Companies
9.1 Leading Airport Security Companies 2019
9.2 Analogic Corporation
9.2.1 Analogic Corporation Airport Security Selected Recent Contracts / Projects / Programmes 2011-2019
9.2.2 Analogic Corporation Total Company Net Sales 2013-2017
9.2.3 Analogic Corporation Sales in the Security and Detection Division 2013-2017
9.2.4 Analogic Corporation Sales Share by Segment of Business 2017
9.2.5 Analogic Corporation Regional Emphasis / Focus
9.2.6 Analogic Corporation Organisational Structure / Subsidiaries / Number of Employees
9.2.7 Analogic Corporation Airport Security Products / Services
9.2.8 Analogic Corporation Primary Market Competitors 2018
9.2.9 Analogic Corporation Mergers & Acquisitions (M&A) Activity
9.2.10 Analogic Corporation Overview
9.2.11 Security and Detection is Utilising Advanced CT Technology
9.2.12 Financial Performance of Analogic Corporation
9.2.13 Analogic Corporation Future Outlook
9.3 Bruker Corporation
9.3.1 Bruker Corporation Airport Security Market Selected Recent Contracts / Projects / Programmes 2014-2018
9.3.2 Bruker Corporation Total Company Net Sales 2013-2018
9.3.3 Bruker Corporation Sales in the BSI Division 2013-2018
9.3.4 Bruker Corporation Net Income 2013-2018
9.3.5 Bruker Corporation Sales Share by Segment of Business 2018
9.3.6 Bruker Corporation Regional Emphasis / Focus, 2013-2018
9.3.7 Bruker Corporation Organisational Structure / Subsidiaries / Number of Employees
9.3.8 Bruker Corporation Airport Security Market Products / Services
9.3.9 Bruker Corporation Primary Market Competitors 2019
9.3.10 Bruker Corporation Mergers & Acquisitions (M&A) Activity
9.3.11 Bruker Corporation Overview
9.3.12 Bruker’s Activities in Airport Security
9.3.13 A Global Distribution of Facilities
9.3.14 Financial Performance of Bruker Corporation
9.3.15 Bruker Corporation Future Outlook
9.4 CEIA SpA
9.4.1 CEIA SpA Airport Security Market Selected Recent Contracts / Projects / Programmes 2011-2019
9.4.2 CEIA SpA Regional Emphasis / Focus
9.4.3 CEIA SpA Organisational Structure / Subsidiaries
9.4.4 CEIA SpA Airport Security Market Products / Services
9.4.5 CEIA SpA Primary Market Competitors 2019
9.4.6 CEIA SpA Overview
9.4.7 A Diverse Portfolio of Products for Transport Security Applications
9.4.8 CEIA SpA Future Outlook
9.5 G4S plc
9.5.1 G4S plc Airport Security Market Selected Recent Contracts /Projects / Programmes 2011-2019
9.5.2 G4S plc Total Company Sales 2013-2018
9.5.3 G4S plc Net Income / Loss 2013-2018
9.5.4 G4S plc Sales Share by Segment of Business 2018
9.5.5 G4S plc Regional Emphasis / Focus
9.5.6 G4S plc Organisational Structure / Subsidiaries / Number of Employees
9.5.7 G4S plc Airport Security Market Products / Services
9.5.8 G4S plc Primary Market Competitors 2019
9.5.9 G4S plc Overview
9.5.10 G4S and Airport Security
9.5.11 Financial Performance of G4S plc
9.5.12 G4S plc Future Outlook
9.6 L-3 Technologies
9.6.1 L-3 Technologies. Airport Security Market Selected Recent Contracts / Projects / Programmes 2011-2019
9.6.2 Implant Sciences Corporation Airport Security Market Selected Recent Contracts / Projects / Programmes 2013-2019
9.6.3 L-3 Technologies Total Company Net Sales 2013-2018
9.6.4 L-3 Technologies Net Income 2013-2018
9.6.5 L-3 Technologies Sales Share by Segment of Business 2018
9.6.6 L-3 Technologies Regional Emphasis / Focus
9.6.7 L-3 Technologies Organisational Structure / Subsidiaries / Number of Employees
9.6.8 L-3 Technologies Airport Security Market Products / Services
9.6.9 L-3 Technologies Primary Market Competitors 2019
9.6.10 L-3 Technologies Mergers & Acquisitions (M&A) Activity
9.6.11 L-3 Technologies Overview
9.6.12 L-3 Security and Detection Systems
9.6.13 Financial Performance of L-3 Technologies
9.6.14 L-3 Technologies Future Outlook
9.7 OT-Morpho (IDEMIA)
9.7.1 OT-Morpho (IDEMIA) Airport Security Market Selected Recent Contracts / Projects / Programmes 2013-2019
9.7.2 OT-Morpho (IDEMIA) Organisational Structure
9.7.3 OT-Morpho (IDEMIA) Airport Security Market Products / Services
9.7.4 OT-Morpho (IDEMIA) Primary Market Competitors 2019
9.7.5 OT-Morpho (IDEMIA) Overview
9.7.6 A Strong Focus on Biometrics
9.7.7 OT-Morpho (IDEMIA) Future Outlook
9.8 Nuctech Company Ltd
9.8.1 Nuctech Company Ltd Airport Security Market Selected Recent Contracts / Projects / Programmes 2012-2019
9.8.2 Nuctech Company Ltd Regional Emphasis / Focus
9.8.3 Nuctech Company Ltd Organisational Structure / Subsidiaries
9.8.4 Nuctech Company Ltd Airport Security Market Products / Services
9.8.5 Nuctech Company Ltd Primary Market Competitors 2019
9.8.6 Nuctech Company Ltd Overview
9.8.7 A Diverse Airport Security Product Portfolio
9.8.8 Nuctech Company Ltd Future Outlook 248
9.9 OSI Systems Inc. / Rapiscan Systems Company 249
9.9.1 OSI Systems, Inc. / Rapiscan Systems Airport Security Market Selected Recent Contracts / Projects / Programmes 2012-2019
9.9.2 OSI Systems Inc. Total Company Sales 2012-2018
9.9.3 OSI Systems Inc. Net Income 2012-2018
9.9.4 OSI Systems Inc. Sales Share by Segment of Business 2018
9.9.5 Rapiscan Systems Regional Emphasis / Focus
9.9.6 Rapiscan Systems Organisational Structure / Subsidiaries
9.9.7 Rapiscan Systems Airport Security Market Products / Services
9.9.8 OSI System Inc. /Rapiscan Systems Primary Market Competitors 2019
9.9.9 OSI Systems, Inc. Mergers & Acquisitions (M&A) Activity
9.9.10 Rapiscan Systems Overview
9.9.11 Financial Performance of OSI Systems Inc.
9.9.12 Rapiscan Systems and Airport Security
9.9.13 OSI Systems Inc. / Rapiscan Systems Future Outlook
9.10 Securitas AB
9.10.1 Securitas AB Airport Security Market Selected Recent Contracts / Projects / Programmes 2011-2019
9.10.2 Securitas AB Total Company Sales 2013-2018
9.10.3 Securitas AB Net Income 2013-2018
9.10.4 Securitas AB Regional Emphasis / Focus
9.10.5 Securitas AB Organisational Structure / Subsidiaries / Number of Employees
9.10.6 Securitas AB Airport Security Market Products / Services
9.10.7 Securitas AB Primary Market Competitors 2019
9.10.8 Securitas AB Mergers & Acquisitions (M&A) Activity
9.10.9 Securitas AB Overview
9.10.10 Securitas Aviation Security Services
9.10.11 Securitas’ Business Performance
9.10.12 Securitas AB Future Outlook
9.11 Smiths Detection (Smiths Group Plc Division)
9.11.1 Smiths Detection Airport Security Market Selected Recent Contracts / Projects / Programmes 2010-2019
9.11.2 Smiths Group Plc Total Company Sales 2012-2018
9.11.3 Smiths Detection Total Sales 2012-2018
9.11.4 Smiths Group Plc Net Income 2012-2018
9.11.5 Smiths Group Plc Sales Share by Segment of Business 2018
9.11.6 Smiths Detection Regional Emphasis / Focus
9.11.7 Smiths Detection Organisational Structure / Subsidiaries
9.11.8 Smiths Detection Airport Security Market Products / Services
9.11.9 Smiths Detection Primary Market Competitors 2019
9.11.10 Smiths Detection Overview
9.11.11 Smiths Detection and Airport Security
9.11.12 Smiths Detection Performance
9.11.13 Smiths Detection Future Outlook
9.12 SITA
9.12.1 SITA Airport Security Selected Recent Contracts / Projects / Programmes 2017-2019
9.12.2 SITA Organisational Structure / Subsidiaries / Number of Employees
9.12.3 SITA Airport Security Products / Services
9.12.4 SITA Primary Market Competitors 2019
9.12.5 SITA Mergers & Acquisitions (M&A) Activity
9.12.6 SITA Overview
9.12.7 Company’s Advanced Biometrics systems is the most preferred solution by Airport authorities
9.12.8 SITA Future Outlook
9.13 Hitachi Ltd.
9.13.1 Hitachi Ltd. Airport Security Market Selected Recent Contracts / Projects / Programmes 2014-2018
9.13.2 Hitachi Ltd. Total Company Net Sales 2014-2018
9.13.3 Hitachi Ltd. Net Income 2014-2018
9.13.4 Hitachi Ltd. Sales Share by Segment of Business 2018
9.13.5 Hitachi Ltd. Regional Emphasis / Focus
9.13.6 Hitachi Ltd. Subsidiaries / Number of Employees
9.13.7 Hitachi Ltd. Airport Security Market Products / Services
9.13.8 Hitachi Ltd. Primary Market Competitors 2019
9.13.9 Hitachi Ltd. Mergers & Acquisitions (M&A) Activity
9.13.10 Hitachi Ltd. Overview
9.13.11 A Global Distribution of Facilities
9.13.12 Financial Performance of Hitachi Ltd.
9.13.13 Hitachi Ltd. Future Outlook
9.14 Thales Group
9.14.1 Thales Group Airport Security Market Selected Recent Contracts / Projects / Programmes 2014-2019
9.14.2 Thales Group Total Company Net Sales 2014-2018
9.14.3 Thales Group Net Income 2014-2018
9.14.4 Thales Group Sales Share by Segment of Business 2018
9.14.5 Thales Group Regional Emphasis / Focus
9.14.6 Thales Group Organisational Structure / Subsidiaries / Number of Employees
9.14.7 Thales Group Airport Security Market Products / Services
9.14.8 Thales Group Overview
9.14.9 A Global Distribution of Facilities
9.14.10 Financial Performance of Thales Group
9.14.11 Thales Group Future Outlook
9.15 The Brinks Co.
9.15.1 The Brinks Co. Total Company Net Sales 2014-2018
9.15.2 The Brinks Co. Net Income 2014-2018
9.15.3 The Brinks Co. Sales Share by Segment of Business 2018
9.15.4 The Brinks Co. Regional Emphasis / Focus
9.15.5 The Brinks Co. Organisational Structure / Subsidiaries / Number of Employees
9.15.6 The Brinks Co. Airport Security Market Products / Services
9.15.7 The Brinks Co. Mergers & Acquisitions (M&A) Activity
9.15.8 The Brinks Co. Overview
9.15.9 Bruker’s Activities in Airport Security
9.15.10 A Global Distribution of Facilities
9.15.11 Financial Performance of The Brinks Co.
9.15.12 The Brinks Co. Future Outlook
9.16 Siemens AG
9.16.1 Siemens AG Airport Security Market Selected Recent Contracts / Projects / Programmes 2014-2018
9.16.2 Siemens AG Total Company Net Sales 2014-2018
9.16.3 Siemens AG Net Income 2014-2018
9.16.4 Siemens AG Sales Share by Segment of Business 2018
9.16.5 Siemens AG Regional Emphasis / Focus
9.16.6 Siemens AG Organisational Structure / Subsidiaries / Number of Employees
9.16.7 Siemens AG Airport Security Market Products / Services
9.16.8 Siemens AG Overview
9.16.9 Siemens’ Activities in Airport Security
9.16.10 A Global Distribution of Facilities
9.16.11 Financial Performance of Siemens AG
9.16.12 Siemens AG Future Outlook
9.17 Other Notable Companies in the Airport Security Market
9.17.1 Magal S3
9.17.2 Opgal Optronics Industries Ltd
9.17.3 Human Recognition Systems
9.17.4 Westminster Aviation Security Services Ltd
10. Conclusions and Recommendations
11. Glossary
List of Tables
Table 3.1 Global Airport Security Market Forecast by System 2019- 2029 (US$ Bn, AGR%, Cumulative)
Table 3.2 Global Airport Security Market Forecast by Application 2019- 2029 (US$ Bn, AGR%, Cumulative)
Table 3.3 Global Airport Security Market Forecast by End-use 2019- 2029 (US$ Bn, AGR%, Cumulative)
Table 3.4 Global Airport Security Market Forecast by System 2019- 2029 (US$ Bn, AGR%, Cumulative)
Table 4.1 North America Airport Security Market Forecast 2019-2029 ($bn, AGR %)
Table 4.2 North America Airport Security Market Forecast by System 2019- 2029 (US$ Bn, AGR%, Cumulative)
Table 4.3 North America Airport Security Market Forecast by Application 2019- 2029 (US$ Bn, AGR%, Cumulative)
Table 4.4 North America Airport Security Market Forecast by End-use 2019- 2029 (US$ Bn, AGR%, Cumulative)
Table 4.5 North America Airport Security Market Forecast by Country 2019- 2029 (US$ Bn, AGR%, Cumulative)
Table 4.6 U.S. Airport Security Market Forecast 2019-2029 ($bn, AGR %)
Table 4.7 Canada Airport Security Market Forecast 2019-2029 ($bn, AGR %)
Table 4.8 Rest of North America Airport Security Market Forecast 2019-2029 ($bn, AGR %)
Table 5.1 Europe Airport Security Market Forecast 2019-2029 ($bn, AGR %)
Table 5.2 Europe Airport Security Market Forecast by System 2019- 2029 (US$ Bn, AGR%, Cumulative)
Table 5.3 Europe Airport Security Market Forecast by Application 2019- 2029 (US$ Bn, AGR%, Cumulative)
Table 5.4 Europe Airport Security Market Forecast by End-use 2019- 2029 (US$ Bn, AGR%, Cumulative)
Table 5.5 Europe Airport Security Market Forecast by Country 2019- 2029 (US$ Bn, AGR%, Cumulative)
Table 5.6 U.K. Airport Security Market Forecast 2019-2029 ($bn, AGR %)
Table 5.7 Spain Airport Security Market Forecast 2019-2029 ($bn, AGR %)
Table 5.8 Italy Airport Security Market Forecast 2019-2029 ($bn, AGR %)
Table 5.9 Germany Airport Security Market Forecast 2019-2029 ($bn, AGR %)
Table 5.10 Rest of Europe Airport Security Market Forecast 2019-2029 ($bn, AGR %)
Table 6.1 Asia Pacific Airport Security Market Forecast 2019-2029 ($bn, AGR %)
Table 6.2 Asia Pacific Airport Security Market Forecast by System 2019- 2029 (US$ Bn, AGR%, Cumulative)
Table 6.3 Asia Pacific Airport Security Market Forecast by Application 2019- 2029 (US$ Bn, AGR%, Cumulative)
Table 6.4 Asia Pacific Airport Security Market Forecast by End-use 2019- 2029 (US$ Bn, AGR%, Cumulative)
Table 6.5 Asia Pacific Airport Security Market Forecast by Country 2019- 2029 (US$ Bn, AGR%, Cumulative)
Table 6.6 China Airport Security Market Forecast 2019-2029 ($bn, AGR %)
Table 6.7 Japan Airport Security Market Forecast 2019-2029 ($bn, AGR %)
Table 6.8 India Airport Security Market Forecast 2019-2029 ($bn, AGR %)
Table 6.9 Australasia Airport Security Market Forecast 2019-2029 ($bn, AGR %)
Table 6.10 Rest of Asia Pacific Airport Security Market Forecast 2019-2029 ($bn, AGR %)
Table 7.1 Middle East and Africa Airport Security Market Forecast 2019-2029 ($bn, AGR %)
Table 7.2 Middle East and Africa Airport Security Market Forecast by System 2019- 2029 (US$ Bn, AGR%, Cumulative)
Table 7.3 Middle East and Africa Airport Security Market Forecast by Application 2019- 2029 (US$ Bn, AGR%, Cumulative)
Table 7.4 Middle East and Africa Airport Security Market Forecast by End-use 2019- 2029 (US$ Bn, AGR%, Cumulative)
Table 7.5 Middle East and Africa Airport Security Market Forecast by Country 2019- 2029 (US$ Bn, AGR%, Cumulative)
Table 7.6 GCC Countries Airport Security Market Forecast 2019-2029 ($bn, AGR %)
Table 7.7 South Africa Airport Security Market Forecast 2019-2029 ($bn, AGR %)
Table 7.8 Rest of Middle East and Africa Airport Security Market Forecast 2019-2029 ($bn, AGR %)
Table 8.1 South America Airport Security Market Forecast 2019-2029 ($bn, AGR %)
Table 8.2 South America Airport Security Market Forecast by System 2019- 2029 (US$ Bn, AGR%, Cumulative)
Table 8.3 South America Airport Security Market Forecast by Application 2019- 2029 (US$ Bn, AGR%, Cumulative)
Table 8.4 South America Airport Security Market Forecast by End-use 2019- 2029 (US$ Bn, AGR%, Cumulative)
Table 8.5 South America Airport Security Market Forecast by Country 2019- 2029 (US$ Bn, AGR%, Cumulative)
Table 8.6 Brazil Airport Security Market Forecast 2019-2029 ($bn, AGR %)
Table 8.7 Argentina Airport Security Market Forecast 2019-2029 ($bn, AGR %)
Table 8.8 Rest of South America Airport Security Market Forecast 2019-2029 ($bn, AGR %)
Table 9.1 Leading Airport Security Companies 2019 (Company, FY2018 Total Company Sales US$m, Primary Submarket Specialisation)
Table 9.2 Analogic Corporation Profile 2019 (CEO, Total Company Sales US$m, Net Income US$m, Strongest Business Region, Business Segment in the Market, Submarket Involvement, HQ, Founded, No. of Employees, IR Contact, Ticker, Website)
Table 9.3 Selected Recent Analogic Corporation Airport Security Contracts / Projects / Programmes 2011-2019 (Date, Country / Region, Subcontractor, Product, Details)
Table 9.4 Analogic Corporation Total Company Net Sales 2013-2017 (US$m, AGR %)
Table 9.5 Analogic Corporation Sales in the Security and Detection Division 2013-2017 (US$m, AGR %)
Table 9.6 Analogic Corporation Sales by Segment of Business 2013-2017 (US$m, AGR %)
Table 9.7 Analogic Corporation Sales by Geographical Location 2013-2017 (US$m, AGR %)
Table 9.8 Analogic Corporation Subsidiaries 2018 (Subsidiary, Location)
Table 9.9 Analogic Corporation Number of Employees 2013-2017 (No. of Employees, AGR %)
Table 9.10 Analogic Corporation Airport Security Products / Services (Segment of Business, Product, Specification / Features)
Table 9.11 Analogic Corporation Mergers and Acquisitions 2013-2018 (Date, Company Involved, Value US$m, Details)
Table 9.12 Bruker Corporation Profile 2018 (CEO, Total Company Sales US$m, Net Income US$m, Net Capital Expenditure US$m, Business Segment in the Market, Submarket Involvement, HQ, Founded, No. of Employees, IR Contact, Ticker, Website)
Table 9.13 Selected Recent Bruker Corporation Airport Security Market Contracts / Projects / Programmes 2014-2018 (Date, Country / Region, Product, Details)
Table 9.14 Bruker Corporation Total Company Net Sales 2013-2018 (US$m, AGR %)
Table 9.15 Bruker Corporation Sales in the BSI Division 2013-2018 (US$m, AGR %)
Table 9.16 Bruker Corporation Net Income 2013-2018 (US$m, AGR %)
Table 9.17 Bruker Corporation Sales by Segment of Business 2013-2018 (US$m, AGR %)
Table 9.18 Bruker Corporation Sales by Geographical Location 2013-2018 (US$m, AGR%)
Table 9.19 Bruker Corporation Subsidiaries 2018 (Subsidiary, Location)
Table 9.20 Bruker Corporation Number of Employees 2013-2018 (No. of Employees, AGR %)
Table 9.21 Bruker Corporation Airport Security Products / Services (Segment of Business, Product, Specification / Features)
Table 9.22 Bruker Corporation Mergers and Acquisitions 2015 (Date, Company Involved, Value US$m, Details)
Table 9.23 CEIA SpA Profile 2018 (Business Segment in the Market, Submarket Involvement, HQ, Founded, Website)
Table 9.24 Selected Recent CEIA SpA Airport Security Contracts / Projects / Programmes 2011-2019 (Date, Country / Region, Product, Details)
Table 9.25 CEIA SpA Subsidiaries 2019 (Subsidiary, Location)
Table 9.26 CEIA SpA Airport Security Market Products / Services (Segment of Business, Product, Specification / Features)
Table 9.27 G4S plc Profile 2018 (CEO, Total Company Sales US$m, Net Income US$m, Net Capital Expenditure US$m, Strongest Business Region, Business Segment in the Market, Submarket Involvement, HQ, Founded, No. of Employees, IR Contact, Ticker, Website)
Table 9.28 Selected Recent G4S plc Airport Security Market Contracts / Projects / Programmes 2011-2019 (Date, Country / Region, Subcontractor, Value US$m, Product, Details)
Table 9.29 G4S plc Total Company Net Sales 2013-2018 (US$m, AGR %)
Table 9.30 G4S plc Net Income / Loss 2013-2018 (US$m)
Table 9.31 G4S plc Sales by Segment of Business 2013-2018 (US$m, AGR %)
Table 9.32 G4S plc Sales by Geographical Location 2013-2018 (US$m, AGR %)
Table 9.33 G4S plc Select Subsidiaries 2019 (Subsidiary, Location)
Table 9.34 G4S plc Number of Employees 2013-2018 (No. of Employees, AGR %)
Table 9.35 G4S plc Airport Security Market Products / Services (Segment of Business, Product, Specification / Features)
Table 9.36 L-3 Technologies Profile 2018 (CEO, Total Company Sales US$m, Net Income US$m, Net Capital Expenditure US$m, Strongest Business Region, Business Segment in the Market, Submarket Involvement, HQ, Founded, No. of Employees, IR Contact, Ticker, Website)
Table 9.37 Selected Recent L-3 Technologies Airport Security Market Contracts / Projects / Programmes 2011-2019 (Date, Country / Region, Value US$m, Product, Details)
Table 9.38 Selected Recent Implant Sciences Corporation Airport Security Market Contracts / Projects / Programmes 2013-2019 (Date, Country / Region, Subcontractor, Value US$m, Product, Details)
Table 9.39 L-3 Technologies Total Company Net Sales 2013-2018 (US$m, AGR %)
Table 7.40 L-3 Technologies Income 2013-2018 (US$m, AGR %)
Table 9.41 L-3 Technologies Sales by Segment of Business 2015-2018 (US$m, AGR %)
Table 9.42 L-3 Technologies Sales by Segment of Business 2015-2018 (US$m, AGR %)
Table 7.43 L-3 Technologies Select Subsidiaries 2019 (Subsidiary, Location)
Table 9.44 L-3 Technologies Number of Employees 2013-2018 (No. of Employees, AGR %)
Table 9.45 L-3 Technologies Airport Security Market Products / Services (Segment of Business, Product, Specification / Features)
Table 9.46 L-3 Technologies Mergers and Acquisitions 2015-2019 (Date, Company Involved, Value US$m, Details)
Table 9.47 L-3 Technologies Divestitures 2014 (Date, Company Involved, Value US$m, Details)
Table 9.48 OT-Morpho ( IDEMIA) Profile 2018 (CEO, Submarket Involvement, Website)
Table 9.49 Selected Recent OT-Morpho ( IDEMIA) Airport Security Market Contracts / Projects / Programmes 2013-2019 (Date, Country / Region, Value US$m, Product, Details)
Table 9.50 OT-Morpho ( IDEMIA) Airport Security Products / Services (Segment of Business, Product, Specification / Features)
Table 9.51 Nuctech Company Ltd Profile 2018 (President, Strongest Business Region, Business Segment in the Market, Submarket Involvement, HQ, Founded, Website)
Table 9.52 Selected Recent Nuctech Company Ltd Airport Security Market Contracts / Projects / Programmes 2012-2019 (Date, Country / Region, Subcontractor, Value US$m, Product, Details)
Table 9.53 Nuctech Company Ltd Subsidiaries 2019 (Subsidiary, Location)
Table 9.54 Nuctech Company Ltd Airport Security Market Products / Services (Segment of Business, Product, Specification / Features)
Table 9.55 OSI Systems, Inc. Profile 2018 (President, Total Company Sales US$m, Net Income US$m, Net Capital Expenditure US$m, Strongest Business Region, Business Segment in the Market, Submarket Involvement, HQ, Founded, IR Contact, Ticker, Website)
Table 9.56 Selected Recent Rapiscan Systems Airport Security Market Contracts / Projects / Programmes 2012-2019 (Date, Country / Region, Value US$m, Product, Details)
Table 9.57 OSI Systems Inc. Total Company Sales 2012-2018 (US$m, AGR %)
Table 9.58 OSI Systems Inc. Net Income 2012-2018 (US$m, AGR %)
Table 9.59 OSI Systems Inc. Sales by Segment of Business 2012-2018 (US$m, AGR %)
Table 9.60 OSI Systems Inc. Sales by Geographical Location 2014-2018 (US$m, AGR %)
Table 9.61 Rapiscan Systems Subsidiaries 2019 (Subsidiary, Location)
Table 9.61 Rapiscan Systems Subsidiaries 2019 (Subsidiary, Location)
Table 9.63 OSI Systems Inc. Mergers and Acquisitions 2016-2019 (Date, Company Involved, Value US$m, Details)
Table 9.64 Securitas AB Profile 2018 (CEO, Total Company Sales US$m, Net Income US$m, Strongest Business Region, Business Segment in the Market, Submarket Involvement, HQ, Founded, No. of Employees, IR Contact, Ticker, Website)
Table 9.65 Selected Recent Securitas AB Airport Security Market Contracts / Projects / Programmes 2011-2019 (Date, Country / Region, Subcontractor, Value US$m, Product, Details)
Table 9.66 Securitas AB Total Company Sales 2013-2018 (US$m, AGR %)
Table 9.67 Securitas AB Net Income 2013-2018 (US$m, AGR %)
Table 9.68 Securitas AB Select Subsidiaries 2019 (Subsidiary, Location)
Table 9.69 Securitas AB Number of Employees 2013-2018 (No. of Employees, AGR %)
Table 9.70 Securitas AB Airport Security Market Products / Services (Segment of Business, Product, Specification / Features)
Table 9.71 Securitas AB Mergers and Acquisitions 2015-2019 (Date, Company Involved, Value US$m, Details)
Table 9.72 Smiths Detection Profile 2018 (President, Parent Company Sales US$m, Total Company Sales US$m, Net Income US$m, Net Capital Expenditure US$m, Strongest Business Region, Business Segment in the Market, Submarket Involvement, HQ, Founded, No. of Employees, IR Contact, Ticker, Website)
Table 9.73 Selected Recent Smiths Detection Airport Security Market Contracts / Projects / Programmes 2010-2019 (Date, Country / Region, Value US$m, Product, Details)
Table 9.74 Smiths Group plc Total Company Sales 2012-2018 (US$m, AGR %)
Table 9.75 Smiths Detection Total Sales 2012-2018 (US$m, AGR %)
Table 9.76 Smiths Group plc Net Income 2012-2018 (US$m, AGR %)
Table 9.77 Smiths Group plc Sales by Segment of Business 2012-2018 (US$m, AGR %)
Table 9.78 Smiths Detection Subsidiaries 2019 (Subsidiary, Location)
Table 9.79 Smiths Detection Airport Security Market Products / Services (Segment of Business, Product, Specification / Features)
Table 9.80 SITA Profile 2018 (CEO, Total Company Sales US$m, Strongest Business Region, Business Segment in the Market, Submarket Involvement, HQ, Founded, No. of Employees, Website)
Table 9.81 Selected Recent SITA Airport Security Contracts / Projects / Programmes 2011-2018 (Date, Country / Region, Subcontractor, Product, Details)
Table 9.82 SITA Subsidiaries 2019 (Subsidiary, Location)
Table 9.83 SITA Airport Security Products / Services (Products and Services)
Table 9.84 SITA Mergers and Acquisitions 2013-2018 (Date, Company Involved, Value US$m, Details)
Table 9.85 Hitachi Ltd. Profile 2018 (CEO, Total Company Sales US$m, Net Income US$m, Business Segment in the Market, HQ, Founded, No. of Employees, IR Contact, Ticker, Website)
Table 9.86 Selected Recent Hitachi Ltd. Airport Security Market Contracts / Projects / Programmes 2014-2018 (Date, Country / Region, Product, Details)
Table 9.87 Hitachi Ltd. Total Company Net Sales 2014-2018
Table 9.88 Hitachi Ltd. Net Income 2014-2018 (US$m, AGR %)
Table 9.89 Hitachi Ltd. Sales by Segment of Business 2014-2018 (US$m, AGR %)
Table 9.90 Hitachi Ltd. Subsidiaries 2018 (Subsidiary, Location)
Table 9.91 Hitachi Ltd. Number of Employees 2013-2018 (No. of Employees, AGR %)
Table 9.92 Hitachi Ltd. Airport Security Products / Services (Segment of Business, Product, Specification / Features)
Table 9.93 Hitachi Ltd. Mergers and Acquisitions 2019 (Date, Company Involved, Value US$m, Details)
Table 9.94 Thales Group Profile 2018 (CEO, Total Company Sales US$m, Net Income US$m, Business Segment in the Market, HQ, Founded, No. of Employees, IR Contact, Ticker, Website)
Table 9.95 Selected Recent Thales Group Airport Security Market Contracts / Projects / Programmes 2014-2019 (Date, Country / Region, Product, Details)
Table 9.96 Thales Group Total Company Net Sales 2014-2018
Table 9.97 Thales Group Net Income 2014-2018 (US$m, AGR %)
Table 9.98 Thales Group Sales by Segment of Business 2014-2018 (US$m, AGR %)
Table 9.99 Thales Group Subsidiaries 2018
Table 9.100 Thales Group Number of Employees 2013-2018 (No. of Employees, AGR %)
Table 9.101 Thales Group Airport Security Products / Services (Segment of Business, Product, Specification / Features)
Table 9.102 The Brinks Co. Profile 2018 (CEO, Total Company Sales US$m, Net Income US$m, HQ, Founded, No. of Employees, IR Contact, Ticker, Website)
Table 9.103 The Brinks Co. Total Company Net Sales 2014-2018
Table 9.104 The Brinks Co. Net Income 2014-2018 (US$m, AGR %)
Table 9.105 The Brinks Co. Sales by Segment of Business 2016-2018 (US$m, AGR %)
Table 9.106 The Brinks Co. Sales by Segment of Geographic Location 2016-2018 (US$m, AGR %)
Table 9.107 The Brinks Co. Subsidiaries 2018 (Subsidiary, Location)
Table 9.108 The Brinks Co. Number of Employees 2013-2018 (No. of Employees, AGR %)
Table 9.109 The Brinks Co. Airport Security Products / Services (Segment of Business, Product, Specification / Features)
Table 9.110 The Brinks Co. Mergers and Acquisitions 2019 (Date, Company Involved, Value US$m, Details)
Table 9.111 Siemens AG Profile 2018 (CEO, Total Company Sales US$m, Net Income US$m, HQ, Founded, No. of Employees, IR Contact, Ticker, Website)
Table 9.112 Selected Recent Siemens AG Airport Security Market Contracts / Projects / Programmes 2014-2018 (Date, Country / Region, Product, Details)
Table 9.113 Siemens AG Total Company Net Sales 2014-2018
Table 9.114 Siemens AG Net Income 2014-2018 (US$m, AGR %)
Table 9.115 Siemens AG Sales by Segment of Business 2014-2018 (US$m, AGR %)
Table 9.116 Siemens AG Subsidiaries 2018 (Subsidiary, Location)
Table 9.117 Siemens AG Number of Employees 2013-2018 (No. of Employees, AGR %)
Table 9.118 Siemens AG Airport Security Products / Services (Segment of Business, Product, Specification / Features)
Table 9.119 Other Companies in the Airport Security Market 2018 (Company, Product / Service)
List of Figures
Figure 1.1 Global Airport Security Market Segmentation Overview
Figure 2.1 Global Airport Security Market Segmentation Overview
Figure 3.1 Global Airport Security Market Share Forecast by System 2019, 2024, 2029 (% Share)
Figure 3.2 Global Airport Security Market Forecast by System 2019-2029 (US$ Bn)
Figure 3.3 Global Airport Security Market AGR Forecast by System 2019-2029 (AGR%)
Figure 3.4 Global Airport Security Market Attractiveness Analysis by System 2019-2029
Figure 3.5 Global Airport Security Market Share Forecast by Application 2019, 2024, 2029 (% Share)
Figure 3.6 Global Airport Security Market Forecast by Application 2019-2029 (US$ Bn)
Figure 3.7 Global Airport Security Market AGR Forecast by Application 2019-2029 (AGR%)
Figure 3.8 Global Airport Security Market Attractiveness Analysis by Application 2019-2029
Figure 3.9 Global Airport Security Market Share Forecast by End-use 2019, 2024, 2029 (% Share)
Figure 3.10 Global Airport Security Market Forecast by End-use 2019-2029 (US$ Bn)
Figure 3.11 Global Airport Security Market AGR Forecast by End-use 2019-2029 (AGR%)
Figure 3.12 Global Airport Security Market Attractiveness Analysis by End-use 2019-2029
Figure 3.13 Global Airport Security Market Share Forecast by Geography 2019, 2024, 2029 (% Share)
Figure 3.14 Global Airport Security Market Forecast by Geography 2019-2029 (US$ Bn)
Figure 3.15 Global Airport Security Market AGR Forecast by Geography 2019-2029 (AGR%)
Figure 3.16 Global Airport Security Market Attractiveness Analysis by Geography 2019-2029
Figure 4.1 North America Airport Security Market Forecast 2019-2029 ($bn, AGR %)
Figure 4.2 North America Airport Security Market Share Forecast by System 2019, 2024, 2029 (% Share)
Figure 4.3 North America Airport Security Market Forecast by System 2019-2029 (US$ Bn)
Figure 4.4 North America Airport Security Market AGR Forecast by System 2019-2029 (AGR%)
Figure 4.5 North America Airport Security Market Attractiveness Analysis by System 2019-2029
Figure 4.6 North America Airport Security Market Share Forecast by Application 2019, 2024, 2029 (% Share)
Figure 4.7 North America Airport Security Market Forecast by Application 2019-2029 (US$ Bn)
Figure 4.8 North America Airport Security Market AGR Forecast by Application 2019-2029 (AGR%)
Figure 4.9 North America Airport Security Market Attractiveness Analysis by Application 2019-2029
Figure 4.10 North America Airport Security Market Share Forecast by End-use 2019, 2024, 2029 (% Share)
Figure 4.11 North America Airport Security Market Forecast by End-use 2019-2029 (US$ Bn)
Figure 4.12 North America Airport Security Market AGR Forecast by End-use 2019-2029 (AGR%)
Figure 6.13 North America Airport Security Market Attractiveness Analysis by End-use 2019-2029
Figure 4.13 North America Airport Security Market Share Forecast by Country 2019, 2024, 2029 (% Share)
Figure 4.14 North America Airport Security Market Forecast by Country 2019-2029 (US$ Bn)
Figure 4.15 North America Airport Security Market AGR Forecast by Country 2019-2029 (AGR%)
Figure 6.29 North America Airport Security Market Attractiveness Analysis by Country 2019-2029
Figure 4.16 U.S. Airport Security Market Forecast 2019-2029 ($bn, AGR %)
Figure 4.17 Canada Airport Security Market Forecast 2019-2029 ($bn, AGR %)
Figure 4.18 Rest of North America Airport Security Market Forecast 2019-2029 ($bn, AGR %)
Figure 5.1 Europe Airport Security Market Forecast 2019-2029 ($bn, AGR %)
Figure 5.2 Europe Airport Security Market Share Forecast by System 2019, 2024, 2029 (% Share)
Figure 5.3 Europe Airport Security Market Forecast by System 2019-2029 (US$ Bn)
Figure 5.4 Europe Airport Security Market AGR Forecast by System 2019-2029 (AGR%)
Figure 5.5 Europe Airport Security Market Attractiveness Analysis by System 2019-2029
Figure 5.6 Europe Airport Security Market Share Forecast by Application 2019, 2024, 2029 (% Share)
Figure 5.7 Europe Airport Security Market Forecast by Application 2019-2029 (US$ Bn)
Figure 5.8 Europe Airport Security Market AGR Forecast by Application 2019-2029 (AGR%)
Figure 5.9 Europe Airport Security Market Attractiveness Analysis by Application 2019-2029
Figure 5.10 Europe Airport Security Market Share Forecast by End-use 2019, 2024, 2029 (% Share)
Figure 5.11 Europe Airport Security Market Forecast by End-use 2019-2029 (US$ Bn)
Figure 5.12 Europe Airport Security Market AGR Forecast by End-use 2019-2029 (AGR%)
Figure 5.13 Europe Airport Security Market Attractiveness Analysis by End-use 2019-2029
Figure 5.14 Europe Airport Security Market Share Forecast by Country 2019, 2024, 2029 (% Share)
Figure 5.15 Europe Airport Security Market Forecast by Country 2019-2029 (US$ Bn)
Figure 5.16 Europe Airport Security Market AGR Forecast by Country 2019-2029 (AGR%)
Figure 5.17 Europe Airport Security Market Attractiveness Analysis by Country 2019-2029
Figure 5.18 U.K. Airport Security Market Forecast 2019-2029 ($bn, AGR %)
Figure 5.19 Spain Airport Security Market Forecast 2019-2029 ($bn, AGR %)
Figure 5.20 Italy Airport Security Market Forecast 2019-2029 ($bn, AGR %)
Figure 5.21 Germany Airport Security Market Forecast 2019-2029 ($bn, AGR %)
Figure 5.22 Rest of Europe Airport Security Market Forecast 2019-2029 ($bn, AGR %)
Figure 6.1 Asia Pacific Airport Security Market Forecast 2019-2029 ($bn, AGR %)
Figure 6.2 Asia Pacific Airport Security Market Share Forecast by System 2019, 2024, 2029 (% Share)
Figure 6.3 Asia Pacific Airport Security Market Forecast by System 2019-2029 (US$ Bn)
Figure 6.4 Asia Pacific Airport Security Market AGR Forecast by System 2019-2029 (AGR%)
Figure 6.5 Asia Pacific Airport Security Market Attractiveness Analysis by System 2019-2029
Figure 6.6 Asia Pacific Airport Security Market Share Forecast by Application 2019, 2024, 2029 (% Share)
Figure 6.7 Asia Pacific Airport Security Market Forecast by Application 2019-2029 (US$ Bn)
Figure 6.8 Asia Pacific Airport Security Market AGR Forecast by Application 2019-2029 (AGR%)
Figure 6.9 Asia Pacific Airport Security Market Attractiveness Analysis by Application 2019-2029
Figure 6.10 Asia Pacific Airport Security Market Share Forecast by End-use 2019, 2024, 2029 (% Share)
Figure 6.11 Asia Pacific Airport Security Market Forecast by End-use 2019-2029 (US$ Bn)
Figure 6.12 Asia Pacific Airport Security Market AGR Forecast by End-use 2019-2029 (AGR%)
Figure 6.13 Asia Pacific Airport Security Market Attractiveness Analysis by End-use 2019-2029
Figure 6.14 Asia Pacific Airport Security Market Share Forecast by Country 2019, 2024, 2029 (% Share)
Figure 6.15 Asia Pacific Airport Security Market Forecast by Country 2019-2029 (US$ Bn)
Figure 6.16 Asia Pacific Airport Security Market AGR Forecast by Country 2019-2029 (AGR%)
Figure 6.17 Asia Pacific Airport Security Market Attractiveness Analysis by Country 2019-2029
Figure 6.18 China Airport Security Market Forecast 2019-2029 ($bn, AGR %)
Figure 6.19 Japan Airport Security Market Forecast 2019-2029 ($bn, AGR %)
Figure 6.20 India Airport Security Market Forecast 2019-2029 ($bn, AGR %)
Figure 6.21 Australasia Airport Security Market Forecast 2019-2029 ($bn, AGR %)
Figure 6.22 Rest of Asia Pacific Airport Security Market Forecast 2019-2029 ($bn, AGR %)
Figure 7.1 Middle East and Africa Airport Security Market Forecast 2019-2029 ($bn, AGR %)
Figure 7.2 Middle East and Africa Airport Security Market Share Forecast by System 2019, 2024, 2029 (% Share)
Figure 7.3 Middle East and Africa Airport Security Market Forecast by System 2019-2029 (US$ Bn)
Figure 7.4 Middle East and Africa Airport Security Market AGR Forecast by System 2019-2029 (AGR%)
Figure 7.5 Middle East and Africa Airport Security Market Attractiveness Analysis by System 2019-2029
Figure 7.6 Middle East and Africa Airport Security Market Share Forecast by Application 2019, 2024, 2029 (% Share)
Figure 7.7 Middle East and Africa Airport Security Market Forecast by Application 2019-2029 (US$ Bn)
Figure 7.8 Middle East and Africa Airport Security Market AGR Forecast by Application 2019-2029 (AGR%)
Figure 7.9 Middle East and Africa Airport Security Market Attractiveness Analysis by Application 2019-2029
Figure 7.10 Middle East and Africa Airport Security Market Share Forecast by End-use 2019, 2024, 2029 (% Share)
Figure 7.11 Middle East and Africa Airport Security Market Forecast by End-use 2019-2029 (US$ Bn)
Figure 7.12 Middle East and Africa Airport Security Market AGR Forecast by End-use 2019-2029 (AGR%)
Figure 7.13 Middle East and Africa Airport Security Market Attractiveness Analysis by End-use 2019-2029
Figure 7.14 Middle East and Africa Airport Security Market Share Forecast by Country 2019, 2024, 2029 (% Share)
Figure 7.15 Middle East and Africa Airport Security Market Forecast by Country 2019-2029 (US$ Bn)
Figure 7.16 Middle East and Africa Airport Security Market AGR Forecast by Country 2019-2029 (AGR%)
Figure 6.29 Middle East and Africa Airport Security Market Attractiveness Analysis by Country 2019-2029
Figure 7.17 GCC Countries Airport Security Market Forecast 2019-2029 ($bn, AGR %)
Figure 7.18 South Africa Airport Security Market Forecast 2019-2029 ($bn, AGR %)
Figure 7.19 Rest of Middle East and Africa Airport Security Market Forecast 2019-2029 ($bn, AGR %)
Figure 8.1 South America Airport Security Market Forecast 2019-2029 ($bn, AGR %)
Figure 8.2 South America Airport Security Market Share Forecast by System 2019, 2024, 2029 (% Share)
Figure 8.3 South America Airport Security Market Forecast by System 2019-2029 (US$ Bn)
Figure 8.4 South America Airport Security Market AGR Forecast by System 2019-2029 (AGR%)
Figure 8.5 South America Airport Security Market Attractiveness Analysis by System 2019-2029
Figure 8.6 South America Airport Security Market Share Forecast by Application 2019, 2024, 2029 (% Share)
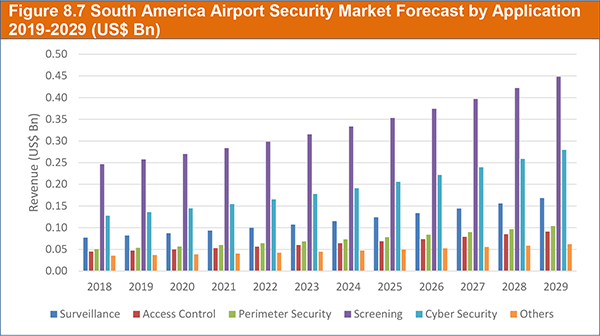
Figure 8.7 South America Airport Security Market Forecast by Application 2019-2029 (US$ Bn)
Figure 8.8 South America Airport Security Market AGR Forecast by Application 2019-2029 (AGR%)
Figure 8.9 South America Airport Security Market Attractiveness Analysis by Application 2019-2029
Figure 8.10 South America Airport Security Market Share Forecast by End-use 2019, 2024, 2029 (% Share)
Figure 8.11 South America Airport Security Market Forecast by End-use 2019-2029 (US$ Bn)
Figure 8.12 South America Airport Security Market AGR Forecast by End-use 2019-2029 (AGR%)
Figure 8.13 South America Airport Security Market Attractiveness Analysis by End-use 2019-2029
Figure 8.14 South America Airport Security Market Share Forecast by Country 2019, 2024, 2029 (% Share)
Figure 8.15 South America Airport Security Market Forecast by Country 2019-2029 (US$ Bn)
Figure 8.16 South America Airport Security Market AGR Forecast by Country 2019-2029 (AGR%)
Figure 8.17 South America Airport Security Market Attractiveness Analysis by Country 2019-2029
Figure 8.18 Brazil Airport Security Market Forecast 2019-2029 ($bn, AGR %)
Figure 8.19 Argentina Airport Security Market Forecast 2019-2029 ($bn, AGR %)
Figure 8.20 Rest of South America Airport Security Market Forecast 2019-2029 ($bn, AGR %)
Figure 9.1 Analogic Corporation Total Company Net Sales 2013-2017 (US$m, AGR %)
Figure 9.2 Analogic Corporation Sales in the Security and Detection Division 2013-2017 (US$m, AGR %)
Figure 9.3 Analogic Corporation Sales Share by Segment of Business 2017 (%)
Figure 9.4 Analogic Corporation Sales by Geographical Location Share 2017 (%)
Figure 9.5 Analogic Corporation Organisational Structure 2017
Figure 9.6 Analogic Corporation Primary Market Competitors 2018
Figure 9.7 Bruker Corporation Total Company Sales 2013-2018 (US$m, AGR %)
Figure 9.8 Bruker Corporation Sales in the BSI Division 2013-2018 (US$m, AGR %)
Figure 9.9 Bruker Corporation Net Income 2013-2018 (US$m, AGR %)
Figure 9.10 Bruker Corporation Sales Share by Segment of Business Share 2018 (%)
Figure 9.11 Bruker Corporation Sales by Geographical Location 2013-2018 (US$m, Total Net Sales AGR %)
Figure 9.12 Bruker Corporation Organisational Structure 2018
Figure 9.13 Bruker Corporation Primary Market Competitors 2019
Figure 9.14 CEIA SpA Primary International Operations 2019
Figure 9.15 CEIA SpA Organisational Structure 2019
Figure 9.16 CEIA SpA Primary Market Competitors 2019
Figure 9.17 G4S plc Total Company Sales 2013-2018 (US$m, AGR %)
Figure 9.18 G4S plc Net Income / Loss 2013-2018 (US$m)
Figure 9.19 G4S plc Sales Share by Segment of Business 2018 (%)
Figure 9.20 G4S plc Sales Share by Geographical Location 2018 (%)
Figure 9.21 G4S plc Organisational Structure 2019
Figure 9.22 G4S plc Primary Market Competitors 2019
Figure 9.23 L-3 Technologies Total Company Net Sales 2013-2018 (US$m, AGR %)
Figure 9.24 L-3 Technologies Net Income 2013-2018 (US$m, AGR %)
Figure 9.25 L-3 Technologies Sales Share by Segment of Business 2018 (US$m)
Figure 9.26 L-3 Technologies Sales Share by Geographical Location 2018 (%)
Figure 9.27 L-3 Technologies Organisational Structure 2019
Figure 9.28 L-3 Technologies Primary Market Competitors 2019
Figure 9.29 Morpho Organisational Structure 2019
Figure 9.30 OT-Morpho ( IDEMIA) Primary Market Competitors 2019
Figure 9.31 Nuctech Company Ltd Primary International Operations 2019
Figure 9.32 Nuctech Company Ltd Organisational Structure 2019
Figure 9.33 Nuctech Company Ltd Primary Market Competitors 2019
Figure 9.34 OSI Systems Inc. Total Company Sales 2012-2018 (US$m, AGR %)
Figure 9.35 OSI Systems Inc. Net Income 2012-2018 (US$m, AGR %)
Figure 9.36 OSI Systems Inc. Sales Share by Segment of Business 2018 (%)
Figure 9.37 OSI Systems Inc. Sales Share by Geographical Location 2018 (%)
Figure 9.38 Rapiscan Systems Inc. Organisational Structure 2019
Figure 9.39 Rapiscan Systems Primary Market Competitors 2019
Figure 9.40 Securitas AB Total Company Sales 2013-2018 (US$m, AGR %)
Figure 9.41 Securitas AB Net Income 2013-2018 (US$m, AGR %)
Figure 9.42 Securitas AB Sales Share by Geographical Location 2018 (%)
Figure 9.43 Securitas AB Organisational Structure 2019
Figure 9.44 Securitas AB Primary Market Competitors 2019
Figure 9.45 Smiths Group plc Total Company Sales 2012-2018 (US$m, AGR %)
Figure 9.46 Smiths Detection Total Sales 2012-2018 (US$m, AGR %)
Figure 9.47 Smiths Group plc Net Income 2012-2018 (US$m, AGR %)
Figure 9.48 Smiths Group plc Sales Share by Segment of Business 2018 (%)
Figure 9.49 Smiths Group plc Sales Share by Geographical Location 2018 (%)
Figure 9.50 Smiths Detection Organisational Structure 2019
Figure 9.51 Smiths Detection Primary Market Competitors 2019
Figure 9.52 SITA Organisational Structure 2019
Figure 9.53 SITA Primary Market Competitors 2019
Figure 9.54 Hitachi Ltd. Total Company Sales 2014-2018 (US$m, AGR %)
Figure 9.55 Hitachi Ltd. Net Income 2014-2018 (US$m, AGR %)
Figure 9.56 Hitachi Ltd. Sales Share by Segment of Business Share 2018 (%)
Figure 9.57 Hitachi Ltd. Sales by Geographical Location 2018 (%)
Figure 9.58 Hitachi Ltd. Primary Market Competitors 2019
Figure 9.59 Thales Group Total Company Sales 2014-2018 (US$m, AGR %)
Figure 9.60 Thales Group Net Income 2014-2018 (US$m, AGR %)
Figure 9.61 Thales Group Sales Share by Segment of Business Share 2018 (%)
Figure 9.62 Thales Group Sales by Geographical Location 2018 (%)
Figure 9.63 Thales Group Organisational Structure 2018
Figure 9.64 The Brinks Co. Total Company Sales 2014-2018 (US$m, AGR %)
Figure 9.65 The Brinks Co. Net Income 2014-2018 (US$m, AGR %)
Figure 9.66 The Brinks Co. Sales Share by Segment of Business Share 2018 (%)
Figure 9.67 The Brinks Co. Sales by Geographical Location 2018 (%)
Figure 9.68 The Brinks Co. Organisational Structure 2018
Figure 9.69 Siemens AG Total Company Sales 2014-2018 (US$m, AGR %)
Figure 9.70 Siemens AG Net Income 2014-2018 (US$m, AGR %)
Figure 9.71 Siemens AG Sales Share by Segment of Business Share 2018 (%)
Figure 9.72 Siemens AG Sales by Geographical Location 2018 (%)
Figure 9.73 Siemens AG Organisational Structure 2018
3Com
ACO Electronics Ltd
Adani Systems
AENA
Aéroports de Paris (ADP)
Air Canada
Air Freight Atlanta
Air New Zealand
Airbus
Airport Corporation of Vietnam
Alarm.com
Alaska Airlines
Allied Security Holdings LLC
Altaris Capital Partners
American Airlines
American Science & Engineering (AS&E) Inc.
Anadventure Delaware Inc.
Analogic Benelux NV/SA
Analogic Canada Corporation
Analogic China Holding Ltd
Analogic Corporation
Analogic Foreign Sales Corporation
Analogic Holding Luxembourg Sarl
Analogic Italia Srl
Analogic Japan KK
Analogic Ltd
Analogic Medical Equipment (Shanghai) Co Ltd
Analogic Ultrasound UK Ltd
Automatic Alarm
Avianca Airlines
BAA plc
BioLink Solutions
B-K Medical AB
B-K Medical ApS
B-K Medical Holdings ApS
B-K Medical Systems Inc.
Blighter Surveillance Systems
Boeing
Bosch Ltd
Brazil Airport Management Company
Brink's Company
Brisbane Airport Corporation (BAC)
British Airways
Bruker (Beijing) Scientific Technology Co Ltd
Bruker Austria GmbH
Bruker BioSpin Group
Bruker CALID Group
Bruker Corporation
Bruker Detection.
Bruker do Brasil
Bruker Española SA
Bruker Nano Group
Bruker Nano Surfaces
Bruker Singapore Pte Ltd
CACI International Inc.
Cargohaus
CEIA GmbH
CEIA International SAS
CEIA Ltd
CEIA SpA
CEIA USA Ltd
CEM Systems
Cobalt
Cobalt Light Systems
Croma Security Solutions Group plc
CTC Aviation Group
Dallmeier
Defense & Protection Systems Phil. Inc
Delta Air Lines
Detector Networks International (DNI)
DHL
Diebold Inc.
DMS Logistics
Draht+Schutz Unternehmengruppe
El Al Airlines
ELP GmbH
Emirates
Emirates Group Security
ENAIRE
Ethiopian Airlines
Ethiopian Airports Enterprise (EAE)
F.H. Paschen
Fastlane
Fibre Net Srl
Flex-Tek
Fraport AG
Freightnet Handling Ltd
G4S Australia Pty Ltd
G4S Aviation Services (UK) Ltd
G4S Hong Kong
G4S Kenya Ltd
G4S Plc
G4S Risk Consulting
G4S Secure Solutions (Canada) Ltd
G4S Secure Solutions (HK) Ltd
G4S Secure Solutions (India) Pvt Ltd
G4S Secure Solutions (Israel) Ltd
G4S Secure Solutions (SA) (Pty) Ltd
G4S Secure Solutions (USA) Inc.
G4S Secure Solutions AG (Austria)
G4S Secure Solutions SA / NV
G4S Soluciones de Seguridad SA
G4S Technology LLC
G4S United Arab Emirates
Garver
Gilardoni
Glidepath
Global CFS
Global Choice
Glosec Holdings Ltd
Group LB
Harris Corporation
Hawaiian Airlines
Herbert Systems
Heuresis Corporation
Hong Kong Air Cargo Terminals Ltd (Hactl)
Human Recognition Systems
ICTS
ICTS Cyprus
IDSS
Implant Sciences Corporation
Incheon International Airport Corporation
Infraero
Infratek Security Solutions
iProov
ISS
JC Ingeniería
JetBlue Airways
John Crane
Johnson Controls
Jordan Valley Semiconductors Ltd
Kaba Gallenschütz GmbH
KGT (UK) LTD.
KLM
Kratos Defense & Security Solutions, Inc
Kromek Group plc
Kuehne + Nagel
L-3 Communications
L-3 Communications Flight Capital LLC
L-3 Communications Flight International Aviation LLC
L-3 Communications Security and Detection Systems Inc.
L-3 CyTerra
L-3 MacDonald Humfrey
L-3 Security & Detection Systems (L-3 SDS)
L-3 Technologies
LAWA
Leidos Holdings Inc.
Liteye Systems Inc.
Loomis
MacDonald Humfrey (Automation) Ltd
Magal
Magal S3
Magal Security Systems, Ltd.
Malaysia Airlines
Manchester Airport Group
Marine Systems International
MediaCityUK
Menara Airport
Metrojet
Meyertech Ltd
Mitie
ML Medizinische Systeme GmbH
Morpho Detection UK Ltd
Morpho SAS
Mühlbauer Group
Narita International Airport Corporation
National Security Solutions (NSS)
Navtech
NEC Ltd
Nedap
Nuctech Africa
Nuctech Central Asia
Nuctech CIS
Nuctech Company Limited
Nuctech Company Ltd Sucursal Argentina
Nuctech Company Ltd Sucursal Venezuela
Nuctech do Brasil Ltd.
Nuctech Europe
Nuctech Hong Kong Company Ltd
Nuctech Middle East FZE
Nuctech Panama SA
Nuctech Singapore Pvt Ltd
Nuctech Southeast Asia
Nuctech Sydney Pty Ltd
Nuctech Warsaw Company Ltd Sp Zoo
Nuctech West Asia
Oesterreichische Staatsdruckerei Holding AG (OeSD)
Oman Airports Management Company (OAMC)
Omnitech
OneJet
Opgal Optronics Industries Ltd
Optosecurity
Orad Ltd
OSI System, Inc. (Rapiscan Systems)
OT-Morpho (IDEMIA)
Pacific Air Cargo
Pacific Marks Shinurayasu
Papua New Guinea’s National Airport Corporation
Peel Land and Property
Peraton
Plextek Ltd
Prosegur
PSGA
Qantas
Qatar Airways
Rapiscan
Rapiscan do Brasil Ltda
Rapiscan Systems Ltd
Rapiscan Systems Sdn Bhd
Raytheon Company
Reveal Imaging
Ryan Security Technologies Ltd.
Safeguards G4S Sdn Bhd
Safran Identity & Security
Safran S.A.
Science Applications International Corporation (SAIC)
Securitas AB
Securitas Canada Ltd
Securitas Holding GmbH
Securitas Services Holding UK Ltd
Securitas Services International BV
Securitas Transport Aviation Security AB
Securitas Transport Aviation Security Ltd
Securitas UAE LLC
Senstar Corporation
Serco Group plc.
SITA
Smiths Detection
Smiths Detection (Asia Pacific) Pte Ltd
Smiths Detection (Australia) Pty Ltd
Smiths Detection (Smiths Heimann GmbH)
Smiths Detection (Smiths Heimann SAS)
Smiths Detection (Thailand) Ltd
Smiths Detection Brasil
Smiths Detection Inc.
Smiths Detection Italia Srl
Smiths Detection Middle East FZE
Smiths Detection Montreal Inc.
Smiths Detection New Zealand Ltd
Smiths Detection Veecon Systems
Smiths Group plc
Smiths Heimann GmbH
Smiths Interconnect
Smiths Medical
S.N. Nielsen
Sound Technology Inc.
Southwest Airlines
SriLankan Airlines
Stratovan
Süddeutsche Bewachung
Sun Country
Sung Group
Swedavia
TECOSA
Teledyne DALSA
Teledyne ICM
Thales
The Peel Group
Todd Research
Totalpost
Touchstone Electronics
Turner PCL Flatiron
Tyco International
Ultrasonix Medical Corporation
Unisys Corporation
United Airlines
Virgin America
Virgin Atlantic
VMD Systems Integrators, Inc.
Wärtsilä Corporation
WestJet
Westminster Aviation Security Services (WASS) Ltd.
Westminster Group plc
Airports Mentioned
Abu Dhabi International Airport
Adelaide Airport
Airport Magadan
Al Maktoum International Airport
Amsterdam Airport Schiphol
Avalon Airport
Baghdad International Airport
Barcelona Airport
Ben Gurion International Airport
Bole International Airport
Bologna Guglielmo Marconi Airport
Boston Logan International Airport.
Bremen Airport
Brisbane Airport
Brussels Airport
Brussels South Charleroi Airport
Bucharest Otopeni Airport
Cardiff Airport
Changi Airport
Chaoshui Airport
Charles de Gaulle Airport
Chennai International Airport
Chittagong International Airport
Chongqing Jiangbei International Airport
Copenhagen Airport
Darwin Airport
Dubai International Airport
Durham Tees Valley Airport
East Midlands Airport
Edinburgh Airport
Galeão International Airport
Gatwick Airport
Georgia Airport
Glasgow Airport
Gold Coast Airport
Guangzhou Baiyun International Airport
Guarulhos International Airport
Halifax Stanfield International Airport
Hamad International Airport
Heathrow Airport
Hong Kong International
Incheon Airport
International Airport of Bangkok
Istanbul Airport
JFK International Airport
Jiangsu Wuxi Airport
Kigali International Airport
Kuala Lumpur International Airport
Kunming-Changshui International Airport
Kutaisi International Airport
Kuwait Airport
Leonardo da Vinci - Fiumicino Airport
Liverpool John Lennon Airport
Luton Airport
Madrid Airport
Malaga Airport
Manchester Airport
Melbourne Airport
Menara Airport.
Mexico City International Airport
Minsk National Airport
Munich Airport.
Muscat International Airport
Narita International Airport
Netaji Subhas Chandra Bose International Airport
Nice Côte d'Azur International Airport
Ninoy Aquino International Airport
Orlando International Airport.
Orly International Airport
Oslo Airport
Penglai International Airport
Perth Airport
Port Moresby Jackson’s International Airport.
Pristina International Airport Adem Jashari
Robin Hood Doncaster Sheffield Airport
Rome Ciampino International Airport
Rome Fiumicino Intercontinental Airport
Sabiha Gökçen International Airport
Salalah Airport.
Santiago International Airport
Shanghai Pudong International Airport
Sharm el-Sheikh Airport
Soekarno-Hatta. Airport
Stansted Airport
Stockholm Arlanda Airport
Sydney Airport
Tampa International Airport
Toulouse-Blagnac Airport
Vancouver International Airport.
Organisations Mentioned
Advanced Cabin Baggage X-ray
Aéroports de Paris
African Civil Aviation Commission (AFCAC)
Airports Council International
Association of Asia Pacific Airlines
Aviation Business Centre
Bureau of Civil Aviation Security
Canadian Air Transport Security Authority (CATSA)
Civil Aviation Administration of China (CAAC)
Civil Aviation Authority (ANAC)
Civil Aviation Authority (CAA)
COMAR
Department for Transport
Department of Infrastructure and Transport
Direction Générale de l’Aviation Civile (DGAC)
EASA
Ente Nazionale per L’Aviazione Civile (ENAC - Italian Civil Aviation Authority)
European Civil Aviation Conference (ECAC)
European Commission (EC)
Federal Aviation Authority (FAA)
General Civil Aviation Authority (GCAA)
Home Office
Infraero
Ministry of Civil Aviation
Transport Canada
Transportation Security Administration (TSA)
Download sample pages
Complete the form below to download your free sample pages for Airport Security Market Report 2019-2029
Related reports
-
Military Airborne Intelligence, Surveillance & Reconnaissance (ISR) Technologies Market 2019-2029
Visiongain expects the Airborne ISR market to generate sales of USD 30.6 billion in 2019 and estimates that this figure...Full DetailsPublished: 30 September 2019 -
Counter-UAV (C-UAV) Market Report 2019-2029
The recent developments in counter UAV systems by type, platform and technology has led Visiongain to publish this timely report....
Full DetailsPublished: 04 June 2019 -
Global Aircraft Line Maintenance Market Report 2019-2029
Visiongain expects the Aircraft Line Maintenance market to generate sales of USD 19.89 billion in 2019 and estimates that this...Full DetailsPublished: 02 August 2019 -
Airport Construction Market Report 2018-2028
The latest report from business intelligence provider Visiongain offers comprehensive analysis of the global airport construction market. Visiongain assesses that...
Full DetailsPublished: 03 January 2018 -
Military Land Vehicle Electronics (Vetronics) Market Report 2019-2029
Visiongain’s definitive new report values the Military Land Vehicle Electronics (Vetronics) market at USD 3.56 billion in 2019.
...Full DetailsPublished: 10 June 2019 -
Global Ground Surveillance Radar Market Report 2019-2029
The Global Ground Surveillance Radar market is expected to reach US$ 7.61bn in 2019, up from 7.34 bn in 2018...Full DetailsPublished: 30 November 2018 -
Electronic Warfare (EW) Market Report 2019-2029
The recent developments in electronic warfare systems in defence platforms and systems, has led Visiongain to publish this timey report....
Full DetailsPublished: 26 March 2019 -
Smart Airport Technologies Market Report 2020-2030
The recent contracts in Smart airport technologies market, has led Visiongain to publish this timely report. The $3,569.6 million Smart...
Full DetailsPublished: 14 May 2020 -
Air Traffic Control Equipment Market Report 2020-2030
ATC Equipment market to total USD 9.7 billion in 2030.
...Full DetailsPublished: 14 January 2020 -
US Border Security Market Report 2019-2029
This report is essential reading for you or anyone in the aerospace and defence sector with an interest in Border...
Full DetailsPublished: 29 November 2018
Download sample pages
Complete the form below to download your free sample pages for Airport Security Market Report 2019-2029
Any specific country, geo region, market segment or specific company information?
Email us today, we can discuss your needs and see how we can help: sara.peerun@visiongain.com
If so, please drop an email to Sara Peerun stating your chosen report title to sara.peerun@visiongain.com
What are the dynamic growth sectors? where are the regional business opportunities?
Which technologies will prevail and who are the leading companies succeeding in these sectors and why?
If you want definitive answers to business critical questions, discover Visiongain’s full range of business intelligence reports.
If so, please email Sara Peerun on sara.peerun@visiongain.com or call her today on +44 (0) 20 7549 9987
- Advanced Truck Technologies Market 2019-2029
- Biometric Vehicle Access Technologies Market 2019-2029
- Automotive Composites 2019-2029
- Automotive Vehicle to Everything (V2X) Technologies Market 2019-2029
- Automotive Driver Monitoring Systems (DMS) Market 2019-2029
- Wireless Electric Vehicle Charging (WEVC) Technologies Market 2019-2029
Association of Russian Automakers
Audio Video Bridging (AVB)
China Association Of Automoblie Manufacturers
European Association of Automotive Suppliers
European Automobile Manufacturers’ Association
European Council for Automotive Research and Development
Former Society of Automotive Engineers
German Association of the Automotive Industry
Institute of the Motor Industry
International Organization of Motor Vehicle Manufacturers
In-Vehicle Infotainment (IVI)
Italian Association of the Automotive Industry
Japan Automobile Manufacturers Association
One-Pair Ether-Net
Society of Indian Automobile Manufacturers (SIAM)
Society of Motor Manufacturers and Traders
The International Council For Clean Transport
US National Highway Traffic Safety Administration
