Are you involved in the unsaturated polyester resin (UPR) market for composites or intend to be? If so, then you must read this report
It’s vital that you keep your knowledge up to date with market developments.
Visiongain’s new 169-page report assesses that the global unsaturated polyester resin (UPR) for composites market will reach $9.03 billion in 2018.
Market scope: This brand-new report from Visiongain is a completely fresh market assessment of the unsaturated polyester resin for composites market based upon the latest information. Our new market study contains forecasts, original analysis, company profiles and, most crucially, new conclusions. The report not only gives detailed forecasts and analysis of the global UPR market for composites, but also breaks this down by region and product.
The Unsaturated Polyester Resin (UPR) for Composites Market Report 2018-2028 responds to your need for definitive market data:
• Where are the UPR for composites market opportunities?
– 187 tables, charts, and graphs reveal market data allowing you to target your strategy more effectively
• When will the UPR for composites market grow?
– Global, national and submarket forecasts and analysis from 2018-2028 illustrate the market progression
• What UPR products will flourish from 2018-2028?
– Orthopthalic products consumption (Tonnes) & market value forecast 2018-2028
– Isopthalic products consumption (Tonnes) & market value forecast 2018-2028
– DCPD products consumption (Tonnes) & market value forecast 2018-2028
– Other products consumption (Tonnes) & market value forecast 2018-2028
• Where are the national UPR for composites market value and consumption forecasts from 2018-2028?
North America
– US UPR Market for Composites Forecast 2018-2028
– Canadian UPR Market for Composites Forecast 2018-2028
South America
– Brazilian UPR Market for Composites Forecast 2018-2028
Asia Pacific
– Chinese UPR Market for Composites Forecast 2018-2028
– Japanese UPR Market for Composites Forecast 2018-2028
– Indian UPR Market for Composites Forecast 2018-2028
Europe
– German UPR Market for Composites Forecast 2018-2028
– UK UPR Market for Composites Forecast 2018-2028
– French UPR Market for Composites Forecast 2018-2028
– Italian UPR Market for Composites Forecast 2018-2028
– Spanish UPR Market for Composites Forecast 2018-2028
– Russian UPR Market for Composites Forecast 2018-2028
– RoW UPR Market for Composites Forecast 2018-2028
• What are the factors influencing UPR for composites market dynamics?
– A high-level SWOT analysis explores the factors
– Research and development (R&D) strategy
– Supply and demand dynamics
– An increasing range of applications
– Advances in product quality
• Who are the leading UPR for composites companies? We profile the leading players. We reveal capabilities, product portfolios, R&D activity, services, focus, M&A activity, and future outlook
– Ashland Inc.
– BASF
– Dow Chemical Company
– DSM10
– Lonza GmbH.
– Polynt SpA
– Reichhold
– Shin-Etsu Chemical Co., Ltd
– Swancor Ind. Co., Ltd
– Tianhe Resin Co., Ltd.
Who should read this report?
– Anyone within the UPR value chain, including:
– UPR for composites technology providers
– UPR for composites producers
– UPR for composites materials providers
– UPR for composites manufacturers
– UPR for composites wholesale and distribution companies
– UPR for composites suppliers
– Composites textile suppliers
– Finished composite product manufacturers
– R&D specialists
– CEOs
– COOs
– CIOs
– Business development managers
– Marketing managers
– Suppliers
– Technologists
– Investors
– Banks
– Government agencies
– Contractors
Get our report the Unsaturated Polyester Resin (UPR) for Composites Market Report 2018-2028: Global Forecasts by Product (Orthopthalic, Isopthalic, Dicyclopentadiene (DCPD), Other Products) With Analysis of Use in Carbon Fibre (CFRP), Glass Fibre (GFRP), Aramid Fibre Reinforced Plastics (AFRP) and Applications (Aerospace / Aircraft, Automotive / Transport, Buildings / Construction, Pipes / Tanks, Wind Energy, Consumer Goods, Electrical / Electronics, Marine, Other) Plus Leading Company Analysis and Leading National Market Analysis today. Avoid missing out – order our report now.
Visiongain is a trading partner with the US Federal Government
CCR Ref number: KD4R6
1. Report Overview
1.1 Unsaturated Polyester Resin (UPR) Market for Composites Overview
1.2 UPR Market for Composites Segmentation
1.3 Why You Should Read This Report
1.4 How This Report Delivers
1.5 Key Questions Answered by This Analytical Report Include:
1.6 Who is This Report For?
1.7 Unsaturated Polyester Resin Market Definition
1.8 Methodology
1.9 Frequently Asked Questions (FAQ)
1.10 Associated Visiongain Reports
1.11 About Visiongain
2. Introduction to the Unsaturated Polyester Resin (UPR) Market for Composites
2.1 What are UPR?
2.2 Properties of UPR
2.3 Where Are Unsaturated Polyester Resins Applied?
3. Global Unsaturated Polyester Resin (UPR) for Composites Market 2018-2028
3.1 How does UPR for Composites Demand Compare to GDP Growth?
3.2 The Global Economic Outlook 2018
3.3 Global UPR Market for Composites Forecast 2018-2028
3.3.1 Global UPR for Composites Consumption Forecast 2018-2028
3.3.2 Global UPR for Composites Market Value Forecast 2018-2028
3.4 Global UPR for Composites Market Analysis 2018-2028
3.5 Global UPR Market for Composites Drivers and Restraints
3.5.1 How Growth of Emerging Markets Will Stimulate Demand for UPR for Composites
3.5.2 How Currently Low Oil Prices Are Affecting the UPR Market for Composites
3.5.3 The Importance of Government Policies in the UPR Market for Composites
3.5.4 Difficulties in Recycling UPR
4. Global Unsaturated Polyester Resin (UPR) for Composites Products Submarkets 2018-2028
4.1 Global Outlook for UPR for Composites Products
4.2 Global UPR for Composites Products Submarket Consumption Forecasts 2018-2028
4.3 Global UPR for Composites Products Market Value Forecasts 2018-2028
4.4 Global UPR Market for Composites Product Market Share Forecasts
4.5 Orthopthalic UPR for Composites Submarket Forecast 2018-2028
4.5.1 Orthopthalic UPR Submarket Analysis 2018-2028
4.6 Isopthalic UPR for Composites Submarket Forecast 2018-2028
4.6.1 Isopthalic UPR Submarket Analysis 2018-2028
4.7 DCPD UPR for Composites Submarket Forecast 2018-2026
4.7.1 DCPD UPR for Composites Submarket Analysis 2018-2028
4.8 Other UPR for Composites Submarket Forecast 2018-2028
4.8.1 Other UPR for Composites Submarket Analysis 2018-2028
5. Leading National UPR for Composites Market Forecasts 2018-2028
5.1 An Overview of the Leading National UPR Markets for Composites 2018-2028
5.2 US UPR Market for Composites Forecast 2018-2028
5.2.1 US UPR for Composites Market Analysis 2018-2028
5.2.2 US UPR for Composites Market Outlook
5.2.2.1 The Growth of UPR for Composites Consumption in the Automotive Sector Will Be Driven by Fuel Efficiency Requirements
5.2.2.2 The Prospects for Wind Energy in the US
5.3 Canadian UPR for Composites Market Forecast 2018-2028
5.3.1 Canadian UPR for Composites Market Analysis 2018-2028
5.3.2 Canadian UPR for Composites Market Outlook
5.3.2.1 Energy Growth Sources in the Canadian UPR Market for Composites
5.3.2.2 Huge Growth Prospects for the UPR Market for Composites in the Canadian Aerospace Industry
5.4 Brazilian UPR for Composites Market Forecast 2018-2028
5.4.1 Brazilian UPR for Composites Market Analysis 2018-2028
5.4.2 Brazilian UPR for Composites Market Outlook
5.4.2.1 Economic and Social Factors
5.4.2.2 Growing Middle Class Will Increase the Demand for UPR for Composites in the Brazilian Automotive Sector
5.5 Chinese UPR for Composites Market Forecast 2018-2028
5.5.1 Chinese UPR for Composites Market Analysis 2018-2028
5.5.2 Chinese UPR for Composites Market Outlook
5.5.2.1 Enormous Potential for Automotive Industry Development in China
5.5.2.2 Wind Energy will be the Key Growth Driver of the UPR Market for Composites
5.6 UK UPR for Composites Market Forecast 2018-2028
5.6.1 UK UPR for Composites Market Analysis 2018-2028
5.6.2 UK UPR for Composites Market Outlook
5.7 French UPR for Composites Market Forecast 2018-2028
5.7.1 French UPR for Composites Market Analysis 2018-2028
5.7.2 French UPR for Composites Market Outlook
5.7.2.1 Airbus’ Focus on CFRP Will Increase UPR for Composites Consumption in France
5.8 Italian UPR for Composites Market Forecast 2018-2028
5.8.1 Italian UPR for Composites Market Analysis 2018-2028
5.8.2 Italian UPR for Composites Market Outlook
5.8.2.1 Growth in Italy’s Renewable Energy Market Will Spur the Demand for UPR for Composites
5.9 Spanish UPR for Composites Market Forecast 2018-2028
5.9.1 Spanish UPR for Composites Market Analysis 2018-2028
5.9.2 Spanish UPR for Composites Market Outlook
5.9.2.1 How the Euro Debt Crisis Affected the Spanish UPR for Composites Demand in Different Industries
5.10 Russian UPR for Composites Market Forecast 2018-2028
5.10.1 Russian UPR for Composites Market Analysis 2018-2028
5.10.2 Russian UPR for Composites Market Outlook
5.10.2.1 UPR for Composites in the Russian Energy Sector
5.11 German UPR for Composites Market Forecast 2018-2028
5.11.1 German UPR for Composites Market Analysis 2018-2028
5.11.2 German UPR for Composites Market Outlook
5.11.2.1 Find out How German Leadership in the Automotive Industry Will Drive the Demand for UPR for Composites
5.12 Japanese UPR for Composites Market Forecast 2018-2028
5.12.1 Japanese UPR for Composites Market Analysis 2018-2028
5.12.2 Japanese UPR for Composites Market Outlook
5.13 Indian UPR for Composites Market Forecast 2018-2028
5.13.1 Indian UPR for Composites Market Analysis 2018-2028
5.13.2 Indian UPR for Composites Market Outlook
5.14 RoW UPR for Composites Market Forecast 2018-2028
5.14.1 RoW UPR for Composites Market Analysis 2018-2028
5.14.2 RoW UPR for Composites Market Outlook
6. SWOT Analysis of the UPR Market for Composites 2018-2028
7. Leading Companies in the UPR Market for Composites
7.1 Ashland Inc.
7.1.1 Ashland Inc. Historical Performance and Analysis
7.1.2 Ashland Inc. M&A Activity
7.1.3 Ashland Inc. Future Outlook
7.2 BASF
7.2.1 BASF Historical Performance and Analysis
7.2.2 BASF M&A Activity
7.2.3 BASF Future Outlook
7.3 Dow Chemical Company
7.3.1 Dow Chemical Company Historical Performance and Analysis
7.3.2 Dow Chemical Company M&A Activity
7.3.3 Dow Chemical Company Future Outlook
7.4 DSM
7.4.1 DSM Historical Performance and Analysis
7.4.2 DSM M&A Activity
7.4.3 DSM Future Outlook
7.5 Lonza GmBH
7.6 Reichhold
7.6.1 Reichhold Timeline
7.7 Polynt SpA
7.7.1 Polynt SpA M&A Activity
7.7.2 Polynt SpA Future Outlook
7.8 Shin-Etsu Chemical Co., Ltd. M&A Activity
7.8.1 Shin-Etsu Chemical Co., Ltd. Historical Performance and Analysis
7.8.2 Shin-Etsu Chemical Co., Ltd. M&A Activity
7.9 Swancor Ind. Co., Ltd.
7.10 Tianhe Resin Co., Ltd.
7.11 Other Leading Companies
8. Conclusions
8.1 The Global Unsaturated Polyester Resin Market for Composites Overview
8.2 Drivers and Restraints to the Global Unsaturated Polyester Resin Market for Composites 2018-2028
8.3 Unsaturated Polyester Resin Market for Composites Prospects – By Type
8.4 Leading National Unsaturated Polyester Resin Markets for Composites Forecast Summary
9. Glossary
Associated Visiongain Reports
Visiongain Report Sales Order Form
Appendix A
About Visiongain
Appendix B
Visiongain Report Evaluation Form
List of Figures
Figure 1.1 Global UPR Market for Composites Segmentation Overview 2018-2028
Figure 3.1 Global UPR for Composites Consumption Forecast 2018-2028 (Million Tonnes, AGR %)
Figure 3.2 Global UPR for Composites Market Value Forecast 2018-2028 ($bn, AGR %)
Figure 3.3 Drivers and Restraints of the Global UPR Market for Composites 2018
Figure 4.1 Global UPR for Composites Consumption Forecast by Products 2018-2028 (Million Tonnes)
Figure 4.2 Global UPR for Composites Consumption CAGR Forecast by Products 2018-2028, 2018-2023 and 2023-2028 (CAGR %)
Figure 4.3 Global UPR for Composites Market Value Forecast by Products 2018-2028 ($bn)
Figure 4.4 Global UPR for Composites Market Value CAGR Forecast by Products 2018-2028, 2018-2023 and 2023-2028 (CAGR %)
Figure 4.5 UPR for Composites Market Value Share Forecast by Products 2018 (% Share)
Figure 4.6 UPR for Composites Market Value Share Forecast by Products 2023 (% Share)
Figure 4.7 UPR for Composites Market Value Share Forecast by Products 2028 (% Share)
Figure 4.8 UPR for Composites Consumption Share Forecast by Products 2018 (% Share)
Figure 4.9. UPR for Composites Consumption Share Forecast by Products 2023 (% Share)
Figure 4.10 UPR for Composites Consumption Share Forecast by Products 2028 (% Share)
Figure 4.11 Orthopthalic UPR for Composites Consumption Forecast 2018-2028 (mt, AGR%)
Figure 4.12 Orthopthalic UPR for Composites Market Value Forecast 2018-2028 ($bn, AGR%)
Figure 4.13 Orthopthalic UPR for Composites Market Value Share Forecasts 2018, 2023, 2028 (% of Total Market Value)
Figure 4.14 Orthopthalic UPR for Composites AGR Vs Global Market 2018-2028 (AGR%)
Figure 4.15 Isopthalic UPR for Composites Consumption Forecast 2018-2028 (Mt, AGR%)
Figure 4.16 Isopthalic UPR for Composites Market Value Forecast 2018-2028 ($bn, AGR%)
Figure 4.17 Isopthalic UPR for Composites Market Value Share Forecasts 2018, 2023, 2028 (% of Total Market Value)
Figure 4.18 Isopthalic UPR for Composites AGR Vs Global Market 2018-2028 (AGR%)
Figure 4.19 CPD UPR for Composites Consumption Forecast 2018-2028 (Mt, AGR%)
Figure 4.20 PD UPR for Composites Market Value Forecast 2018-2028 ($bn, AGR%)
Figure 4.21 DCPD UPR for Composites Market Value Share Forecasts 2018, 2023, 2028 (% of Total Market Value)
Figure 4.22 DCPD UPR for Composites AGR Vs Global Market 2018-2028 (AGR%)
Figure 4.23 Other UPR for Composites Consumption Forecast 2018-2028 (Mt, AGR%)
Figure 4.24 Other UPR for Composites Market Value Forecast 2018-2028 ($bn, AGR %)
Figure 4.25 Other UPR for Composites Market Value Share Forecasts 2018, 2023, 2028 (% of Total Market Value)
Figure 4.26 Other UPR for Composites AGR Vs Global Market 2018-2028 (AGR%)
Figure 5.1 Leading National UPR for Composites Market Value Forecasts 2018-2028 ($bn)
Figure 5.2 Leading National UPR for Composites Market Value Share Forecast 2018 (%)
Figure 5.3 Leading National UPR for Composites Market Value Share Forecast 2023 (%)
Figure 5.4 Leading National UPR for Composites Market Value Share Forecast 2028 (%)
Figure 5.5 US UPR for Composites Market Value Forecast 2018-2028 ($bn, AGR%)
Figure 5.6 US UPR for Composites Market Value Share Forecasts 2018, 2023, 2028 (% of Global Market Value)
Figure 5.7 US Vs China UPR for Composites Market Value Share 2018-2028 (%Share)
Figure 5.8 US Vs China UPR for Composites Market Value 2018-2028 ($bn)
Figure 5.9 Value of Private Construction in U.S. 2011-2028 (US$ Bn, AGR (%)
Figure 5.10 Canadian UPR for Composites Market Value Forecast 2018-2026 ($bn, AGR%)
Figure 5.11 Canadian UPR for Composites Market Value Share Forecasts 2018, 2023, 2028 (% of Global Market Value)
Figure 5.12 Canada Vs China UPR for Composites Market Value Share 2018-2028 (%)
Figure 5.13 Canada Vs China UPR for Composites Market Value 2018-2028 ($bn)
Figure 5.14 Brazilian UPR for Composites Market Value Forecast 2018-2028 ($bn, AGR%)
Figure 5.15 Brazilian UPR for Composites Market Value Share Forecasts 2018, 2023, 2028 (% of Global Market Value)
Figure 5.16 Brazil Vs China UPR for Composites Market Value Share 2018-2028 (%)
Figure 5.17 Brazil Vs China UPR for Composites Market Value 2018-2028 ($bn)
Figure 5.18 GDP Growth rate of Brazil 2012-2022 (%)
Figure 5.19 Chinese UPR for Composites Market Value Forecast 2018-2028 ($bn, AGR%)
Figure 5.20 Chinese UPR for Composites Market Value Share Forecasts 2018, 2023, 2028 (% of Global Market Value)
Figure 5.21 UK UPR for Composites Market Value Forecast 2018-2028 ($bn, AGR%)
Figure 5.22 UK UPR for Composites Market Share Forecasts 2018, 2023, 2028 (% of Global Market Value)
Figure 5.23 UK Vs China UPR for Composites Market Share 2018-2028 (% Share)
Figure 5.24 UK Vs China UPR for Composites Market Value 2018-2028 ($bn)
Figure 5.25 U.K. Construction Industry in U.K.-Split by sector 2017 (%)
Figure 5.26 French UPR for Composites Market Value Forecast 2018-2028 ($bn, AGR%)
Figure 5.27 French UPR for Composites Market Value Share Forecasts 2018, 2023, 2028 (% of Global Market Value)
Figure 5.28 France Vs China UPR for Composites Market Value Share 2018-2028(%)
Figure 5.29 France Vs China UPR for Composites Market Value 2018-2028 ($bn)
Figure 5.30 Volume sale of light commercial vehicles in France 2015, 2016, 2017 (Units, AGR (%))
Figure 5.31 Italian UPR for Composites Market Value Forecast 2018-2028 ($bn, AGR%)
Figure 5.32 Italian UPR for Composites Market Value Share Forecasts 2018, 2023, 2028 (% of Global Market Value)
Figure 5.33 Italy Vs China UPR for Composites Market Value Share 2018-2028 (%)
Figure 5.34 Italy Vs China UPR for Composites Market Value 2018-2028 ($bn)
Figure 5.35 Spanish UPR for Composites Market Value Forecast 2018-2028 ($bn, AGR%)
Figure 5.36 Spanish UPR for Composites Market Value Share Forecasts 2018, 2023, 2028 (% of Global Market Value)
Figure 5.37 Spain Vs China UPR for Composites Market Value Share 2018-2028 (%)
Figure 5.38 Spain Vs China UPR for Composites Market Value 2018-2028 ($bn)
Figure 5.39 Russian UPR for Composites Market Forecast 2018-2028 ($bn, AGR%)
Figure 5.40 Russian UPR for Composites Market Value Share Forecasts 2018, 2023, 2028 (% of Global Market Value)
Figure 5.41 Russia Vs China UPR for Composites Market Share 2018-2028 (%)
Figure 5.42 Russia Vs China UPR for Composites Market Value 2018-2028 ($bn)
Figure 5.43 Yearly Installed Capacity of Wind Power in Russia 2017-2024 (MW/Year)
Figure 5.44 German UPR for Composites Market Value Forecast 2018-2028 ($bn, AGR%)
Figure 5.45 German UPR for Composites Market Value Share Forecasts 2018, 2023, 2028 (% of Global Market Value)
Figure 5.46 Germany Vs China UPR for Composites Market Value Share 2018-2028 (%)
Figure 5.47 Germany Vs China UPR for Composites Market Value 2018-2028 ($bn)
Figure 5.48 Japanese UPR for Composites Market Forecast 2018-2028 ($bn, AGR%)
Figure 5.49 Japanese UPR for Composites Market Share Forecasts 2018, 2023, 2028 (% of Global Market Value)
Figure 5.50 Japan Vs China UPR for Composites Market Share 2018-2028 (%)
Figure 5.51 Japan Vs China UPR for Composites Market Value 2018-2028 ($bn)
Figure 5.52 Monthly Car sales in Japan in 2016, 2017 and 2018
Figure 5.53 Indian UPR for Composites Market Forecast 2018-2028 ($bn, AGR%)
Figure 5.54 Indian UPR for Composites Market Share Forecasts 2018, 2023, 2028 (% of Global Market Value)
Figure 5.55 India Vs China UPR for Composites Market Share 2018-2028 (%)
Figure 5.56 India Vs China UPR for Composites Market Value 2018-2028 ($bn)
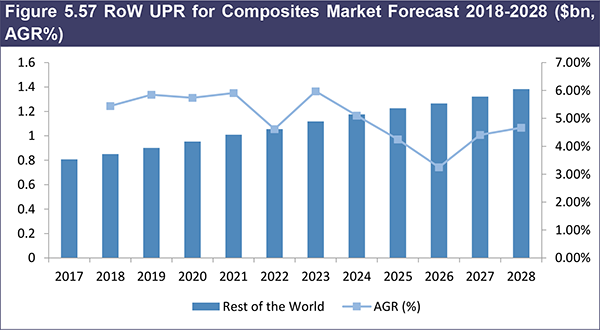
Figure 5.57 RoW UPR for Composites Market Forecast 2018-2028 ($bn, AGR%)
Figure 5.58 RoW UPR for Composites Market Share Forecasts 2018, 2023, 2028 (% of Global Market Value)
Figure 5.59 RoW Vs China UPR for Composites Market Share 2018-2028 (%)
Figure 5.60 RoW Vs China UPR for Composites Market Value 2018-2028 ($bn)
Figure 7.1 Ashland Inc. Revenue by Business Segment 2017 (% Share)
Figure 7.2 Ashland Inc. Revenue by Region 2017 (% Share)
Figure 7.3 Ashland Inc. Annual Revenues 2012-2017 ($bn, AGR%)
Figure 7.4 BASF Revenue Share by Business Segment 2017 (%)
Figure 7.5 BASF Petrochemicals Revenue by Geographic Region 2017 (%)
Figure 7.6 BASF Annual Revenues 2012-2017 ($bn, AGR%)
Figure 7. 7 Dow Chemical Company’s Segments
Figure 7.8 Dow Chemical Company Revenue by Business Segment 2017
(% Share)
Figure 7.9 Dow Chemical Company Annual Revenues 2012-2017 ($bn, AGR%)
Figure 7.10 DSM Net Sales by Sectors 2017 (% Share)
Figure 7.11 DSM Net Sales by Geography 2017 (% Share)
Figure 7.12 DSM Annual Revenue 2012-2017 ($bn, AGR%)
Figure 7.13 Lonza GmbH. Revenue Share by Business Segment 2017 (%)
Figure 7.14 Lonza GmbH. Revenue by Geographic Region 2017 (%)
Figure 7.15 Lonza GmbH. Annual Revenues 2012-2017 ($Bn)
Figure 7.16 Shin-Etsu Chemical Co., Ltd. Revenue Share by Business Segment 2017 (%)
Figure 7.17 Shin-Etsu Chemical Co., Ltd. Revenue by Geographic Region 2017 (%)
Figure 7.18 Shin-Etsu Chemical Co., Ltd. Annual Revenues 2012-2017 ($Bn, AGR %)
Figure 7.19 Tianhe Resin Co., Ltd. Structure
Figure 8.1 Drivers and Restraints of the Global UPR Market for Composites 2018
List of Tables
Table 3.1 Global Growth in Unsaturated Polyester Resin for Composites Demand vs. GDP 2018-2028 (AGR%, Difference%)
Table 3.2 Global UPR for Composites Consumption Forecast 2018-2028 (Million Tonnes, AGR %, CAGR %, Cumulative)
Table 3.3 Global UPR for Composites Market Value Forecast 2018-2028 ($bn, AGR %, CAGR%, Cumulative)
Table 4.1 Global UPR for Composites Consumption Forecast by Products 2018-2028 (Million Tonnes, AGR %, Cumulative)
Table 4.2 Global UPR for Composites Consumption CAGR Forecast by Products 2018-2028, 2018-2023 and 2023-2028 (CAGR %)
Table 4.3 Global UPR for Composites Market Value Forecast by Products 2018-2028 ($bn, AGR %, Cumulative)
Table 4.4 Global UPR for Composites Market Value CAGR Forecast by Products (CAGR % 2018-2028, 2018-2023, and 2023-2028)
Table 4.5 Orthopthalic UPR for Composites Consumption Forecast 2018-2028 (mt, AGR%, CAGR%, Cumulative)
Table 4.6 Orthopthalic UPR for Composites Market Value Forecast 2018-2028 ($bn, AGR%, CAGR%, Cumulative)
Table 4.7 Isopthalic UPR for Composites Consumption Forecast 2018-2028 (mt, AGR%, CAGR%, Cumulative)
Table 4.8 Isopthalic UPR for Composites Market Value Forecast 2018-2028 ($bn, AGR%, CAGR%, Cumulative)
Table 4.9 DCPD UPR for Composites Consumption Forecast 2018-2028 (mt, AGR%, CAGR%, Cumulative)
Table 4.10 DCPD UPR for Composites Market Value Forecast 2018-2028 ($bn, AGR%, CAGR%, Cumulative)
Table 4.11 Other UPR for Composites Consumption Forecast 2018-2028 (mt, AGR%, CAGR%, Cumulative)
Table 4.12 Other UPR for Composites Market Value Forecast 2018-2028 ($bn, AGR%, CAGR%, Cumulative)
Table 5.1 Leading National UPR for Composites Market Value Forecasts 2018-2028 ($bn, AGR%)
Table 5.2 US UPR for Composites Market Value Forecast 2018-2028 ($bn, AGR%, CAGR%, Cumulative)
Table 5.3 US UPR for Composites Market Share Forecast 2018-2028 (% Share)
Table 5.4 Canadian UPR for Composites Market Forecast 2018-2028 ($bn, AGR%, CAGR%, Cumulative)
Table 5.5 Canadian UPR for Composites Market Share Forecasts 2018-2028 (% share)
Table 5.6 Brazilian UPR for Composites Market Forecast 2018-2028 ($bn, AGR%, CAGR%, Cumulative)
Table 5.7 Brazilian UPR for Composites Market Share Forecasts 2018-2028 (% Share)
Table 5.8 Chinese UPR for Composites Market Forecast 2018-2028 ($bn, AGR%, CAGR%, Cumulative)
Table 5.9 Chinese UPR for Composites Market Share Forecasts 2018-2028 (% Share)
Table 5.10 UK UPR for Composites Market Forecast 2018-2028 ($bn, AGR%, CAGR%, Cumulative)
Table 5.11 UK UPR for Composites Market Share Forecasts 2018-2028 (% share)
Table 5.12 French UPR for Composites Market Forecast 2018-2028 ($bn, AGR%, CAGR%, Cumulative)
Table 5.13 French UPR for Composites Market Share Forecasts 2018-2028 (% Share)
Table 5.14 Italian UPR for Composites Market Forecast 2018-2028 ($bn, AGR%, CAGR%, Cumulative)
Table 5.15 Italian UPR for Composites Market Share Forecasts 2018-2028 (% Share)
Table 5.16 Spanish UPR for Composites Market Forecast 2018-2028 ($bn, AGR%, CAGR%, Cumulative)
Table 5.17 Spanish UPR for Composites Market Share Forecasts 2018-2028 (% Share)
Table 5.18 Russian UPR for Composites Market Forecast 2018-2028 ($bn, AGR%, CAGR%, Cumulative)
Table 5.19 Russian UPR for Composites Market Share Forecasts 2018-2028 (% Share)
Table 5.20 German UPR for Composites Market Forecast 2018-2028 ($bn, AGR%, CAGR%, Cumulative)
Table 5.21 German UPR for Composites Market Share Forecasts 2018-2028 (% Share)
Table 5.22 Japanese UPR for Composites Market Forecast 2018-2028 ($bn, AGR%, CAGR%, Cumulative)
Table 5.23 Japanese UPR for Composites Market Share Forecasts 2018-2028 (% Share)
Table 5.24 Indian UPR for Composites Market Forecast 2018-2028 ($bn, AGR%, CAGR%, Cumulative)
Table 5.25 Indian UPR for Composites Market Share Forecasts 2018-2028 (% share)
Table 5.26 RoW UPR for Composites Market Forecast 2018-2028 ($bn, AGR%, CAGR%, Cumulative)
Table 5.27 RoW UPR for Composites Market Share Forecasts 2018-2028 (% share)
Table 6.1 SWOT Analysis of the UPR Market for Composites 2018-2028
Table 7.1 Ashland Inc. Overview: Total Company Revenue ($bn), Sector Revenue ($bn), CEO, Headquarters, Foundation Year, Number of Employees, Ticker, IR Contact, Website)
Table 7.2 Ashland Inc. Annual Revenues 2012-2017 ($bn, AGR%)
Table 7.3 Ashland Inc. Major Activities: M&A (Time, Description)
Table 7.4 BASF Overview: Total Company Revenue ($bn), CEO, Headquarters, Foundation Year, Number of Employees, Ticker, IR Contact, Website)
Table 7.5 BASF Products & Services (Company Division, Product Lines)
Table 7.6 BASF Annual Revenues 2012-2017 ($bn, AGR%)
Table 7.7 BASF Major Activities: M&A (Time, Description)
Table 7.8 Dow Chemical Company Overview: Total Company Revenue ($bn), Sector Revenue ($bn), CEO, Headquarters, Foundation Year, Number of Employees, Ticker, IR Contact, Website)
Table 7.9 Dow Chemical Company Annual Revenues 2012-2017 ($bn, AGR%)
Table 7.10 Dow Chemical Company Major Activities: M&A 2009-2017 (Time, Description)
Table 7.11 DSM Overview: Total Company Revenue ($bn), CEO, Headquarters, Foundation Year, Number of Employees, Ticker, IR Contact, Website)
Table 7.12 DSM Annual Revenues 2012-2017 ($bn, AGR%)
Table 7.13 DSM Major Activities: M&A (Time, Description)
Table 7.14 Lonza GmbH. Overview: Total Company Revenue ($bn), CEO, Headquarters, Foundation Year, Number of Employees, Website)
Table 7.15 Lonza GmbH. Products & Services (Company Division, Product Description)
Table 7.16 Lonza GmbH. Annual Revenues 2012-2017 ($Bn, AGR %)
Table 7.17 Lonza GmbH. Major Activities: M&A (Time, Description)
Table 7.18 Reichhold Overview: CEO, Headquarters, Foundation Year, Number of Employees, IR Contact, Website)
Table 7.19 Reichhold Major Activities (Time, Description)
Table 7.20 Polynt SpA Overview: CEO, Headquarters, Foundation Year, Number of Employees, Website)
Table 7.21 Polynt SpA Products & Services (Company Division, Product Description)
Table 7.22 Polynt SpA Major Activities: M&A (Time, Description)
Table 7.23 Shin-Etsu Chemical Co., Ltd. Overview: Total Company Revenue ($bn), CEO, Headquarters, Foundation Year, Number of Employees, Website)
Table 7.24 Shin-Etsu Chemical Co., Ltd. Products & Services (Company Division, Product Description)
Table 7.25 Shin-Etsu Chemical Co., Ltd. Annual Revenues 2012-2017 ($Bn, AGR %)
Table 7.26 Swancor Ind. Co., Ltd. Overview: Total Company Revenue ($bn), CEO, Headquarters, Foundation Year, Number of Employees, IR Contact, Website)
Table 7.27 Swancor Ind. Co., Ltd. Products & Applications (Product, Application)
Table 7.28 Other Leading Companies in the UPR Market 2018
Table 8.1 Global UPR Market for Composites Forecast Summary 2018, 2023, 2028 (Million Tonnes, AGR %, CAGR%)
Table 8.2 Global UPR Market for Composites Forecast Summary 2018, 2023, 2028 ($bn, AGR %, CAGR%)
Table 8.3 Global Unsaturated Polyester Resin Market for Composites Submarket by Type Forecast Summary 2018, 2023, 2028 ($bn, CAGR %)
Table 8.4 Global Unsaturated Polyester Resin Market for Composites Submarket by Type Forecast Summary 2018, 2023, 2028 (mt, CAGR %)
Table 8.5 Global Leading National Unsaturated Polyester Resin Market for Composites Forecast Summary 2018, 2023, 2028 ($bn, CAGR %)
ADTECH Plastic Systems
Advance Coatings Co.
Advanced Materials Technology (Pty.) Ltd.
Aerontec
Air Products & Chemicals
Airbus
AkzoNobel
Aland (HK) Holding Limited
Aliancys AG
AOC Resins
Argosy International Inc.
Ashland Inc.
Ashland Performance Materials
Associated Industries Inc.
Audi
BASF
Bayer
Bell Helicopter
BMW
Boeing Canada
Bombardier Aerospace
Bonstone Materials Corp
Borealis
Boytek Resins
BÜFA Composite Systems GmbH & Co. KG
CAE Inc.
CCP Composites
Changzhou Huarun Composite Materials Co. Ltd
Ciba
Composites Canada
Composites One
Cray Valley
Cubic Tech Corporation
Daimler
Dainippon Ink and Chemicals (DIC)
Dassault
Degussa
Divina HiTech Systems
Dow Agro Sciences LLC
Dow Chemical Company
DSM
DuPont Tate
Lyle Bio Products Co. LLC
Dyna-Grout Inc.
E.V. Roberts
Enercon
ExxonMobil
FCM
Fiberglass (A/Asia) Sales Pty. Ltd
Fiberglass Coatings Inc.
Fibre Glass Developments Corporation
Fibreglass Supplies
Ford
Fortitech, Inc
Freeman Manufacturing & Supply Co.
FRP Services & Co.
Gazprom
GE Canada
General Dynamics
General Motors
Glass Fiber Technology Co. Ltd.
Great Wall Motor Co Ltd
Gruber Systems, Inc.
Havel Composites CZ sro
Hepworth
Hercules Inc.
Heroux Devtek
Hexion
HK Reserarch Corp.
Hobas
Honda
Huntsman
Ihance Fluoro-Seal LLC
INEOS
Infinity Composites Inc.
Interplastic Corp.
Italbeit Srl
Johnson Polymer
Jotun Polymer
JSR Micro
K & C Mouldings (England) Ltd.
KemiKomp Inc.
Kemrock Industries & Exports Ltd.
Kirkco-Dopag
Lightscape Materials Inc.'s
Linamar
Lintech International LLC
Lockheed Martin
LyondellBasell
MacDonald Dettwiler
Magellan Aerospace
Magna
Magnum Venus Products-MVP
Martinrea
Mechemo Group
Mercedes
Mitsui
Monsanto
Nantong Tianhe Resin Co., Ltd.
Nexeo Solutions
Nissan
Noah's Marine
Nord Composites
North American Composites
Nuplex Composites
Owen Corning
Peugeot
PJ Hobbs Industries Ltd.
Poliya Composites and Polymers
Polymer Products (Phil.) Inc.
Polymer Technologies Pte. Ltd
Polynt Composites Canada Inc.
Pratt & Whitney
Quimidroga SA
Reichhold
Reinforced Plastics Lab Div.
Renault
Resana S/A
Revchem Composites Inc.
Rohm
Rolls-Royce
Rostec
RT-Chemcomposite Holding Company
SABIC
Saint-Gobain
Satyen Polymers Pvt. Ltd.
Scott Bader Company Ltd.
SGL Carbon AG
Shanghai New Tianhe Resin Co., Ltd.
Shin-Etsu Chemical
SikaAxson U.S.
SK Global Chemical Company Limited
Sorex Ltd
Spraycore
Stealth Composites Inc.
Superior Fiberglass & Resins
Swancor Ind. Co., Ltd
Swift Adhesives
Syngenta
Technip
Tianhe Resin Co., Ltd
Tila Kompozit Temsilcilik Iç ve Dis Tic. Ltd. Sti.
Tongun Elektrik Telekom Dogalgaz Mlz. San. Ve Tic. A.S.
Tool Chemical Composites (TCC)
Toray Industries
Tortuga Companhia Zootécnica Agrária (Tortuga)
Toyota
Unitech Industries Limited
Vestas
Wee Tee Tong Chemical Pte Ltd.
Yantai Andre Pectin Co. Ltd.
Zhejiang Taizhou Chemical Raw Material Company
Zhejiang Tianhe Resin Co.
List of Other Organisations Mentioned in this Report
Bureau of the Census and Bureau of Labour Statistics
Energy Research Agency
European Union
French Builders Association
India Brand Equity Foundation
International Monetary Fund (IMF)
International Organization of Motor Vehicle Manufacturers (OICA)
Massachusetts Institute of Technology (MIT)
Oak Ridge National Laboratory
The Bureau of the Census and Bureau of Labour Statistics
The Canadian Wind Energy Association
The Government of India
The Spanish Wind Energy Association
The US Environmental Protection Agency (EPA)
United Nations
US Department of Energy