Visiongain assesses that the composites market is fragmented with the top 30 companies accounting for just over 44% of the global composites market in 2019.
Increasing demand for lightweight materials in aerospace, wind energy, transportation (including automotive) and other end-use industries will continue to drive future composites growth. Increasing demand is expected to encourage material manufacturers to increase their production facilities to cater to growing industry demand.
Who are the top 30 composites companies? Visiongain’s comprehensive new report contains a detailed analysis of the leading 30 composites companies with the key facts of each company’s revenue, market share, and outlook.
How this 146-page report will inform you:
• View extensive profiles of the leading 30 companies in the composites market to keep your knowledge ahead of your competition and ensure you exploit key business opportunities
• The report provides detailed sales of the market and the commercial drivers and restraints, allowing you to more effectively compete in the market. Our study shows current market data, market shares, original analysis and insight into commercial developments
• The report provides 86 tables, charts, and graphs
• Let our analysts present you with a thorough assessment of the current composites market. This analysis will achieve quicker, easier understanding. Also, you will gain from our analyst’s industry expertise allowing you to demonstrate your authority on the composites sector.
• Discover sales for the top 30 composites companies
• What are the prospects for the top 30 composites companies? How is the market evolving? Which company generates the most revenue? Use our study and expert insight to grow your business and give you more industry influence. Stay informed about the potential for each of these composites markets with individual analysis 2019.
• Explore the factors affecting top companies, and learn about the forces influencing market dynamics
• Explore the strengths, weaknesses, opportunities and threats (SWOT) affecting the industry. Discover what the present and future outlook for business will be. Learn about the following business-critical issues
• Identify who are the leading 30 companies in the composites industry
• Our report reveals the companies which hold the greatest potential. In particular, exploring and analysing the activities of these companies: See where the expected gains will be. Our work explains that potential, helping you stay ahead. Gain a thorough understanding of the competitive landscape with profiles of 30 composites companies examining their positioning, capabilities product portfolios, services, focus, strategies, M&A activity, and future outlook.
• Asahi Fibreglass Company
• Braj Binani Group
• China Fibreglass Company
• Chongqing Polycomp International Corporation
• Cytec Industries (Solvay S.A.)
• DuPont
• Formosa Plastic
• GKN
• Guardian Fibre Glass
• Hexcel Corporation
• Huntsman Corporation
• Johns Manville
• KCC Corporation
• Kolon Industries
• Kurarey
• Mitsubishi Chemical Corporation
• Momentive Performance Materials, Inc.
• Nippon Sheet Glass Co. Ltd.
• Owens Corning
• PPG Industries
• Saertex Glass
• Saint Gobain Vetrotex
• SGL Group
• Taishan Fibreglass SA
• Taiwan Glass Industry Corporation
• Teijin
• TenCate N.V.
• Toray
• Weyerhaeuser Company
• Zoltek
Discover information found nowhere else in this independent assessment of the top 30 composites companies
Top 30 Composites Companies Report 2019: Market Share Analysis, Financials & Key Strategies and Achievements Details for the Glass Fibre, Carbon Fibre and Aramid Fibre Companies, Including Owens Corning Corporation, Saint-Gobain, Asahi Fibreglass Company, Mitsubishi Chemical Corporation, Johns Manville Corp. and More report provides impartial composites sector analysis. With the independent business intelligence found only in our work, you will discover where the prospects are for profit. In particular, our new research provides you with key strategic advantages: independent and objective analysis, and revealing company profiles will provide you with that necessary edge, allowing you to gain ground over your competitors.
With this report, you are less likely to fall behind in knowledge or miss crucial business opportunities. You will save time and receive recognition for your market insight. See how this report could benefit and enhance your research, analysis, company presentations and ultimately your individual business decisions and your company’s prospects.
What makes this report unique?
Visiongain’s research methodology involves an exclusive blend of primary and secondary sources providing informed analysis. This methodology allows insight into the key drivers and restraints behind market dynamics and competitive developments. The report, therefore, presents a comprehensive analysis of the top 30 composites companies, including revenue, market share, products, services and outlook.
Why Choose Visiongain Business Intelligence?
Visiongain’s increasingly diverse sector coverage strengthens our research portfolio. The growing cross-sector convergence of key verticals and the interplay of game-changing technologies across hitherto unrelated industries are creating new synergies, resulting in new business opportunities for you to leverage.
Visiongain is a trading partner with the US Federal Government
CCR Ref number: KD4R6
Do you have any custom requirements we can help you with? Any need for specific country, geo region, market segment or specific company information? Contact us today, we can discuss your needs and see how we can help: sara.peerun@visiongain.com
1. Report Overview
1.1 Global Leading Composites Companies Overview
1.2 Why You Should Read This Report
1.3 How This Report Delivers
1.4 Key Questions Answered by This Analytical Report Includes:
1.5 Who is This Report For?
1.7 Frequently Asked Questions (FAQ)
1.8 Associated Visiongain Reports
1.9 About Visiongain
2. Introduction to the Composites Market
2.1 What Are Composites?
2.2 Uses of Composites
2.2.1 The Use of Fibres within Composites
2.3 Glass Fibre Reinforced Polymers (GFRP)
2.3.1 Major Factors Driving the Usage of Glass Fibre Reinforced Polymers
2.4 Carbon Fibre Reinforced Polymers (GFRP)
2.5 Aramid Fibre Reinforced Polymers (GFRP)
2.6 Composites Market By Application
2.6.1 Transportation
2.6.2 Aviation
2.6.3 Energy
2.6.4 Sporting Goods
2.6.5 Consumer Goods
2.7 The Composites Industry
2.8 Composite Applications and Competing Materials in Major End Market Segments
2.9.1 Thermoset Composites
2.9.2 Thermoplastic Composites
3. The Leading Composites Companies 2019
3.1 The Global Top 30 Composites Companies 2019
3.2 The Glass Fibre Market
3.2.1 The Global Top Glass Fibre Companies
3.3 The Carbon Fibre Market
3.3.1 The Global Top Carbon Fibre Companies
3.4 The Aramid Fibre Market
3.4.1 The Global Top Aramid Fibre Companies
4. The Leading Carbon, Glass & Aramid Fibre Companies 2019
4.1 Asahi Fibreglass Company
4.1.1 Asahi Fibreglass Overview and Operations & Locations
4.1.2 Asahi Fibreglass Outlook
4.1.3 Asahi Fibreglass Mergers, Acquisitions & News
4.2 Braj Binani Group
4.2.1 Braj Binani Group Overview and Operations & Locations
4.2.2 Braj Binani Group Outlook & News
4.3 China Fibreglass Company
4.3.1 China Fibreglass Company Overview and Operations & Locations
4.3.2 China Fibreglass Company Outlook & News
4.4 Cytec Industries (Solvay S.A.)
4.4.1 Solvay S.A. Overview and Operations & Locations
4.4.2 Solvay S.A. Outlook & News
4.5 DuPont
4.5.1 DuPont Overview and Operations & Locations
4.5.2 DuPont Outlook & News
4.6 Formosa Plastic
4.6.1 Formosa Plastic Overview and Operations & Locations
4.6.2 Formosa Plastic Outlook & News
4.7 GKN
4.7.1 GKN Overview and Operations & Locations
4.7.2 GKN Outlook & News
4.8 Guardian Fibre Glass
4.8.1 Guardian Fibreglass Overview and Operations & Locations
4.9 Gurit
4.9.1 Gurit Overview and Operations & Locations
4.9.2 Gurit Outlook & News
4.10 Huntsman Corporation
4.10.1 Huntsman Corporation Overview and Operations & Locations
4.10.2 Huntsman Corporation Outlook & News
4.11 Hexcel Corporation
4.11.1 Hexcel Overview and Operations & Locations
4.11.2 Hexcel Outlook & News
4.12 Johns Manville
4.12.1 Johns Manville Overview and Operations & Locations
4.12.2 Johns Manville Outlook & News
4.13 Kuraray
4.13.1 Kuraray Overview and Operations & Locations
4.13.2 Kuraray Outlook & News
4.14 Kolon Industries
4.14.1 Kolon Industries Overview and Operations & Locations
4.14.2 Kolon Industries Outlook & News
4.15 KCC Corporation
4.15.1 KCC Corporation Overview and Operations & Locations
4.15.2 KCC Corporation Outlook & News
4.16 Mitsubishi Chemical Corporation
4.16.1 Mitsubishi Chemical Corporation Overview and Operations & Locations
4.16.2 Mitsubishi Chemical Corporation Outlook & News
4.17 Momentive Performance Materials, Inc.
4.17.1 Momentive Performance Materials, Inc. Overview and Operations & Locations
4.17.2 Momentive Performance Materials, Inc. Outlook & News
4.18 Nippon Sheet Glass Co. Ltd.
4.18.1 Nippon Sheet Glass Co. Ltd. Overview and Operations & Locations
4.18.2 Nippon Sheet Glass Co. Ltd. Corporation Outlook & News
4.19 Owens Corning
4.19.1 Owens Corning Overview and Operations & Locations
4.19.2 Owens Corning Outlook & News
4.20 PPG Industries
4.20.1 PPG Overview and Operations & Locations
4.20.2 PPG Outlook & News
4.21 Saint Gobain Vetrotex
4.21.1 Saint-Gobain Vetrotex Overview and Operations & Locations
4.21.2 Saint-Gobain Vetrotex Outlook & News
4.22 SGL Group
4.22.1 SGL Group Overview and Operations & Locations
4.22.2 SGL Group Outlook & News
4.23 Saertex Glass
4.23.1 Saertex Glass Overview and Operations & Locations
4.24 Taishan Fibreglass SA
4.24.1 Taishan Fibreglass Overview and Operations & Locations
4.24.2 Taishan Fibreglass Outlook & News
4.25 Taiwan Glass Industry Corporation
4.25.1 Taiwan Glass Industry Corporation Overview and Operations & Locations
4.25.2 Taiwan Glass Industry Corporation Outlook & News
4.26 Teijin
4.26.1 Teijin Overview and Operations & Locations
4.27 TenCate N.V.
4.27.1 TenCate Overview and Operations & Locations
4.27.2 TenCate Outlook & News
4.28 Toray
4.28.1 Toray Overview and Operations & Locations
4.28.2 Toray Outlook & News
4.29 Weyerhaeuser Company
4.29.1 Weyerhaeuser Company Overview and Operations & Locations
4.29.2 Weyerhaeuser Company Outlook & News
4.30 Zoltek
4.30.1 Zoltek Overview and Operations & Locations
4.30.2 Zoltek Outlook & News
4.31 Other Leading Composite Companies
4.31.1 Advanced Glassfibre Yarns
4.31.2 AKSA
4.31.3 BGF
4.31.4 Chongqing Polycomp International Corporation
4.31.5 Chomarat Group
4.31.6 Crosby Composites
4.31.7 Fiberex Glass Corporation
4.31.8 Innegra Technologies
4.31.9 Jushi Group Co. Ltd
4.31.10 Nitto Boseki
4.31.11 Plasan Carbon Composites
4.32 Other Leading Composites Companies
5. SWOT Analysis of The Composites Market
6. Conclusion
6.1 The Leading Companies in the Composites Market
7. Glossary
Associated Visiongain Reports
Visiongain Report Sales Order Form
Appendix A
About Visiongain
Appendix B
Visiongain Report Evaluation Form
List of Figures
Figure 2.1 Global Composite Overview by Composite Type
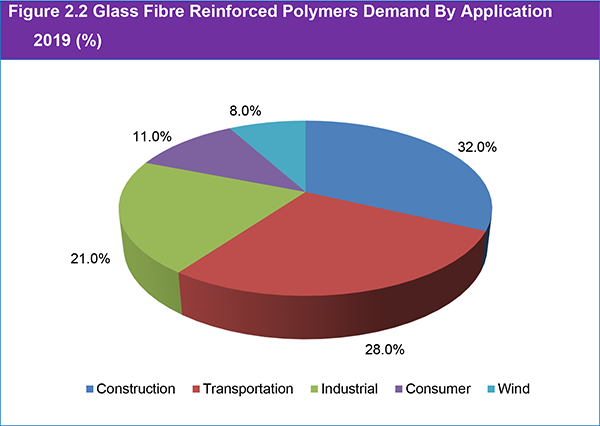
Figure 2.2 Glass Fibre Reinforced Polymers Demand By Application 2019 (%)
Figure 2.3 Global Composite Overview by Application
Figure 2.4 Global Composite Materials Market by Application
Figure 2.5 Composite materials Market Comparison 2015 & 2018 (%)
Figure 2.6 Global Composite Materials Market Forecast 2019-2029 ($Billion)
Figure 2.7 Global Thermoset Composite Market Forecast 2019-2029 ($Billion)
Figure 2.8 Global Thermoplastic Composite Market Forecast 2019-2029 ($Billion)
Figure 2.9 Cost Comparison by Materials
Figure 2.10 Lightweight Materials in the Automotive Industry from 2010 to 2030
Figure 2.11 Global Hybrid Composites Market Size 2019-2029 ($Million)
Figure 2.12 Global Bio Composites Market Size 2019-2029 ($Billion)
Figure 3.1 The Global Top 30 Composite Companies 2019 (Market Share %)
Figure 3.2 The Global Construction Industry Spending 2014-2025 ($ Trillion)
Figure 3.3 The Global Leisure Boat Market Size 2018-2025 ($ Billion)
Figure 3.4 The Global Wind Power Market Capacity 2018-2025 (GW)
Figure 3.5 The Global Top Glass Fibre Composite Companies 2019 (Market Share (%)
Figure 3.6 The Global Aerospace Industry 2019 ($ Bn)
Figure 3.7 The Global Luxury Car Sales 2010-2018 (Units)
Figure 3.8 The Global Top Carbon Fibre Composite Companies 2019 (Market Share (%)
Figure 3.9 The Global Body Armour Market Size 2019-2025 ($ Bn)
Figure 3.10 The Global Top Aramid Fibre Composite Companies 2019 (Market Share (%)
Figure 4.1 Asahi Fibreglass Net Sales by Material Segment 2018 (%)
Figure 4.2 Asahi Fibreglass Net Sales by Geographical Location 2018 (%)
Figure 4.3 China Fibreglass Company Revenue From International & Domestic Sales 2018 (%)
Figure 4.4 Solvay S.A. Company Revenue From Business Segment 2018 (%)
Figure 4.5 DuPont Net Sales by Business Segment 2018 (%)
Figure 4.6 GKN Net Sales Breakdown by Business Division 2018 (%)
Figure 4.7 GKN Net Sales Breakdown by Geographical Region 2018 (%)
Figure 4.8 Gurit Net Sales Breakdown by End Market 2018 (%)
Figure 4.9 Gurit Net Sales Breakdown by Geographic Region 2018 (%)
Figure 4.10 Huntsman Corporation Net Sales Breakdown by Business Segment 2018 (%)
Figure 4.11 Hexcel Net Sales Breakdown by Business Segment 2018 (%)
Figure 4.12 Hexcel Net Sales Breakdown by Geography 2018 (%)
Figure 4.13 Kuraray Net Sales Breakdown by Business Segment 2018 (%)
Figure 4.14 Momentive Performance Materials Net Sales Breakdown by Business Segment 2018 (%)
Figure 4.15 Nippon Sheet Glass Co. Ltd Sales Breakdown by Business Segment 2018 (%)
Figure 4.16 Owens Corning Net Sales Breakdown by Business Segment 2018 (%)
Figure 4.17 Owens Corning Net Sales Breakdown by Geographical 2018 (%)
Figure 4.18 PPG Net Sales Breakdown by Business Segment 2018 (%)
Figure 4.19 PPG Net Sales Breakdown by Geographic Segment 2018 (%)
Figure 4.20 Saint-Gobain Net Sales Breakdown by Business Segment 2018 (%)
Figure 4.21 Saint-Gobain Net Sales Breakdown by Geographical Location 2018 (%)
Figure 4.22 Taiwan Glass Industry Corporation Sales Revenue by Business Segment (%) 2018
Figure 4.23 Teijin Net Sales Breakdown by Business Segment 2018 (%)
Figure 4.24 TenCate Net Sales Breakdown by Business Segment 2018 (%)
Figure 4.25 Toray Net Sales Breakdown by Business Segment 2018 (%)
Figure 4.26 Zoltek Net Sales Breakdown by Geographical Location (%) 2018
List of Tables
Table 2.1 Composite Applications and Competing Materials in Major End Market (End-User Industry, Application, Materials)
Table 2.2 Key Composites Issues to Deliver Better Solutions (Issues, Industry Expectations)
Table 3.1 The Global Top 30 Composite Companies 2019 (Total Revenue $bn, Sector Revenue $m, Total Composite Market Share (%))
Table 3.2 The Global Top Glass Fibre Composite Companies 2019 (Total Revenue $bn, Glass Fibre Composite Market Share (%))
Table 3.3 The Global Top Carbon Fibre Composite Companies 2019 (Total Revenue $bn, Carbon Fibre Composite Market Share (%))
Table 3.4 The Global Top Aramid Fibre Composite Companies 2019 (Total Revenue $bn, Sector Revenue $m, Aramid Fibre Composite Market Share (%)
Table 4.1 Asahi Fibreglass Overview 2018 (Total Revenue $bn, Composites Revenue $m, Market Share, Market Position, Primary Sector, HQ, Ticker, Website)
Table 4.2 Braj Binani Group Overview 2018 (Total Revenue $bn, Market Share, Market Position, Primary Sector, HQ, Ticker, Website)
Table 4.3 China Fibreglass Company Overview 2018 (Total Revenue $bn, Composites Revenue $m, Market Share, Market Position, Primary Sector, HQ, Ticker, Website)
Table 4.4 Solvay S.A. Overview 2018 (Total Revenue $bn, Composites Revenue $m, Market Share, Market Position, Primary Sector, HQ, Website)
Table 4.5 DuPont Overview 2018 (Total Revenue $bn, Composites Revenue $m, Market Share, Market Position, Primary Sector, HQ, Ticker, Website)
Table 4.6 Formosa Plastic Overview 2018 (Total Revenue $bn, Composites Revenue $m, Market Share, Market Position, Primary Sector, HQ, Ticker, Website)
Table 4.7 GKN Overview 2018 (Total Revenue $bn, Composites Revenue $m, Market Share, Market Position, Primary Sector, HQ, Ticker, Website)
Table 4.8 Guardian Fibre Glass Overview 2018 (Total Revenue $ bn, Composites Revenue $m, Market Share, Market Position, Primary Sector, HQ, Ticker, Website)
Table 4.9 Gurit Overview 2018 (Total Revenue $bn, Composites Revenue $m, Market Share, Market Position, Primary Sector, HQ, Ticker, Website)
Table 4.10 Huntsman Corporation Overview 2018 (Total Revenue $bn, Composites Revenue $m, Market Share, Market Position, Primary Sector, HQ, Ticker, Website)
Table 4.11 Hexcel Overview 2018 (Total Revenue $bn, Composites Revenue $bn, Market Share, Market Position, Primary Sector, HQ, Ticker, Website)
Table 4.12 Hexcel Detailed Description of Composite Materials and Product End Uses
Table 4.13 Johns Manville Overview 2018 (Total Revenue $bn, Composites Revenue $bn, Market Share, Market Position, Primary Sector, HQ, Ticker, Website)
Table 4.14 Kuraray Overview 2018 (Total Revenue $bn, Composites Revenue $m, Market Share, Market Position, Primary Sector, HQ, Ticker, Website)
Table 4.15 Kolon Industries Overview 2018 (Total Revenue $bn, Composites Revenue $m, Market Share, Market Position, Primary Sector, HQ, Ticker, Website)
Table 4.16 KCC Corporation Overview 2018 (Total Revenue $bn, Composites Revenue $m, Market Share, Market Position, Primary Sector, HQ, Ticker, Website)
Table 4.17 Mitsubishi Chemical Corporation Overview 2018 (Total Revenue $bn, Composites Revenue $bn, Market Share, Market Position, Primary Sector, HQ, Ticker, Website)
Table 4.18 Momentive Performance Materials, Inc. Overview 2018 (Total Revenue $bn, Composites Revenue $bn, Market Share, Market Position, Primary Sector, HQ, Ticker, Website)
Table 4.19 Nippon Sheet Glass Co. Ltd. Overview 2018 (Total Revenue $bn, Composites Revenue $bn, Market Share, Market Position, Primary Sector, HQ, Ticker, Website)
Table 4.20 Owens Corning Overview 2018 (Total Revenue $bn, Composites Revenue $bn, Market Share, Market Position, Primary Sector, HQ, Ticker, Website)
Table 4.21 PPG Overview 2018 (Total Revenue $bn, Composites Revenue $bn, Market Share, Market Position, Primary Sector, HQ, Ticker, Website)
Table 4.22 Saint Gobain Vetrotex Overview 2018 (Total Revenue $bn, Market Share, Market Position, Sector, HQ, Ticker, Website)
Table 4.23 SGL Group Overview 2018 (Total Revenue $bn, Composites Revenue $bn, Market Share, Market Position, Primary Sector, HQ, Ticker, Website)
Table 4.24 Saertex Glass Overview 2018 (Total Revenue $bn, Composites Revenue $bn, Market Share, Market Position, Primary Sector, HQ, Ticker, Website)
Table 4.25 Taishan Fibreglass Overview 2018 (Total Revenue $bn, Composites Revenue $bn, Market Share, Market Position, Primary Sector, HQ, Ticker, Website)
Table 4.26 Taiwan Glass Industry Corporation Overview 2018 (Total Revenue $bn, Composites Revenue $bn, Market Share, Market Position, Primary Sector, HQ, Ticker, Website)
Table 4.27 Teijin Overview 2018 (Total Revenue $bn, Composites Revenue $bn, Market Share, Market Position, Primary Sector, HQ, Ticker, Website)
Table 4.28 TenCate Overview 2018 (Total Revenue $bn, Market Share, Market Position, Primary Sector, HQ, Ticker, Website)
Table 4.29 Toray Overview 2018 (Total Revenue $bn, Composites Revenue $bn, Market Share, Market Position, Primary Sector, HQ, Ticker, Website)
Table 4.30 Weyerhaeuser Company Overview 2018 (Total Revenue $bn, Composites Revenue $bn, Market Share, Market Position, Primary Sector, HQ, Ticker, Website)
Table 4.31 Zoltek Overview 2018 (Total Revenue $mn, Market Share, Market Position, Primary Sector, HQ, Ticker, Website)
Table 5.1 SWOT Analysis of the Composites Market
AAT Composites (Pty) Ltd.
Accudyne Systems Inc
Advanced Glassfibre Yarns
Aernnova
AGC AeroComposites Yeovil
Airbus
Aircelle
AKSA
Alabuga Fibers LLC
Amber Composites (UK)
Arkema
Asahi Fibreglass Company
BGF
Boeing
Braj Binani Group
Brookhouse
China Fibreglass Company
China National Building Material Company
Chomarat Group
Chongqing Polycomp International Corporation
Chongquing Polycomp International Company
Composite Products, Inc. (CPI)
Composites Horizons LLC
Continental Structural Plastics Inc.
Cray Valley
Creative Composites Ltd.
Crosby composites
Cytec Industries (Solvay S.A.)
DAHER
Dalian Xingke Carbon Fibers Co. Ltd
DowAksa
Dowty Propellers
DuPont
EPO GmbH
Exports Ltd
Fiberex Glass Corporation
FibreTEK Insulation West
Fisipe Fibras Sintéticas de Portugal S.A
Formaplex
Formax
Formosa Plastic
GKN
GMS Composites
Guardian Fibre Glass
Gurit
Hanwha Azdel
Heatcon Composite Systems
Hexcel Corporation
Huntsman Corporation
Hyosung Advanced Materials Corp.
Icon Polymer Group Ltd
IDI Composite International
Innegra Technologies
JiangsuHengshen Fibers Materials Co. Ltd.
Johns Manville
Johnson Controls
KCC Corporation
Kemrock Industries
Kolon Industries
Koninklijke Ten Cate B.V.
Kurarey
Magna International Inc.
Mahindra Cie Automotive Ltd.
Mitsubishi Chemical Corporation
Mitsubishi Chemical Holdings
Momentive Performance Materials, Inc.
Mubea Carbo Tech GmbH
Nippon Sheet Glass Co. Ltd.
Nitto Boseki
NP Aerospace
Owens Corning
Plasan Carbon Composite
PPG Industries
Quantum Composites
Quickstep Holdings Ltd
Reinforced Plastic Industries
RIBA Composites Srl
Rock West Composites
Russian newcomers Argon Ltd. (CJSC Holding Company Composite)
SABIC (Saudi Arabia Basic Industries Corporation)
Saertex Glass
Saint Gobain
Scott Bader
SGL Group
Sigmatex
Strata Manufacturing PJSC
Taekwang Industrial Co Ltd
Taishan Fibreglass SA
Taiwan Glass Industry Corporation
Teijin
TenCate N.V.
The Gill Corporation
TK Industries
Toray
TPI Composites
Triumph Group Inc
UFP Technologies, Inc.
Weihai Tuozhan Fibers Co Ltd.
Weyerhaeuser Company
Zhongfu Shenying Carbon Fibers Co. Ltd.
Zoltek Corporation
List of Other Organisations Mentioned in this Report
Government of France
World Wind Energy Association (WWEA)

