• Do you need definitive performance based logistics market data?
• Succinct performance based logistics market analysis?
• Technological insight?
• Clear competitor analysis?
• Actionable business recommendations?
Read on to discover how this definitive report can transform your own research and save you time.
The recent developments in performance based logistics and its application within the defence industry has led Visiongain to publish this timely report. The $1.98 billion performance based logistics market is expected to flourish over the next few years due to rising demand for on-demand weapon systems and low costs associated with performance based contracting will drive growth in different submarkets. If you want to be part of this growing industry, then read on to discover how you can maximise your investment potential.
Report Highlights
• More Than 190 Tables, Charts, And Graphs
• Analysis Of Key Players In The Performance Based Logistics Market
• Boeing
• Collins Aerospace
• Dayton Aerospace
• Dayton T. Brown, Inc.
• General Dynamics
• IFS AB
• ISO Group
• L3 Technologies
• Lockheed Martin Corporation
• Northrop Grumman
• Textron Inc.
• Thales
• Global Performance Based Logistics Market Outlook And Analysis From 2019-2029
• 78 Major Performance Based Logistics Contracts And Projects
• Performance Based Logistics Component Forecasts And Analysis From 2019-2029
• Army Performance Based Logistics Forecast 2019-2029
• Navy Performance Based Logistics Forecast 2019-2029
• Airforce Performance Based Logistics Forecast 2019-2029
• Performance Based Logistics Platform Forecasts And Analysis From 2019-2029
• Aircraft And Drones Performance Based Logistics Forecast 2019-2029
• Land Vehicles Performance Based Logistics Forecast 2019-2029
• Electronics And Communications Performance Based Logistics Forecast 2019-2029
• Missiles And Space Systems Performance Based Logistics Forecast 2019-2029
• Weapons And Ammunitions Performance Based Logistics Forecast 2019-2029
• Facilities And Construction Performance Based Logistics Forecast 2019-2029
• Other Products And Services Performance Based Logistics Forecast 2019-2029
Regional Performance Based Logistics Market Forecasts From 2019-2029
• US Performance Based Logistics Market Forecast 2019-2029
• UK Performance Based Logistics Market Forecast 2019-2029
• Saudi Arabia Performance Based Logistics Market Forecast 2019-2029
• Japan Performance Based Logistics Market Forecast 2019-2029
• China Performance Based Logistics Market Forecast 2019-2029
• Italy Performance Based Logistics Market Forecast 2019-2029
• Israel Performance Based Logistics Market Forecast 2019-2029
• India Performance Based Logistics Market Forecast 2019-2029
• Germany Performance Based Logistics Market Forecast 2019-2029
• France Performance Based Logistics Market Forecast 2019-2029
• Australia Performance Based Logistics Market Forecast 2019-2029
• Rest of the World Performance Based Logistics Market Forecast 2019-2029
Key Questions Answered
• What does the future hold for the performance based logistics industry?
• Where should you target your business strategy?
• Which applications should you focus upon?
• Which disruptive technologies should you invest in?
• Which companies should you form strategic alliances with?
• Which company is likely to succeed and why?
• What business models should you adopt?
• What industry trends should you be aware of?
Target Audience
• Performance based logistics companies
• Defence contractors
• Tier 1 & Tier 2 suppliers
• Military platform manufacturers
• Weapons specialists
• Electronics companies
• Technologists
• R&D staff
• Consultants
• Analysts
• CEO’s
• CIO’s
• COO’s
• Business development managers
• Investors
• Governments
• Agencies
• Industry organizations
• Banks
Visiongain is a trading partner with the US Federal Government
CCR Ref number: KD4R6
Do you have any custom requirements we can help you with? Any need for specific country, geo region, market segment or specific company information? Contact us today, we can discuss your needs and see how we can help: sara.peerun@visiongain.com
1. Report Overview
1.1 Performance Based Logistics Market Overview
1.2 Why You Should Read This Report
1.3 How This Report Delivers
1.4 Key Questions Answered by this Analytical Report include:
1.5 Who is This Report For?
1.6 Methodology
1.6.1 Secondary Research
1.6.2 Market Evaluation & Forecasting Methodology
1.7 Frequently Asked Questions (FAQ)
1.8 Associated Visiongain Reports
1.9 About Visiongain
2. Introduction to the Performance Based Logistics Market
2.1 Performance Based Logistics Market Structure
2.2 Performance Based Logistics Market Definition
2.3 Performance Based Logistics Platform Submarkets Definitions
2.3.1 Aircraft and Drones
2.3.2 Electronics and Communications
2.3.3 Land Vehicles
2.3.4 Missile and Space Systems
2.3.5 Weapons and Ammunitions
2.3.6 Facilities and Construction
2.3.7 Other Products and Services
2.4 Performance Based Logistics Component Submarket
2.4.1 Army
2.4.2 Airforce
2.4.3 Navy
3. Performance Based Logistics Market 2019-2029
3.1 Performance Based Logistics Market Forecast 2019-2029
3.2 Performance Based Logistics Drivers & Restraints
3.2.1 Performance Based Logistics Market Drivers 2019
3.2.1.1 Rising Demand For On-Demand Weapon System
3.2.1.2 Low Cost Associated With Performance Based Contracting
3.2.1.3 Benefits For Both Supplier And Customer
3.2.2 Performance Based Logistics Market Restraints 2019
3.2.2.1 Improper Monitor And Control May Result In Added Cost
3.2.2.2 Performance Based Logistics (PBL) Is A Complex Process
4. Performance Based Logistics Platform Submarket Forecast 2019-2029
4.1 Aircraft and Drones Submarket PBL Analysis
4.2 Electronics and Communication Submarket PBL Analysis
4.3 Missile and Space Systems Submarket PBL Analysis
4.4 Weapons and Ammunitions Submarket PBL Analysis
4.5 Facilities and Construction Submarket PBL Analysis
5. Performance Based Logistics Component Forecast 2019-2029
5.1 Performance Based Logistics Army Submarket by Country 2019-2029
5.2 Performance Based Logistics Airforce Submarket by Country 2019-2029
5.3 Performance Based Logistics Navy Submarket by Country 2019-2029
6. Performance Based Logistics Market Forecast by Country 2019-2029
6.1 U.S. Performance Based Logistics Market Forecast
6.1.1 U.S. Performance Based Logistics Market Forecast 2019-2029
6.1.2 U.S. Performance Based Logistics Market Forecast by Platform 2019-2029
6.2 U.K. Performance Based Logistics Market Forecast
6.2.1 U.K. Performance Based Logistics Market Forecast 2019-2029
6.2.2 U.K. Performance Based Logistics Market Forecast by Component 2019-2029
6.3 Saudi Arabia Performance Based Logistics Market Forecast
6.3.1 Saudi Arabia Performance Based Logistics Market Forecast 2019-2029
6.3.2 Saudi Arabia Performance Based Logistics Market Forecast by Component 2019-2029
6.4 Japan Performance Based Logistics Market Forecast
6.4.1 Japan Performance Based Logistics Market Sales Forecast 2019-2029
6.4.2 Japan Performance Based Logistics Market Forecast by Component 2019-2029
6.5 China Performance Based Logistics Market Forecast
6.5.1 China Performance Based Logistics Market Sales Forecast 2019-2029
6.5.2 China Performance Based Logistics Market Forecast by Component 2019-2029
6.6 Italy Performance Based Logistics Market Forecast
6.6.1 Italy Performance Based Logistics Market Sales Forecast 2019-2029
6.6.2 Italy Performance Based Logistics Market Forecast by Component 2019-2029
6.7 Israel Performance Based Logistics Market Forecast
6.7.1 Israel Performance Based Logistics Market Forecast 2019-2029
6.7.2 Israel Performance Based Logistics Market Forecast by Component 2019-2029
6.8 India Performance Based Logistics Market Forecast
6.8.1 India Performance Based Logistics Market Forecast 2019-2029
6.8.2 India Performance Based Logistics South Korea Market Forecast by Component 2019-2029
6.9 Germany Performance Based Logistics Market Forecast
6.9.1 Germany Performance Based Logistics Market Sales Forecast 2019-2029
6.9.2 Germany Performance Based Logistics Market Forecast by Platform 2019-2029
6.10 France Performance Based Logistics Market Forecast
6.10.1 France Performance Based Logistics Market Forecast 2019-2029
6.10.2 France Performance Based Logistics Market Forecast by Component 2019-2029
6.11 Australia Performance Based Logistics Market Forecast
6.11.1 Australia Performance Based Logistics Market Forecast 2019-2029
6.11.2 Australia Performance Based Logistics Market Forecast by Component 2019-2029
6.12 RoW Performance Based Logistics Market Forecast
6.12.1 RoW Performance Based Logistics Market Forecast 2019-2029
6.12.2 RoW Performance Based Logistics Market Forecast by Component 2019-2029
7. Leading 15 Performance Based Logistics Companies
7.1 Leading 15 Performance Based Logistics Companies 2018
7.2 The Boeing Company
7.2.1 Introduction
7.2.2 Boeing Global Services
7.2.3 The Boeing Co. PBL Selected Recent Contracts 2012-2019
7.2.4 Boeing Total Company Sales 2014-2018
7.2.5 Boeing Sales by Segment of Business 2014-2018
7.2.6 Boeing Net Income / Loss 2014-2018
7.2.7 Boeing Sales by Regional Segment of Business 2014-2018
7.2.8 Boeing Analysis
7.2.8.1 Boeing SWOT Analysis
7.2.8.2 Boeing Future Outlook
7.3 Collins Aerospace
7.3.1 Introduction
7.3.2 Collins Aerospace FlexForce Performance Based Logistics (PBL)
7.3.3 Collins Aerospace PBL Selected Recent Contracts 2016-2018
7.3.4 Collins Aerospace Total Company Sales 2016-2018
7.3.5 Collins Aerospace Sales by Segment of Business 2018
7.3.6 Collins Aerospace Operating Profit 2016-2018
7.3.7 Collins Aerospace Sales by Regional Segment of Business 2018
7.3.8 Collins Aerospace Analysis
7.3.8.1 Collins Aerospace SWOT Analysis
7.3.8.2 Collins Aerospace Future Outlook
7.4 Dayton Aerospace
7.4.1 Introduction
7.4.2 Dayton Aerospace Performance Based Logistics (PBL)
7.5 Dayton T. Brown, Inc.
7.5.1 Introduction
7.5.2 Dayton T. Brown, Inc. Logistics Services
7.5.3 Dayton T. Brown, Inc. PBL Selected Recent Contracts 2017-2019
7.6 General Dynamics Corporation
7.6.1 Introduction
7.6.2 General Dynamics Information Technology
7.6.3 General Dynamics Corporation PBL Selected Recent Contracts 2016-2019
7.6.4 General Dynamics Corporation Total Company Sales 2014-2018
7.6.5 General Dynamics Corporation Sales by Segment of Business 2014-2018
7.6.6 General Dynamics Corporation Net Income / Loss 2014-2018
7.6.7 General Dynamics Corporation Sales by Regional Segment of Business 2014-2018
7.6.8 General Dynamics Corporation Analysis
7.6.8.1 SWOT Analysis
7.6.8.2 General Dynamics Corporation Future Outlook
7.7 IFS AB
7.7.1 Introduction
7.7.2 IFS AB PBL Selected Recent Contracts 2018
7.7.3 IFS AB Total Company Sales 2014-2018
7.7.4 IFS AB Sales by Segment of Business 2017-2018
7.7.5 IFS AB Analysis
7.7.5.1 SWOT Analysis
7.7.5.2 IFS AB Future Outlook
7.8 ISO Group
7.8.1 Introduction
7.8.2 ISO Group Performance Based Logistics
7.8.3 ISO Group PBL Selected Recent Contracts 2013-2015
7.9 L3 Technologies, Inc.
7.9.1 Introduction
7.9.2 L3 Technologies, Inc. PBL Selected Recent Contracts 2012-2019
7.9.3 L3 Technologies, Inc. Total Company Sales 2014-2018
7.9.4 L3 Technologies, Inc. Net Income 2014-2018
7.9.5 L3 Technologies, Inc. Sales by Segment of Business 2014-2018
7.9.6 L3 Technologies, Inc. Sales by Regional Segment of Business 2016-2018
7.9.7 L3 Technologies, Inc. Future Outlook
7.10 Lockheed Martin Corporation
7.10.1 Introduction
7.10.2 Lockheed Martin Corporation PBL Selected Recent Contracts 2016-2019
7.10.3 Lockheed Martin Total Company Sales 2014-2018
7.10.4 Lockheed Martin Net Income 2014-2018
7.10.5 Lockheed Martin Sales by Segment of Business 2014-2018
7.10.6 Lockheed Martin Sales by Geographical Location 2014-2018
7.10.7 Lockheed Martin Corporation Analysis
7.10.7.1 SWOT Analysis
7.10.7.2 Lockheed Martin Future Outlook
7.11 Northrop Grumman Corporation
7.11.1 Introduction
7.11.2 Northrop Grumman Selected Recent Contracts 2017-2019
7.11.3 Northrop Grumman Total Company Sales 2014-2018
7.11.4 Northrop Grumman Net Income 2014-2018
7.11.5 Northrop Grumman Sales by Segment of Business 2014-2018
7.11.6 Northrop Grumman Sales by Regional Business 2015-2018
7.11.7 Northrop Grumman Analysis
7.11.7.1 Northrop Grumman SWOT Analysis
7.11.7.2 Northrop Grumman Future Outlook
7.12 Textron Inc.
7.12.1 Introduction
7.12.2 Textron Inc. PBL Selected Recent Contracts / Projects / Programmes 2013-2017
7.12.3 Textron Inc. Total Company Sales 2014-2018
7.12.4 Textron Inc. Net Income 2014-2018
7.12.5 Textron Inc. Sales by Segment of Business 2014-2018
7.12.6 Textron Inc. Sales by Regional Segment of Business 2014-2018 (US$m, Total Company Sales AGR %)
7.13 Thales SA
7.13.1 Introduction
7.13.2 Thales Group PBL Selected Recent Contracts 2015-2018
7.13.3 Thales Group Total Company Sales 2014-2018
7.13.4 Thales Group Sales by Segment of Business 2014-2018
7.13.5 Thales Group Net Income / Loss 2014-2018
7.13.6 Thales Group Sales by Geographical Regional 2014-2018
7.13.7 Thales Group Analysis
7.13.7.1 Thales Group SWOT Analysis
7.13.7.2 Thales Group Future Outlook
8. Conclusions and Recommendations
9. Glossary
List of Tables
Table 3.1 Performance Based Logistics Market Forecast 2019-2029 (US$m, AGR %, CAGR %, Cumulative)
Table 3.2 Performance Based Logistics Market Drivers & Restraints 2019
Table 4.1 Performance Based Logistics Platform Submarket Forecast 2019-2029 (US$m, AGR %, Cumulative, CAGR%)
Table 5.1 Performance Based Logistics Component Submarket Forecast 2019-2029 (US$m, AGR %, CAGR %, Cumulative)
Table 5.2 Performance Based Logistics Army Submarket Forecast by Country 2019-2029 (US$m, AGR %, CAGR %, Cumulative)
Table 5.3 Performance Based Logistics Airforce Submarket Forecast By Country 2019-2029 (US$m, AGR %, CAGR %, Cumulative)
Table 5.4 Performance Based Logistics Navy Submarket Forecast By Country 2019-2029 (US$m, AGR %, CAGR %, Cumulative)
Table 6.1 Performance Based Logistics Market by Country Forecast 2019-2029 (US$m, AGR %, CAGR %, Cumulative)
Table 6.2 U.S. Performance Based Logistics Market Forecast 2019-2029 (US$m, AGR %, CAGR %, Cumulative)
Table 6.3 U.S. Performance Based Logistics Market Forecast by Component 2019-2029 (US$m, Cumulative)
Table 6.4 U.K. Performance Based Logistics Market Forecast 2019-2029 (US$m, AGR %, CAGR %, Cumulative)
Table 6.5 U.K. Performance Based Logistics Market Forecast by Component 2019-2029 (US$m, Cumulative)
Table 6.6 Saudi Arabia Performance Based Logistics Market Forecast 2019-2029 (US$m, AGR %, CAGR %, Cumulative)
Table 6.7 Saudi Arabia Performance Based Logistics Market Forecast by Component 2019-2029 (US$m, Cumulative)
Table 6.8 Japan Performance Based Logistics Market Sales Forecast 2019-2029 (US$m, AGR %, CAGR %, Cumulative)
Table 6.9 Japan Performance Based Logistics Market Forecast by Component 2019-2029 (US$m, Cumulative)
Table 6.10 China Performance Based Logistics Market Sales Forecast 2019-2029 (US$m, AGR %, CAGR %, Cumulative)
Table 6.11 China Performance Based Logistics Market Forecast by Component 2019-2029 (US$m, Cumulative)
Table 6.12 Italy Performance Based Logistics Market Sales Forecast 2019-2029 (US$m, AGR %, CAGR %, Cumulative)
Table 6.13 Italy Performance Based Logistics Market Forecast by Component 2019-2029 (US$m, Cumulative)
Table 6.14 Israel Performance Based Logistics Market Forecast 2019-2029 (US$m, AGR %, CAGR %, Cumulative)
Table 6.15 Israel Performance Based Logistics Market Forecast by Component 2019-2029 (US$m, Cumulative)
Table 6.16 India Performance Based Logistics Market Forecast 2019-2029 (US$m, AGR %, CAGR %, Cumulative)
Table 6.17 India Performance Based Logistics Market Forecast by Component 2019-2029 (US$m, Cumulative)
Table 6.18 Germany Performance Based Logistics Market Sales Forecast 2019-2029 (US$m, AGR %, CAGR %, Cumulative)
Table 6.19 Germany Performance Based Logistics Market Forecast by Component 2019-2029 (US$m, Cumulative)
Table 6.20 France Performance Based Logistics Market Forecast 2019-2029 (US$m, AGR %, CAGR %, Cumulative)
Table 6.21 France Performance Based Logistics Market Forecast by Component 2019-2029 (US$m, Cumulative)
Table 6.22 Australia Performance Based Logistics Market Forecast 2019-2029 (US$m, AGR %, CAGR %, Cumulative)
Table 6.23 Australia Performance Based Logistics Market Forecast by Component 2019-2029 (US$m, Cumulative)
Table 6.24 RoW Performance Based Logistics Market Forecast 2019-2029 (US$m, AGR %, CAGR %, Cumulative)
Table 6.25 RoW Performance Based Logistics Market Forecast by Component 2019-2029 (US$m, Cumulative)
Table 7.1 Leading 15 Performance Based Logistics Companies Listed Alphabetically (Company, FY 2017/2018 Total Company Sales US $m*Latest, HQ)
Table 7.2 The Boeing Company Profile 2018 (CEO, Total Company Sales US$m, Net Income US$m, HQ, Founded, No. of Employees, Ticker, Website)
Table 7.3 Selected Recent Boeing Co. PBL Contracts 2012-2019 (Date, Country, Contractor, Value US$m, Product, Details)
Table 7.4 Boeing Total Company Sales 2014-2018 (US$m, AGR %)
Table 7.5 Boeing Sales by Segment of Business 2014-2018 (US$m, AGR %)
Table 7.6 Boeing Net Income / Loss 2014-2018 (US$m)
Table 7.7 Boeing Sales by Regional Segment of Business 2014-2018 (US$m, AGR %)
Table 7.8 Boeing SWOT Analysis
Table 7.9 Collins Aerospace Profile 2018 (CEO, Total Company Sales US$m, Operating Profit US$m, HQ, Founded, No. of Employees FY2017, Website)
Table 7.10 Selected Recent Collins Aerospace PBL Contracts 2016-2018 (Date, Country, Details)
Table 7.11 Collins Aerospace Total Company Sales 2016-2018 (US$m, AGR %)
Table 7.12 Collins Aerospace Sales by Regional Segment of Business 2018 (US$m)
Table 7.13 Collins Aerospace Operating Profit 2016-2018 (US$m)
Table 7.14 Collins Aerospace Sales by Regional Segment of Business 2018 (US$m)
Table 7.15 Collins Aerospace SWOT Analysis
Table 7.16 Dayton Aerospace Profile 2018 (CEO, HQ, Founded, No. of Employees, Website)
Table 7.17 Dayton T. Brown, Inc. Profile 2018 (CEO, HQ, Founded, No. of Employees, Website)
Table 7.18 Selected Recent Dayton T. Brown, Inc. PBL Contracts 2017-2019 (Date, Country, Details)
Table 7.19 General Dynamics Corporation Profile 2018 (CEO, Total Company Sales US$m, Net Income US$m, HQ, Founded, No. of Employees, Ticker, Website)
Table 7.20 General Dynamics Corporation PBL Selected Recent Contracts 2016-2019 (Date, Country, Details)
Table 7.19 General Dynamics Corporation Profile 2018 (CEO, Total Company Sales US$m, Net Income US$m, HQ, Founded, No. of Employees, Ticker, Website)
Table 7.20 General Dynamics Corporation PBL Selected Recent Contracts 2016-2019 (Date, Country, Details)
Table 7.21 General Dynamics Corporation, Total Company Sales 2014-2018 (US $m, AGR %)
Table 7.22 General Dynamics Corporation Sales by Segment of Business 2014-2018 (US$m, AGR %)
Table 7.23 General Dynamics Corporation Net Income / Loss 2014-2018 (US$m)
Table 7.24 General Dynamics Corporation Sales by Regional Segment of Business 2014-2018 (US$m, AGR %)
Table 7.25 General Dynamics Corporation SWOT Analysis
Table 7.26 IFS AB Profile 2018 (CEO, Total Company Sales US$m, HQ,
Table 7.27 IFS AB PBL Selected Recent Contracts 2018 (Date, Country, Details)
Table 7.28 IFS AB Total Company Sales 2014-2018 (US $m, AGR %)
Table 7.29 IFS AB Sales by Segment of Business 2017-2018 (US$m)
Table 7.30 IFS AB SWOT Analysis
Table 7.31 ISO Group Profile 2018 (CEO, HQ, Founded, No. of Employees, Website)
Table 7.32 ISO Group PBL Selected Recent Contracts 2013-2015 (Date, Country, Details)
Table 7.33 L3 Technologies, Inc. Profile 2018 (CEO, Total Company Sales US$m, Net Income US$m, HQ, Founded, No. of Employees, Ticker, Website)
Table 7.34 L3 Technologies, Inc. PBL Selected Recent Contracts 2012-2019 (Date, Country, Product, Details)
Table 7.35 L3 Technologies, Inc. Total Company Sales 2014-2018 (US$m, AGR%)
Table 7.36 L3 Technologies, Inc. Net Income 2014-2018 (US$m, AGR%)
Table 7.37 L3 Technologies, Inc. Sales by Segment of Business 2014-2018 (US$m)
Table 7.38 L3 Technologies, Inc., Sales by Regional Segment of Business 2016-2018 (US$m, AGR %)
Table 7.39 Lockheed Martin Corporation Profile 2018 (CEO, Total Company Sales US$m, Net Income US$m, HQ, Founded, No. of Employees, Ticker, Website)
Table 7.40 Lockheed Martin Corporation PBL Selected Recent Contracts 2016-2019 (Date, Country, Details)
Table 7.41 Lockheed Martin Total Company Sales 2014-2018 (US$m, AGR%)
Table 7.42 Lockheed Martin Net Income 2014-2018 (US$m, AGR%)
Table 7.43 Lockheed Martin Sales by Segment of Business 2014-2018 (US$m, AGR%)
Table 7.44 Lockheed Martin Sales by Geographical Location 2014-2018 (US$m, AGR%)
Table 7.45 Lockheed Martin SWOT Analysis
Table 7.46 Northrop Grumman Profile 2018 (CEO, Total Company Sales US$m, Net Income US$m, HQ, Founded, Ticker, Website)
Table 7.47 Northrop Grumman Selected Recent Contracts 2017-2019 (Date, Country, Details)
Table 7.48 Northrop Grumman Total Company Sales 2014-2018 (US$m, AGR%)
Table 7.49 Northrop Grumman Net Earnings 2014-2018 (US$m, AGR%)
Table 7.50 Northrop Grumman Sales by Segment of Business 2014-2018 (US$m, AGR%)
Table 7.51 Northrop Grumman Sales by Geographical Location 2014-2018 (US$m, AGR %)
Table 7.52 Northrop Grumman SWOT Analysis
Table 7.53 Textron Inc. Group Profile 2018 (CEO, Total Company Sales US$m, Net Income US$m, HQ, Founded, No. of Employees, IR Contact, Ticker, Website)
Table 7.54 Textron Inc. Selected Recent PBL Contracts 2013-2017 (Date, Country, Details)
Table 7.55 Textron Inc. Total Company Sales 2014-2018 (US$m, AGR%)
Table 7.56 Textron Inc. Net Earnings 2014-2018 (US$m, AGR%)
Table 7.57 Textron Inc. Sales by Segment of Business 2014-2018 ($m)
Table 7.58 Textron Inc., Sales by Regional Segment of Business 2014-2018 (US$m, AGR %)
Table 7.59 Thales SA. Profile 2018 (CEO, Total Company Sales US$m, Net Income US$m, HQ, Founded, No. of Employees, Ticker, Website)
Table 7.60 Thales Group PBL Selected Recent Contracts 2015-2018 (Date, Country, Details)
Table 7.61 Thales Group Total Company Sales 2014-2018 (US$m, AGR %)
Table 7.62 Thales Group Sales by Segment of Business 2014-2018 (US$m, AGR %)
Table 7.63 Thales Group Net Income / Loss 2014-2018 (US$m)
Table 7.64 Thales Group Sales by Geographical Regional 2014-2018 (US$m, AGR %)
Table 7.65 Thales Group SWOT Analysis
List of Figures
Figure 2.1 Global Performance Based Logistics Market Segmentation Overview
Figure 3.1 Performance Based Logistics Forecast 2019-2029 (US$m, Global AGR %)
Figure 4.1 Performance Based Logistics Platform Submarket AGR Forecast 2019-2029 (AGR %)
Figure 4.2 Performance Based Logistics Platform Submarket Forecast 2019-2029 (US$m, Global AGR %)
Figure 4.3 Performance Based Logistics Platform Submarket Shares Forecast 2019 (% Share)
Figure 4.4 Performance Based Logistics Platform Submarket Shares Forecast 2024 (% Share)
Figure 4.5 Performance Based Logistics Platform Submarket Shares Forecast 2029 (% Share)
Figure 5.1 Performance Based Logistics Component Submarket AGR Forecast 2019-2029 (AGR %)
Figure 5.2 Performance Based Logistics Component Submarket Forecast 2019-2029 (US$m, Global AGR %)
Figure 5.3 Performance Based Logistics Offering Submarket Shares 2019 (% Share)
Figure 5.4 Performance Based Logistics Offering Submarket Shares 2024 (% Share)
Figure 5.5 Performance Based Logistics Offering Submarket Shares 2029 (% Share)
Figure 5.6 Performance Based Logistics Army Submarket AGR Forecast 2019-2029 (AGR %)
Figure 5.7 Performance Based Logistics Army Submarket Forecast by Country 2019-2029 (US$m)
Figure 5.8 Performance Based Logistics Army Submarket Shares Forecast by Country 2019 (% Share)
Figure 5.9 Performance Based Logistics Airforce Submarket AGR Forecast 2019-2029 (AGR %)
Figure 5.10 Performance Based Logistics Airforce Submarket Forecast by Country 2019-2029 (US$m)
Figure 5.11 Performance Based Logistics Airforce Submarket Shares Forecast by Country 2019 (% Share)
Figure 5.12 Performance Based Logistics Navy Submarket AGR Forecast 2019-2029 (AGR %)
Figure 5.13 Performance Based Logistics Navy Submarket Forecast by Country 2019-2029 (US$m)
Figure 5.14 Performance Based Logistics Navy Submarket Shares Forecast by Country 2019 (% Share)
Figure 6.1 Performance Based Logistics Market by Country AGR Forecast 2019-2029 (AGR %)
Figure 6.2 Performance Based Logistics Market by Country Forecast 2019-2029 (US$m)
Figure 6.3 Performance Based Logistics Market by Country Shares 2019 (% Share)
Figure 6.4 Performance Based Logistics Market by Country Shares 2024 (% Share)
Figure 6.5 Performance Based Logistics Market by Country Shares 2029 (% Share)
Figure 6.6 U.S. Performance Based Logistics Market Forecast 2019-2029 (US$m, AGR (%)
Figure 6.7 U.S. Performance Based Logistics Market Forecast by Component 2019-2029 (US$m)
Figure 6.8 U.K. Performance Based Logistics Market Forecast 2019-2029 (US$m, AGR (%)
Figure 6.9 U.K. Performance Based Logistics Market Forecast by Component 2019-2029 (US$m)
Figure 6.10 Saudi Arabia Performance Based Logistics Market Sales Forecast 2019-2029 (US$m, AGR (%)
Figure 6.11 Saudi Arabia Performance Based Logistics Market Forecast by Component 2019-2029 (US$m)
Figure 6.12 Japan Performance Based Logistics Market Sales Forecast 2019-2029 (US$m, AGR (%)
Figure 6.13 Japan Performance Based Logistics Market Forecast by Component 2019-2029 (US$m)
Figure 6.14 China Performance Based Logistics Market Sales Forecast 2019-2029 (US$m, AGR (%)
Figure 6.15 China Performance Based Logistics Market Forecast by Component 2019-2029 (US$m)
Figure 6.16 Italy Performance Based Logistics Market Sales Forecast 2019-2029 (US$m, AGR (%)
Figure 6.17 Italy Performance Based Logistics Market Forecast by Component 2019-2029 (US$m)
Figure 6.18 Israel Performance Based Logistics Market Sales Forecast 2019-2029 (US$m, AGR (%)
Figure 6.19 Israel Performance Based Logistics Market Forecast by Component 2019-2029 (US$m)
Figure 6.20 India Performance Based Logistics Market Forecast 2019-2029 (US$m, AGR (%)
Figure 6.21 India Performance Based Logistics Market Forecast by Component 2019-2029 (US$m)
Figure 6.22 Germany Performance Based Logistics Market Sales Forecast 2019-2029 (US$m, AGR (%)
Figure 6.23 Germany Performance Based Logistics Market Forecast by Component 2019-2029 (US$m)
Figure 6.24 France Performance Based Logistics Market Forecast 2019-2029 (US$m, AGR (%)
Figure 6.25 France Performance Based Logistics Market Forecast by Component 2019-2029 (US$m)
Figure 6.26 Australia Performance Based Logistics Market Forecast 2019-2029 (US$m, AGR (%)
Figure 6.27 Australia Performance Based Logistics Market Forecast by Component 2019-2029 (US$m)
Figure 6.28 RoW Performance Based Logistics Market Forecast 2019-2029 (US$m, AGR (%)
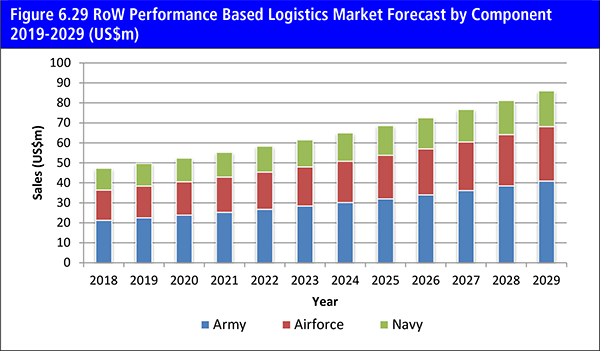
Figure 6.29 RoW Performance Based Logistics Market Forecast by Component 2019-2029 (US$m)
Figure 7.1 Boeing Total Company Sales 2014-2018 (US$m, AGR %)
Figure 7.2 Boeing Sales by Segment of Business 2014-2018 (US$m)
Figure 7.3 Boeing Sales AGR by Segment of Business 2015-2018 (AGR %)
Figure 7.4 Boeing Net Income / Loss 2014-2018 (US$m)
Figure 7.5 Boeing Sales by Regional Segment of Business 2014-2018 (US$m)
Figure 7.6 Boeing Sales AGR by Regional Segment of Business 2015-2018 (AGR %)
Figure 7.7 Collins Aerospace Total Company Sales 2016-2018 (US$m, AGR %)
Figure 7.8 Collins Aerospace Sales by Segment of Business 2018 (Share)
Figure 7.9 Collins Aerospace Operating Profit 2016-2018 (US$m)
Figure 7.10 Collins Aerospace Sales by Regional Segment of Business 2018 (Share)
Figure 7.11 General Dynamics Corporation Total Company Sales 2014-2018 (US$m, AGR %)
Figure 7.12 General Dynamics Corporation Sales by Segment of Business 2014-2018 (US$m, Total Company Sales AGR %)
Figure 7.13 General Dynamics Corporation Sales AGR by Segment of Business 2015-2018 (AGR %)
Figure 7.14 General Dynamics Corporation Net Income / Loss 2014-2018 (US$m)
Figure 7.15 General Dynamics Corporation Sales by Regional Segment of Business 2014-2018 (US$m, Total Company Sales AGR %)
Figure 7.16 General Dynamics Corporation Sales AGR by Regional Segment of Business 2015-2018 (AGR %)
Founded, No. of Employees, Website)
Figure 7.17 IFS AB Total Company Sales 2014-2018 (US$m, AGR %)
Figure 7.18 IFS AB Sales by Segment of Business 2017-2018 (US$m)
Figure 7.19 L3 Technologies, Inc. Total Company Sales 2014-2018 (US$m, AGR%)
Figure 7.20 L3 Technologies, Inc. Net Income 2014-2018 (US$m, AGR%)
Figure 7.21 L3 Technologies, Inc. Sales by Segment of Business 2014-2018 (US$m)
Figure 7.22 L3 Technologies, Inc. Sales by Regional Segment of Business 2016-2018 (US$m)
Figure 7.23 Lockheed Martin Total Company Sales 2014-2018 (US$m, AGR%)
Figure 7.24 Lockheed Martin Net Income 2014-2018 (US$m, AGR%)
Figure 7.25 Lockheed Martin Sales by Segment of Business 2014-2018 (US$m, Total Company Sales AGR%)
Figure 7.26 Lockheed Martin AGR by Segment of Business 2015-2018 (AGR%)
Figure 7.27 Lockheed Martin Sales by Geographical Location 2014-2018 (US$m, Total Company Sales AGR%)
Figure 7.28 Northrop Grumman Total Company Sales 2014-2018 (US$m, AGR%)
Figure 7.29 Northrop Grumman Net Income 2014-2018 (US$m, AGR%)
Figure 7.30 Northrop Grumman Sales by Segment of Business 2014-2018 (US$m, Total Company Sales AGR%)
Figure 7.31 Northrop Grumman AGR by Segment of Business 2015-2018 (AGR%)
Figure 7.32 Northrop Grumman Sales AGR by Geographical Location 2015-2018 (AGR %)
Figure 7.33 Northrop Grumman Sales by Geographical Location 2014-2018 (US$m, Total Company Sales AGR %)
Figure 7.34 Textron Inc. Total Company Sales 2014-2018 (US$m, AGR%)
Figure 7.35 Textron Inc. Net Earnings 2014-2018 (US$m, AGR%)
Figure 7.36 Textron Inc. Sales by Segment of Business 2014-2018 (US$m, Total Company Sales AGR%)
Figure 7.37 Textron Inc. Sales AGR by Segment of Business 2015-2018 (AGR%)
Figure 7.38 Textron Inc. Sales by Regional Segment of Business 2014-2018 (US$m, Total Company Sales AGR %)
Figure 7.39 Textron Inc. Sales AGR by Regional Segment of Business 2015-2018 (AGR %)
Figure 7.40 Thales Group Total Company Sales 2014-2018 (US$m, AGR %)
Figure 7.41 Thales Group Sales by Segment of Business 2014-2018 (US$m)
Figure 7.42 Thales Group Sales AGR by Segment of Business 2015-2018 (AGR %)
Figure 7.43 Thales Group.Net Income / Loss 2014-2018 (US$m)
Figure 7.44 Thales Group Sales by Geographical Regional 2014-2018 (US$m)
Figure 7.45 Thales Group Sales AGR by Geographical Regional 2015-2018 (AGR %)
AVC-Defence
Boeing
Boeing HorizonX
Collin Aerospace
Dassault
Dayton Aerospace
Dayton T. Brown, Inc.
General Dynamics Corporation
General Dynamics Information Technology (GDIT)
General Dynamics Land Systems
HAL
IFS AB
ISO Group
L3 Communications
L3 Technologies
LiG Nex1
Lockheed Martin Corporation
Northrop Grumman
PTC
Raytheon Company
Rheinmetall Arabia Simulation and Training (RAST)
Rockwell Collins
SAAB
Singapore Airlines
Smiths Aerospace
Smiths Group
SparkCognition
Sukhoi
Terma
Textron Inc.
Textron Systems
Thales
TRL Technology
UTC
UTC Aerospace Systems
Organizations mentioned
Australian Army
Central Military Commission
Defence Acquisition Council
French Ministry of Defence
Indian Air Force
Indian Navy
Italian Air Force
Japan Air Self-Defence Force
Korea Air Force
Minister of Defence and Aviation (MODA)
Naval Surface Warfare Centre, Crane Division (NSWC Crane)
People's Liberation Army
Qatar armed forces
Republic of Korea Air Force (ROKAF)
Republic of Korea's Defence Acquisition Program Administration (DAPA)
Royal Air Force
Royal Australian Air Force
Royal Saudi Armed Forces
Saudi Arabian Armed Forces
Saudi Arabian National Guard (SANG)
U.K. armed forces
U.S. Air Force
U.S. Army
U.S. Army Aviation and Missile Command (AMCOM) Logistics Center (ALC).
U.S. Coast Guard
U.S. Defence Logistics Agency (DLA)
U.S. Department of Defence
U.S. Marine Corp
U.S. Navy
UAE Armed Forces