Industries > Defence > Military Augmented Reality (MAR) Technologies Market Report 2018-2028
Military Augmented Reality (MAR) Technologies Market Report 2018-2028
Forecasts by Platform (Dismounted Soldiers, Land Vehicles, Naval Vehicles, Aerial Vehicles), by Technology (Helmet Mounted Display Systems (HMD), Heads-Up Display (HUD), and Smart Glasses, Plus Analysis of Leading Companies
• Do you need definitive military augmented reality market data?
• Succinct military augmented reality market analysis?
• Technological insight?
• Clear competitor analysis?
• Actionable business recommendations?
Read on to discover how this definitive report can transform your own research and save you time.
The spate of investments in augmented reality technology has led Visiongain to publish this timely report.
Visiongain assesses the military augmented reality market will reach $1.4bn in 2018. Augmented reality technologies in the defence sector are expected to flourish in the next few years because of increased spending by governments on modernizing their armed forces and also because of the changing nature of warfare, thereby driving significant growth in this market. If you want to be part of this growing industry, then read on to discover how you can maximise your investment potential.
Report highlights
• 150+ Quantitative Tables, Charts, And Graphs
• Analysis Of Key Players In Military Augmented Reality Technologies
• Rockwell Collins
• Elbit Systems
• BAE Systems Plc
• Applied Research Associates
• BANC3 Inc
• Thales Group
• Osterhout Design Group
• Six15 Technologies
• Global Military Augmented Reality Technologies Market Outlook And Analysis From 2018-2028
• 133 Major Military Augmented Reality Contract And Projects
• Military Augmented Reality Application Forecasts And Analysis From 2018-2028
• Dismounted Soldiers Augmented Reality Technologies Forecast 2018-2028
• Land Vehicles Augmented Reality Technologies Forecast 2018-2028
• Naval Vehicles Augmented Reality Technologies Forecast 2018-2028
• Aerial Vehicles Augmented Reality Technologies Forecast 2018-2028
• Military Augmented Reality Technology Projections, Analysis And Potential From 2018-2028
• Helmet Mounted Displays Military Augmented Reality Technologies Forecast 2018-2028
• Heads Up Displays Military Augmented Reality Technologies Forecast 2018-2028
• Smart Glasses Military Augmented Reality Technologies Forecast 2018-2028
• National Military Augmented Reality Market Forecasts From 2018-2028
• Australia Military Augmented Reality Technologies Forecast 2018-2028
• Canada Military Augmented Reality Technologies Forecast 2018-2028
• France Military Augmented Reality Technologies Forecast 2018-2028
• Israel Military Augmented Reality Technologies Forecast 2018-2028
• Italy Military Augmented Reality Technologies Forecast 2018-2028
• Japan Military Augmented Reality Technologies Forecast 2018-2028
• Russia Military Augmented Reality Technologies Forecast 2018-2028
• South Korea Military Augmented Reality Technologies Forecast 2018-2028
• UK Military Augmented Reality Technologies Forecast 2018-2028
• US Military Augmented Reality Technologies Forecast 2018-2028
• RoW Military Augmented Reality Technologies Forecast 2018-2028
Key questions answered
• What Does The Future Hold For The Military Augmented Reality Industry?
• Where Should You Target Your Business Strategy?
• Which Applications Should You Focus Upon?
• Which Disruptive Technologies Should You Invest In?
• Which Companies Should You Form Strategic Alliances With?
• Which Company Is Likely To Success And Why?
• What Business Models Should You Adopt?
• What Industry Trends Should You Be Aware Of?
Target audience
• Leading military augmented reality companies
• Suppliers
• Contractors
• Technologists
• R&D staff
• Consultants
• Analysts
• CEO’s
• CIO’s
• COO’s
• Business development managers
• Investors
• Governments
• Agencies
• Industry organisations
• Banks
Visiongain is a trading partner with the US Federal Government
CCR Ref number: KD4R6
1. Report Overview
1.1 Global Military Augmented Reality Technologies Market Overview
1.2 Why You Should Read This Report
1.3 How This Report Delivers
1.4 Key Questions Answered by This Analytical Report Include:
1.5 Who is This Report For?
1.6 Methodology
1.6.1 Secondary Research
1.6.2 Market Evaluation & Forecasting Methodology
1.7 Frequently Asked Questions (FAQ)
1.8 Associated Visiongain Reports
1.9 About Visiongain
2. Introduction to the Military Augmented Reality Market
2.1 Global Military Augmented Reality Technologies Market Structure
2.2 Military Augmented Reality Technologies Market Definition
2.3 MAR for Dismounted Soldiers Submarket Definition
2.4 MAR for Land Vehicles Submarket Definition
2.5 MAR for Naval Vehicles Submarket Definition
2.6 MAR for Aerial Vehicles Submarket Definition
2.7 MAR by Technology Submarket Definition
3. Global Military Augmented Reality Technologies Market 2018-2028
3.1 Global Military Augmented Reality Technologies Market Forecast 2018-2028
4. Global Military Augmented Reality Technologies Submarket Forecast 2018-2028
4.1 Global MAR for Dismounted Soldiers Submarket Forecast 2018-2028
4.1.1 Global MAR for Dismounted Soldiers Submarket Offers High Growth Potential
4.2 Global MAR for Land Vehicles Submarket Forecast 2018-2028
4.2.1 Global MAR for Land Vehicles Submarket Analysis
4.3 Global MAR for Naval Vehicles Submarket Forecast 2018-2028
4.3.1 Global MAR for Naval Vehicles Submarket Analysis
4.4 Global MAR for Aerial Vehicles Submarket Forecast 2018-2028
4.4.1 MAR for Aerial Vehicles at the Core of Global Spending
4.3.1Global MAR Submarket, By Technology Market Analysis
5. Leading National Military Augmented Reality Technologies Market Forecast 2018-2028
5.1 Leading National Military Augmented Reality Technologies Market Share Forecast 2018-2028
5.2 Australian Military Augmented Reality Technologies Market Forecast 2018-2028
5.2.1 Australian Military Augmented Reality Technologies Market Contracts & Programmes
5.2.2 Australian Military Augmented Reality Technologies Market Analysis
5.2.3 Australian Military Augmented Reality Technologies Market Drivers & Restraints
5.3 Canadian Military Augmented Reality Technologies Market Forecast 2018-2028
5.3.1 Canadian Military Augmented Reality Technologies Market Contracts & Programmes
5.3.2 Canadian Military Augmented Reality Technologies Market Analysis
5.3.3 Canadian Military Augmented Reality Technologies Market Drivers & Restraints
5.4 French Military Augmented Reality Technologies Market Forecast 2018-2028
5.4.1 French Military Augmented Reality Technologies Market Analysis
5.4.2 French Military Augmented Reality Technologies Market Drivers & Restraints
5.5 Israeli Military Augmented Reality Technologies Market Forecast 2018-2028
5.5.1 Israeli Military Augmented Reality Technologies Market Contracts & Programmes
5.5.2 Israeli Military Augmented Reality Technologies Market Analysis
5.5.3 Israeli Military Augmented Reality Technologies Market Drivers & Restraints
5.6 Italian Military Augmented Reality Technologies Market Forecast 2018-2028
5.6.1 Italian Military Augmented Reality Technologies Market Contracts & Programmes
5.6.2 Italian Military Augmented Reality Technologies Market Analysis
5.6.3 Italian Military Augmented Reality Technologies Market Drivers & Restraints
5.7 Japanese Military Augmented Reality Technologies Market Forecast 2018-2028
5.7.1 Japanese Military Augmented Reality Technologies Market Contracts & Programmes
5.7.2 Japanese Military Augmented Reality Technologies Market Analysis
5.7.3 Japanese Military Augmented Reality Technologies Market Drivers & Restraints
5.8 Russian Military Augmented Reality Technologies Market Forecast 2018-2028
5.8.1 Russian Military Augmented Reality Technologies Market Contracts & Programmes
5.8.2 Russian Military Augmented Reality Technologies Market Analysis
5.8.3 Russian Military Augmented Reality Technologies Market Drivers & Restraints
5.9 South Korean Military Augmented Reality Technologies Market Forecast 2018-2028
5.9.1 South Korean Military Augmented Reality Technologies Market Contracts & Programmes
5.9.2 South Korean Military Augmented Reality Technologies Market Analysis
5.9.3 South Korean Military Augmented Reality Technologies Market Drivers & Restraints
5.10 United Kingdom Military Augmented Reality Technologies Market Forecast 2018-2028
5.10.1 United Kingdom Military Augmented Reality Technologies Market Contracts & Programmes
5.10.2 United Kingdom Military Augmented Reality Technologies Market Analysis
5.10.3 The Impact of Britain leaving the European Union
5.10.4 United Kingdom Military Augmented Reality Technologies Market Drivers & Restraints
5.11 United States Military Augmented Reality Technologies Market Forecast 2018-2028
5.11.1 United States Military Augmented Reality Technologies Market Contracts & Programmes
5.11.2 United States Military Augmented Reality Technologies Market Analysis
5.11.3 Death by a Thousand Cuts: the Impact of Sequestration on U.S. Defence and Security Policy
5.11.4 United States Military Augmented Reality Technologies Market Drivers & Restraints
5.12 Rest of the World Military Augmented Reality Technologies Market Forecast 2018-2028
5.12.1 Rest of the World Military Augmented Reality Technologies Market Contracts & Programmes
5.12.2 Rest of the World Military Augmented Reality Technologies Market Analysis
5.12.3 Chinese MAR Capabilities and Systems
5.12.4 Rest of the World Military Augmented Reality Technologies Market Drivers & Restraints
6. SWOT Analysis of the Military Augmented Reality Technologies Market 2018-2028
7. Leading 8Military Augmented Reality Technologies Companies
7.1 Leading 8Military Augmented Reality Technologies Companies
7.2 Applied Research Associates (ARA)
7.2.1 Applied Research Associates Military Augmented Reality Technologies Selected Recent Contracts / Projects / Programmes 2008-2014
7.2.3 Applied Research Associates Military Augmented Reality Technologies Products / Services
7.2.4 Applied Research Associates Primary Market Competitors 2018
7.2.5 Applied Research Associates Analysis and Future Outlook
7.3 BAE Systems plc
7.3.1 BAE Systems plc Military Augmented Reality Technologies Selected Recent Contracts / Projects / Programmes 2010-2018
7.3.2 BAE Systems plc Total Company Sales 2013-2017
7.3.3 BAE Systems plc Net Income 2013-2017
7.3.4 BAE Systems plc Military Augmented Reality Technologies Products / Services
7.3.5 BAE Systems plc Primary Market Competitors 2018
7.3.6 BAE Systems plc Analysis
7.3.7 BAE Systems plc Future Outlook
7.4 BANC3 Inc.
7.4.1 BANC3 Inc. Military Augmented Reality Technologies Selected Recent Contracts / Projects / Programmes 2013-2018
7.4.2 BANC3 Inc. Military Augmented Reality Technologies Products / Services
7.4.3 BANC3 Inc. Primary Market Competitors 2018
7.4.4 BANC3 Inc. Analysis and Future Outlook
7.5 Elbit Systems Ltd.
7.5.1 Elbit Systems Ltd. Military Augmented Reality Technologies Selected Recent Contracts / Projects / Programmes 2009-2016
7.5.2 Elbit Systems Ltd. Total Company Sales 2013-2017
7.5.3 Elbit Systems Ltd. Net Income 2013-2017
7.5.4 Elbit Systems Ltd. Military Augmented Reality Technologies Products / Services
7.5.5 Elbit Systems Ltd. Primary Market Competitors 2018
7.5.6 Elbit Systems Ltd. Analysis
7.5.7 Elbit Systems Ltd. Future Outlook
7.6 Osterhout Design Group (ODG)
7.6.1 Osterhout Design Group Military Augmented Reality Technologies Selected Recent Contracts / Projects / Programmes 2014
7.6.2 Osterhout Design Group Military Augmented Reality Technologies Products / Services
7.6.3 Osterhout Design Group Primary Market Competitors 2018
7.6.4 Osterhout Design Group Analysis and Future Outlook
7.7 Rockwell Collins
7.7.1 Rockwell Collins Military Augmented Reality Technologies Selected Recent Contracts / Projects / Programmes 2010-2018
7.7.2 Rockwell Collins Total Company Sales 2013-2017
7.7.3 Rockwell Collins Net Income 2013-2017
7.7.4 Rockwell Collins Military Augmented Reality Technologies Products / Services
7.7.5 Rockwell Collins Primary Market Competitors 2018
7.7.6 Rockwell Collins Analysis
7.7.7 Rockwell Collins Future Outlook
7.8 Six15 Technologies
7.8.1 Six15 Technologies Military Augmented Reality Technologies Selected Recent Contracts / Projects / Programmes 2014-2015
7.8.2 Six15 Technologies Military Augmented Reality Technologies Products / Services
7.8.3 Six15 Technologies Primary Market Competitors 2018
7.8.4 Six15 Technologies Analysis
7.8.5 Six15 Technologies Future Outlook
7.9 Thales Group
7.9.1 Thales Group Military Augmented Reality Technologies Selected Recent Contracts / Projects / Programmes 2010-2017
7.9.2 Thales Group Total Company Sales 2013-2017
7.9.3 Thales Group Net Income 2013-2017
7.9.4 Thales Group Military Augmented Reality Technologies Products / Services
7.9.5 Thales Group Primary Market Competitors 2018
7.9.6 Thales Group Analysis and Future Outlook
7.10 Other Companies Involved in the Military Augmented Reality Technologies Market 2018
8. Conclusions and Recommendations
8.1 The MAR Submarket for Dismounted Soldiers Offers the Greatest Growth Opportunities
8.2 Companies Providing Solutions to the Dismounted Soldier Will Generate Many Sales over the Next Decade
8.3 MAR for Aerial Vehicles Remains as Relevant as Ever
8.4 The United States and United Kingdom are the Key National Markets to Invest Into
9. Glossary
List of Tables
Table 1.1 Example of Leading National Military Augmented Reality Technologies Market by Submarket Forecast 2018-2028 (US$m, Global AGR %, Cumulative)
Table 3.1 Global Military Augmented Reality Technologies Market Forecast 2018-2028 (US$m, AGR %, CAGR %, Cumulative)
Table 4.1 Global Military Augmented Reality Technologies Submarket Forecast 2018-2028 (US$m, AGR %, Cumulative)
Table 4.2 Global Military Augmented Reality Technologies Submarket Forecast by National Market 2018-2028 (US$m, Cumulative, Global AGR %)
Table 4.3 Global Military Augmented Reality Technologies Submarket CAGR Forecast 2018-2023, 2023-2028, 2018-2028 (CAGR %)
Table 4.4 Global MAR for Dismounted Soldiers Submarket by National Market Forecast 2018-2028 (US$m, AGR %, CAGR %, Cumulative)
Table 4.5 Global MAR for Land Vehicles Submarket by National Market Forecast 2018-2028 (US$m, AGR %, CAGR %, Cumulative)
Table 4.6 Global MAR for Naval Vehicles Submarket by National Market Forecast 2018-2028 (US$m, AGR %, CAGR %, Cumulative)
Table 4.7 Global MAR for Aerial Vehicles Submarket by National Market Forecast 2018-2028 (US$m, AGR %, CAGR %, Cumulative)
Table 4.8 Global MAR Submarket, By Technology Forecast 2018-2028 (US$m, AGR %, Cumulative)
Table 4.9Global MAR Submarket, By Technology CAGR Forecast 2018-2023, 2023-2028, 2018-2028 (CAGR %)
Table 5.1 Leading National Military Augmented Reality Technologies Market by Submarket Forecast 2018-2028 (US$m, Global AGR %, Cumulative)
Table 5.2 Leading National Military Augmented Reality Technologies Market CAGR Forecast 2018-2023, 2023-2028, 2018-2028 (CAGR %)
Table 5.4 Australian Military Augmented Reality Technologies Market by Submarkets Forecast 2018-2028 (US$m, AGR %, CAGR %, Cumulative)
Table 5.5 Australian Military Augmented Reality Technologies Market Selected Major Contracts & Programmes 2010-2016(Date, Company, Value US$m, Customer, Details)
Table 5.6 Australian Military Augmented Reality Technologies Market Drivers &Restraints 2018
Table 5.7 Canadian Military Augmented Reality Technologies Market by Submarkets Forecast 2018-2028 (US$m, AGR %, CAGR %, Cumulative)
Table 5.8 Canadian Military Augmented Reality Technologies Market Selected Major Contracts & Programmes 2012-2017(Date, Company, Value US$m, Customer, Details)
Table 5.9 Canadian Military Augmented Reality Technologies Market Drivers &Restraints 2018
Table 5.10 French Military Augmented Reality Technologies Market by Submarkets Forecast 2018-2028 (US$m, AGR %, CAGR %, Cumulative)
Table 5.11 French Military Augmented Reality Technologies Market Drivers &Restraints 2018
Table 5.12 Israeli Military Augmented Reality Technologies Market by Submarkets Forecast 2018-2028 (US$m, AGR %, CAGR %, Cumulative)
Table 5.13 Israeli Military Augmented Reality Technologies Market Selected Major Contracts & Programmes 2014-2018(Date, Company, Value US$m, Customer, Details)
Table 5.14 Israeli Military Augmented Reality Technologies Market Drivers &Restraints 2018
Table 5.15 Italian Military Augmented Reality Technologies Market by Submarkets Forecast 2018-2028 (US$m, AGR %, CAGR %, Cumulative)
Table 5.16 Italian Military Augmented Reality Technologies Market Selected Major Contracts & Programmes 2013-2018(Date, Company, Value US$m, Customer, Details)
Table 5.17 Italian Military Augmented Reality Technologies Market Drivers &Restraints 2018
Table 5.18 Japanese Military Augmented Reality Technologies Market by Submarkets Forecast 2018-2028 (US$m, AGR %, CAGR %, Cumulative)
Table 5.19 Japanese Military Augmented Reality Technologies Market Selected Major Contracts & Programmes 2014-2015 (Date, Company, Value US$m, Customer, Details)
Table 5.20 Japanese Military Augmented Reality Technologies Market Drivers &Restraints 2018
Table 5.21 Russian Military Augmented Reality Technologies Market by Submarkets Forecast 2018-2028 (US$m, AGR %, CAGR %, Cumulative)
Table 5.22 Russian Military Augmented Reality Technologies Market Selected Major Contracts & Programmes 2012-2017(Date, Company, Customer, Details)
Table 5.23 Russian Military Augmented Reality Technologies Market Drivers &Restraints 2018
Table 5.24 South Korean Military Augmented Reality Technologies Market by Submarkets Forecast 2018-2028 (US$m, AGR %, CAGR %, Cumulative)
Table 5.25 South Korean Military Augmented Reality Technologies Market Selected Major Contracts & Programmes 2009-2018 (Date, Company, Customer, Details)
Table 5.26 South Korean Military Augmented Reality Technologies Market Drivers &Restraints 2018
Table 5.27 United Kingdom Military Augmented Reality Technologies Market by Submarkets Forecast 2018-2028 (US$m, AGR %, CAGR %, Cumulative)
Table 5.28 United Kingdom Military Augmented Reality Technologies Market Selected Major Contracts &Programmes 2010-2016 (Date, Company, Customer, Details)
Table 5.29 United Kingdom Military Augmented Reality Technologies Market Drivers &Restraints 2018
Table 5.30 United States Military Augmented Reality Technologies Market by Submarkets Forecast 2018-2028 (US$m, AGR %, CAGR %, Cumulative)
Table 5.31 United States Military Augmented Reality Technologies Market Selected Major Contracts & Programmes 2008-2018(Date, Company, Value US$m, Customer, Details)
Table 5.32 United States Military Augmented Reality Technologies Market Drivers &Restraints 2018
Table 5.33 Rest of the World Military Augmented Reality Technologies Market by Submarkets Forecast 2018-2028 (US$m, AGR %, CAGR %, Cumulative)
Table 5.34 Rest of the World Military Augmented Reality Technologies Market Selected Major Contracts & Programmes 2010-2018(Date, Company, Value US$m, Customer, Country/Region, Details)
Table 5.35 Rest of the World Military Augmented Reality Technologies Market Drivers &Restraints 2018
Table 6.1 Global Military Augmented Reality Technologies Market SWOT Analysis 2018-2028
Table 7.1 Leading 8 Military Augmented Reality Technologies Companies 2018(Company, FY2016 Total Company Sales US$m)
Table 7.2 Applied Research Associates Profile 2018 (CEO, Business Segment in the Market, Strongest Business Region, Submarket Involvement, HQ, Founded, No. of Employees, Website)
Table 7.3 Selected Recent Applied Research Associates Military Augmented Reality Technologies Contracts / Projects / Programmes 2008-2018 (Date, Country, Customer, Value US$m, Product, Details)
Table 7.4 Applied Research Associates Military Augmented Reality Technologies Products / Services (Product, Specification / Features)
Table 7.5 BAE Systems plc Profile 2018 (CEO, Total Company Sales US$m, Net Income US$m, Business Segment in the Market, Strongest Business Region, Submarket Involvement, HQ, Founded, No. of Employees, IR Contact, Ticker, Website)
Table 7.6 Selected Recent BAE Systems plc Military Augmented Reality Technologies Contracts / Projects / Programmes 2010-2018 (Date, Country Customer, Product, Details)
Table 7.7 BAE Systems plc Total Company Sales 2013-2017 (US$m, AGR %)
Table 7.8 BAE Systems plc Net Income 2013-2017 (US$m, AGR %)
Table 7.9 BAE Systems plc Military Augmented Reality Technologies Products / Services (Segment of Business, Product, Specification / Features)
Table 7.10 BANC3 Inc. Profile 2018 (Strongest Business Region, Submarket Involvement, HQ, Founded, No. of Employees, Website)
Table 7.11Selected Recent BANC3 Inc. Military Augmented Reality Technologies Contracts / Projects / Programmes 2013-2018 (Date, Country, Customer, Value US$m, Product, Details)
Table 7.12 BANC3 Inc. Military Augmented Reality Technologies Products / Services (Product, Specification / Features)
Table 7.13 Elbit Systems Ltd. Profile 2018 (CEO, Total Company Sales US$m, Net Income US$m, Business Segment in the Market, Strongest Business Region, Submarket Involvement, HQ, Founded, No. of Employees, IR Contact, Ticker, Website)
Table 7.14Selected Recent Elbit Systems Ltd. Military Augmented Reality Technologies Contracts / Projects / Programmes 2009-2016 (Date, Country, Customer, Value US$m, Product, Details)
Table 7.15 Elbit Systems Ltd. Total Company Sales 2013-2017 (US$m, AGR %)
Table 7.16 Elbit Systems Ltd. Net Income 2013-2017 (US$m, AGR (%)
Table 7.17 Elbit Systems Ltd. Military Augmented Reality Technologies Products / Services (Segment of Business, Product, Specification / Features)
Table 7.18 Osterhout Design Group Profile 2018 (CEO, Strongest Business Region, Submarket Involvement, HQ, Founded, Website)
Table 7.19Selected Recent Osterhout Design Group Military Augmented Reality Technologies Contracts / Projects / Programmes 2014 (Date, Country, Customer, Value US$m, Product, Details)
Table 7.20 Osterhout Design Group Military Augmented Reality Technologies Products / Services (Product, Specification / Features)
Table 7.21 Rockwell Collins Profile 2018 (CEO, Total Company Sales US$m, Net Income US$m, Business Segment in the Market, Strongest Business Region, Submarket Involvement, HQ, Founded, No. of Employees, IR Contact, Ticker, Website)
Table 7.22Selected Recent Rockwell Collins Military Augmented Reality Technologies Contracts / Projects / Programmes 2010-2018 (Date, Country, Customer(s), Value US$m, Product, Details)
Table 7.23 Rockwell Collins Total Company Sales 2013-2017 (US$m, AGR %)
Table 7.24 Rockwell Collins Net Income 2013-2017 (US$m, AGR %)
Table 7.25 Rockwell Collins Military Augmented Reality Technologies Products / Services (Segment of Business, Product, Specification / Features)
Table 7.26 Six15 Technologies Profile 2018 (CEO, Strongest Business Region, Submarket Involvement, HQ, Founded, No. of Employees, Website)
Table 7.27Selected Recent Six15 Technologies Military Augmented Reality Technologies Contracts / Projects / Programmes 2014-2015 (Date, Country, Customer, Value US$m, Product, Details)
Table 7.28 Six15 Technologies Military Augmented Reality Technologies Products / Services (Segment of Business, Product, Specification / Features)
Table 7.29 Thales Group Profile 2018 (CEO, Total Company Sales US$m, Net Income US$m, Business Segment in the Market, Strongest Business Region, Submarket Involvement, HQ, Founded, No. of Employees, IR Contact, Ticker, Website)
Table 7.30Selected Recent Thales Group Military Augmented Reality Technologies Contracts / Projects / Programmes 2010-2017 (Date, Country, Customer, Value US$m, Product, Details)
Table 7.31 Thales Group Total Company Sales 2012-2016 (US$m, AGR %)
Table 7.32 Thales Group Net Income 2013-2017 (US$m, AGR %)
Table 7.33 Thales Group Military Augmented Reality Technologies Products / Services (Segment of Business, Product, Specification / Features)
Table 7.34 Other Companies Involved in the Military Augmented Reality Technologies Market 2017 (Company, Location)
Table of Figures
Figure 1.1 Example of National Military Augmented Reality Technologies Market by Submarket Forecast 2018-2028 (US$m, AGR %)
Figure 2.1 Global Military Augmented Reality Technologies Market Segmentation Overview
Figure 3.1 Global Military Augmented Reality Technologies Market Forecast 2018-2028 (US$m, AGR %)
Figure 4.1 Global Military Augmented Reality Technologies Submarket AGR Forecast 2018-2028 (AGR %)
Figure 4.2 Global Military Augmented Reality Technologies Submarket Forecast 2018-2028 (US$m, Global AGR %)
Figure 4.3 Global Military Augmented Reality Technologies Submarket Share Forecast 2018 (% Share)
Figure 4.4 Global Military Augmented Reality Technologies Submarket Share Forecast 2023 (% Share)
Figure 4.5 Global Military Augmented Reality Technologies Submarket Share Forecast 2028 (% Share)
Figure 4.6 Global MAR for Dismounted Soldiers Submarket by National Market AGR Forecast 2018-2028 (AGR %)
Figure 4.7 Global MAR for Dismounted Soldiers Submarket Forecast by National Market 2018-2028 (US$m, Global AGR %)
Figure 4.8 Global MAR for Dismounted Soldiers Submarket Share by National Market Forecast 2018 (% Share)
Figure 4.9 Global MAR for Dismounted Soldiers Submarket Share by National Market Forecast 2023 (% Share)
Figure 4.10 Global MAR for Dismounted Soldiers Submarket Share by National Market Forecast 2028 (% Share)
Figure 4.11 Global MAR for Land Vehicles Submarket by National Market AGR Forecast 2018-2028 (AGR %)
Figure 4.12 Global MAR for Land Vehicles Submarket Forecast by National Market 2018-2028 (US$m, Global AGR %)
Figure 4.13 Global MAR for Land Vehicles Submarket Share by National Market Forecast 2018 (% Share)
Figure 4.14 Global MAR for Land Vehicles Submarket Share by National Market Forecast 2023 (% Share)
Figure 4.15 Global MAR for Land Vehicles Submarket Share by National Market Forecast 2028 (% Share)
Figure 4.16 Global MAR for Naval Vehicles Submarket by National Market AGR Forecast 2018-2028 (AGR %)
Figure 4.17 Global MAR for Naval Vehicles Submarket Forecast by National Market 2018-2028 (US$m, Global AGR %)
Figure 4.18 Global MAR for Naval Vehicles Submarket Share by National Market Forecast 2018 (% Share)
Figure 4.19 Global MAR for Naval Vehicles Submarket Share by National Market Forecast 2023 (% Share)
Figure 4.20 Global MAR for Naval Vehicles Submarket Share by National Market Forecast 2028 (% Share)
Figure 4.21 Global MAR for Aerial Vehicles Submarket by National Market AGR Forecast 2018-2028 (AGR %)
Figure 4.22 Global MAR for Aerial Vehicles Submarket Forecast by National Market 2018-2028 (US$m, Global AGR %)
Figure 4.23 Global MAR for Aerial Vehicles Submarket Share by National Market Forecast 2018 (% Share)
Figure 4.24 Global MAR for Aerial Vehicles Submarket Share by National Market Forecast 2023 (% Share)
Figure 4.25 Global MAR for Aerial Vehicles Submarket Share by National Market Forecast 2028 (% Share)
Figure 4.26 Global MAR Submarket, By Technology AGR Forecast 2018-2028 (AGR %)
Figure 4.27 Global MAR Submarket, By Technology Forecast 2018-2028 (US$m, Global AGR %)
Figure 4.28 Global MAR Submarket, By Technology Share Forecast 2018 (% Share)
Figure 4.29 Global MAR Submarket, By Technology Share Forecast 2023 (% Share)
Figure 4.30 Global MAR Submarket, By Technology Share Forecast 2028 (% Share)
Figure 4.31 Global Baggage Handling Systems Submarket, By Technology CAGR Forecast 2018-2023 (CAGR %)
Figure 4.32 Global Baggage Handling Systems Submarket, By Technology CAGR Forecast 2023-2028 (CAGR %)
Figure 4.33 Global Baggage Handling Systems Submarket, By Technology CAGR Forecast 2018-2028 (CAGR %)
Figure 5.1 Leading National Military Augmented Reality Technologies Market Forecast 2018-2028 (US$m, Global AGR %)
Figure 5.2 Leading National Military Augmented Reality Technologies Market Forecast AGR 2018-2028 (AGR %)
Figure 5.3Leading National Military Augmented Reality Technologies Market Forecast 2018 (% Share)
Figure 5.4Leading National Military Augmented Reality Technologies Market Share Forecast 2023 (% Share)
Figure 5.5Leading National Military Augmented Reality Technologies Market Share Forecast 2027 (% Share)
Figure 5.6 Australian Military Augmented Reality Technologies Submarkets AGR Forecast 2018-2028 (AGR %)
Figure 5.7 Australian Military Augmented Reality Technologies Market by Submarkets Forecast 2018-2028 (US$m, Australian Total Market Sales AGR %)
Figure 5.8 Canadian Military Augmented Reality Technologies Submarkets AGR Forecast 2018-2028 (AGR %)
Figure 5.9 Canadian Military Augmented Reality Technologies Market by Submarkets Forecast 2018-2028 (US$m, Canadian Total Market Sales AGR %)
Figure 5.10 French Military Augmented Reality Technologies Submarkets AGR Forecast 2018-2028 (AGR %)
Figure 5.11 French Military Augmented Reality Technologies Market by Submarkets Forecast 2018-2028 (US$m, French Total Market Sales AGR %)
Figure 5.12 Israeli Military Augmented Reality Technologies Submarkets AGR Forecast 2018-2028 (AGR %)
Figure 5.13 Israeli Military Augmented Reality Technologies Market by Submarkets Forecast 2018-2028 (US$m, Israeli Total Market Sales AGR %)
Figure 5.14 Italian Military Augmented Reality Technologies Submarkets AGR Forecast 2018-2028 (AGR %)
Figure 5.15 Italian Military Augmented Reality Technologies Market by Submarkets Forecast 2018-2028 (US$m, Italian Total Market Sales AGR %)
Figure 5.16 Japanese Military Augmented Reality Technologies Submarkets AGR Forecast 2018-2028 (AGR %)
Figure 5.17 Japanese Military Augmented Reality Technologies Market by Submarkets Forecast 2018-2028 (US$m, Japanese Total Market Sales AGR %)
Figure 5.18 Russian Military Augmented Reality Technologies Submarkets AGR Forecast 2018-2028 (AGR %)
Figure 5.19 Russian Military Augmented Reality Technologies Market by Submarkets Forecast 2018-2028 (US$m, Russian Total Market Sales AGR %)
Figure 5.20 South Korean Military Augmented Reality Technologies Submarkets AGR Forecast 2018-2028 (AGR %)
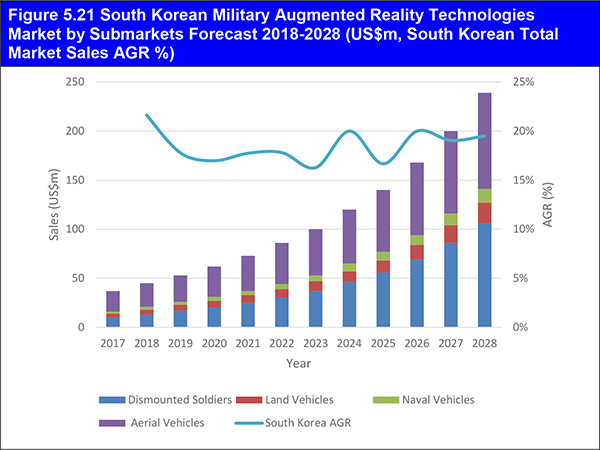
Figure 5.21 South Korean Military Augmented Reality Technologies Market by Submarkets Forecast 2018-2028 (US$m, South Korean Total Market Sales AGR %)
Figure 5.22 United Kingdom Military Augmented Reality Technologies Submarkets AGR Forecast 2018-2028 (AGR %)
Figure 5.23 United Kingdom Military Augmented Reality Technologies Market by Submarkets Forecast 2018-2028 (US$m, United Kingdom Total Market Sales AGR %)
Figure 5.24 United States Military Augmented Reality Technologies Submarkets AGR Forecast 2018-2028 (AGR %)
Figure 5.25 United States Military Augmented Reality Technologies Market by Submarkets Forecast 2018-2028 (US$m, United States Total Market Sales AGR %)
Figure 5.26 Rest of the World Military Augmented Reality Technologies Submarkets AGR Forecast 2018-2028 (AGR %)
Figure 5.27 Rest of the World Military Augmented Reality Technologies Market by Submarkets Forecast 2018-2028 (US$m, Rest of the World Total Market Sales AGR %)
Figure 7.1 Applied Research Associates Primary Market Competitors 2018
Figure 7.2 BAE Systems plc Total Company Sales 2013-2017 (US$m, AGR %)
Figure 7.3 BAE Systems plc Net Income 2013-2017 (US$m, AGR %)
Figure 7.4 BAE Systems plc Primary Market Competitors 2018
Figure 7.5 BANC3 Inc. Primary Market Competitors 2018
Figure 7.6 Elbit Systems Ltd. Total Company Sales 2013-2017 (US$m, AGR %)
Figure 7.7 Elbit Systems Ltd. Net Income 2013-2017 (US$m, AGR %)
Figure 7.8 Elbit Systems Ltd. Primary Market Competitors 2018
Figure 7.9 Osterhout Design Group Primary Market Competitors 2018
Figure 7.10 Rockwell Collins Total Company Sales 2013-2017 (US$m, AGR %)
Figure 7.11 Rockwell Collins Net Income 2013-2017 (US$m, AGR %)
Figure 7.12 Rockwell Collins Primary Market Competitors 2018
Figure 7.13 Six15 Technologies Primary Market Competitors 2018
Figure 7.14 Thales Group Total Company Sales 2013-2017 (US$m, AGR %)
Figure 7.15 Thales Group Net Income 2013-2017 (US$m, AGR %)
Figure 7.16 Thales Group Primary Market Competitors 2018
21st Century Fox
ADS Inc.
Airbus Defence & Space
Airbus Helicopters
Alenia Aermacchi
Apple, Inc.
Applied Research Associates (ARA)
APX Labs
ARA
Arcane Technologies
ASELSAN
Atheer, Inc.
Augmented Vision Inc.
BAE Systems Hägglunds
BAE Systems plc
BANC3 Inc.
Bell Helicopters.
Boeing Company
China Electronics Technology Group Corporation
Cinoptics
Close Air Solutions
Cohort Group plc
Collins Aerospace Systems
Convergent Manufacturing Technologies,
Cubic Corporation
DAQRI
Dassault Aviation
DCNS
Department of Defence Ordnance Technology Consortium
Design Interactive (DI)
Digilens
DIOTA
EFW Inc.,
Elbit Systems Ltd.
Elbit Systems of America
Eligo Vision
Eon Reality Inc.
ESA Vision Systems
ESG
Excelitas Technologies
Facebook in 2014
FedEx Express
Fincantieri
Finmeccanica
Future Naval Capabilities Applied Research
Gentex Corporation
Google
Harris Corporation.
Hunter Medical Research Institute (HMRI)
Immy Inc.
Innovega
International Enterprises Inc.
ISTEC ICE Ltd.
J&F Alliance,
JSC United Aircraft Corporation
Kongsberg Gallium
Kopin Corporation
KRET
L-3 Communications
L-3 Link
L3 Warrior Sensor Systems
Leonardo
LifeBEAM
LIG Nex1
Liteye Systems Inc.
Lockheed Martin
Lumus Optical
Microsoft Corporation
NGRAIN
Oculus VR
ODG
Optech4D
Optics1 Inc.
Osterhout Design Group
Paravion Technology Inc.
Physical Optics Corporation (POC)
Precision Technic Defence A/S,
Qioptiq Photonics Ltd.
Quanta Computer
Rafael Advanced Defence
Rapid Imaging Software Inc.
Raytheon
ReallarR
Rockwell Collins
Rosoboronexport
SA Photonics
Saab
Saab Australia
SEA
Shenzhen O-film Tech Co., Ltd.
Six15 Technologies
Sukhoi
Tactical Display Group LLC
TechSolutions
Thales Group
United Technologies Corporation (UTC)
Vanfund Urban Investment & Development Co. Ltd.
Vision Systems International
Visual Analytics Research and Development Consortium of Canada (VARDEC)
Vuzix Corporation
Organisations mentioned
Army of South Korea
Australian Army
British Army
Canadian Armed Forces
Defence Science & Technology Laboratory (DSTL)
Defence Science Technology Group (DSTG)
French Air Force
Indian Air Force
Indian Navy
Industry Trade Association
Israel Defence Forces (IDF)
Israeli Navy
Italian Air Force
Italian Ministry of Defence
Korea Institute for Advancement of Technology
Korea Institute for Industrial Economics and Trade
Mari State University
National Defense Industrial Association (NDIA)
NATO
Norwegian Army
Organisation for Joint Armament Cooperation
Organization of Petroleum Exporting Countries (OPEC)
People's Liberation Army Air Force (PLAAF)
Polish Air Force
Polish Ministry of National Defence
Republic of Korea Air Force (ROKAF)
Royal Australian Air Force
Royal Canadian Air Force
Royal Danish Air Force (RDAF)
Royal Thai Air Force (RTAF)
Russian Advanced Research Fund
Russian Air Force
Russian Defence Ministry
Russian Defence Ministry Main Robotics Research and Test Center
Russian Navy
South Korean Air Force
South Korean Army
South Korean Military Academy
South Korean Ministry of Science Technology & Innovation
Spanish Ministry of Defence
Transparency International
U.K. Ministry of Defence (MoD)
U.K. Royal Air Force (RAF)
U.K. Royal Navy
U.S. Defense Logistics Agency
U.S. Homeland Security Advanced Research Projects Agency (HSARPA)
U.S. Naval Research Laboratory (NRL)
U.S. Air Force
U.S. Army
U.S. Army Communications-Electronics Command (CECOM)
U.S. Army Communications-Electronics Research, Development and Engineering Center (CERDEC)
U.S. Army Contracting Command
U.S. Army Program Executive Office for Simulation, Training, and Instrumentation (PEO STRI)
U.S. Army Research Development and Engineering Command (RDECOM)
U.S. Army’s NVESD (Night Vision and Electronic Sensors Directorate)
U.S. Combating Terrorism Technical Support Office (CTTSO)
U.S. Defence Advanced Research Projects Agency (DARPA)
U.S. Department of Defence Ordnance Technology Consortium
U.S. Marine Corps
U.S. Naval Surface Warfare Center
U.S. Navy
U.S. Night Vision and Electronic Sensors Directorate (NVESD)
U.S. Office of Naval Research.(ONR)
University of Birmingham
University of Newcastle (UON)
Wright-Patterson Air Force Base
Download sample pages
Complete the form below to download your free sample pages for Military Augmented Reality (MAR) Technologies Market Report 2018-2028
Related reports
-
Smart Sensors in Military and Defence Market Report 2019-2029
The latest demand in Smart Sensors has led Visiongain to publish this unique report, which is crucial to your companies...Full DetailsPublished: 28 February 2019 -

Wearable Technology Market 2018-2028
Our 172-page report provides 134 tables, charts, and graphs. Read on to discover the most lucrative areas in the industry...
Full DetailsPublished: 16 January 2018 -
Military Aviation Sensors & Switches Market Report 2019-2029
Visiongain assesses the military aviation sensor and switches market to be valued at $179.5m in 2019....Full DetailsPublished: 17 April 2019 -
Top 20 Military Embedded Systems Companies 2018
Visiongain assesses that the military embedded system market will generate revenues of $80.96bn in 2018....Full DetailsPublished: 21 September 2018 -
Military Simulation, Modelling and Virtual Training Market Report 2019-2029
Developments in simulation systems related technology have had a significant impact on the defence military simulation and virtual training market.
...Full DetailsPublished: 06 December 2018 -

Automotive Augmented Reality Market Report 2017-2027
Are you looking for a definitive report on the $1.1bn automotive augmented reality market? In this comprehensive report, you will...Full DetailsPublished: 21 September 2017 -

Global Military Personnel Health Monitoring Bioinformatics Market Forecast 2017-2027
The global military personnel health monitoring bioinformatics market is expected to grow at a CAGR of 12.8% from 2017-2027. Bioinformatics...Full DetailsPublished: 03 October 2017 -
Military Wearable Sensors Market Report 2019-2029
Visiongain assesses the military wearable sensors market at $179m in 2019....Full DetailsPublished: 03 May 2019 -

Augmented Reality & Virtual Reality in Healthcare Market Forecast 2018-2028
The Global Augmented Reality & Virtual Reality in Healthcare market shows immense potential to grow in the future, growing in...
Full DetailsPublished: 05 February 2018 -
Military Unmanned Aerial Vehicle (UAV) Market Report 2018-2028
The global Military Unmanned Aerial Vehicle (UAV) market consists of worldwide government spending on the procurement and development of Military...
Full DetailsPublished: 31 August 2018
Download sample pages
Complete the form below to download your free sample pages for Military Augmented Reality (MAR) Technologies Market Report 2018-2028
Do you have any custom requirements we can help you with?
Any specific country, geo region, market segment or specific company information?
Email us today, we can discuss your needs and see how we can help: jamie.roberts@visiongain.com
Would you like a free report overview of the report of your choice?
If so, please drop an email to Jamie Roberts stating your chosen report title to jamie.roberts@visiongain.com
Visiongain defence reports are compiled using a broad and rich mixture of both primary and secondary information to produce an overall industry outlook. In order to provide our clients with the best product possible, Visiongain analysts reach out to market-leading vendors and industry experts and review a wealth of financial data and product information from a vast range of sources. To find out more about our reports methodology, please email jamie.roberts@visiongain.com
Would you like to get the latest Visiongain defence reports catalogue?
What are the dynamic growth sectors? where are the regional business opportunities?
Which technologies will prevail and who are the leading companies succeeding in these sectors and why?
If you want definitive answers to business critical questions, discover Visiongain’s full range of business intelligence reports.
If so, please email Jamie Roberts on jamie.roberts@visiongain.com or call her today on +44 207 336 6100
ADS Group
Aerial Refueling Systems Advisory Group
Aerospace and Defence Industries Association of Nova Scotia
Aerospace Industries Association
Aerospace Industries Association of Canada
AHS International – The Vertical Flight Technical Society
Air Force Association
Aircraft Electronics Association
Airlift/Tanker Association
American Astronautical Society
American Gear Manufacturers Association
American Institute of Aeronautics and Astronautics
American Logistics Association
American Society of Naval Engineers
AMSUS – The Society of the Federal Health Agencies
Armed Forces Communications and Electronics Association
Armed Forces Communications and Electronics Association
Army Aviation Association of America
ASD – Aerospace & Defence Association of Europe
Association for Unmanned Vehicle Systems International
Association of Aviation Manufacturers of the Czech Republic
Association of Naval Aviation
Association of Old Crows
Association of Polish Aviation Industry
Association of the Defense Industry of the Czech Republic
Association of the United States Army
Association of the United States Navy
Australia Defence Association
Australian Industry & Defence Network
Australian Industry Group Defence Council
Austrian Aeronautics Industries Group
Aviation Distributors and Manufacturers Association
Aviation Suppliers Association
Belgian Security and Defence Industry
Bulgarian Defence Industry Association
Business Executives for National Security
Canadian Association of Defence and Security Industries
Conference of Defense Associations
Council of Defense and Space Industry Associations
Danish Defence & Security Industries Association
Defence Industry Manufacturers Association
Defense Industry Initiative on Business Ethics and Conduct
Defense Industry Offset Association
Defense Orientation Conference Association
Deutsche Gesellschaft fur Wehrtechnik
Federal Association of the German Security and Defence Industry
Federation of Aerospace Enterprises in Ireland
French Aerospace Industries Association
French Land Defence Manufacturers Association (GICAT)
German Aerospace Industries Association
Helicopter Association International
Hellenic Aerospace & Defense Industries Group
Homeland Security & Defense Business Council
International Stability Operations Association
Japan Association of Defense Industry
Korea Defense Industry Association
Marine Corps Association & Foundation
National Aeronautic Association
National Association of Ordnance and Explosive Waste Contractors
National Defense Industrial Association
National Defense Transportation Association
National Guard Association of the U.S.
Navy League of the United States
Netherlands Aerospace Group
New Zealand Defence Industry Association
Portuguese Association of Defense Related Industries & New Technologies Companies
Québec Ground Transportation Cluster
Satellite Industry Association
Society of American Military Engineers
South African Aerospace Maritime and Defence Industries Association
Spanish Aerospace and Defence Association Industries
Submarine Industrial Base Council
Swedish Aerospace Industries
Swedish Security and Defence Industry Association
Swiss Aeronautical Industries Group
The Association of Finnish Defence and Aerospace Industries
The Italian Industries Association for Aerospace Systems and Defence
The Netherlands Defence Manufacturers Association
The Society of Japanese Aerospace Companies
UK AeroSpace, Defence & Security Industries
United Kingdom National Defence Association
Don’t Miss Out!
Subscribe to receive the latest Industry news, trending insight and analysis straight to your inbox.Choose your preferences:
Latest Defence news
Robotic Warfare Market
The global Robotic Warfare market is projected to grow at a CAGR of 6.7% by 2034
19 July 2024
Cyber Warfare Market
The global Cyber Warfare market is projected to grow at a CAGR of 17.7% by 2034
16 July 2024
Counter-UAV (C-UAV) Market
The global Counter-UAV (C-UAV) market is projected to grow at a CAGR of 29.6% by 2034
08 July 2024
Special Mission Aircraft Market
The global Special Mission Aircraft market is projected to grow at a CAGR of 4.6% by 2034
27 June 2024
