Industries > Pharma > Global Military Personnel Health Monitoring Bioinformatics Market Forecast 2017-2027
Global Military Personnel Health Monitoring Bioinformatics Market Forecast 2017-2027
Knowledge Management Tools, Bioinformatics Platforms, Services, Genomics, Proteomics, Transcriptomics, Metabolomics
The global military personnel health monitoring bioinformatics market is expected to grow at a CAGR of 12.8% from 2017-2027. Bioinformatics platforms occupied over 45% of the overall market share in 2016, a trend which is expected to continue over the next few years
How this report will benefit you
Read on to discover how you can exploit the future business opportunities emerging in this sector.
In this brand new 207-page report you will receive 83 tables and 170 figures– all unavailable elsewhere.
The 207-page report provides clear detailed insight into the global military personnel health monitoring bioinformatics market. Discover the key drivers and challenges affecting the market.
By ordering and reading our brand-new report today you stay better informed and ready to act.
Report Scope
• Global Military Personnel Health Monitoring Bioinformatics Market Forecast 2017-2027
• This report also breaks down the revenue forecast for the global military personnel health monitoring bioinformatics market by Type:
– Knowledge Management Tools: General Knowledge Management Tools, Specialized Knowledge Management Tools
– Bioinformatics Platforms: Sequence Analysis Platforms, Sequence Alignment Platforms, Sequence Manipulation Platforms, Others
– Services: Sequencing Services, Database and Management Services, Other (Data Analysis, etc.).
• This report also breaks down the revenue forecast for the global military personnel health monitoring bioinformatics market by Application:
– Genomics
– Proteomics
– Transcriptomics
– Metabolomics
– Others
• This report also breaks down the revenue forecast for the global military personnel health monitoring bioinformatics market by Regional and National Markets:
– North America: the US, Canada, Rest of North America
– Asia-Pacific: China, India, Australia, Rest of Asia-Pacific
– Europe: the UK, Germany, France, Rest of Europe
– Middle East & Africa: GCC, South Africa, Rest of MEA
– South America: Brazil, Argentina, Rest of South America
Each region is further segmented by type, application and services.
• This report discusses trends in the industry and assesses drivers, restraints, opportunities and threats that influence the global military personnel health monitoring bioinformatics market.
• This report profiles the leading companies of the global military personnel health monitoring bioinformatics market:
– Thermo Fisher Scientific Inc.
– Optra Health Scientific Inc.
– Illumina Inc.
– Bruker Corporation
– Qiagen Inc.
– Agilent Technologies, Inc.
– Biomax Informatics
– PerkinElmer Inc.
– Waters Corporation
– DNAnexus
Visiongain’s study is intended for anyone requiring commercial analyses for the global military personnel health monitoring bioinformatics market. You find data, trends and predictions.
Buy our report today Global Military Personnel Health Monitoring Bioinformatics Market Forecast 2017-2027: Knowledge Management Tools, Bioinformatics Platforms, Services, Genomics, Proteomics, Transcriptomics, Metabolomics.
Visiongain is a trading partner with the US Federal Government
CCR Ref number: KD4R6
1. Report Overview
1.1 Global Military Personnel Health Monitoring Bioinformatics Market Overview
1.2 Why You Should Read This Report
1.3 How This Report Delivers
1.4 Key Questions Answered by This Analytical Report Include:
1.5 Who is This Report For?
1.6 Methodology
1.6.1 Secondary Research
1.6.2 Market Evaluation & Forecasting Methodology
1.7 Frequently Asked Questions (FAQ)
1.8 Associated Visiongain Reports
1.9 About Visiongain
2. Introduction
2.1 Objectives of the Study
2.2 Market Definition
2.2.1 Military Personnel Health Monitoring Bioinformatics Market at a Glance:
2.2.2 Market Segmentation
2.3 Currency
3. Research Methodology
3.1 Data Collection
3.2 Secondary Data
3.3 Market Size Estimation
4. Executive Summary
5. Military Personnel Health Monitoring Bioinformatics Market Dynamics
5.1 Drivers
5.1.1 Widespread Applications
5.1.2 Technological Development
5.1.3 Growth of Integrative Bioinformatics (Big Data Analytics)
5.2 Restraints
5.2. Managing Big Data and Data Complexity
5.3 Opportunities
5.3.1 Open Source Bioinformatics and Biotechnology Cells In Military
5.4 Challenges
5.4.1 Sparse Data and Lack of Comparable Studies
6. Premium Insights
6.1 Regional Growth Insight
6.2 Key Investment Pockets by Application
7. Market Position of Top 5 Player
8. Global Military Personnel Health Monitoring Bioinformatics Market
8.1 Global Military Personnel Health Monitoring Bioinformatics Market by Type 2017-2027
8.1.1 Introduction
8.1.2 Segment Revenue Matrix
8.1.3 Market Share Analysis
8.1.4 Growth Comparison Matrix
8.2 Global Military Personnel Health Monitoring Bioinformatics Market by Knowledge Management Tools, 2017-2027
8.2.1 Introduction
8.2.2 Segment Revenue Matrix
8.2.3 Market Share Analysis
8.2.4 Growth Comparison Matrix
8.3 Global Military Personnel Health Monitoring Bioinformatics Market by Platforms, 2017-2027
8.3.1 Introduction
8.3.2 Segment Revenue Matrix
8.3.3 Market Share Analysis
8.3.4 Growth Comparison Matrix
8.4 Global Military Personnel Health Monitoring Bioinformatics Market by Services, 2017-2027
8.4.1 Introduction
8.4.2 Segment Revenue Matrix
8.4.3 Market Share Analysis
8.4.4 Growth Comparison Matrix
8.5 Global Military Personnel Health Monitoring Bioinformatics Market by Application, 2017-2027
8.5.1 Introduction
8.5.2 Segment Revenue Matrix
8.5.3 Market Share Analysis
8.5.4 Growth Comparison Matrix
8.6 Global Military Personnel Health Monitoring Bioinformatics Market by Geography 2017-2027
8.6.1. Introduction
8.6.2 Segment Revenue Matrix
8.6.3 Market Share Analysis
8.6.4 Growth Comparison Matrix
9. North America Military Personnel Health Monitoring Bioinformatics Market
9.1 North America Military Personnel Health Monitoring Bioinformatics Market by Type 2017-2027
9.1.1 Introduction
9.1.2 Segment Revenue Matrix
9.1.3 Market Share Analysis
9.1.4 Growth Comparison Matrix
9.2 North America Military Personnel Health Monitoring Bioinformatics Market by Knowledge Management Tools 2017-2027
9.2.1 Introduction
9.2.2 Segment Revenue Matrix
9.2.3 Market Share Analysis
9.2.4 Growth Comparison Matrix
9.3 North America Military Personnel Health Monitoring Bioinformatics Market by Platform 2017-2027
9.3.1 Introduction
9.3.2 Segment Revenue Matrix
9.3.3 Market Share Analysis
9.3.4 Growth Comparison Matrix
9.4 North America Military Personnel Health Monitoring Bioinformatics Market by Platform 2017-2027
9.4.1 Introduction
9.4.2 Segment Revenue Matrix
9.4.3 Market Share Analysis
9.4.4 Growth Comparison Matrix
9.5 North America Military Personnel Health Monitoring Bioinformatics Market by Application 2017-2027
9.5.1 Introduction
9.5.2 Segment Revenue Matrix
9.5.3 Market Share Analysis
9.5.4 Growth Comparison Matrix
9.6 North America Military Personnel Health Monitoring Bioinformatics Market by Country 2017-2027
9.6.1 Introduction
9.6.2 Segment Revenue Matrix
9.6.3 Market Share Analysis
9.6.4 Growth Comparison Matrix
10. Europe Military Personnel Health Monitoring Bioinformatics Market
10.1 Europe Military Personnel Health Monitoring Bioinformatics Market by Type 2017-2027
10.1.1 Introduction
10.1.2 Segment Revenue Matrix
10.1.3 Market Share Analysis
10.1.4 Growth Comparison Matrix
10.2 Europe Military Personnel Health Monitoring Bioinformatics Market by Knowledge Management Tools 2017-2027
10.2.1 Introduction
10.2.2 Segment Revenue Matrix
10.2.3 Market Share Analysis
10.2.4 Growth Comparison Matrix
10.3 Europe Military Personnel Health Monitoring Bioinformatics Market, By Platform 2017-2027
10.3.1 Introduction
10.3.2 Segment Revenue Matrix
10.3.3 Market Share Analysis
10.3.4 Growth Comparison Matrix
10.4 Europe Military Personnel Health Monitoring Bioinformatics Market, By Platform 2017-2027
10.4.1 Introduction
10.4.2 Segment Revenue Matrix
10.4.3 Market Share Analysis
10.4.4 Growth Comparison Matrix
10.5 Europe Military Personnel Health Monitoring Bioinformatics Market by Application 2017-2027
10.5.1 Introduction
10.5.2 Segment Revenue Matrix
10.5.3 Market Share Analysis
10.5.4 Growth Comparison Matrix
10.6 Europe Military Personnel Health Monitoring Bioinformatics Market by Country 2017-2027
10.6.1 Introduction
10.6.2 Segment Revenue Matrix
10.5.3 Market Share Analysis
10.5.4 Growth Comparison Matrix
11. Asia Pacific (APAC) Military Personnel Health Monitoring Bioinformatics Market
11.1 APAC Military Personnel Health Monitoring Bioinformatics Market, By Type 2017-2027
11.1.1 Introduction
11.1.2 Segment Revenue Matrix
11.1.3 Market Share Analysis
11.1.4 Growth Comparison Matrix
11.2 Asia Pacific Military Personnel Health Monitoring Bioinformatics Market by Knowledge Management Tool 2017-2027
11.2.1 Introduction
11.2.2 Segment Revenue Matrix
11.2.3 Market Share Analysis
11.2.4 Growth Comparison Matrix
11.3 Asia Pacific Military Personnel Health Monitoring Bioinformatics Market by Platform 2017-2027
11.3.1 Introduction
11.3.2 Segment Revenue Matrix
11.3.3 Market Share Analysis
11.3.4 Growth Comparison Matrix
11.4 Asia Pacific Military Personnel Health Monitoring Bioinformatics Market by Services 2017-2027
11.4.1 Introduction
11.4.2 Segment Revenue Matrix
11.4.3 Market Share Analysis
11.4.4 Growth Comparison Matrix
11.5 Asia Pacific Military Personnel Health Monitoring Bioinformatics Market by Application 2017-2027
11.5.1 Introduction
11.5.2 Segment Revenue Matrix
11.5.3 Market Share Analysis
11.5.4 Growth Comparison Matrix
11.6 Asia Pacific Military Personnel Health Monitoring Bioinformatics Market by Country 2017-2027
11.6.1 Introduction
11.6.2 Segment Revenue Matrix
11.6.3 Market Share Analysis
11.6.4 Growth Comparison Matrix
12. Middle East and Africa (MEA) Military Personnel Health Monitoring Bioinformatics Market
12.1 MEA Military Personnel Health Monitoring Bioinformatics Market by Type 2017-2027
12.1.1 Introduction
12.1.2 Segment Revenue Matrix
12.1.3 Market Share Analysis
12.1.4 Growth Comparison Matrix
12.2 Middle East and Africa Military Personnel Health Monitoring Bioinformatics Market by Knowledge Management Tool 2017-2027
12.2.1 Introduction
12.2.2 Segment Revenue Matrix
12.2.3 Market Share Analysis
12.2.4 Growth Comparison Matrix
12.3 Middle East and Africa Military Personnel Health Monitoring Bioinformatics Market by Platform 2017-2027
12.3.1 Introduction
12.3.2 Segment Revenue Matrix
12.3.3 Market Share Analysis
12.3.4 Growth Comparison Matrix
12.4 Middle East and Africa Military Personnel Health Monitoring Bioinformatics Market by Services 2017-2027
12.4.1 Introduction
12.4.2 Segment Revenue Matrix
12.4.3 Market Share Analysis
12.4.4 Growth Comparison Matrix
12.5 Middle East and Africa Military Personnel Health Monitoring Bioinformatics Market by Application 2017-2027
12.5.1 Introduction
13.5.2 Segment Revenue Matrix
12.5.3 Market Share Analysis
12.5.4 Growth Comparison Matrix
12.6 Middle East and Africa Military Personnel Health Monitoring Bioinformatics Market by Country 2017-2022
12.6.1 Introduction
12.6.2 Segment Revenue Matrix
12.6.3 Market Share Analysis
12.6.4 Growth Comparison Matrix
13. South America Military Personnel Health Monitoring Bioinformatics Market
13.1 South America Military Personnel Health Monitoring Bioinformatics Market by Type 2017-2027
13.1.1 Introduction
13.1.2 Segment Revenue Matrix
13.1.3 Market Share Analysis
13.1.4 Growth Comparison Matrix
13.2 South America Military Personnel Health Monitoring Bioinformatics Market, By Knowledge Management Tool 2017-2027
13.2.1 Introduction
13.2.2 Segment Revenue Matrix
13.2.3 Market Share Analysis
13.2.4 Growth Comparison Matrix
13.3 South America Military Personnel Health Monitoring Bioinformatics Market by Platform 2017-2027
13.3.1 Introduction
13.3.2 Segment Revenue Matrix
13.3.3 Market Share Analysis
13.3.4 Growth Comparison Matrix
13.4 South America Military Personnel Health Monitoring Bioinformatics Market, By Services 2017-2027
13.4.1 Introduction
13.4.2 Segment Revenue Matrix
13.4.3 Market Share Analysis
13.4.4 Growth Comparison Matrix
13.5 South America Military Personnel Health Monitoring Bioinformatics Market by Application 2017-2027
13.5.1 Introduction
13.5.2 Segment Revenue Matrix
13.5.3 Market Share Analysis
13.5.4 Growth Comparison Matrix
13.6 South America Military Personnel Health Monitoring Bioinformatics Market, By Country 2017-2027
13.6.1 Introduction
13.6.2 Segment Revenue Matrix
13.6.3 Market Share Analysis
13.6.4 Growth Comparison Matrix
14.Military Personnel Health Monitoring Bioinformatics – Leading Companies
14.1 Market Share Analysis
14.1.1 Introduction
14.2 Thermo Fisher Scientific Inc
14.2.1Revenue, by Geographic Region, 2016 and Revenue & Y-o-Y Growth, 2014-2016
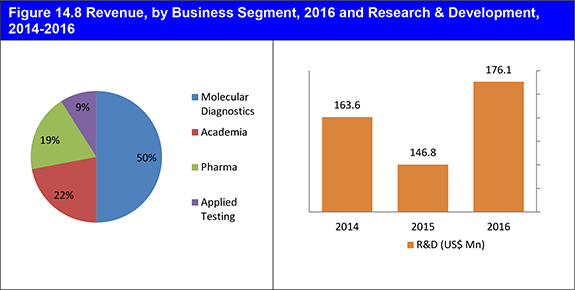
14.2.2 Revenue, by Business Segment, 2016 and Research & Development, 2014-2016
14.2.3 Recent Developments
14.2.4 Thermo Fisher Inc. Analysis
14.3 Optra Health Scientific Inc.
14.3. 1 Recent Developments
14.4 Illumina Inc
14.4.1 Revenue, by Geographic Region, 2016 and Revenue & Y-o-Y Growth, 2014-2016
14.4.2 Research & Development, 2014-2016
14.4.3 Recent Developments
14.4.4 Illumina Inc. Analysis
14.5 Bruker Corporation
14.5.1 Revenue, by Geographic Region, 2016 and Revenue & Y-o-Y Growth, 2014-2016
14.5.2 Revenue, by Business Segment, 2016 and Research & Development, 2014-2016
14.5.3 Recent Developments
14.5.4 Bruker Analysis
14.6 Qiagen Inc
14.6.1 Revenue, by Geographic Region, 2016 and Revenue & Y-o-Y Growth, 2014-2016
14.6.2 Revenue, by Business Segment, 2016 and Research & Development, 2014-2016
14.6.3 Recent Developments
14.6.4 Qiagen Analysis
14.7 Agilent Technologies, Inc.
14.7.1 Revenue, by Geographic Region, 2016 and Revenue & Y-o-Y Growth, 2014-2016
14.7.2 Revenue, by Business Segment, 2016 and Research & Development, 2014-2016
14.7.3 Recent Developments
14.7.4 Agilent Analysis
14.8 Biomax Informatics
14.8.1 Recent Developments
14.9 PerkinElmer Inc
14.9.1 Revenue, by Geographic Region, 2016 and Revenue & Y-o-Y Growth, 2014-2016
14.9.2 Revenue, by Business Segment, 2016 and Research & Development, 2014-2016
14.9.3 Recent Developments
14.9.4 PerkinElmer Analysis
14.10 Waters Corporation
14.10.1 Revenue, by Geographic Region, 2016 and Revenue & Y-o-Y Growth, 2014-2016
14.10.2 Revenue, by Business Segment, 2016 and Research & Development, 2014-2016
14.10.3 Recent Developments
14.10.4 Waters Corporation Analysis
14.11 DNAnexus
14.11.1 Recent Developments
15. Conclusion
Appendices
Associated Visiongain Reports
Visiongain Report Sales Order Form
Appendix A
About Visiongain
Appendix B
Visiongain report evaluation form
List of Tables
Table 4.1: Global Military Personnel Health Monitoring Bioinformatics Market Size 2017-2027 ($m, AGR %, CAGR)
Table 8.1: Global Military Personnel Health Monitoring Bioinformatics Market Forecast by Type 2017-2027 ($m, AGR%, CAGR%)
Table 8.2: Global Military Personnel Health Monitoring Bioinformatics market CAGR Forecast 2017-2022, 2023-2027, 2017-2027 (%)
Table 8.3: Global Military Personnel Health Monitoring Bioinformatics Market Forecast by Knowledge Management Tools, 2017-2027 ($m, AGR%, CAGR%)
Table 8.4: Global Military Personnel Health Monitoring Bioinformatics market CAGR Forecast by Knowledge Management Tools 2017-2022, 2023-2027, 2017-2027 (%)
Table 8.5: Global Military Personnel Health Monitoring Bioinformatics Market Forecast by Platforms, 2017-2027 ($m, AGR%, CAGR%)
Table 8.6: Global Military Personnel Health Monitoring Bioinformatics market CAGR Forecast by Platforms 2017-2022, 2023-2027, 2017-2027 (CAGR %)
Table 8.7: Global Military Personnel Health Monitoring Bioinformatics Market Forecast by Services, 2017-2027 ($m, AGR%, CAGR%)
Table 8.8: Global Military Personnel Health Monitoring Bioinformatics market CAGR Forecast by Services 2017-2022, 2023-2027, 2017-2027 (CAGR %)
Table 8.9: Global Military Personnel Health Monitoring Bioinformatics Market Forecast by Application, 2017-2027 ($m, AGR %, CAGR)
Table 8.10: Global Military Personnel Health Monitoring Bioinformatics market CAGR Forecast by Application 2017-2022, 2023-2027, 2017-2027 (CAGR %)
Table 8.11: Global Military Personnel Health Monitoring Bioinformatics Market Forecast by Geography 2017-2027 ($m, AGR%, CAGR%)
Table 8.12: Global Military Personnel Health Monitoring Bioinformatics market CAGR Forecast 2017-2022, 2023-2027, 2017-2027 (CAGR %)
Table 9.1: North America Military Personnel Health Monitoring Bioinformatics Market Forecast by Type 2017-2027 ($m, AGR%, CAGR%)
Table 9.2: North America Military Personnel Health Monitoring Bioinformatics market CAGR Forecast 2017-2022, 2023-2027, 2017-2027 (CAGR %)
Table 9.3: North America Military Personnel Health Monitoring Bioinformatics Market Forecast by Knowledge Management Tool 2017-2027 ($m, AGR%, CAGR%)
Table 9.4: North America Military Personnel Health Monitoring Bioinformatics market CAGR Forecast by Knowledge Management Tool 2017-2022, 2023-2027, 2017-2027 (CAGR %)
Table 9.5: North America Military Personnel Health Monitoring Bioinformatics Market Forecast by Platform 2017-2027 ($m, AGR%, CAGR%)
Table 9.6: North America Military Personnel Health Monitoring Bioinformatics market CAGR Forecast by Platform 2017-2022, 2023-2027, 2017-2027 (CAGR %)
Table 9.7: North America Military Personnel Health Monitoring Bioinformatics Market Forecast by Services 2017-2027 ($m, AGR%, CAGR%)
Table 9.8: North America Military Personnel Health Monitoring Bioinformatics market CAGR Forecast by Services 2017-2022, 2023-2027, 2017-2027 (CAGR %)
Table 9.9: North America Military Personnel Health Monitoring Bioinformatics Market Forecast by Application 2017-2027 ($m, AGR%, CAGR%)
Table 9.10: North America Military Personnel Health Monitoring Bioinformatics market CAGR Forecast by Application 2017-2022, 2023-2027, 2017-2027 (CAGR %)
Table 9.11: North America Military Personnel Health Monitoring Bioinformatics Market Forecast by Country 2017-2027 ($m, AGR% CAGR%)
Table 9.12: North America Military Personnel Health Monitoring Bioinformatics Market CAGR Forecast 2017-2022, 2023-2027, 2017-2027 (CAGR %)
Table 10.1: Europe Military Personnel Health Monitoring Bioinformatics Market Forecast by Type 2017-2027 ($m, AGR%, CAGR%)
Table 10.2: Europe Military Personnel Health Monitoring Bioinformatics Market CAGR Forecast 2017-2022, 2023-2027, 2017-2027 (CAGR %)
Table 10.3: Europe Military Personnel Health Monitoring Bioinformatics Market Forecast by Knowledge Management Tool 2017-2027 ($m, AGR%, CAGR%)
Table 10.4: Europe Military Personnel Health Monitoring Bioinformatics market CAGR Forecast by Knowledge Management Tool 2017-2022, 2023-2027, 2017-2027 (CAGR %)
Table 10.5: Europe Military Personnel Health Monitoring Bioinformatics Market Forecast by Platform 2017-2027 ($m, AGR%, CAGR%)
Table 10.6: Europe Military Personnel Health Monitoring Bioinformatics market CAGR Forecast by Platform 2017-2022, 2023-2027, 2017-2027 (CAGR %)
Table 10.7: Europe Military Personnel Health Monitoring Bioinformatics Market Forecast by Services 2017-2027 ($m, AGR%, CAGR%)
Table 10.8: Europe Military Personnel Health Monitoring Bioinformatics market CAGR Forecast by Services 2017-2022, 2023-2027, 2017-2027 (CAGR %)
Table 10.9: Europe Military Personnel Health Monitoring Bioinformatics Market Forecast by Application 2017-2027 ($m, AGR%, CAGR%)
Table 10.10: Europe Military Personnel Health Monitoring Bioinformatics market CAGR Forecast by Application 2017-2022, 2023-2027, 2017-2027 (CAGR %)
Table 10.11: Europe Military Personnel Health Monitoring Bioinformatics Market Forecast by Country 2017-2027 ($m, AGR%, CAGR%)
Table 10.12: Europe Military Personnel Health Monitoring Bioinformatics market CAGR Forecast by Country 2017-2022, 2023-2027, 2017-2027 (CAGR %)
Table 11.1: Asia Pacific Military Personnel Health Monitoring Bioinformatics Market Forecast by Type 2017-2027 ($m, AGR%, CAGR%)
Table 11.2: Asia Pacific Military Personnel Health Monitoring Bioinformatics market CAGR Forecast 2017-2022, 2023-2027, 2017-2027 (CAGR %)
Table 11.3: Asia Pacific Military Personnel Health Monitoring Bioinformatics Market Forecast by Knowledge Management Tool 2017-2027 ($m, AGR%, CAGR%)
Table 11.4: Asia Pacific Military Personnel Health Monitoring Bioinformatics market CAGR Forecast by Knowledge Management Tool 2017-2022, 2023-2027, 2017-2027 (CAGR %)
Table 11.5: Asia Pacific Military Personnel Health Monitoring Bioinformatics Market Forecast by Platform 2017-2027 ($m, AGR%, CAGR%)
Table 11.6: Asia Pacific Military Personnel Health Monitoring Bioinformatics market CAGR Forecast by Platform 2017-2022, 2023-2027, 2017-2027 (CAGR %)
Table 11.7: Asia Pacific Military Personnel Health Monitoring Bioinformatics Market Forecast by Services 2017-2027 ($m, AGR%, CAGR%)
Table 11.8: Asia Pacific Military Personnel Health Monitoring Bioinformatics market CAGR Forecast by Services 2017-2022, 2023-2027, 2017-2027 (CAGR %)
Table 11.9: Asia Pacific Military Personnel Health Monitoring Bioinformatics Market Forecast by Application 2017-2027 ($m, AGR%, CAGR%)
Table 11.10: Asia Pacific Military Personnel Health Monitoring Bioinformatics market CAGR Forecast by Application 2017-2022, 2023-2027, 2017-2027 (CAGR %)
Table 11.11: Asia Pacific Military Personnel Health Monitoring Bioinformatics Market Forecast by Country 2017-2027 ($m, AGR%, CAGR%)
Table 11.12: Asia Pacific Military Personnel Health Monitoring Bioinformatics market CAGR Forecast by Country 2017-2022, 2023-2027, 2017-2027 (CAGR %)
Table 12.1: Middle East and Africa Military Personnel Health Monitoring Bioinformatics Market Forecast, By Type 2017-2027 ($m, AGR%, CAGR%)
Table 12.2: Middle East and Africa Military Personnel Health Monitoring Bioinformatics market CAGR Forecast by Type 2017-2022, 2023-2027, 2017-2027 (CAGR %)
Table 12.3: Middle East and Africa Military Personnel Health Monitoring Bioinformatics Market Forecast by Knowledge Management Tool 2017-2027 ($m, AGR%, CAGR%)
Table 12.4: Middle East and Africa Military Personnel Health Monitoring Bioinformatics market CAGR Forecast by Knowledge Management Tool 2017-2022, 2023-2027, 2017-2027 (CAGR %)
Table 12.5: Middle East and Africa Military Personnel Health Monitoring Bioinformatics Market Forecast by Platform 2017-2027 ($m, AGR%, CAGR%)
Table 12.6: Middle East and Africa Military Personnel Health Monitoring Bioinformatics market CAGR Forecast by Platform 2017-2022, 2023-2027, 2017-2027 (CAGR %)
Table 12.7: Middle East and Africa Military Personnel Health Monitoring Bioinformatics Market Forecast by Services 2017-2027 ($m, AGR %, CAGR%)
Table 12.8: Middle East and Africa Military Personnel Health Monitoring Bioinformatics market CAGR Forecast by Services 2017-2022, 2023-2027, 2017-2027 (CAGR %)
Table 12.9: Middle East and Africa Military Personnel Health Monitoring Bioinformatics Market Forecast by Application 2017-2027 ($m, AGR%, CAGR%)
Table 12.10: Middle East and Africa Military Personnel Health Monitoring Bioinformatics market CAGR Forecast by Application 2017-2022, 2023-2027, 2017-2027 (CAGR %)
Table 12.11: Middle East and Africa Military Personnel Health Monitoring Bioinformatics Market Forecast by Country 2017-2027 ($m, AGR%, CAGR%)
Table 12.12: Middle East and Africa Military Personnel Health Monitoring Bioinformatics market CAGR Forecast by Country 2017-2022, 2023-2027, 2017-2027 (CAGR %)
Table 13.1: South America Military Personnel Health Monitoring Bioinformatics Market Forecast by Type 2017-2027 ($m, AGR%, CAGR%)
Table 13.2: South America Military Personnel Health Monitoring Bioinformatics market CAGR Forecast by Type 2017-2022, 2023-2027, 2017-2027 (CAGR %)
Table 13.3: South America Military Personnel Health Monitoring Bioinformatics Market Forecast by Knowledge Management Tool 2017-2027 ($m, AGR%, CAGR%)
Table 13.4: South America Military Personnel Health Monitoring Bioinformatics market CAGR Forecast by Knowledge Management Tool 2017-2022, 2023-2027, 2017-2027 (CAGR %)
Table 13.5: South America Military Personnel Health Monitoring Bioinformatics Market Forecast by Platform 2017-2027 ($m, AGR %, CAGR)
Table 13.6: South America Military Personnel Health Monitoring Bioinformatics market CAGR Forecast by Platform 2017-2022, 2023-2027, 2017-2027 (CAGR %)
Table 13.7: South America Military Personnel Health Monitoring Bioinformatics Market Forecast by Services 2017-2027 ($m, AGR %, CAGR)
Table 13.8: South America Military Personnel Health Monitoring Bioinformatics market CAGR Forecast by Services 2017-2022, 2023-2027, 2017-2027 (CAGR %)
Table 13.9: South America Military Personnel Health Monitoring Bioinformatics Market Forecast by Application 2017-2027 ($m, AGR %, CAGR)
Table 13.10: South America Military Personnel Health Monitoring Bioinformatics market CAGR Forecast by Application 2017-2022, 2023-2027, 2017-2027 (CAGR %)
Table 13.11: South America Military Personnel Health Monitoring Bioinformatics Market Forecast by Application 2017-2027 (US$ Mn, AGR %, CAGR)
Table 13.12: South America Military Personnel Health Monitoring Bioinformatics market CAGR Forecast by Country 2017-2022, 2023-2027, 2017-2027 (CAGR %)
Table 14.1: Thermo Fisher Scientific Inc. Overview
Table 14.2: Optra Health Overview
Table 14.3: Illumina Inc Overview
Table 14.4: Bruker Overview
Table 14.5: Qiagen Overview
Table 15.6: Agilent Technologies, Inc.Overview
Table 14.7: Biomax Informatics Overview
Table 14.8: PerkinElmer Inc Overview
Table 14.9: Waters Corporation Overview
Table 14.10: DNAnexus Overview
List of Figures
Figure 2.1: Military Personnel Health Monitoring Bioinformatics – Market Segmentation
Figure 3.1: Market Size Estimation Methodology: Bottom-Up Approach
Figure 3.2: Market Size Estimation Methodology: Top-Down Approach
Figure 4.1: Global Military Personnel Health Monitoring Bioinformatics Market Size 2017-2027 ($m, AGR %)
Figure 5.1: Military Personnel Health Monitoring Bioinformatics: Qualitative Analysis
Figure 6.1: Regional Growth Matrix
Figure 6.2: Global Military Personnel Health Monitoring Bioinformatics Key Investment Pockets by Application
Figure 7.1: Market Position of Top 5 Player
Figure 8.1: Global Military Personnel Health Monitoring Bioinformatics Market Forecast by Type 2017-2027 ($m)
Figure 8.2: Global Military Personnel Health Monitoring Bioinformatics Market by Type, Share Forecast 2016 (% Share)
Figure 8.3: Global Military Personnel Health Monitoring Bioinformatics Market by Type, Share Forecast 2027 (% Share)
Figure 8.4: Global Military Personnel Health Monitoring Bioinformatics: CAGR 2017-2027 (%)
Figure 8.5: Global Military Personnel Health Monitoring Bioinformatics Market Forecast by Knowledge Management Tools 2017-2027 ($m)
Figure 8.6: Global Military Personnel Health Monitoring Bioinformatics Market by Knowledge Management Tools, Share Forecast 2016 (% Share)
Figure 8.7: Global Military Personnel Health Monitoring Bioinformatics Market by Knowledge Management Tools, Share Forecast 2027 (% Share)
Figure 8.8: Submarkets by Knowledge Management Tools: CAGR (%) 2017-2027
Figure 8.9: Global Military Personnel Health Monitoring Bioinformatics Market Forecast by Platforms 2017-2027 ($m)
Figure 8.10: Global Military Personnel Health Monitoring Bioinformatics Market by Platforms, Share Forecast 2016 (% Share)
Figure 8.11: Global Military Personnel Health Monitoring Bioinformatics Market by Platforms, Share Forecast 2027 (% Share)
Figure 8.12: Submarkets by Platforms: CAGR (%) 2017-2027
Figure 8.13: Global Military Personnel Health Monitoring Bioinformatics Market Forecast by Services 2017-2027 ($m)
Figure 8.14: Global Military Personnel Health Monitoring Bioinformatics Market by Services, Share Forecast 2016 (% Share)
Figure 8.15: Global Military Personnel Health Monitoring Bioinformatics Market by Services, Share Forecast 2027 (% Share)
Figure 8.16: Submarkets by Services: CAGR (%) 2017-2027
Figure 8.17: Global Military Personnel Health Monitoring Bioinformatics Market Forecast by Application 2017-2027 ($m)
Figure 8.18: Global Military Personnel Health Monitoring Bioinformatics Market by Services, Share Forecast 2016 (% Share)
Figure 8.19: Global Military Personnel Health Monitoring Bioinformatics Market by Services, Share Forecast 2027 (% Share)
Figure 8.20: Submarkets by Application: CAGR (%) 2017-2027
Figure 8.21: Military Personnel Health Monitoring Bioinformatics by Geography Snapshot
Figure 8.22: Global Military Personnel Health Monitoring Bioinformatics Market Forecast by Geography 2017-2027 ($m)
Figure 8.23: Global Military Personnel Health Monitoring Bioinformatics Market by Geography, Share Forecast 2016 (% Share)
Figure 8.24: Global Military Personnel Health Monitoring Bioinformatics Market by Geography, Share Forecast 2027 (% Share)
Figure 8.25: Submarkets by Geography: CAGR (%) 2017-2027
Figure 9.1: North America Military Personnel Health Monitoring Bioinformatics Market Forecast by Type 2017-2027 ($m)
Figure 9.2: North America Military Personnel Health Monitoring Bioinformatics Market by Type, Share Forecast 2016 (% Share)
Figure 9.3: North America Military Personnel Health Monitoring Bioinformatics Market by Type, Share Forecast 2027 (% Share)
Figure 9.4: North America Submarkets by Type: CAGR (%) 2017-2027
Figure 9.5: North America Military Personnel Health Monitoring Bioinformatics Market Forecast by Knowledge Management Tool 2017-2027 ($m)
Figure 9.6: North America Military Personnel Health Monitoring Bioinformatics Market by Knowledge Management Tool, Share Forecast 2016 (% Share)
Figure 9.7: North America Military Personnel Health Monitoring Bioinformatics Market by Knowledge Management Tool, Share Forecast 2027 (% Share)
Figure 9.8: North America Submarkets by Knowledge Management Tool: CAGR (%) 2017-2027
Figure 9.9: North America Military Personnel Health Monitoring Bioinformatics Market Forecast by Platform 2017-2027 ($m)
Figure 9.10: North America Military Personnel Health Monitoring Bioinformatics Market by Platform, Share Forecast 2016 (% Share)
Figure 9.11: North America Military Personnel Health Monitoring Bioinformatics Market by Platform, Share Forecast 2027 (% Share)
Figure 9.12: North America Submarkets by Platform: CAGR (%) 2017-2027
Figure 9.13: North America Military Personnel Health Monitoring Bioinformatics Market Forecast by Services 2017-2027 ($m)
Figure 9.14: North America Military Personnel Health Monitoring Bioinformatics Market by Services, Share Forecast 2016 (% Share)
Figure 9.15: North America Military Personnel Health Monitoring Bioinformatics Market by Services, Share Forecast 2027 (% Share)
Figure 9.16: North America Submarkets by Services: CAGR (%) 2017-2027
Figure 9.17: North America Military Personnel Health Monitoring Bioinformatics Market Forecast by Application 2017-2027 ($m)
Figure 9.18: North America Military Personnel Health Monitoring Bioinformatics Market by Application, Share Forecast 2016 (% Share)
Figure 9.19: North America Military Personnel Health Monitoring Bioinformatics Market by Application, Share Forecast 2027 (% Share)
Figure 9.20: North America Submarkets by Application: CAGR (%) 2017-2027
Figure 9.21: North America Military Personnel Health Monitoring Bioinformatics Market Forecast by Country 2017-2027 ($m)
Figure 9.22: North America Military Personnel Health Monitoring Bioinformatics Market by Country, Share Forecast 2016 (% Share)
Figure 9.23: North America Military Personnel Health Monitoring Bioinformatics Market by Country, Share Forecast 2027 (% Share)
Figure 9.24: North America Submarkets by Country: CAGR (%) 2017-2027
Figure 10.1: Europe Military Personnel Health Monitoring Bioinformatics Market Forecast by Type 2017-2027 ($m)
Figure 10.2: Europe Military Personnel Health Monitoring Bioinformatics Market by Type, Share Forecast 2016 (% Share)
Figure 10.3: Europe Military Personnel Health Monitoring Bioinformatics Market by Type, Share Forecast 2027 (% Share)
Figure 10.4: Europe Submarkets by Type: CAGR (%) 2017-2027
Figure 10.5: Europe Military Personnel Health Monitoring Bioinformatics Market Forecast by Knowledge Management Tool 2017-2027 ($m)
Figure 10.6: Europe Military Personnel Health Monitoring Bioinformatics Market by Knowledge Management Tool, Share Forecast 2016 (% Share)
Figure 10.7: Europe Military Personnel Health Monitoring Bioinformatics Market by Knowledge Management Tool, Share Forecast 2027 (% Share)
Figure 10.8: Europe Submarkets by Knowledge Management Tool: CAGR (%) 2017-2027
Figure 10.9: Europe Military Personnel Health Monitoring Bioinformatics Market Forecast by Platform 2017-2027 ($m)
Figure 10.10: Europe Military Personnel Health Monitoring Bioinformatics Market by Platform, Share Forecast 2016 (% Share)
Figure 10.11: Europe Military Personnel Health Monitoring Bioinformatics Market by Platform, Share Forecast 2027 (% Share)
Figure 10.12: Europe Submarkets by Platforms: CAGR (%) 2017-2027
Figure 10.13: Europe Military Personnel Health Monitoring Bioinformatics Market Forecast by Services 2017-2027 ($m)
Figure 10.14: Europe Military Personnel Health Monitoring Bioinformatics Market by Services, Share Forecast 2016 (% Share)
Figure 10.15: Europe Military Personnel Health Monitoring Bioinformatics Market by Services, Share Forecast 2027 (% Share)
Figure 10.16: Europe Submarkets by Services: CAGR (%) 2017-2027
Figure 10.17: Europe Military Personnel Health Monitoring Bioinformatics Market Forecast by Application 2017-2027 ($m)
Figure 10.18: Europe Military Personnel Health Monitoring Bioinformatics Market by Application, Share Forecast 2016 (% Share)
Figure 10.19: Europe Military Personnel Health Monitoring Bioinformatics Market by Application, Share Forecast 2027 (% Share)
Figure 10.20: Europe Submarkets by Application: CAGR (%) 2017-2027
Figure 10.21: Europe Military Personnel Health Monitoring Bioinformatics Market Forecast by Country 2017-2027 ($m)
Figure 10.22: Europe Military Personnel Health Monitoring Bioinformatics Market by Country, Share Forecast 2016 (% Share)
Figure 10.23: Europe Military Personnel Health Monitoring Bioinformatics Market by Country, Share Forecast 2027 (% Share)
Figure 10.24: Europe Submarkets by Country: CAGR (%) 2017-2027
Figure 11.1: Asia Pacific Military Personnel Health Monitoring Bioinformatics Market Forecast by Type 2017-2027 ($m)
Figure 11.2: Asia Pacific Military Personnel Health Monitoring Bioinformatics Market by Type, Share Forecast 2016 (% Share)
Figure 11.3: Asia Pacific Military Personnel Health Monitoring Bioinformatics Market by Type, Share Forecast 2027 (% Share)
Figure 11.4: Asia-Pacific Submarkets by Type: CAGR (%) 2017-2027
Figure 11.5: Asia Pacific Military Personnel Health Monitoring Bioinformatics Market Forecast by Knowledge Management Tool 2017-2027 ($m)
Figure 11.6: Asia Pacific Military Personnel Health Monitoring Bioinformatics Market by Knowledge Management Tool, Share Forecast 2016 (% Share)
Figure 11.7: Asia Pacific Military Personnel Health Monitoring Bioinformatics Market by Knowledge Management Tool, Share Forecast 2027 (% Share)
Figure 11.8: Asia-Pacific Submarkets by Knowledge Management Tool: CAGR (%) 2017-2027
Figure 11.9: Asia Pacific Military Personnel Health Monitoring Bioinformatics Market Forecast by Platform 2017-2027 ($m)
Figure 11.10: Asia Pacific Military Personnel Health Monitoring Bioinformatics Market by Platform, Share Forecast 2016 (% Share)
Figure 11.11: Asia Pacific Military Personnel Health Monitoring Bioinformatics Market by Platform, Share Forecast 2027 (% Share)
Figure 11.12: Asia-Pacific Submarkets by Platform: CAGR (%) 2017-2027
Figure 11.13: Asia Pacific Military Personnel Health Monitoring Bioinformatics Market Forecast by Services 2017-2027 ($m)
Figure 11.14: Asia Pacific Military Personnel Health Monitoring Bioinformatics Market by Services, Share Forecast 2016 (% Share)
Figure 11.15: Asia Pacific Military Personnel Health Monitoring Bioinformatics Market by Services, Share Forecast 2027 (% Share)
Figure 11.16: Asia-Pacific Submarkets by Services: CAGR (%) 2017-2027
Figure 11.17: Asia Pacific Military Personnel Health Monitoring Bioinformatics Market Forecast by Application 2017-2027 ($m)
Figure 11.18: Asia Pacific Military Personnel Health Monitoring Bioinformatics Market by Application, Share Forecast 2016 (% Share)
Figure 11.19: Asia Pacific Military Personnel Health Monitoring Bioinformatics Market by Application, Share Forecast 2027 (% Share)
Figure 11.20: Asia-Pacific Submarkets by Application: CAGR (%) 2017-2027
Figure 11.21: Asia Pacific Military Personnel Health Monitoring Bioinformatics Market Forecast by Country 2017-2027 ($m)
Figure 11.22: Asia Pacific Military Personnel Health Monitoring Bioinformatics Market by Country, Share Forecast 2016 (% Share)
Figure 11.23: Asia Pacific Military Personnel Health Monitoring Bioinformatics Market by Country, Share Forecast 2027 (% Share)
Figure 11.24: Asia-Pacific Submarkets by Country: CAGR (%) 2017-2027
Figure 12.1: Middle East and Africa Military Personnel Health Monitoring Bioinformatics Market Forecast by Type 2017-2027 ($m)
Figure 12.2: Middle East and Africa Military Personnel Health Monitoring Bioinformatics Market by Type, Share Forecast 2016 (% Share)
Figure 12.3: Middle East and Africa Military Personnel Health Monitoring Bioinformatics Market by Type, Share Forecast 2027 (% Share)
Figure 12.4: Middle East and Africa Submarkets by Type: CAGR (%) 2017-2027
Figure 12.5: Middle East and Africa Military Personnel Health Monitoring Bioinformatics Market Forecast by Knowledge Management Tool 2017-2027 ($m)
Figure 12.6: Middle East and Africa Military Personnel Health Monitoring Bioinformatics Market by Knowledge Management Tool, Share Forecast 2016 (% Share)
Figure 12.7: Middle East and Africa Military Personnel Health Monitoring Bioinformatics Market by Knowledge Management Tool, Share Forecast 2027 (% Share)
Figure 12.8: Middle East and Africa Submarkets by Knowledge Management Tool: CAGR (%) 2017-2027
Figure 12.9: Middle East and Africa Military Personnel Health Monitoring Bioinformatics Market Forecast by Platform 2017-2027 ($m)
Figure 12.10: Middle East and Africa Military Personnel Health Monitoring Bioinformatics Market by Platform, Share Forecast 2016 (% Share)
Figure 12.11: Middle East and Africa Military Personnel Health Monitoring Bioinformatics Market by Platform, Share Forecast 2027 (% Share)
Figure 12.12: Middle East and Africa Submarkets by Platform: CAGR (%) 2017-2027
Figure 12.13: Middle East and Africa Military Personnel Health Monitoring Bioinformatics Market Forecast by Services 2017-2027 ($m)
Figure 12.14: Middle East and Africa Military Personnel Health Monitoring Bioinformatics Market by Services, Share Forecast 2016 (% Share)
Figure 12.15: Middle East and Africa Military Personnel Health Monitoring Bioinformatics Market by Services, Share Forecast 2027 (% Share)
Figure 12.16: Middle East and Africa Submarkets by Services: CAGR (%) 2017-2027
Figure 12.17: Middle East and Africa Military Personnel Health Monitoring Bioinformatics Market Forecast by Application 2017-2027 ($m)
Figure 12.18: Middle East and Africa Military Personnel Health Monitoring Bioinformatics Market by Application, Share Forecast 2016 (% Share)
Figure 12.19: Middle East and Africa Military Personnel Health Monitoring Bioinformatics Market by Application, Share Forecast 2027 (% Share)
Figure 12.20: Middle East and Africa Submarkets by Application: CAGR (%) 2017-2027
Figure 12.21: Middle East and Africa Military Personnel Health Monitoring Bioinformatics Market Forecast by Country 2017-2027 ($m)
Figure 12.22: Middle East and Africa Military Personnel Health Monitoring Bioinformatics Market by Country, Share Forecast 2016 (% Share)
Figure 12.23: Middle East and Africa Military Personnel Health Monitoring Bioinformatics Market by Country, Share Forecast 2027 (% Share)
Figure 12.24: Middle East and Africa Submarkets by Country: CAGR (%) 2017-2027
Figure 13.1: South America Military Personnel Health Monitoring Bioinformatics Market Forecast by Type 2017-2027 ($m)
Figure 13.2: South America Military Personnel Health Monitoring Bioinformatics Market by Type, Share Forecast 2016 (% Share)
Figure 13.3: South America Military Personnel Health Monitoring Bioinformatics Market by Type, Share Forecast 2027 (% Share)
Figure 13.4: South America Submarkets by Type: CAGR (%) 2017-2027
Figure 13.5: South America Military Personnel Health Monitoring Bioinformatics Market Forecast by Knowledge Management Tool 2017-2027 ($m)
Figure 13.6: South America Military Personnel Health Monitoring Bioinformatics Market by Knowledge Management Tool, Share Forecast 2016 (% Share)
Figure 13.7: South America Military Personnel Health Monitoring Bioinformatics Market by Knowledge Management Tool, Share Forecast 2027 (% Share)
Figure 13.8: South America Submarkets by Knowledge Management Tool: CAGR (%) 2017-2027
Figure 13.9: South America Military Personnel Health Monitoring Bioinformatics Market Forecast by Platform 2017-2027 ($m)
Figure 13.11: South America Military Personnel Health Monitoring Bioinformatics Market by Platform, Share Forecast 2016 (% Share)
Figure 13.12: South America Military Personnel Health Monitoring Bioinformatics Market by Platform, Share Forecast 2027 (% Share)
Figure 13.13: South America Submarkets by Platform: CAGR (%) 2017-2027
Figure 13.14: South America Military Personnel Health Monitoring Bioinformatics Market Forecast by Services 2017-2027 ($m)
Figure 13.15: South America Military Personnel Health Monitoring Bioinformatics Market by Services, Share Forecast 2016 (% Share)
Figure 13.16: South America Military Personnel Health Monitoring Bioinformatics Market by Services, Share Forecast 2027 (% Share)
Figure 13.17: South America Submarkets by Services: CAGR (%) 2017-2027
Figure 13.16: South America Military Personnel Health Monitoring Bioinformatics Market Forecast by Application 2017-2027 ($m)
Figure 13.18: South America Military Personnel Health Monitoring Bioinformatics Market by Application, Share Forecast 2016 (% Share)
Figure 13.19: South America Military Personnel Health Monitoring Bioinformatics Market by Application, Share Forecast 2027 (% Share)
Figure 13.20: South America Submarkets by Application: CAGR (%) 2017-2027
Figure 13.21: South America Military Personnel Health Monitoring Bioinformatics Market Forecast by Country 2017-2027 ($m)
Figure 13.22: South America Military Personnel Health Monitoring Bioinformatics Market by Country, Share Forecast 2016 (% Share)
Figure 13.23: South America Military Personnel Health Monitoring Bioinformatics Market by Country, Share Forecast 2027 (% Share)
Figure 13.24: South America Submarkets by Country: CAGR (%) 2017-2027
Figure 14.1: Market Share Analysis 2016 (% Share)
Figure 14.2: Revenue by Geographic Region, 2016 and Revenue & Y-o-Y Growth, 2014-2016
Figure 14.3: Revenue by Business Segment, 2016 and Research & Development, 2014-2016
Figure 14.3: Revenue, by Geographic Region, 2016 and Revenue & Y-o-Y Growth, 2014-2016
Figure 14.4: Research & Development, 2014-2016
Figure 14.5: Revenue, by Geographic Region, 2016 and Revenue & Y-o-Y Growth, 2014-2016
Figure 14.6: Revenue, by Business Segment, 2016 and Research & Development, 2014-2016
Figure 14.7: Revenue, by Geographic Region, 2016 and Revenue & Y-o-Y Growth, 2014-2016
Figure 14.8: Revenue, by Business Segment, 2016 and Research & Development, 2014-2016
Figure 14.9: Revenue & Y-o-Y Growth, 2014-2016
Figure 14.10: Revenue, by Business Segment, 2016 and Research & Development, 2014-2016
Figure 14.11: Revenue, by Geographic Region, 2016 and Revenue & Y-o-Y Growth, 2014-2016
Figure 14.12: Revenue, by Business Segment, 2016 and Research & Development, 2014-2016
Figure 14.13: Revenue, by Geographic Region, 2016 and Revenue & Y-o-Y Growth, 2014-2016
Figure 14.14: Revenue, by Business Segment, 2016 and Research & Development, 2014-2016
Figure 15.1: Military Personnel Health Monitoring Bioinformatics Share Analysis by Type (2016)
Figure 15.2: Military Personnel Health Monitoring Bioinformatics Market Attractiveness by Region, 2016
Agilent Technologies
ASCO
ASCP
AstraZeneca’s Centre for Genomics Research
Biomax Informatics AG
Bio-Rad
Bruker Corporation
CosmosID
DNAnexus, Inc.
Fisher Scientific
Genome Institute of Singapore
Health Biomed
Hewlett Packard
Illumina, Inc.
Optra HEALTH, Affymetrix, Inc.
Optra Systems
Perkinelmer, Inc.
Qiagen NV
The Florida State University
The National High Magnetic Field Laboratory
Thermo Electron
Thermo Fisher Scientific Inc.
Waters Corporation
Download sample pages
Complete the form below to download your free sample pages for Global Military Personnel Health Monitoring Bioinformatics Market Forecast 2017-2027
Related reports
-
Military Augmented Reality (MAR) Technologies Market Report 2018-2028
The spate of investments in augmented reality technology has led Visiongain to publish this timely report.
...Full DetailsPublished: 05 October 2018 -
Military Sensor Fusion Market Forecast 2019-2029
The $ 204 million military sensor fusion market is expected to flourish in the next few years because of rising...Full DetailsPublished: 26 November 2018 -
Smart Sensors in Military and Defence Market Report 2019-2029
The latest demand in Smart Sensors has led Visiongain to publish this unique report, which is crucial to your companies...Full DetailsPublished: 28 February 2019 -

Wearable Technology Market 2018-2028
Our 172-page report provides 134 tables, charts, and graphs. Read on to discover the most lucrative areas in the industry...
Full DetailsPublished: 16 January 2018 -

Military Aviation Sensors & Switches Market Report 2019-2029
Visiongain assesses the military aviation sensor and switches market to be valued at $179.5m in 2019....Full DetailsPublished: 17 April 2019 -
Military Wearable Sensors Market Report 2019-2029
Visiongain assesses the military wearable sensors market at $179m in 2019....Full DetailsPublished: 03 May 2019 -
Military Simulation, Modelling and Virtual Training Market Report 2019-2029
Developments in simulation systems related technology have had a significant impact on the defence military simulation and virtual training market.
...Full DetailsPublished: 06 December 2018
Download sample pages
Complete the form below to download your free sample pages for Global Military Personnel Health Monitoring Bioinformatics Market Forecast 2017-2027
Do you have any custom requirements we can help you with?
Any specific country, geo region, market segment or specific company information?
Email us today, we can discuss your needs and see how we can help: jamie.roberts@visiongain.com
Would you like a free report overview of the report of your choice?
If so, please drop an email to Jamie Roberts stating your chosen report title to jamie.roberts@visiongain.com
Visiongain’s reports are based on comprehensive primary and secondary research. Those studies provide global market forecasts (sales by drug and class, with sub-markets and leading nations covered) and analyses of market drivers and restraints (including SWOT analysis) and current pipeline developments. To find out more about our reports methodology, please email jamie.roberts@visiongain.com
“Thank you for this Gene Therapy R&D Market report and for how easy the process was. Your colleague was very helpful and the report is just right for my purpose. This is the 2nd good report from Visiongain and a good price.”
Dr Luz Chapa Azuella, Mexico
American Association of Colleges of Pharmacy
American College of Clinical Pharmacy
American Pharmacists Association
American Society for Pharmacy Law
American Society of Consultant Pharmacists
American Society of Health-System Pharmacists
Association of Special Pharmaceutical Manufacturers
Australian College of Pharmacy
Biotechnology Industry Organization
Canadian Pharmacists Association
Canadian Society of Hospital Pharmacists
Chinese Pharmaceutical Association
College of Psychiatric and Neurologic Pharmacists
Danish Association of Pharmaconomists
European Association of Employed Community Pharmacists in Europe
European Medicines Agency
Federal Drugs Agency
General Medical Council
Head of Medicines Agency
International Federation of Pharmaceutical Manufacturers & Associations
International Pharmaceutical Federation
International Pharmaceutical Students’ Federation
Medicines and Healthcare Products Regulatory Agency
National Pharmacy Association
Norwegian Pharmacy Association
Ontario Pharmacists Association
Pakistan Pharmacists Association
Pharmaceutical Association of Mauritius
Pharmaceutical Group of the European Union
Pharmaceutical Society of Australia
Pharmaceutical Society of Ireland
Pharmaceutical Society Of New Zealand
Pharmaceutical Society of Northern Ireland
Professional Compounding Centers of America
Royal Pharmaceutical Society
The American Association of Pharmaceutical Scientists
The BioIndustry Association
The Controlled Release Society
The European Federation of Pharmaceutical Industries and Associations
The European Personalised Medicine Association
The Institute of Clinical Research
The International Society for Pharmaceutical Engineering
The Pharmaceutical Association of Israel
The Pharmaceutical Research and Manufacturers of America
The Pharmacy Guild of Australia
The Society of Hospital Pharmacists of Australia
Don’t Miss Out!
Subscribe to receive the latest Industry news, trending insight and analysis straight to your inbox.Choose your preferences:
Latest Pharma news
Retinal Gene Therapy Market
The global Retinal Gene Therapy market is projected to grow at a CAGR of 9.6% by 2034
26 July 2024
HIV Drugs and Injectables Market
The global HIV Drugs & Injectables market is projected to grow at a CAGR of 4.6 % by 2034
24 July 2024
Digital Twin Technology in Pharmaceutical Manufacturing Market
The global Digital Twin Technology in Pharmaceutical Manufacturing market is projected to grow at a CAGR of 31.3% by 2034
23 July 2024
Specialty Pharma Market
The global Specialty Pharma market is projected to grow at a CAGR of 7.5% by 2034
22 July 2024


