Checkpoint Inhibitors for Treating Cancer – our new study reveals trends, R&D progress, and predicted revenues
Where is the Checkpoint Inhibitors for Treating Cancer market heading? If you are involved in this sector you must read this newly updated report. Visiongain’s report shows you the potential revenues streams to 2028, assessing data, trends, opportunities and business prospects there.
Discover How to Stay Ahead
Our 161-page report provides 107 tables, charts, and graphs. Read on to discover the most lucrative areas in the industry and the future market prospects. Our new study lets you assess forecasted sales at overall world market and regional level. See financial results, trends, opportunities, and revenue predictions. Much opportunity remains in this growing Checkpoint Inhibitors for Treating Cancer market. See how to exploit the opportunities.
Forecasts to 2028 and other analyses reveal the commercial prospects
• In addition to revenue forecasting to 2028, our new study provides you with recent results, growth rates, and market shares.
• You find original analyses, with business outlooks and developments.
• Discover qualitative analyses (including market dynamics, drivers, opportunities, restraints and challenges), product profiles and commercial developments.
Discover sales predictions for the world market and submarkets
Along with revenue prediction for the overall world market, there are forecasts for 3 submarkets and 5 Drugs in the report at a global level, as well as profiles for 14 pipeline drug candidates
Global Checkpoint Inhibitors for Treating Cancer Market by Type
• PD-1 Inhibitors
• CLTA-4 Inhibitors
• Pipeline Drugs
Global Checkpoint Inhibitors for Treating Cancer Market by Drug
• Opdivo (nivolumab)
• Keytruda (pembrolizumab)
• Yervoy (ipilimumab)
• Tecentriq (Atezolizumab)
• Tremelimumab (CP-675,206)
In addition to the revenue predictions for the overall world market and segments, you will also find revenue forecasts for 8 major regional/national markets:
• The US
• Japan
• Germany
• The UK
• Italy
• France
• Spain
• Asia-Pacific
The report also includes profiles and for some of the leading companies in the Checkpoint Inhibitors for Treating Cancer market, with a focus on this segment of these companies’ operations.
There will be growth in both established and in developing countries. Our analyses show that the both developed and developing markets, the US, the UK and the APAC region in particular, will continue to achieve high revenue growth to 2028.
Leading companies and the potential for market growth
Overall world revenue for Checkpoint Inhibitors for Treating Cancer will surpass $7.9bn in 2018, our work calculates. We predict strong revenue growth through to 2027.
Our work identifies which organisations hold the greatest potential. Discover their capabilities, progress, and commercial prospects, helping you stay ahead.
How the Checkpoint Inhibitors for Treating Cancer Market report helps you
In summary, our 161-page report provides you with the following knowledge:
• Revenue forecasts to 2027 for the Checkpoint Inhibitors for Treating Cancer market, with forecasts for 3 submarkets and 5 Drugs, each forecasted at a global level – discover the industry’s prospects, finding the most lucrative places for investments and revenues
• Revenue forecasts to 2028 for 8 key regional and national markets – See forecasts for the Checkpoint Inhibitors for Treating Cancer in Asia-Pacific, the US, Germany, France, the UK, Italy, France, and Japan,
• What stimulates and restrains companies and the market
• Prospects for established firms and those seeking to enter the market – including company profiles for some of the major companies involved in the Checkpoint Inhibitors for Treating Cancer market
Find quantitative and qualitative analyses with independent predictions. Receive information that only our report contains, staying informed with this invaluable business intelligence.
Information found nowhere else
With our newly updated report title, you are less likely to fall behind in knowledge or miss out on opportunities. See how our work could benefit your research, analyses, and decisions.
Visiongain’s study is for everybody needing commercial analyses for the Checkpoint Inhibitors for Treating Cancer market and leading companies. You will find data, trends and predictions.
Get our report today Checkpoint Inhibitors for Treating Cancer Market Report 2018-2028: Analysing Prospects for PD-1 Inhibitors, CLTA-4 Inhibitors and Pipeline Drugs.
Visiongain is a trading partner with the US Federal Government
CCR Ref number: KD4R6
1. Report Overview
1.1 Global Overview of the Checkpoint Inhibitor Anti-Cancer Treatment Market 2017
1.2 Benefits of This Report
1.3 How This Report Delivers
1.4 Key Questions Answered by This Analytical Report
1.5 Who is This Report For?
1.6 Methods of the Study
1.7 Frequently Asked Questions (FAQ)
1.8 Associated Visiongain Reports
1.9 About Visiongain
2. Introduction to the Checkpoint Inhibitor Anti-Cancer World Market 2017
2.1 Checkpoint Inhibitors: A New Era in Immunotherapy
2.2 Checkpoint Inhibitor Drug Treatments in Oncology
3. Leading Checkpoint Inhibitors: Anti-Cancer Drug Forecasts 2018-2028 and Leading Companies in the World Market
3.1 Leading Checkpoint Inhibitor Anti-Cancer Drug Treatments on the Market in 2017
3.1.1 Yervoy (ipilimumab) – Bristol-Myers Squibb
3.1.1.1 Yervoy: Sales Analysis
3.1.2 Opdivo (nivolumab) – Bristol-Myers Squibb/Ono Pharmaceutical
3.1.2.1 Opdivo: Sales Analysis
3.1.3 Keytruda (pembrolizumab) – Merck & Co.
3.1.3.1 Keytruda: Sales Analysis
3.2 Leading Companies in the Checkpoint Inhibitor Anti-Cancer Treatment Market in 2017
3.2.1 Bristol-Myers Squibb Leads the Market
4. Checkpoint Inhibitor Anti-Cancer Treatment: World Market 2018-2028
4.1 The Global Market for Checkpoint Inhibitor Anti-Cancer Treatments in 2017
4.2 The World Anti-Cancer Checkpoint Inhibitor Market: Revenue Forecasts 2018-2028
4.3 Leading Checkpoint Inhibitor Treatment Submarkets Forecast 2018-2028
4.3.1 The CTLA-4 Inhibitors Submarket Forecast 2018-2028
4.3.2 The PD-1 Inhibitors Submarket Forecast 2018-2028
4.3.3 Changing Market Shares: PD-1 Inhibitors Will Lead the Market
4.3.4 Market Dynamics of the Checkpoint Inhibitor Anti-Cancer Treatment Market 2018-2028
4.3.4.1 Drivers of the Checkpoint Inhibitor Anti-Cancer Treatment Market
4.3.4.1.1 Increasing Prevalence of Cancer
4.3.4.1.2 Increasing Adoption Of Immunotherapy
4.3.4.1.3 Increasing Cancer Awareness
4.3.4.2 Restraints of the Checkpoint Inhibitor Anti-Cancer Treatment Market
4.3.4.2.1 Expensive Nature of Treatment
4.3.4.2.2 High Attrition Rates
4.3.4.3 Opportunity of the Checkpoint Inhibitor Anti-Cancer Treatment Market
4.3.4.3.1 Increasing Demand Of Checkpoint Inhibitors In Emerging Markets
4.3.4.3.2 Immunotherapy Showing Increased Efficacy Over Chemotherapy
4.3.4.4 Trends of the Checkpoint Inhibitor Anti-Cancer Treatment Market
4.3.4.4.1 Collaborations And Mergers In This Market
5. Leading National Markets for the Checkpoint Inhibitor Anti-Cancer Treatment Market 2018-2028
5.1 Regional Breakdown of the World Checkpoint Inhibitor Anti-Cancer Treatments Market 2018-2028
5.2 World Checkpoint Inhibitor Anti-Cancer Treatment Market: Regional Forecast 2018-2028
5.2.1 How Will Regional Market Shares Change to 2027?
5.3 The US Checkpoint Inhibitor Anti-Cancer Treatment Market Forecast 2018-2028
5.4 The EU Checkpoint Inhibitor Anti-Cancer Treatment Market Forecast 2018-2028
5.4.1 Germany: The Checkpoint Inhibitor Anti-Cancer Treatment Market Forecast 2018-2028
5.4.2 France: The Checkpoint Inhibitor Anti-Cancer Treatment Market Forecast 2018-2028
5.4.3 Italy: The Checkpoint Inhibitor Anti-Cancer Treatment Market Forecast 2018-2028
5.4.4 The UK: The Checkpoint Inhibitor Anti-Cancer Treatment Market Forecast 2018-2028
5.4.5 Spain: The Checkpoint Inhibitor Anti-Cancer Treatment Market Forecast 2018-2028
5.5 Japan: The Checkpoint Inhibitor Anti-Cancer Treatment Market Forecast 2018-2028
5.6 The APAC Market: Checkpoint Inhibitor Anti-Cancer Treatment Market Forecast 2018-2028
6. The Checkpoint Inhibitor Anti-Cancer Treatment Market Pipeline Analysis 2018-2028
6.1 Anti-PD-1 Inhibitors and Anti-PD-L1 Inhibitors
6.1.1 Tecentriq (Atezolizumab)
6.1.2 Pidilizumab (CT-011) – CureTech Ltd
6.1.3 AMP-224 – GSK/Amplimmune
6.1.4 REGN2810 – Regeneron/Sanofi
6.2 CTLA-4 Inhibitors
6.2.1 Tremelimumab (CP-675,206) - AstraZeneca
6.3 LAG-3 (lymphocyte activation gene-3) Inhibitors
6.3.1 IMP321- Prima Biomed
6.3.2 BMS-986016 - Bristol-Myers Squibb
6.3.3 IMP701 – Prima BioMed/Novartis
6.4 KIR Inhibitors
6.4.1 Lirilumab (IPH2102/BMS-986015) – Innate Pharma/Bristol-Myers Squibb
6.5 Anti-NKG2A Inhibitors
6.5.1 IPH2201 – Innate Pharma/AstraZeneca/MedImmune
6.6 Other Checkpoint Inhibitors
6.6.1 VISTA Inhibitors
6.6.1.1 CA-170 – Curis Inc/Aurigene Discovery Technologies
6.6.1.2 NLG919 – NewLink Genetics
6.6.1.3 INCB024360 – Incyte/Roche
6.6.2 A2aR Inhibitors
6.6.2.1 HTL-1071 – AstraZeneca/Heptares
7. Qualitative Analysis of the Checkpoint Inhibitor Anti-Cancer Treatment Market 2018-2028
7.1 SWOT Analysis of the Checkpoint Inhibitor Anti-Cancer Treatment Market 2018-2028
7.2 Strengths and Weaknesses of the Checkpoint Inhibitor Anti-Cancer Treatment Market
7.2.1 A Novel Treatment Method that Harnesses the Immune System’s Vast Potential
7.2.2 Pricing of the Treatments Will Attract Companies
7.2.3 Cost of Treatment Will Restrain Market Access
7.2.4 Side Effects May Prohibit Growth
7.3 Opportunities and Threats for the Checkpoint Inhibitor Anti-Cancer Treatment Market
7.3.1 Biomarkers Pave the Way for Optimum Utility
7.3.2 Combination Therapies Are Achieving Superior Results
7.3.3 The Cost Burden of Expensive Drug Treatments on Healthcare Systems
7.3.4 Crowding of the Market with Similar Products
8. Company Profiles
8.1 AstraZeneca Plc.
8.1.1 Company Overview
8.1.2 Key Developments
8.2 Bristol-Myers Squibb Co.
8.2.1 Company Overview
8.2.2 Key Developments
8.3 Celldex Therapeutics Inc.
8.3.1 Company Overview
8.3.2 Key Developments
8.4 Incyte Corporation
8.4.1 Company Overview
8.4.2 Key Developments
8.5 Merck & Co., Inc.
8.5.1 Company Overview
8.5.2 Key Developments
8.6 Novartis Ag
8.6.1 Company Overview
8.6.2 Key Developments
8.7 Pfizer Inc.
8.7.1 Company Overview
8.7.2 Key Developments
8.8 Roche Holding Ag
8.8.1 Company Overview
8.8.2 Key Developments
9. Conclusions
9.1 The Global Checkpoint Inhibitor Anti-Cancer Treatment Market: Current World Outlook
9.1.1 Driver for Growth: A Robust and Innovative Pipeline for the Checkpoint Inhibitors Anti-Cancer Treatment Market to 2028
9.2 Leading National Markets for the Checkpoint Inhibitor Anti-Cancer Treatment Market 2018-2028: The US and EU Will Retain Their Lead
9.3 The Future of the Checkpoint Inhibitor Anti-Cancer Treatment Market
Visiongain Report Sales Order Form
About Visiongain
Visiongain report evaluation form
Associated Visiongain Reports
List of Figures
Figure 1.1 Global Checkpoint Inhibitor Anti-Cancer Treatment Market Segmentation Overview, 2017
Figure 3.1 Yervoy (ipilimumab): Historical Sales ($bn), 2013-2016
Figure 3.2 Yervoy Forecast, Revenue ($bn), 2017-2028
Figure 3.3 Opdivo Forecast, Revenue ($bn), 2017-2028
Figure 3.4 Keytruda Forecast, Revenue ($bn),2017-2028
Figure 3.5 Leading Companies in the Checkpoint Inhibitor Anti-Cancer Market by Revenue: Market Shares, 2017
Figure 4.1 Global Market for Anti-Cancer Checkpoint Inhibitors: Market Shares by Class (%), 2017
Figure 4.2 Global Market Forecast for Anti-Cancer Checkpoint Inhibitors by Class: Market Sizes ($bn), 2017-2028
Figure 4.3 Global Market for Anti-Cancer Checkpoint Inhibitors: Market Shares by Class (%), 2017
Figure 4.4 Global Market Forecast for CTLA-4 Inhibitors: Revenue ($bn), 2017-2028
Figure 4.5 Global Market Forecast for PD-1 Inhibitors: Revenue ($bn), 2017-2028
Figure 4.6 Global Market for Anti-Cancer Checkpoint Inhibitors: Market Shares by Class (%), 2023
Figure 4.7 Global Market for Anti-Cancer Checkpoint Inhibitors: Market Shares by Class (%), 2028
Figure 5.1 Regional and National Breakdown of the Checkpoint Inhibitor Cancer Treatment Market: Market Shares (%), 2017
Figure 5.2 Forecast of Regional and National Checkpoint Inhibitor Cancer Treatment Markets: Market Sizes ($bn), 2017-2028
Figure 5.3 Forecast of Regional and National Checkpoint Inhibitor Cancer Treatment Markets: Market Shares (%), 2023
Figure 5.4 Forecast of Regional and National Checkpoint Inhibitor Cancer Treatment Markets: Market Shares (%), 2028
Figure 5.5 Forecast of the US Checkpoint Inhibitor Cancer Treatment Market: Market Size ($bn), 2017-2028
Figure 5.6 Forecast of the EU Checkpoint Inhibitor Cancer Treatment Market: Market Size ($bn), 2017-2028
Figure 5.7 EU Market for the Checkpoint Inhibitor Cancer Treatment by Leading Country (%), 2017
Figure 5.8 Forecast of the EU Checkpoint Inhibitor Cancer Treatment Market, Market Sizes ($bn), 2017-2028
Figure 5.9 Forecast of the German Checkpoint Inhibitor Cancer Treatment Market: Market Size ($bn), 2017-2028
Figure 5.10 Forecast of the French Checkpoint Inhibitor Cancer Treatment Market: Market Size ($bn), 2018-2028
Figure 5.11 Forecast of the Italian Checkpoint Inhibitor Cancer Treatment Market: Market Size ($bn), 2017-2028
Figure 5.12 Forecast of the UK Checkpoint Inhibitor Cancer Treatment Market: Market Size ($bn), 2017-2028
Figure 5.13 Forecast of the Spanish Checkpoint Inhibitor Cancer Treatment Market: Market Size ($bn), 2017-2028
Figure 5.14 Forecast of the Japanese Checkpoint Inhibitor Cancer Treatment Market: Market Size ($bn), 2017-2028
Figure 5.15 Forecast of the APAC Checkpoint Inhibitor Cancer Treatment Market: Market Size ($bn), 2017-2028
Figure 6.1 Tecentriq Forecast: Revenue ($bn), 2018-2028
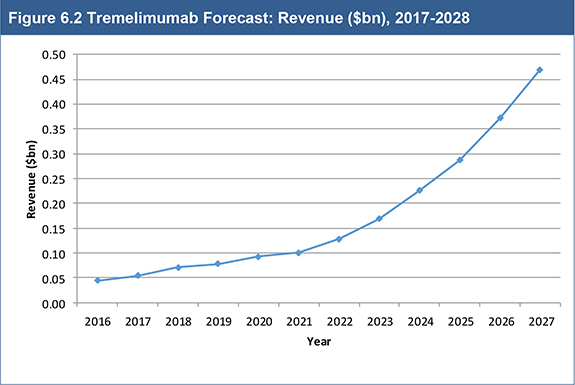
Figure 6.2 Tremelimumab Forecast: Revenue ($bn), 2017-2028
Figure 9.1 Checkpoint Inhibitor Anti-Cancer Drug Treatment Market Forecast by Class: Market Sizes ($bn), 2017-2028
Figure 9.2 Checkpoint Inhibitor Anti-Cancer Treatment Market Forecasts by Region: Market Size ($bn), 2017, 2019, 2023, and 2028
List of Tables
Table 2.1 Main Types of Checkpoint Inhibitors in Development, 2017
Table 3.1 Yervoy (Ipilimumab): Historical Sales ($bn, AGR%), 2013-2016
Table 3.2 Yervoy Forecast, Revenue ($bn), Annual Growth (%), CAGR (%), 2017-2023
Table 3.3 Yervoy Forecast, Revenue ($bn), Annual Growth (%), CAGR (%), 2023-2028
Table 3.4 Opdivo Forecast, Revenue ($bn), Annual Growth (%), CAGR (%), 2017-2023
Table 3.5 Opdivo Forecast, Revenue ($bn), Annual Growth (%), CAGR (%), 2023-2028
Table 3.6 Keytruda Forecast, Revenue ($bn), Annual Growth (%), CAGR (%), 2017-2023
Table 3.7 Keytruda Forecast, Revenue ($bn), Annual Growth (%), CAGR (%),2023-2028
Table 3.8 Leading Companies in the Checkpoint Inhibitor Treatment Market: Revenue ($bn), Market Share (%), 2017
Table 4.1 Global Market for Anti-Cancer Checkpoint Inhibitors: Revenues ($bn) and Market Shares (%) by Class, 2017
Table 4.2 Checkpoint Inhibitors by Revenue ($bn), 2017
Table 4.3 Checkpoint Inhibitors by Revenue ($bn), 2018
Table 4.4 Global Market Forecast for Anti-Cancer Checkpoint Inhibitors by Class: Market Sizes ($bn), Annual Growth Rates (%), CAGR (%), 2017-2023
Table 4.5 Global Market Forecast for Anti-Cancer Checkpoint Inhibitors by Class: Market Sizes ($bn), Annual Growth Rates (%), CAGR (%), 2023-2028
Table 4.6 Global Market for Anti-Cancer Checkpoint Inhibitors: Revenues ($bn) and Market Shares (%) by Class, 2017
Table 4.7 Global Market Forecast for CTLA-4 Inhibitors: Revenue ($bn), Annual Growth Rate (%), CAGR (%), 2017-2023
Table 4.8 Global Market Forecast for CTLA-4 Inhibitors: Revenue ($bn), Annual Growth Rate (%), CAGR (%), 2023-2028
Table 4.9 Global Market Forecast for PD-1 Inhibitors: Revenue ($bn), Annual Growth Rate (%), CAGR (%), 2017-2023
Table 4.10 Global Market Forecast for PD-1 Inhibitors: Revenue ($bn), Annual Growth Rate (%), CAGR (%), 2023-2028
Table 4.11 Global Market Forecast for Anti-Cancer Checkpoint Inhibitors by Class: Market Shares (%), 2017-2023
Table 4.12 Global Market Forecast for Anti-Cancer Checkpoint Inhibitors by Class: Market Shares (%), 2023-2028
Table 5.1 Regional and National Breakdown of the Checkpoint Inhibitor Cancer Treatment Market: Market Sizes ($bn), Market Shares (%), 2017
Table 5.2 Forecast of Regional and National Checkpoint Inhibitor Cancer Treatment Markets: Market Sizes ($bn), Annual Growth (%), CAGRs (%),2017-2023
Table 5.3 Forecast of Regional and National Checkpoint Inhibitor Cancer Treatment Markets: Market Sizes ($bn), Annual Growth (%), CAGRs (%), 2023-2028
Table 5.4 Forecast of Regional and National Checkpoint Inhibitor Cancer Treatment Markets: Market Shares (%), 2017-2023
Table 5.5 Forecast of Regional and National Checkpoint Inhibitor Cancer Treatment Markets: Market Shares (%), 2023-2028
Table 5.6 Forecast of the US Checkpoint Inhibitor Cancer Treatment Market: Market Size ($bn), Annual Growth (%), CAGR (%), 2017-2023
Table 5.7 Forecast of the US Checkpoint Inhibitor Cancer Treatment Market: Market Size ($bn), Annual Growth (%), CAGR (%), 2023-2028
Table 5.8 EU Market Shares (%), 2017-2023
Table 5.9 EU Market Shares (%), 2023-2028
Table 5.10 Forecast of the EU Checkpoint Inhibitor Cancer Treatment Market: Market Size ($bn), Annual Growth (%), CAGR (%), 2017-2023
Table 5.11 Forecast of the EU Checkpoint Inhibitor Cancer Treatment Market: Market Size ($bn), Annual Growth (%), CAGR (%), 2023-2028
Table 5.12 Forecast of the German Checkpoint Inhibitor Cancer Treatment Market: Market Size ($bn), Annual Growth (%), CAGR (%), 2017-2023
Table 5.13 Forecast of the German Checkpoint Inhibitor Cancer Treatment Market: Market Size ($bn), Annual Growth (%), CAGR (%), 2023-2028
Table 5.14 Forecast of the French Checkpoint Inhibitor Cancer Treatment Market: Market Size ($bn), Annual Growth (%), CAGR (%), 2017-2023
Table 5.15 Forecast of the French Checkpoint Inhibitor Cancer Treatment Market: Market Size ($bn), Annual Growth (%), CAGR (%), 2023-2028
Table 5.16 Forecast of the Italian Checkpoint Inhibitor Cancer Treatment Market: Market Size ($bn), Annual Growth (%), CAGR (%), 2017-2023
Table 5.17 Forecast of the Italian Checkpoint Inhibitor Cancer Treatment Market: Market Size ($bn), Annual Growth (%), CAGR (%), 2023-2028
Table 5.18 Forecast of the UK Checkpoint Inhibitor Cancer Treatment Market: Market Size ($bn), Annual Growth (%), CAGR (%), 2017-2023
Table 5.19 Forecast of the UK Checkpoint Inhibitor Cancer Treatment Market: Market Size ($bn), Annual Growth (%), CAGR (%), 2023-2028
Table 5.20 Forecast of the Spanish Checkpoint Inhibitor Cancer Treatment Market: Market Size ($bn), Annual Growth (%), CAGR (%), 2017-2023
Table 5.21 Forecast of the Spanish Checkpoint Inhibitor Cancer Treatment Market: Market Size ($bn), Annual Growth (%), CAGR (%), 2023-2028
Table 5.22 Forecast of the Japanese Checkpoint Inhibitor Cancer Treatment Market: Market Size ($bn), Annual Growth (%), CAGR (%), 2017-2023
Table 5.23 Forecast of the Japanese Checkpoint Inhibitor Cancer Treatment Market: Market Size ($bn), Annual Growth (%), CAGR (%), 2023-2028
Table 5.24 Forecast of the APAC Checkpoint Inhibitor Cancer Treatment Market: Market Size ($bn), Annual Growth (%), CAGR (%), 2017-2023
Table 5.25 Forecast of the APAC Checkpoint Inhibitor Cancer Treatment Market: Market Size ($bn), Annual Growth (%), CAGR (%), 2023-2028
Table 6.1 Selected Combination Therapies for Atezolizumab, 2016
Table 6.2 Tecentriq Forecast: Revenue ($bn), 2017-2022
Table 6.3 Tecentriq Forecast: Revenue ($bn), 2022-2027
Table 6.8 Tremelimumab Forecast: Revenue ($bn), 2017-2028
Table 6.9 Tremelimumab Forecast: Revenue ($bn), 2023-2028
Table 7.1 Strengths and Weaknesses of the Checkpoint Inhibitor Cancer Treatment Market, 2016
Table 7.2 Opportunities and Threats of the Checkpoint Inhibitor Cancer Treatment Market, 2015
Table 8.1 AstraZeneca PLC. Profile 2016 (CEO, Total Company Sales $m, Sales in the Market $m, Net Income / Loss $m, Net Capital Expenditure $m, Strongest Business Region, Business Segment in the Market, HQ, Founded, No. of Employees, Ticker, Website)
Table 8.2:AstraZeneca: Key Developments
Table 8.3 Bristol-Myers Squibb Co. Profile 2016 (CEO, Total Company Sales $m, Sales in the Market $m, Net Income / Loss $m, Net Capital Expenditure $m, Strongest Business Region, Business Segment in the Market, HQ, Founded, No. of Employees, Ticker, Website)
Table 8.4: Bristol-Myers Squibb: Key Developments
Table 8.4: Bristol-Myers Squibb: Key Developments
Table 8.4: Bristol-Myers Squibb: Key Developments
Table 8.5 Celldex Therapeutics Inc. Profile 2016 (CEO, Total Company Sales $m, Sales in the Market $m, Net Income / Loss $m, Net Capital Expenditure $m, Strongest Business Region, Business Segment in the Market, HQ, Founded, No. of Employees, Ticker, Website)
Table 8.6: Celldex Therapeutics: Key Developments
Table 8.7 Incyte Corporation Profile 2016 (CEO, Total Company Sales $m, Sales in the Market $m, Net Income / Loss $m, Net Capital Expenditure $m, Strongest Business Region, Business Segment in the Market, HQ, Founded, No. of Employees, Ticker, Website)
Table 8.8: Incyte: Key Developments
Table 8.8: Incyte: Key Developments
Table 8.9 Merck & Co., Inc. Profile 2016 (CEO, Total Company Sales $m, Sales in the Market $m, Net Income / Loss $m, Net Capital Expenditure $m, Strongest Business Region, Business Segment in the Market, HQ, Founded, No. of Employees, Ticker, Website)
Table 8.10: Merck & Co.: Key Developments
Table 8.10: Merck & Co.: Key Developments
Table 8.11 Novartis AG Profile 2016 (CEO, Total Company Sales $m, Sales in the Market $m, Net Income / Loss $m, Net Capital Expenditure $m, Strongest Business Region, Business Segment in the Market, HQ, Founded, No. of Employees, Ticker, Website)
Table 8.12: Novartis: Key Developments
Table 8.13 Pfizer Inc. Profile 2016 (CEO, Total Company Sales $m, Sales in the Market $m, Net Income / Loss $m, Net Capital Expenditure $m, Strongest Business Region, Business Segment in the Market, HQ, Founded, No. of Employees, Ticker, Website)
Table 8.14: Pfizer: Key Developments
Table 8.15: Roche Holding AG Profile 2016 (CEO, Total Company Sales CHF m, Sales in the Market CHF m, Net Income / Loss CHF m, Net Capital Expenditure CHF m, Strongest Business Region, Business Segment in the Market, HQ, Founded, No. of Employees, Ticker, Website)
Table 8.16: Roche: Key Developments
Table 9.1 Checkpoint Inhibitor Anti-Cancer Treatment Market Forecast by Region: Market Size ($bn), Market Share (%), CAGR (%), 2017, 2019, 2023, and 2028
Table 9.2 Checkpoint Inhibitor Anti-Cancer Treatment Drugs Market Forecasts by Class: Market Size ($bn), Market Share (%), CAGR (%), 2017, 2019, 2023, and 2028