The global biosimilar monoclonal antibodies market is expected to reach $5.9bn in 2023 and is estimated to grow at a CAGR of 19% from 2016 to 2028.
How this report will benefit you
Read on to discover how you can exploit the future business opportunities emerging in this sector.
In this brand new 204-page report you will receive 72 tables and 74 figures– all unavailable elsewhere.
The 204-page report provides clear detailed insight into the global biosimilar monoclonal antibodies market. Discover the key drivers and challenges affecting the market.
By ordering and reading our brand new report today you stay better informed and ready to act.
Report Scope
• Global Biosimilar Monoclonal Antibodies Market forecasts from 2018-2028
• Along with revenue prediction for the overall world market for biosimilar monoclonal antibodies, our investigation shows forecasts to 2028 for the market segmented by compound:
• Infliximab
• Rituximab
• Abciximab
• Trastuzumab
• Adalimumab
• Bevacizumab
• This report also shows revenue to 2028 for individual biosimilar mAb products in the market:
• Remsima/Inflectra
• Infimab
• Reditux
• BI695500
• CT-P10
• BI695501
• FKB327
• FKB238
• Mabtas
• AcellBia
• Maball
• Clotinab
• Abcixirel
• BCD-022
• BCD-021
• Herzuma
• CANMAB/Hertraz
• Our analyses show individual revenue forecasts to 2028 for these regional and national markets:
• The US Biosimilar mAb Market
• Japanese Biosimilar mAb Market
• EU5 Biosimilar mAb Markets
• BRIC and South Korea Biosimilar mAb Markets
• Rest of the World Biosimilar mAb Market
• This report profiles 10 leading companies either with biosimilar mAbs already on the market or in the pipeline
• Our study discusses strengths, weaknesses, opportunities and threats affecting the biosimilar monoclonal antibodies market
Visiongain’s study is intended for anyone requiring commercial analyses for the biosimilars monoclonal antibodies market. You find data, trends and predictions.
Buy our report today Global Biosimilar Monoclonal Antibodies Forecast 2018-2028: Biosimilar Versions of Infliximab, Rituximab, Trastuzumab, Adalimumab, Bevacizumab and Abciximab.
Visiongain is a trading partner with the US Federal Government
CCR Ref number: KD4R6
1. Report Overview
1.1 Overview of Biosimilar Monoclonal Antibodies: R&D, Industry and Market
1.2 Why You Should Read this Report
1.3 How This Study Delivers
1.4 Main Questions Answered by the Analysis
1.5 Who is This Investigation For?
1.6 Method of Research and Analysis
1.7 Frequently Asked Questions (FAQs)
1.8 Associated visiongain Reports
1.9 About visiongain
2. Introduction to Biosimilar Monoclonal Antibodies
2.1 Natural Antibodies: Key to the Immune System
2.2 From Serum therapy to Monoclonal Antibodies
2.3 Humanising the mAb
2.4 Biologics (Biological Drugs) and Biosimilars
2.5 Why are Biosimilars in High Demand?
2.6 Considerations for the Development of Biosimilars
2.6.1 Biologics and Biosimilars Are Large, Complex Molecules
2.6.2 How Much of a Concern is Immunogenicity?
2.7 Biosimilar Monoclonal Antibodies Currently on the Market
3. The Global Market for Biosimilar Monoclonal Antibodies, 2018-2028
3.1 The Present Global Market for Biosimilar Monoclonal Antibodies
3.2 The Global Market for Biosimilar mAbs: A Revenue Forecast, 2016-2028
3.3 The Global Market for Biosimilar mAbs by Compound: Predictions for Revenue and Market Share in 2023 and 2028
3.4 The World Market for Biosimilar mAbs by Compound: Revenue Forecasts, 2016-2028
3.4.1 Will Biosimilar Versions of Monoclonal Antibodies Capture a Large Proportion of the Market?
3.4.2 Biosimilar Infliximab
3.4.3 Biosimilar Rituximab
3.4.4 Biosimilar Abciximab
3.4.5 Biosimilar Trastuzumab
3.4.6 Biosimilar Adalimumab
3.4.7 Biosimilar Bevacizumab
3.5 Drivers and Restraints for the Biosimilar mAb market 2018-2028
3.5.1 Driving Factors of the Biosimilar mAb Market 2018-2028
3.6 Restraining Factors of the Biosimilar mAb Market 2018-2028
4. Individual Biosimilar mAb Products: Marketed and Pipeline Drugs, 2018-2028
4.1 Biosimilar mAbs on the Market in 2017
4.1.1 Celltrion’s Remsima/ Hospira’s Inflectra/ Egis’ Flammegis (Infliximab): The First Official Biosimilar Monoclonal Antibody
4.1.2 Infimab (Infliximab): Launched a Quarter Ahead of Schedule
4.1.3 Dr Reddy’s Reditux (Rituximab): No Application for EU or US Approval
4.1.4 Intas Pharmaceuticals’ Mabtas (Rituximab)
4.1.5 AcellBia (Rituximab): Sales in Russia Generating Large Revenue Figures
4.1.6 MABALL: Faces Competition from other Biosimilar Rituximabs in India
4.1.7 Isu Abxis’ Clotinab (abciximab):
4.1.8 AbcixiRel: The First Indian Abciximab Biosimilar
4.1.9 Herzuma (Trastuzumab): Approved in South Korea
4.1.10 CANMAb/Hertraz (Trastuzumab)
4.2 Pipeline Biosimilars
4.2.1 BI695500 (Rituximab)
4.2.2 CT-P10 (Rituximab): Celltrion’s Reputation for Biosimilars will Assist Sales
4.2.3 Boehringer Ingelheim’s BI695501 (Adalimumab)
4.2.4 BCD-022 (Trastuzumab): Approved in Russia
4.2.5 Fujifilm Kyowa Kirin Biologics’ FKB327 (Adalimumab)
4.2.6 Fujifilm Kyowa Kirin Biologics’ FKB238 (Bevacizumab)
4.2.7 BCD-021 (Bevacizumab): Russia Will Contribute the Most Revenue
5. Leading National Markets for Biosimilar Monoclonal Antibodies, 2018-2028
5.1 What Were the Leading National Markets for Biosimilar mAbs in 2017?
5.2 How Will National Market Shares Change Over the Forecast Period?
5.3 India: The Current Leading Nation for Biosimilar mAbs but Growth Will Slow
5.3.1 India Releases New Biosimilar Development Guidelines
5.3.2 Indian Biosimilar Submarket Forecast 2016-2028
5.4 Russia: Lack of Regulatory Framework Works Well in the Short Term
5.4.1 Russian Government Backed ‘Pharma 2020’ Initiative
5.4.2 Russian Biosimilar mAb Revenue Forecast, 2016-2028
5.4 South Korean Market Has Benefitted from Early Biosimilar Guidelines
5.4.1 Significant Investment in Biosimilars in South Korea
5.4.2 South Korean Biosimilar mAb Revenue Forecast, 2016-2028
5.5 China: A Fragmented Biosimilar mAb Market
5.5.1 Chinese FDA Publishes Finalised Biosimilar Guidelines in 2017
5.5.2 China Biosimilar mAb Revenue Forecast, 2016-2028
5.6 Brazil: ANVISA’s Biosimilar Regulations Are Similar the EMA’s
5.6.1 Brazil Biosimilar mAb Revenue Forecast 2016-2028
5.7 The Outlook for Biosimilar mAbs in the EU 2016-2028
5.7.1 Updating Biosimilar Regulation: Guidelines for the Specific Approval of Biosimilar mAbs
5.7.2 Biosimilar mAbs in the EU5: Revenue Forecasts, 2016-2028
5.7.3 Germany: The Current EU Leader
5.7.4 France: Will the Uptake of Biosimilar mAbs be Restricted?
5.7.5 UK: NICE Recommends Use of Remsima for Certain Indications
5.7.6 Italy: Healthcare Spending Cuts Will Drive Growth
5.7.7 Spain: High Biosimilar mAb Discounts Expected
5.8 The Outlook for Biosimilar mAbs in Japan
5.8.1 Regulations for Naming Biosimilars
5.8.2 Biosimilar mAb Market Activity in Japan
5.8.3 Japanese Biosimilar Submarket Forecast 2016-2028
5.9 US Biosimilar mAb Outlook: None Currently on the Market
5.9.1 US FDA Biosimilar Guidelines were Released in 2015
5.9.2 Legal Challenges for Biosimilars in the US
5.9.3 State Regulation of Biosimilar Substitution
5.9.4 The US Biosimilar mAb Market Revenue Forecast, 2016-2028
5.9.5 The Mexico Biosimilar mAb Market Revenue Forecast, 2016-2028
5.9.6 The Canada Biosimilar mAb Market Revenue Forecast, 2016-2028
6. Leading Companies in the Biosimilar Monoclonal Antibodies Market
6.1 Collaboration in Biosimilar mAb Development
6.2 BioXpress
6.3 Celltrion
6.4 Harvest Moon
6.5 Genor Biopharma
6.6 Samsung Bioepsis
6.7 Mabion
6.8 Gene Techno Science
6.9 India’s Biocon
6.10 Coherus Biosciences
6.11 BIOCAD
6.12 Big Pharma and the Biosimilar mAb Market
7. Qualitative Analysis of Biosimilar Monoclonal Antibodies Market
7.1 Strengths and Weaknesses of the Biosimilar Monoclonal Antibodies Market, 2016-2028
7.1.1 Global Demand for Affordable Biopharmaceuticals has Never Been Greater
7.1.2 Adoption of Biosimilar mAbs will be Proportional to the Rate of Discount
7.1.3 Approval Pathways are Now Established in Developed Markets
7.1.4 Complexity of Protein Molecules Leads to Technical Challenges
7.1.5 Doctor and Patient Confidence May Take Time
7.2 Opportunities and Threat Facing the Biosimilar Monoclonal Antibodies Market, 2016-2028
7.2.1 Market Opportunities from Patent Expiries and a Well-Stocked Pipeline
7.2.2 Substitution may Not Occur Automatically
7.2.3 Biobetters Offer a Serious Threat to the Production and Uptake of Biosimilars
7.3 Social and Technological Forces Influencing the Biosimilar Monoclonal Antibodies Market 2016-2028
7.3.1 Social Factors: Driving or Restraining the Market?
7.3.2 Technological Factors Concentrate on Reducing Costs and Increasing Ease of Production
7.3.3 Economic Pressures Raise Demand for Biosimilar mAbs
7.3.4 Political Issues: Stringent Regulations Hurdles to Market Entry
8. Conclusions
8.1 Biosimilar Monoclonal Antibodies: World Market, 2016-2028
8.2 Future of Compounds on the Market and in the Pipeline
8.3 Leading National Markets for Biosimilar Monoclonal Antibodies 2017, 2023, 2028
8.4 Leading Companies in the Biosimilar mAb Market
8.5 Current and Expected Industry Trends 2016-2028
8.5.1 Cost Control of Healthcare Will Work in Favour mAbs
8.5.2 Upcoming Patent Expiries in Developed Markets Offer Large Market Potential
8.5.3 Complex Production Processes are a Restraining Factor
8.5.4 Clinician and Patient Confidence Must be Maximized to Ensure Uptake
8.5.5 Biobetters Pose a Threat
Appendices
Associated Visiongain Reports
Visiongain Report Sales Order Form
Appendix A
About Visiongain
Appendix B
Visiongain report evaluation form
List of Tables
Table 2.1 Classification of Monoclonal Antibodies
Table 2.2 Murine Monoclonal Antibodies on the Market
Table 2.3 Chimeric Monoclonal Antibodies on the Market
Table 2.4 Humanised Monoclonal Antibodies on the Market
Table 2.5 Fully Human Monoclonal Antibodies on the Market
Table 2.6 Revenue of Originator Monoclonal Antibody Products in 2016
Table 3.1 Global Biosimilar mAbs Market Forecast 2016-2028: Revenue ($m), AGR (%), CAGR (%)
Table 3.2 Global Market for Biosimilar mAbs: Revenues ($m) and Market Shares (%) by Reference Compound, 2017, 2023 and 2028
Table 3.3 EU and US Patent Expiry Dates for the Main mAb Reference Products
Table 3.4 Global Biosimilar mAbs Market Forecast by Reference Compound: Revenue ($m), AGR (%), CAGR (%), 2016-2028
Table 3.5 Biosimilar Infliximab: Compounds Awaiting Approval in the Pipeline
Table 3.6 Global Biosimilar Infliximab Market Forecast 2016-2028: Revenue ($m), AGR (%) and CAGR (%)
Table 3.7 Biosimilar Rituximab: Compounds (Marketed or in the Pipeline), 2018
Table 3.8 Global Biosimilar Rituximab Market Forecast 2016-2028: Revenue ($m), AGR (%) and CAGR (%)
Table 3.9 Biosimilar Abciximab: Compounds (Marketed or in the Pipeline), 2018
Table 3.10 Global Biosimilar Abciximab Market Forecast 2016-2028: Revenue ($m), AGR (%) and CAGR (%)
Table 3.11 Biosimilar Trastuzumab: Compounds Marketed and in the Pipeline, 2018
Table 3.12 Global Biosimilar Trastuzumab Market Forecast 2016-2028: Revenue ($m), AGR (%) and CAGR (%)
Table 3.13 Biosimilar Adalimumab: Compounds (Marketed or in the Pipeline) 2018
Table 3.14 Global Biosimilar Adalimumab Market Forecast 2016-2028: Revenue ($m), AGR (%), and CAGR (%)
Table 3.15 Biosimilar Bevacizumab: Compounds (Marketed or in the Pipeline) 2018
Table 3.16 Global Biosimilar Bevacizumab Market Forecast 2016-2028: Revenue ($m), AGR (%) and CAGR (%)
Table 4.1 Biosimilar mAbs on the Market in 2017: Revenues ($m) and Market Shares (%)
Table 4.2 Remsima/Inflectra/Flammegis (Infliximab) Forecast: Revenue ($m), Market Share (%), AGR (%) and CAGR (%), 2016-2028
Table 4.3 Infimab (Infliximab) Forecast: Revenue ($m), Market Share (%), AGR (%) and CAGR (%), 2016-2028
Table 4.4 Reditux (Rituximab) Forecast: Revenue ($m), Market Share (%), AGR (%) and CAGR (%), 2016-2027
Table 4.5 Mabtas (Rituximab) Forecast: Revenue ($m), Market Share (%), AGR (%) and CAGR (%), 2016-2028
Table 4.6 Biocad Distribution Partners for AcellBia, 2017
Table 4.7 AcellBia (Rituximab) Forecast: Revenue ($m), Market Share (%), AGR (%) and CAGR (%), 2016-2028
Table 4.8 MABALL (Rituximab) Forecast: Revenue ($m), Market Share (%), AGR (%) and CAGR (%), 2016-2028
Table 4.9 Clotinab (Abciximab) Forecast: Revenue ($m), Market Share (%), AGR (%) and CAGR (%), 2016-2028
Table 4.10 AbcixiRel (Abciximab) Forecast: Revenue ($m), Market Share (%), AGR (%) and CAGR (%), 2016-2028
Table 4.11 Herzuma (Trastuzumab) Forecast: Revenue ($m), Market Share (%), AGR (%) and CAGR (%), 2016-2028
Table 4.12 CANMAb/Hertraz (Trastuzumab) Forecast: Revenue ($m), Market Share (%), AGR (%) and CAGR (%), 2016-2028
Table 4.13 BI695500 (Rituximab) Forecast: Revenue ($m), Market Share (%), AGR (%) and CAGR (%), 2016-2028
Table 4.14 CT-P10 (Rituximab) Forecast: Revenue ($m), Market Share (%), AGR (%) and CAGR (%), 2018-2027
Table 4.15 BI695501 (Adalimumab) Forecast: Revenue ($m), Market Share (%), AGR (%) and CAGR (%), 2017-2028
Table 4.16 BCD-022 (Trastuzumab) Forecast: Revenue ($m), Market Share (%), AGR (%) and CAGR (%), 2016-2028
Table 4.17 FKB327 (Adalimumab) Forecast: Revenue ($m), Market Share (%), AGR (%) and CAGR (%), 2017-2028
Table 4.18 FKB238 (Bevacizumab) Forecast: Revenue ($m), Market Share (%), AGR (%) and CAGR (%), 2020-2028
Table 4.19 BCD-021 (Bevacizumab) Forecast: Revenue ($m), Market Share (%), AGR (%) and CAGR (%), 2018-2028
Table 5.1 Leading National Markets for the Global Biosimilar mAb Industry, 2017
Table 5.2 Leading National Markets for the Global Biosimilar mAb Industry, 2017, 2023, 2028
Table 5.3 The Indian Biosimilar MAb Market: Revenue ($m), Annual Growth (%) and CAGR (%) Forecast, 2016-2028
Table 5.4 The Russian Biosimilar mAb Market: Revenue ($m), Annual Growth (%) and CAGR (%) Forecast, 2016-2028
Table 5.5 The South Korean Biosimilar mAb Market: Revenue ($m), Annual Growth (%) and CAGR (%) Forecast, 2016-2028
Table 5.6 The Chinese Biosimilar mAb Market: Revenue ($m), Annual Growth (%) and CAGR (%) Forecast, 2016-2028
Table 5.7 The Brazilian Biosimilar mAb Market: Revenue ($m), Annual Growth (%) and CAGR (%) Forecast, 2016-2028
Table 5.8 The EU5 Biosimilar mAb Market: Revenue Forecast ($m), 2016-2028
Table 5.9 The German Biosimilar mAb Market: Revenue ($m), Annual Growth (%) and CAGR (%) Forecast, 2016-2028
Table 5.10 The French Biosimilar mAb Market: Revenue ($m), Annual Growth (%) and CAGR (%) Forecast, 2016-2028
Table 5.11 The UK Biosimilar mAb Market: Revenue ($m), Annual Growth (%) and CAGR (%) Forecast, 2016-2028
Table 5.12 The Italian Biosimilar mAb Market: Revenue ($m), Annual Growth (%) and CAGR (%) Forecast, 2016-2028
Table 5.13 The Spanish Biosimilar mAb Market: Revenue ($m), Annual Growth (%) and CAGR (%) Forecast, 2016-2028
Table 5.14 The Japanese Biosimilar mAb Market: Revenue ($m), Annual Growth (%) and CAGR (%) Forecast, 2016-2028
Table 5.15 Finalised FDA Biosimilar Guidelines, 2015
Table 5.16 The US Biosimilar mAb Market: Revenue ($m) and Annual Growth (%) Forecast, 2017-2028
Table 5.17 The Mexico Biosimilar mAb Market: Revenue ($m) and Annual Growth (%) Forecast, 2017-2028
Table 5.17 The Canada Biosimilar mAb Market: Revenue ($m) and Annual Growth (%) Forecast, 2017-2028
Table 6.1 Companies in the Biosimilar mAb Industry by Number of Compounds in Development, 2017
Table 6.2 Selected Collaborations for Biosimilar mAb Development, 2009-2017
Table 6.3 BioXpress: Compounds in the Pipeline, 2018
Table 6.4 Tests Carried Out by BioXpress During Biosimilar mAb Development, with Objectives
Table 6.5 Compounds in Celltrion’s Pipeline: Compound Name, Generic Name, Development Stage and Anticipated Year of Approval, 2017
Table 6.6 Genor Biopharma: Biosimilar mAbs Pipeline, 2017
Table 6.7 Mabion: Compounds in the Pipeline and Their Development Stage, 2017
Table 6.8 Gene Techno Science: Revenue ($m), from 2013-2017
Table 6.9 Biocon: Compounds in the Pipeline and Their Stage of Development, 2017
Table 6.10 Big Pharma's Positions in the Biosimilar mAb Industry, 2017
Table 7.1 Strengths and Weaknesses of the Biosimilar mAb Market, 2016-2028
Table 7.2 Opportunities and Threats Facing the Biosimilar mAb Market, 2016-2028
Table 7.3 Social and Technological Factors Influencing the Biosimilar mAb Market, 2016-2028
List of Figures
Figure 1.1 Main Compound Classes of Biosimilar mAbs, 2018
Figure 2.1 Structure of an Antibody
Figure 3.1 Global Biosimilar mAbs Market Forecast: Revenue ($m), 2016-2028
Figure 3.2 The Biosimilar mAb Market: Market Share (%) by compound in 2017
Figure 3.3 The Biosimilar mAb Market: Market Share (%) by compound in 2023
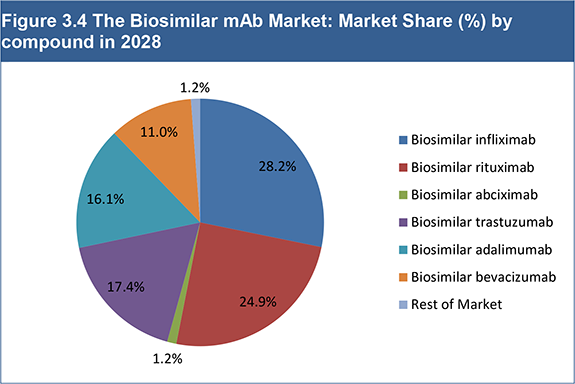
Figure 3.4 The Biosimilar mAb Market: Market Share (%) by compound in 2028
Figure 3.5 Global Biosimilar Infliximab Market Forecast: Revenue ($m), 2016-2028
Figure 3.6 Global Biosimilar Rituximab Market Forecast: Revenue ($m), 2016-2028
Figure 3.7 Global Biosimilar Abciximab Market Forecast: Revenue ($m), AGR (%), and CAGR (%)
Figure 3.8 Global Biosimilar Trastuzumab Market Forecast: Revenue ($m), 2016-2028
Figure 3.9 Global Biosimilar Adalimumab Market Forecast: Revenue ($m), 2016-2028
Figure 3.10 Global Biosimilar Bevacizumab Market Forecast: Revenue ($m), 2016-2028
Figure 3.11 Drivers and Restraints for the Global Biosimilar mAb market 2016-2028
Figure 4.1 Biosimilar mAb Versions on the Market: Market Share (%) 2017
Figure 4.2 Biosimilar mAb Versions on the Market: Market Share (%) 2023
Figure 4.3 Biosimilar mAb Versions on the Market: Market Share (%) 2028
Figure 4.4 Remsima/Inflectra/Flammegis (Infliximab): Revenue Forecast ($m), 2016-2028
Figure 4.5 Remsima/Inflectra/Flammegis (Infliximab): AGR Forecast (%), 2016-2028
Figure 4.6 Infimab (Infliximab): Revenue Forecast ($m) 2016-2028
Figure 4.7 Infimab (Infliximab): AGR Forecast (%) 2016-2028
Figure 4.8 Reditux (Rituximab): Revenue Forecast ($m) 2016-2028
Figure 4.9 Reditux (Rituximab): AGR Forecast (%) 2016-2028
Figure 4.10 Mabtas (Rituximab): Revenue Forecast ($m) 2016-2028
Figure 4.11 Mabtas (Rituximab): AGR Forecast (%) 2016-2028
Figure 4.12 AcellBia (Rituximab): Revenue Forecast ($m) 2016-2028
Figure 4.13 AcellBia (Rituximab): AGR Forecast(%) 2016-2028
Figure 4.14 MABALL (Rituximab): Revenue Forecast ($m) 2016-2028
Figure 4.15 MABALL (Rituximab): AGR Forecast (%) 2016-2028
Figure 4.16 Clotinab (Abciximab): Revenue Forecast ($m) 2016-2028
Figure 4.17 Clotinab (Abciximab): AGR Forecast (%) 2016-2028
Figure 4.18 AbcixiRel (Abciximab): Revenue Forecast ($m) 2016-2028
Figure 4.19 AbcixiRel (Abciximab): AGR Forecast (%) 2016-2028
Figure 4.20 Herzuma (Trastuzumab): Revenue Forecast ($m) 2016-2028
Figure 4.21 Herzuma (Trastuzumab): AGR Forecast (%) 2016-2028
Figure 4.22 CANMAb/Hertraz (Trastuzumab): Revenue Forecast ($m) 2016-2028
Figure 4.23 CANMAb/Hertraz (Trastuzumab): AGR Forecast (%) 2016-2028
Figure 4.24 BI695500 (Rituximab): Revenue Forecast ($m) 2018-2028
Figure 4.25 BI695500 (Rituximab): AGR Forecast (%) 2019-2028
Figure 4.26 CT-P10 (Rituximab): Revenue Forecast ($m) 2019-2028
Figure 4.27 CT-P10 (Rituximab): AGR Forecast (%) 2019-2028
Figure 4.28 BI695501 (Adalimumab): Revenue Forecast ($m) 2018-2028
Figure 4.29 BI695501 (Adalimumab): AGR Forecast (%) 2019-2028
Figure 4.30 BCD-022 (Trastuzumab): Revenue Forecast ($m) 2016-2028
Figure 4.31 BCD-022 (Trastuzumab): AGR Forecast (%) 2017-2028
Figure 4.32 FKB327 (Adalimumab): Revenue Forecast (%) 2018-2028
Figure 4.33 FKB327 (Adalimumab): AGR Forecast (%) 2019-2028
Figure 4.34 FKB238 (Adalimumab): Revenue Forecast ($m) 2020-2028
Figure 4.35 FKB238 (Adalimumab): AGR Forecast (%) 2022-2028
Figure 4.36 BCD-021 (Bevacizumab): Revenue Forecast ($m) 2017-2028
Figure 4.37 BCD-021 (Bevacizumab): AGR Forecast (%) 2018-2028
Figure 5.1 The Biosimilar MAb Market by Country: Market Shares (%) of Revenue, 2017
Figure 5.2 The Biosimilar MAb Market: National Submarket Shares (%), 2023
Figure 5.3 The Biosimilar MAb Market: National Submarket Shares (%), 2028
Figure 5.4 The Indian Biosimilar mAb Market: Revenue Forecast ($m), 2016-2028
Figure 5.5 The Russian Biosimilar mAb Market: Revenue Forecast ($m), 2016-2028
Figure 5.6 The South Korean Biosimilar mAb Market: Revenue Forecast ($m), 2016-2028
Figure 5.7 The Chinese Biosimilar mAb Market: Revenue Forecast ($m), 2016-2028
Figure 5.8 The Brazilian Biosimilar mAb Market: Revenue Forecast ($m), 2016-2028
Figure 5.9 The EU5 Biosimilar mAb Market: Grouped Revenue Forecast ($m), 2016-2028
Figure 5.10 The EU5 Biosimilar mAb Market: Revenue Forecasts ($m) by Country, 2016-2028
Figure 5.11 The German Biosimilar mAb Market: Revenue Forecast ($m), 2016-2028
Figure 5.12 The French Biosimilar mAb Market: Revenue Forecast ($m), 2016-2028
Figure 5.13 The UK Biosimilar mAb Market: Revenue Forecast ($m), 2016-2028
Figure 5.14 The Italian Biosimilar mAb Market: Revenue Forecast ($m), 2016-2028
Figure 5.15 The Spanish Biosimilar mAb Market: Revenue Forecast ($m), 2016-2028
Figure 5.16 The Japanese Biosimilar mAb Market: Revenue Forecast ($m), 2016-2028
Figure 5.17 Biosimilar mAbs in the US: Revenue Forecast ($m), 2017-2028
Figure 5.18 Biosimilar mAbs in the Mexico: Revenue Forecast ($m), 2016-2028
Figure 5.19 Biosimilar mAbs in the Canada: Revenue Forecast ($m), 2016-2028
Figure 6.1 Prominent Companies in the Biosimilar mAb Industry: Share (%) of the Pipeline (2017)
Figure 8.1 Prominent Compounds in the Biosimilar mAb Market: Comparison of Revenues ($m), 2017, 2023 and 2028
Figure 8.2 Forecasted Biosimilar mAbs: Comparison of Revenues ($m), 2017, 2023 and 2028
Figure 8.3 Leading National Markets: Revenues ($m), 2017, 2023 and 2028
Figure 8.4 Prominent Companies in the Biosimilar mAb Industry: Number of Products in Current Development or in the Pipeline, 2017