• Do you need definitive OCTG market data?
• Succinct OCTG market analysis?
• Technological insight?
• Clear competitor analysis?
• Actionable business recommendations?
Report highlights
• 203 quantitative tables, charts, and graphs
• Analysis of key players in SME technologies
• ArcelorMittal
• Continental Alloys & Services
• Iljin Steel Co. Ltd
• National Oilwell Varco
• Nippon Steel & Sumitomo Metal Corporation
• Tenaris SA
• Tianjin Pipe Corporation
• TMK
• United States Steel
• Vallourec
• Global Oil Country Tubular Goods Revenue and Volume Outlook and Analysis From 2019-2029
• One Expert Interview with Key Industry Experts
• Sales Manager – Tenaris
• Oil Country Tubular Goods Revenue and Volume Forecasts and Analysis by Grade 2019-2029
• API
• Premium
• Leading National Tubular Goods Revenue and Volume Forecasts from 2019-2029
• US Tubular Goods Forecast 2019-2029
• China Tubular Goods Forecast 2019-2029
• Russia Tubular Goods Forecast 2019-2029
• Canada Tubular Goods Forecast 2019-2029
• GCC Tubular Goods Forecast 2019-2029
• Rest of the World Tubular Goods Forecast Reactor Forecast 2019-2029
• Key questions answered
• What does the future hold for the Oil Country Tubular Goods industry?
• Where should you target your business strategy?
• Which applications should you focus upon?
• Which companies should you form strategic alliances with?
• Which company is likely to succeed and why?
• What business models should you adopt?
• What industry trends should you be aware of?
• Target Audience
• Leading tubular goods companies
• Suppliers
• Contractors
• Technologists
• R&D staff
• Consultants
• Analysts
• CEO’s
• CIO’s
• COO’s
• Business development managers
• Investors
• Governments
• Agencies
• Industry Organisations
• Banks
Visiongain is a trading partner with the US Federal Government
CCR Ref number: KD4R6
1. Report Overview
1.1 Oil Country Tubular Goods (OCTG) Market Overview
1.2 Market Structure Overview and Market Definition
1.3 How This Report Delivers
1.4 Key Questions Answered by This Analytical Report Include:
1.5 Who is This Report For?
1.6 Methodology
1.6.1 Primary Research
1.6.2 Secondary Research
1.6.3 Market Evaluation & Forecasting Methodology
1.7 Frequently Asked Questions (FAQ)
1.8 Associated Visiongain Reports
1.9 About Visiongain
2. Introduction to the Oil Country Tubular Goods (OCTG)Market
2.1 Global Oil Country Tubular Goods (OCTG) Market Structure
2.2 Market Definition
2.3 Oil Country Tubular Goods (OCTG)-Regulatory Scenario
2.4 Oil Country Tubular Goods (OCTG)- Specification and Capability (Tubing & Casing)
2.5 Global Carbon-Steel Industry Analysis
3. Global Overview of Oil Country Tubular Goods (OCTG) Market
3.1 Regional Overview of Oil Country Tubular Goods (OCTG) Market 21028-2028
3.2 Global Oil Country Tubular Goods (OCTG) Market Drivers and Restraints
4. Global Oil Country Tubular Goods (OCTG) Submarkets Forecast 2019-2029
4.1 Global Oil Country Tubular Goods (OCTG) Submarkets Forecast, by Grade 2019-2029
4.1.1 Global Oil Country Tubular Goods (OCTG) Market, by API Forecasts 2019-2029
4.1.1.1 Global Oil Country Tubular Goods (OCTG) Market, by API Drivers & Restraints
4.1.2 Global Oil Country Tubular Goods (OCTG) Market, by Premium Forecasts 2019-2029
4.1.2.1 Global Oil Country Tubular Goods (OCTG) Market, by Premium Driver & Restraints
4.1.3 Global Oil Country Tubular Goods (OCTG) Market- Comparison Matrix (Solution Type VS Region)
4.2 Global Oil Country Tubular Goods (OCTG) Submarkets Forecast, by Application 2019-2029
4.2.1 Global Oil Country Tubular Goods (OCTG) Market, by Onshore Forecasts 2019-2029
4.2.1.1 Global Oil Country Tubular Goods (OCTG) Market, by Onshore Drivers & Restraints
4.2.2 Global Oil Country Tubular Goods (OCTG) Market, by Offshore Forecasts 2019-2029
4.2.2.1 Global Oil Country Tubular Goods (OCTG) Market, by Offshore Drivers & Restraints
4.2.3 Global Oil Country Tubular Goods (OCTG) Market- Comparison Matrix (Application VS Region)
4.3 Global Oil Country Tubular Goods (OCTG) Submarkets Forecast, by Type 2019-2029
4.3.1 Global Oil Country Tubular Goods (OCTG) Market, by Seamless Forecasts 2019-2029
4.3.1.1 Global Oil Country Tubular Goods (OCTG) Market, by Seamless Drivers & Restraints
4.3.2 Global Oil Country Tubular Goods (OCTG) Market, by Welded Forecasts 2019-2029
4.3.2.1 Global Oil Country Tubular Goods (OCTG) Market, by Welded Drivers & Restraints
4.3.3 Global Oil Country Tubular Goods (OCTG) Market- Comparison Matrix (Type VS Region)
5. Leading Nations in Oil Country Tubular Goods (OCTG) Market 2019-2029
5.1 U.S. Oil Country Tubular Goods (OCTG) Market Forecast 2019-2029
5.1.1 U.S. Oil Country Tubular Goods (OCTG) Submarket Forecast 2019-2029
5.1.1.1 U.S. Oil Country Tubular Goods (OCTG) Market Forecast by Grade 2019-2029
5.1.1.2 U.S. Oil Country Tubular Goods (OCTG) Market Forecast by Application 2019-2029
5.1.1.3 U.S. Oil Country Tubular Goods (OCTG) Market Forecast by Type 2019-2029
5.2 Canada Oil Country Tubular Goods(OCTG) Market Forecast 2019-2029
5.2.1 Canada Oil Country Tubular Goods (OCTG) Submarket Forecast 2019-2029
5.2.1.1 Canada Oil Country Tubular Goods (OCTG) Market Forecast by Grade 2019-2029
5.2.1.2 Canada Oil Country Tubular Goods (OCTG) Market Forecast by Application 2019-2029
5.2.1.3 Canada Oil Country Tubular Goods (OCTG) Market Forecast by Type 2019-2029
5.3 Russia Oil Country Tubular Goods(OCTG) Market Forecast 2019-2029
5.3.1 Russia Oil Country Tubular Goods (OCTG) Submarket Forecast 2019-2029
5.3.1.1 Russia Oil Country Tubular Goods (OCTG) Market Forecast by Grade 2019-2029
5.3.1.2 Russia Oil Country Tubular Goods (OCTG) Market Forecast by Application 2019-2029
5.3.1.3 Russia Oil Country Tubular Goods (OCTG) Market Forecast by Type 2019-2029
5.4 China Oil Country Tubular Goods(OCTG) Market Forecast 2019-2029
5.4.1 China Oil Country Tubular Goods (OCTG) Submarket Forecast 2019-2029
5.4.1.1 China Oil Country Tubular Goods (OCTG) Market Forecast by Grade 2019-2029
5.4.1.2 China Oil Country Tubular Goods (OCTG) Market Forecast by Application 2019-2029
5.4.1.3 China Oil Country Tubular Goods (OCTG) Market Forecast by Type 2019-2029
5.5 GCC Oil Country Tubular Goods(OCTG) Market Forecast 2019-2029
5.5.1 GCC Oil Country Tubular Goods (OCTG) Submarket Forecast 2019-2029
5.5.1.1 GCC Oil Country Tubular Goods (OCTG) Market Forecast by Grade 2019-2029
5.5.1.2 GCC Oil Country Tubular Goods (OCTG) Market Forecast by Application 2019-2029
5.5.1.3 GCC Oil Country Tubular Goods (OCTG) Market Forecast by Type 2019-2029
5.6 Rest of the World Oil Country Tubular Goods(OCTG) Market Forecast 2019-2029
5.6.1 Rest of the World Oil Country Tubular Goods (OCTG) Submarket Forecast 2019-2029
5.6.1.1 Rest of the World Oil Country Tubular Goods (OCTG) Market Forecast by Grade 2019-2029
5.6.1.2 Rest of the World Oil Country Tubular Goods (OCTG) Market Forecast by Application 2019-2029
5.6.1.3 Rest of the World Oil Country Tubular Goods (OCTG) Market Forecast by Type 2019-2029
6. PESTEL Analysis of the Oil Country Tubular Goods (OCTG) Market
6.1 Political Impact of OCTG Market
6.2 Economic Impact of OCTG Market
6.3 Social Impact of OCTG Market
6.4 Technological Impact of OCTG Market
6.5 Environmental Impact of OCTG Market
6.6 Legal Impact of OCTG Market
7. Expert Opinion
7.1 Primary Correspondents
7.2 Global OCTG Market Outlook
7.3 Drivers & Restraints
7.4 Dominant Region/Country in the OCTG Market
7.5 Dominant OCTG Type and Grade
7.6 Overall Growth Rate, Globally
8. Leading Companies in Oil Country Tubular Goods Market
8.1 ArcelorMittal
8.1.1 ArcelorMittal Business Overview
8.1.2 ArcelorMittal Recent Developments
8.1.3 ArcelorMittal Business Strategy
8.2 Continental Alloys & Services
8.2.1 Continental Alloys & Services Business Overview
8.2.2 Continental Alloys & Services Business Strategy
8.3 Iljin Steel Co., Ltd.
8.3.1 Iljin Steel Co., Ltd. Business Overview
8.3.2 Iljin Steel Co., Ltd. Business Strategy
8.4 National Oilwell Varco
8.4.1 National Oilwell Varco Business Overview
8.4.2 National Oilwell Varco Recent Developments
8.4.3 National Oilwell Varco Business Strategy
8.5 Nippon Steel & Sumitomo Metal Corporation
8.5.1 Nippon Steel & Sumitomo Metal Corporation Business Overview
8.5.2 Nippon Steel & Sumitomo Metal Corporation Recent Developments
8.5.3 Nippon Steel & Sumitomo Metal Corporation Business Strategy
8.6 Tenaris S.A
8.6.1 Tenaris S.A Business Overview
8.6.2 Tenaris S.A Recent Developments
8.6.3 Tenaris S.A Business Strategy
8.7 Tianjin Pipe Corporation
8.7.1 Tianjin Pipe Corporation Business Overview
8.7.2 Tianjin Pipe Corporation Recent Developments
8.7.3 Tianjin Pipe Corporation Business Strategy
8.8 TMK
8.8.1 TMK Business Overview
8.8.2 TMK Business Strategy
8.9 United States Steel
8.9.1 United States Steel Business Overview
8.9.2 United States Steel Recent Developments
8.9.3 United States Steel Business Strategy
8.10 Vallourec
8.10.1 Vallourec Business Overview
8.10.2 Vallourec Recent Developments
8.10.3 Vallourec Business Strategy
9. Conclusion & Recommendations
9.1 Recommendations
10. Glossary
Associated Visiongain Reports
Visiongain Report Sales Order Form
Appendix A
About Visiongain
Appendix B
Visiongain report evaluation form
List of Tables
Table 2.1 OCTG Seamless Casing Size Capability
Table 2.2 OCTG Seamless Tubing Size Capability
Table 2.3 World-wide Drill Rigs Count, 2018
Table 3.1 Global Oil Country Tubular Goods (OCTG) Market Forecast 2019-2029 (MT, $ bn, AGR %, CAGR %, Cumulative)
Table 3.2 Global Oil Country Tubular Goods (OCTG) Market by Regional Forecast 2019-2029 (MT, AGR %, CAGR %, Cumulative)
Table 3.3 Global Oil Country Tubular Goods (OCTG) Market by Regional Forecast 2019-2029 ($mn, AGR %, CAGR %, Cumulative)
Table 3.4 Global Oil Country Tubular Goods (OCTG) Market Drivers and Restraints
Table 4.1 Global Oil Country Tubular Goods (OCTG) Market, by Grade Type Forecast 2019-2029 ($bn, AGR %, Cumulative)
Table 4.2 Global Oil Country Tubular Goods (OCTG) Market, by API Forecast 2019-2029 (MT, $ bn, AGR %, CAGR %, Cumulative)
Table 4.3 Global Oil Country Tubular Goods (OCTG) Market, by API Drivers & Restraints
Table 4.4 Global Oil Country Tubular Goods (OCTG) Market, by Premium Forecast 2019-2029 (MT, $ bn, AGR %, CAGR %, Cumulative)
Table 4.5 Global Oil Country Tubular Goods (OCTG) Market, by Premium Drivers and Restraints
Table 4.6 Global Oil Country Tubular Goods (OCTG) Market, by Application Forecast 2019-2029 ($bn, AGR %, Cumulative)
Table 4.7 Global Oil Country Tubular Goods (OCTG) Market, by Onshore Forecast 2018-2029 (MT, $ bn, AGR %, CAGR %, Cumulative)
Table 4.8 Global Oil Country Tubular Goods (OCTG) Market, by Onshore Drivers & Restraints
Table 4.9 Global Oil Country Tubular Goods (OCTG) Market, by Offshore Forecast 2018-2029 (MT, $ bn, AGR %, CAGR %, Cumulative)
Table 4.10 Global Oil Country Tubular Goods (OCTG) Market, by Offshore Drivers and Restraints
Table 4.11 Global Oil Country Tubular Goods (OCTG) Market, by Type Forecast 2019-2029 ($bn, AGR %, Cumulative)
Table 4.12 Global Oil Country Tubular Goods (OCTG) Market, by Seamless Forecast 2019-2029 (MT, $ bn, AGR %, CAGR %, Cumulative)
Table 4.13 Global Oil Country Tubular Goods (OCTG) Market, by Seamless Drivers & Restraints
Table 4.14 Global Oil Country Tubular Goods (OCTG) Market, by Welded Forecast 2018-2029 (MT, $ bn, AGR %, CAGR %, Cumulative)
Table 4.15 Global Oil Country Tubular Goods (OCTG) Market, by Welded Drivers and Restraints
Table 5.1 Global Oil Country Tubular Goods (OCTG) Market by Country Forecast 2019-2029 Volume (MT), AGR %, Cumulative)
Table 5.2 Global Oil Country Tubular Goods (OCTG) Market by Country Forecast 2019-2029 (Revenue($bn), AGR %, Cumulative)
Table 5.3 U.S. Oil Country Tubular Goods (OCTG) Market, by Seamless Forecast 2019-2029 (MT, $ bn, AGR %, CAGR %, Cumulative)
Table 5.4 U.S. Oil Country Tubular Goods (OCTG) Market, by Grade Forecast 2019-2029 ($bn, AGR %, Cumulative)
Table 5.5 U.S. Oil Country Tubular Goods (OCTG) Market, by Application Forecast 2019-2029 ($bn, AGR %, Cumulative)
Table 5.6 U.S. Oil Country Tubular Goods (OCTG) Market, by Type Forecast 2019-2029 ($bn, AGR %, Cumulative)
Table 5.7 Canada Oil Country Tubular Goods (OCTG) Market, Forecast 2019-2029 (MT, $ bn, AGR %, CAGR %, Cumulative)
Table 5.8 Canada Oil Country Tubular Goods (OCTG) Market, by Grade Forecast 2019-2029 ($bn, AGR %, Cumulative)
Table 5.9 Canada Oil Country Tubular Goods (OCTG) Market, by Application Forecast 2019-2029 ($bn, AGR %, Cumulative)
Table 5.10 Canada Oil Country Tubular Goods (OCTG) Market, by Type Forecast 2019-2029 ($bn, AGR %, Cumulative)
Table 5.11 Russia Oil Country Tubular Goods (OCTG) Market, Forecast 2019-2029 (MT, $ bn, AGR %, CAGR %, Cumulative)
Table 5.12 Russia Oil Country Tubular Goods (OCTG) Market, by Grade Forecast 2019-2029 ($bn, AGR %, Cumulative)
Table 5.13 Russia Oil Country Tubular Goods (OCTG) Market, by Application Forecast 2019-2029 ($bn, AGR %, Cumulative)
Table 5.14 Russia Oil Country Tubular Goods (OCTG) Market, by Type Forecast 2019-2029 ($bn, AGR %, Cumulative)
Table 5.15 China Oil Country Tubular Goods (OCTG) Market, Forecast 2019-2029 (MT, $ bn, AGR %, CAGR %, Cumulative)
Table 5.16 China Oil Country Tubular Goods (OCTG) Market, by Grade Forecast 2019-2029 ($bn, AGR %, Cumulative)
Table 5.17 China Oil Country Tubular Goods (OCTG) Market, by Application Forecast 2019-2029 ($bn, AGR %, Cumulative)
Table 5.18 China Oil Country Tubular Goods (OCTG) Market, by Type Forecast 2019-2029 ($bn, AGR %, Cumulative)
Table 5.19 GCC Oil Country Tubular Goods (OCTG) Market, Forecast 2019-2029 (MT, $ bn, AGR %, CAGR %, Cumulative)
Table 5.20 GCC Oil Country Tubular Goods (OCTG) Market, by Grade Forecast 2019-2029 ($bn, AGR %, Cumulative)
Table 5.21 GCC Oil Country Tubular Goods (OCTG) Market, by Application Forecast 2019-2029 ($bn, AGR %, Cumulative)
Table 5.22 GCC Oil Country Tubular Goods (OCTG) Market, by Type Forecast 2019-2029 ($bn, AGR %, Cumulative)
Table 5.23 Rest of the World Oil Country Tubular Goods (OCTG) Market, Forecast 2019-2029 (MT, $ bn, AGR %, CAGR %, Cumulative)
Table 5.24 Rest of the World Oil Country Tubular Goods (OCTG) Market, by Grade Forecast 2019-2029 ($bn, AGR %, Cumulative)
Table 5.25 Rest of the World Oil Country Tubular Goods (OCTG) Market, by Application Forecast 2019-2029 ($bn, AGR %, Cumulative)
Table 5.26 Rest of the World Oil Country Tubular Goods (OCTG) Market, by Type Forecast 2019-2029 ($bn, AGR %, Cumulative)
Table 6.1 PESTEL Analysis, OCTG Market
Table 8.1 ArcelorMittal Profile 2017(Market Entry, Public/Private, Headquarters, No. of Employees, Total Company Revenue US$bn, Change in Revenue, Geography, Key Markets, Listed on, Products/Services)
Table 8.2 ArcelorMittal Total Company Sales 2013-2017 ($ bn, AGR %)
Table 8.3 Continental Alloys & Services Profile 2017 (Market Entry, Public/Private, Headquarters, Revenue ($m) 2017, Geography, Key Market, Listed on, Products/Services)
Table 8.4 Iljin Steel Co., Ltd. Profile 2017 (Market Entry, Public/Private, Headquarters, Geography, Key Market, Products/Services)
Table 8.5 National Oilwell Varco Profile 2017 (Market Entry, Public/Private, Headquarters, No. of Employees, Total Company Revenue US$bn, Change in Revenue, Geography, Key Markets, Listed on, Products/Services)
Table 8.6 National Oilwell Varco Total Company Sales 2013-2017 ($ bn, AGR %)
Table 8.7 Nippon Steel & Sumitomo Metal Corporation Profile 2017 (Market Entry, Public/Private, Headquarters, No. of Employees, Total Company Revenue US$bn, Change in Revenue, Geography, Key Markets, Listed on, Products/Services)
Table 8.8 Nippon Steel & Sumitomo Metal Corporation Total Company Sales 2013-2017 ($ bn, AGR %)
Table 8.9 Tenaris S.A Profile 2017 (Market Entry, Public/Private, Headquarters, No. of Employees, Total Company Revenue US$bn, Change in Revenue, Geography, Key Markets, Listed on, Products/Services)
Table 8.10 Tenaris S.A Total Company Sales 2013-2017 ($ bn, AGR %)
Table 8.11 Tianjin Pipe Corporation Profile 2017 (Market Entry, Public/Private, Headquarters, Geography, Key Markets, Listed on, Products/)
Table 8.12 TMK Profile 2017 (Market Entry, Public/Private, Headquarters, No. of Employees, Total Company Revenue $bn, Change in Revenue, Geography, Key Markets, Listed on, Products/Services)
Table 8.13 TMK’s Premium Projects, contract term and products supplied in Oil Country Tubular Goods Market
Table 8.14 TMK, Total Company Sales 2013-2017 ($bn, AGR %)
Table 8.15 United States Steel Profile 2017 (Market Entry, Public/Private, Headquarters, No. of Employees, Total Company Revenue US$bn, Change in Revenue, Geography, Key Markets, Listed on, Products/Services)
Table 8.16 United States Steel Total Company Sales 2013-2017 ($ bn, AGR %)
Table 8.17 Vallourec Profile 2017 (Market Entry, Public/Private, Headquarters, No. of Employees, Total Company Revenue US$bn, Change in Revenue, Geography, Key Markets, Listed on, Products/Services)
Table 8.18 Vallourec Total Company Sales 2013-2017 ($ bn, AGR %)
Table 8.19 Other Companies Involved in Tubular Goods
List of Figures
Figure 2.1 Global Oil Country Tubular Goods (OCTG)Market Segmentation Overview
Figure 2.2 World-wide Steel Production Statistics (Million Tons), 2008-2017
Figure 2.3 Crude Steel Production Statistics, by Top 25 Companies (Million Tons), 2017
Figure 3.1 Global Oil Country Tubular Goods (OCTG) Market Forecast 2019-2029 (MT, AGR%)
Figure 3.2 Global Oil Country Tubular Goods (OCTG) Market Forecast 2019-2029 ($ bn, AGR %)
Figure 3.3 Global Oil Country Tubular Goods (OCTG), by Application Submarket Forecast 2019-2029 (MT)
Figure 3.4 Regional Oil Country Tubular Goods (OCTG) Market Forecast 2019-2029 ($mn)
Figure 3.5 Global Oil Country Tubular Goods (OCTG) Market by Regional % Share Forecast 2019, 2024, 2029 (Revenue)
Figure 3.6 Global Oil Country Tubular Goods (OCTG) Forecast 2019-2029, by Region (AGR %)
Figure 4.1 Global Oil Country Tubular Goods (OCTG), by Grade Submarket Forecast 2019-2029 (MT)
Figure 4.2 Global Oil Country Tubular Goods (OCTG), by Grade Submarket Forecast 2019-2029 ($bn)
Figure 4.3 Global Oil Country Tubular Goods (OCTG) Market by Grade (Revenue) Share Forecast 2019, 2024, 2029 (% Share)
Figure 4.4 Global Oil Country Tubular Goods (OCTG) Market, By API Forecast 2019-2029 (MT, AGR%)
Figure 4.5 Global Oil Country Tubular Goods (OCTG) Market, by API Forecast 2019-2029 ($ bn, AGR %)
Figure 4.6 Oil Country Tubular Goods (OCTG) Market, By Premium Forecast 2019-2029 (MT, AGR%)
Figure 4.7 Oil Country Tubular Goods (OCTG) Market, By Premium Forecast 2019-2029 ($ bn, AGR%)
Figure 4.8 Global Oil Country Tubular Goods (OCTG) Market, Comparison Matrix, by Solution Type VS Region (Comparison Matric)
Figure 4.9 Global Oil Country Tubular Goods (OCTG), by Application Submarket Forecast 2019-2029 (MT)
Figure 4.10 Global Oil Country Tubular Goods (OCTG), by Application Submarket Forecast 2019-2029 ($bn)
Figure 4.11 Global Oil Country Tubular Goods (OCTG) Market by Application (Revenue) Share Forecast 2019, 2024, 2029 (% Share)
Figure 4.12 Global Oil Country Tubular Goods (OCTG) Market, By Onshore Forecast 2019-2029 (MT, AGR%)
Figure 4.13 Global Oil Country Tubular Goods (OCTG) Market, by Onshore Forecast 2019-2029 ($ bn, AGR %)
Figure 4.14 Oil Country Tubular Goods (OCTG) Market, By Offshore Forecast 2019-2029 (MT, AGR%)
Figure 4.15 Oil Country Tubular Goods (OCTG) Market, By Offshore Forecast 2019-2029 ($ bn, AGR%)
Figure 4.16 Global Oil Country Tubular Goods (OCTG) Market, Comparison Matrix, by Application VS Region (Comparison Matric)
Figure 4.17 Global Oil Country Tubular Goods (OCTG), by Type Submarket Forecast 2019-2029 (MT)
Figure 4.18 Global Oil Country Tubular Goods (OCTG), by Type Submarket Forecast 2019-2029 ($bn)
Figure 4.19 Global Oil Country Tubular Goods (OCTG) Market by Type (Revenue) Share Forecast 2019, 2024, 2029 (% Share)
Figure 4.20 Global Oil Country Tubular Goods (OCTG) Market, By Seamless Forecast 2019-2029 (MT, AGR%)
Figure 4.21 Global Oil Country Tubular Goods (OCTG) Market, by Seamless Forecast 2019-2029 ($ bn, AGR %)
Figure 4.22 Oil Country Tubular Goods (OCTG) Market, By Welded Forecast 2019-2029 (MT, AGR%)
Figure 4.23 Oil Country Tubular Goods (OCTG) Market, By Welded Forecast 2019-2029 ($ bn, AGR%)
Figure 4.24 Global Oil Country Tubular Goods (OCTG) Market, Comparison Matrix, by Type VS Region (Comparison Matric)
Figure 5.1 Global Oil Country Tubular Goods (OCTG) Market Forecast by Leading Nations, Volume (MT)
Figure 5.2 Global Oil Country Tubular Goods (OCTG) Market Forecast by Leading Nations (AGR), by Revenue ($ bn)
Figure 5.3 Global Oil Country Tubular Goods (OCTG) Market Forecast by Leading Nations ($ bn)
Figure 5.4 Leading Country/Regional Oil Country Tubular Goods (OCTG) Market Share Forecast 2019 (% Share)
Figure 5.5 Leading Country/Regional Oil Country Tubular Goods (OCTG) Market Share Forecast 2024 (% Share)
Figure 5.6 Leading Country/Regional Oil Country Tubular Goods (OCTG) Market Share Forecast 2029 (% Share)
Figure 5.7 U.S. Oil Country Tubular Goods (OCTG) Market, By Seamless Forecast 2019-2029 (MT, AGR%)
Figure 5.8 U.S. Oil Country Tubular Goods (OCTG) Market Forecast 2019-2029 ($bn, AGR%)
Figure 5.9 U.S. Oil Country Tubular Goods (OCTG) Market Share Forecast 2019, 2024, 2029 (% Share)
Figure 5.10 U.S. Oil Country Tubular Goods (OCTG), by Grade Submarket Forecast 2019-2029 (MT)
Figure 5.11 U.S. Oil Country Tubular Goods (OCTG) Market Forecast 2019-2029, by Grade ($bn, AGR%)
Figure 5.12 U.S. Oil Country Tubular Goods (OCTG) Market Share Forecast 2019, 2024, 2029 (% Share), by Grade, Revenue ($ bn)
Figure 5.13 U.S. Oil Country Tubular Goods (OCTG), by Application Submarket Forecast 2019-2029 (MT)
Figure 5.14 U.S. Oil Country Tubular Goods (OCTG) Market Forecast 2019-2029, by Application ($bn, AGR%)
Figure 5.15 U.S. Oil Country Tubular Goods (OCTG) Market Share Forecast 2019, 2024, 2029 (% Share), by Application
Figure 5.16 U.S. Oil Country Tubular Goods (OCTG), by Grade Submarket Forecast 2019-2029 (MT)
Figure 5.17 U.S. Oil Country Tubular Goods (OCTG) Market Forecast 2019-2029, by Type ($bn, AGR%)
Figure 5.18 U.S. Oil Country Tubular Goods (OCTG) Market Share Forecast 2019, 2024, 2029 (% Share), by Type
Figure 5.19 Canada Oil Country Tubular Goods (OCTG) Market, By Seamless Forecast 2019-2029 (MT, AGR%)
Figure 5.21 Canada Oil Country Tubular Goods (OCTG) Market Share Forecast 2019, 2024, 2029 (% Share, by Revenue ($ bn)
Figure 5.22 Canada Oil Country Tubular Goods (OCTG), by Grade Submarket Forecast 2019-2029 (MT)
Figure 5.23 Canada Oil Country Tubular Goods (OCTG) Market Forecast 2019-2029, by Grade ($bn, AGR%)
Figure 5.24 Canada Oil Country Tubular Goods (OCTG) Market Share Forecast 2019, 2024, 2029 (% Share), by Grade, Revenue ($ bn)
Figure 5.25 Canada Oil Country Tubular Goods (OCTG), by Application Submarket Forecast 2019-2029 (MT)
Figure 5.26 Canada Oil Country Tubular Goods (OCTG) Market Forecast 2019-2029, by Application ($bn, AGR%)
Figure 5.27 Canada Oil Country Tubular Goods (OCTG) Market Share Forecast 2019, 2024, 2029 (% Share), by Application
Figure 5.28 Canada Oil Country Tubular Goods (OCTG), by Grade Submarket Forecast 2019-2029 (MT)
Figure 5.29 Canada Oil Country Tubular Goods (OCTG) Market Forecast 2019-2029, by Type ($bn, AGR%)
Figure 5.30 Canada Oil Country Tubular Goods (OCTG) Market Share Forecast 2019, 2024, 2029 (% Share), by Type
Figure 5.31 Russia Oil Country Tubular Goods (OCTG) Market, By Seamless Forecast 2019-2029 (MT, AGR%)
Figure 5.32 Russia Oil Country Tubular Goods (OCTG) Market Forecast 2019-2029 ($bn, AGR%)
Figure 5.33 Russia Oil Country Tubular Goods (OCTG) Market Share Forecast 2019, 2024, 2029 (% Share, by Revenue ($ bn)
Figure 5.34 Russia Oil Country Tubular Goods (OCTG), by Grade Submarket Forecast 2019-2029 (MT)
Figure 5.35 Russia Oil Country Tubular Goods (OCTG) Market Forecast 2019-2029, by Grade ($bn, AGR%)
Figure 5.36 Russia Oil Country Tubular Goods (OCTG) Market Share Forecast 2019, 2024, 2029 (% Share), by Grade, Revenue ($ bn)
Figure 5.37 Russia Oil Country Tubular Goods (OCTG), by Application Submarket Forecast 2019-2029 (MT)
Figure 5.38 Russia Oil Country Tubular Goods (OCTG) Market Forecast 2019-2029, by Application ($bn, AGR%)
Figure 5.39 Russia Oil Country Tubular Goods (OCTG) Market Share Forecast 2019, 2024, 2029 (% Share), by Application
Figure 5.40 Russia Oil Country Tubular Goods (OCTG), by Grade Submarket Forecast 2019-2029 (MT)
Figure 5.41 Russia Oil Country Tubular Goods (OCTG) Market Forecast 2019-2029, by Type ($bn, AGR%)
Figure 5.42 Russia Oil Country Tubular Goods (OCTG) Market Share Forecast 2019, 2024, 2029 (% Share), by Type
Figure 5.43 China Oil Country Tubular Goods (OCTG) Market, By Seamless Forecast 2019-2029 (MT, AGR%)
Figure 5.44 China Oil Country Tubular Goods (OCTG) Market Forecast 2019-2029 ($bn, AGR%)
Figure 5.45 China Oil Country Tubular Goods (OCTG) Market Share Forecast 2019, 2024, 2029 (% Share, by Revenue ($ bn)
Figure 5.46 China Oil Country Tubular Goods (OCTG), by Grade Submarket Forecast 2019-2029 (MT)
Figure 5.47 China Oil Country Tubular Goods (OCTG) Market Forecast 2019-2029, by Grade ($bn, AGR%)
Figure 5.48 China Oil Country Tubular Goods (OCTG) Market Share Forecast 2019, 2024, 2029 (% Share), by Grade, Revenue ($ bn)
Figure 5.49 China Oil Country Tubular Goods (OCTG), by Application Submarket Forecast 2019-2029 (MT)
Figure 5.50 China Oil Country Tubular Goods (OCTG) Market Forecast 2019-2029, by Application ($bn, AGR%)
Figure 5.51 China Oil Country Tubular Goods (OCTG) Market Share Forecast 2019, 2024, 2029 (% Share), by Application
Figure 5.52 China Oil Country Tubular Goods (OCTG), by Grade Submarket Forecast 2019-2029 (MT)
Figure 5.53 China Oil Country Tubular Goods (OCTG) Market Forecast 2019-2029, by Type ($bn, AGR%)
Figure 5.54 China Oil Country Tubular Goods (OCTG) Market Share Forecast 2019, 2024, 2029 (% Share), by Type
Figure 5.55 GCC Oil Country Tubular Goods (OCTG) Market, By Seamless Forecast 2019-2029 (MT, AGR%)
Figure 5.56 GCC Oil Country Tubular Goods (OCTG) Market Forecast 2019-2029 ($bn, AGR%)
Figure 5.57 GCC Oil Country Tubular Goods (OCTG) Market Share Forecast 2019, 2024, 2029 (% Share, by Revenue ($ bn)
Figure 5.58 GCC Oil Country Tubular Goods (OCTG), by Grade Submarket Forecast 2019-2029 (MT)
Figure 5.59 GCC Oil Country Tubular Goods (OCTG) Market Forecast 2019-2029, by Grade ($bn, AGR%)
Figure 5.60 GCC Oil Country Tubular Goods (OCTG) Market Share Forecast 2019, 2024, 2029 (% Share), by Grade, Revenue ($ bn)
Figure 5.61 GCC Oil Country Tubular Goods (OCTG), by Application Submarket Forecast 2019-2029 (MT)
Figure 5.62 GCC Oil Country Tubular Goods (OCTG) Market Forecast 2019-2029, by Application ($bn, AGR%)
Figure 5.63 GCC Oil Country Tubular Goods (OCTG) Market Share Forecast 2019, 2024, 2029 (% Share), by Application
Figure 5.64 GCC Oil Country Tubular Goods (OCTG), by Grade Submarket Forecast 2019-2029 (MT)
Figure 5.65 GCC Oil Country Tubular Goods (OCTG) Market Forecast 2019-2029, by Type ($bn, AGR%)
Figure 5.66 GCC Oil Country Tubular Goods (OCTG) Market Share Forecast 2019, 2024, 2029 (% Share), by Type
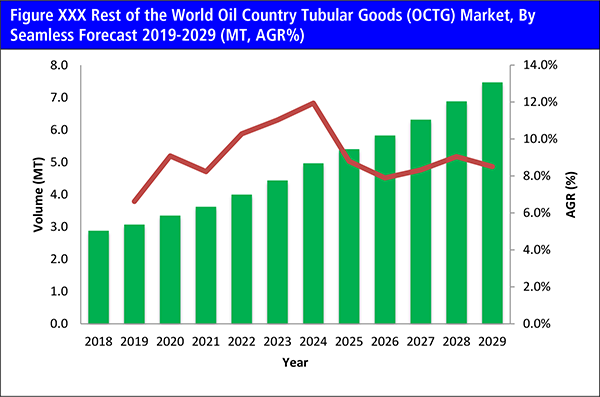
Figure 5.67 Rest of the World Oil Country Tubular Goods (OCTG) Market, By Seamless Forecast 2019-2029 (MT, AGR%)
Figure 5.68 Rest of the World Oil Country Tubular Goods (OCTG) Market Forecast 2019-2029 ($bn, AGR%)
Figure 5.69 Rest of the World Oil Country Tubular Goods (OCTG) Market Share Forecast 2019, 2024, 2029 (% Share, by Revenue ($ bn)
Figure 5.70 Rest of the World Oil Country Tubular Goods (OCTG), by Grade Submarket Forecast 2019-2029 (MT)
Figure 5.71 Rest of the World Oil Country Tubular Goods (OCTG) Market Forecast 2019-2029, by Grade ($bn, AGR%)
Figure 5.72 Rest of the World Oil Country Tubular Goods (OCTG) Market Share Forecast 2019, 2024, 2029 (% Share), by Grade, Revenue ($ bn)
Figure 5.73 Rest of the World Oil Country Tubular Goods (OCTG), by Application Submarket Forecast 2019-2029 (MT)
Figure 5.74 Rest of the World Oil Country Tubular Goods (OCTG) Market Forecast 2019-2029, by Application ($bn, AGR%)
Figure 5.75 Rest of the World Oil Country Tubular Goods (OCTG) Market Share Forecast 2019, 2024, 2029 (% Share), by Application
Figure 5.76 Rest of the World Oil Country Tubular Goods (OCTG), by Grade Submarket Forecast 2019-2029 (MT)
Figure 5.77 Rest of the World Oil Country Tubular Goods (OCTG) Market Forecast 2019-2029, by Type ($bn, AGR%)
Figure 5.78 Rest of the World Oil Country Tubular Goods (OCTG) Market Share Forecast 2019, 2024, 2029 (% Share), by Type
Figure 8.1 ArcelorMittal Revenue, ($bn & AGR %), Y-o-Y Revenue Growth, 2013-2017
Figure 8.2 ArcelorMittal % Revenue Share, by Products, 2017
Figure 8.3 ArcelorMittal % Revenue Share, by Regional Segment, 2017
Figure 8.4 National Oilwell Varco Revenue, ($bn& AGR %), Y-o-Y Revenue Growth, 2013-2017
Figure 8.5 National Oilwell Varco % Revenue Share, by Business Segment, 2017
Figure 8.6 National Oilwell Varco % Revenue Share, by Regional Segment, 2017
Figure 8.7 Nippon Steel & Sumitomo Metal Corporation Revenue, ($bn& AGR %), Y-o-Y Revenue Growth, 2013-2017
Figure 8.8 Nippon Steel & Sumitomo Metal Corporation % Revenue Share, by Business Segment, 2017
Figure 8.9 Nippon Steel & Sumitomo Metal Corporation % Revenue Share, by Regional Segment, 2017
Figure 8.10 Tenaris S.A Revenue, ($bn& AGR %), Y-o-Y Revenue Growth, 2013-2017
Figure 8.11 Tenaris S.A % Revenue Share, by Business Segment, 2017
Figure 8.12 Tenaris S.A % Revenue Share, by Regional Segment, 2017
Figure 8.13 TMK OCTG Consumption (million tonnes) in Russia and the United States
Figure 8.14 TMK, Company Revenue, ($bn& AGR %), 2013-2017
Figure 8.15 TMK, % Revenue Share, by Regional Segment, 2017
Figure 8.16 TMK, % Revenue Share, by Product, 2017
Figure 8.17 United States Steel Revenue, ($bn & AGR %), Y-o-Y Revenue Growth, 2013-2017
Figure 8.18 United States Steel % Revenue Share, by Business Segment, 2017
Figure 8.19 United States Steel % Revenue Share, by Regional Segment, 2017
Figure 8.20 United States Steel % Revenue Share, by Product, 2017
Figure 8.21 Vallourec Revenue, ($bn& AGR %), Y-o-Y Revenue Growth, 2013-2017
Figure 8.22 Vallourec % Revenue Share, by Business Segment, 2017
Figure 8.23 Vallourec % Revenue Share, by Regional Segment, 2017
Figure 9.1 Global Oil Country Tubular Goods (OCTG) Market Forecast 2019-2029 ($ mn, MT, AGR %)
Ameri-Source
Ansteel Group
ArcelorMittal
Benxi Steel
Bison Stainless Tube
China Baowu Group
China Steel Corporation
Continental Alloys & Services
DYC
Exel
ExxonMobil
Fangda Steel
Furukawa Electric
Gerdau
GlobalMask
Globe Mechanical
HBIS Group
Hibernia Management and Development Company Limited
Husky Energy
Hyundai Steel
Iljin Steel Co.
IMIDRO
Insul-Pipe Systems
Interpipe
JFE Steel
Jianlong Group
JSW Steel
Maanshan Steel
Metal Works Corp
National Oilwell Varco
Naylor Pipe Co.
Nippon Steel & Sumutomo Metal Corporation
NLMK
NS SMC
NSSMC Group
Nucor Corporation
Parker Llegris
Perma-Pipe
POSCO
Rexroth (Bosch Group)
Rizhao Steel
Royal Dutch Shell
SAIL
Saudi Aramco
Schaeffler
Shagang Group
Shandong Steel Group
Shengli Oil & Gas Pipe Holdings Limited
Shougang Group
Soconord Corp.
Sound Seal
Steel Tubes India
Suncor Energy
SuperiorTube Company Inc.
Tata Steel Group
Tenaris
Tianjin Pipe Corporation
TMK
Trelleborg
Trico
Tube Methods Inc
United States Steel
Valin Group
Vallourec
Van Leeuwn
Victrex USA Inc
Organisations Mentioned
Australian Government
Canada’s Oil Sands Innovation Alliance (COSIA)
China National Offshore Oil Company (CNOOC)
Government of Newfoundland and Labrador
International Energy Agency (IEA)
World Wide Fund for Nature (WWF)