Visiongain expects market growth from $25.19bn in 2018 to $40.80bn in 2024, growing at a CAGR of 8.42%. The developing markets will continue to grow demand; this is mainly due to the great need for vaccines in low-income and middle-income countries.
How this report will benefit you
Read on to discover how you can exploit the future business opportunities emerging in this sector.
In this brand new 190-page report you will receive 53 tables and 59 figures– all unavailable elsewhere.
The 190-page report provides clear detailed insight into the top 25 vaccines market. Discover the key drivers and challenges affecting the market.
By ordering and reading our brand-new report today you stay better informed and ready to act.
Report Scope
• Top 25 Vaccines Market revenue forecasts from 2019-2029:
• Adacel
• Bexsero
• Boostrix
• Cervarix
• FluLaval / Fluarix
• FluMist/Fluenz
• Fluzone/Vaxigrip
• FSME/IMMUN-TicoVac
• Gardasil/Gardasil 9
• Hepatitis Vaccines (GSK)
• Infanrix/Pediarix
• Ixiaro
• Menactra
• Menveo
• M-M-R II
• Pentacel
• Pneumovax 23
• Prevnar/Prevnar 13
• ProQuad
• Repevax
• Rotarix
• RotaTeq
• Synflorix
• Varivax
• Zostavax
• Top 25 Vaccines Market revenue forecasts from 2019-2029 by Regional and National Market:
• US
• Canada
• Germany
• UK
• France
• Italy
• Spain
• Japan
• China
• India
• Brazil
• Mexico
• Russia
• South Africa
• RoW
The forecast for each regional market is further segmented by leading vaccines.
• Profiles of the selected leading companies:
• AstraZeneca
• Eli Lilly
• Emergent BioSolutions Inc.
• GlaxoSmithKline
• Johnson & Johnson
• Merck & Co.
• Pfizer
• Sanofi
• Serum Institute of India Private Limited
• Takeda
• Discussion on Research & Development:
• Prophylactic Vaccines: Paediatric Vaccines, Adult Vaccines, Elderly Vaccines, Travel Vaccines
• Therapeutic Vaccines
• Qualitative analysis of the generic drugs market:
• SWOT Analysis of the vaccines market
• STEP Analysis of the vaccines market
• Discussion on factors that drive and restrain the vaccines market
• Key Questions Answered by This Report:
• What is the current size of the overall global human vaccines market? How much will this market be worth from 2018 to 2029?
• What are the main drivers and restraints that will shape the overall vaccines market over the next ten years?
• What factors will affect that industry and market over the next ten years?
• What are the largest national markets for the world vaccines? What is their current status and how will they develop over the next ten years? What are their revenue potentials to 2029?
• How will political and regulatory forces influence regional markets?
• How will market shares of the leading national markets change by 2029, and which geographical region will lead the market in 2029?
• Who are the leading companies and what are their activities, results, developments and prospects?
• What are the leading vaccines? What are their revenues and latest developments?
• What are some of the most prominent human vaccines currently in development?
• What are the main trends that will affect the world vaccines market between 2018 and 2029?
• What are the main strengths, weaknesses, opportunities and threats for the market?
• What are the social, technological, economic and political influences that will shape that industry over the next ten years?
• How will the Global Top 25 Vaccines Market evolve over the forecast period, 2018 to 2029?
Visiongain’s study is intended for anyone requiring commercial analyses for the Top 25 Vaccines Market. You find data, trends and predictions.
Buy our report today Top 25 Vaccines Market Forecast : Prevnar/Prevnar 13; Gardasil/Gardasil 9; Fluzone/Vaxigrip; Pentacel; Infanrix, Pediarix; GSK Hepatitis Vaccine; Pneumovax 23; Varivax; Bexsero; Boostrix; Menactra; RotaTeq; Rotarix; Zostavax; Synflorix; FluLaval/Fluarix; ProQuad; M-M-R II; Adacel; Menveo; Repevax; Cervarix; FSME/IMMUN-TicoVac; Ixiaro; FluMist/Fluenz.
Visiongain is a trading partner with the US Federal Government
CCR Ref number: KD4R6
Do you have any custom requirements we can help you with? Any need for specific country, geo region, market segment or specific company information? Contact us today, we can discuss your needs and see how we can help: sara.peerun@visiongain.com
1. Report Overview
1.1 Overview of the World Vaccines Market
1.2 Why You Should Read This Report
1.3 How This Report Delivers
1.4 Main Questions Answered by This Analytical Study
1.5 Who is This Report For?
1.6 Methods of Research and Analysis
1.7 Frequently Asked Questions (FAQ)
1.8 Associated Visiongain Reports
1.9 About Visiongain
2. Introduction to the World Human Vaccines Market
2.1 Human Vaccines - Aiming for Global Disease Prevention
2.2 What is the Social and Economic Burden?
2.3 Vaccine Technology
2.3.1 Inactivated Vaccines
2.3.2 Live Attenuated Vaccines
2.3.3 Conjugate Vaccines
2.3.4 Recombinant Vector Vaccines
2.4 Key Influencers of the Human Top 25 Vaccines Market
2.4.1 Governments and International Organizations
2.4.1.1 The World Health Organisation (WHO)
2.4.1.2 The Governmental Influence
2.4.2 Leading Manufacturers
2.4.2.1 Merck & Co.
2.4.2.2 Sanofi
2.4.2.3 GlaxoSmithKline
2.4.2.4 Pfizer
3. Global Top 25 Vaccines Market Outlook, 2019-2029
3.1 Global Top 25 Vaccines Market Forecast, 2019-2029
4. The World Top 25 Vaccines Market: Industry Trends, 2019-2029
4.1 Undulating Demand
4.2 Supply Restraints
4.3 Funding Trends
4.4 Protecting the Workforce of an Economy
5. Leading Vaccines: Revenue Forecasts, 2019-2029
5.1 Prevnar/Prevnar 13 (Pfizer) - Pneumococcal Pneumonia
5.2 Gardasil/Gardasil 9 (Merck & Co.) - HPV
5.3 Fluzone/Vaxigrip (Sanofi) – Influenza
5.4 Pentacel (Sanofi) – DtaP, Polio, HiB
5.5 ProQuad (Merck) – Varicella, Measles, Mumps, & Rubella
5.6 Infanrix/Pediarix (GSK) – Diptheria, Tetanus and Acellular Pertussis
5.7 Zostavax (Merck and Co.) – Herpes
5.8 RotaTeq (Merck and Co.) – Rotavirus
5.9 Hepatitis Vaccines (GSK) – Hepatitis A & B
5.10 Menactra (Sanofi) – Meningococcal
5.11 Pneumovax 23 (Merck) – Pneumococcal Disease
5.12 Varivax (Merck and Co.) – Chickenpox
5.13 Bexsero (GSK) - Tetanus, Diphtheria, & Pertussis
5.14 Boostrix (GSK) - Meningitis
5.15 FluMist/Fluenz (AstraZeneca)– Influenza Infection
5.16 Rotarix (GSK) - Rotavirus Gastroenteritis
5.17 Synflorix (GSK) - Meningitis, Blood Infection, Pneumonia
5.18 FluLaval / Fluarix (GSK) - Seasonal Influenza Prophylaxis
5.19 M-M-R II (Merck) – Measles, Mumps, & Rubella
5.20 Adacel (Sanofi) - Tetanus, Diphtheria, & Pertussis
5.21 Menveo (GSK) - Meningitis
5.22 Repevax (Sanofi) - Diphtheria, Tetanus, Pertussis, & Poliomyelitis
5.23 Cervarix (GSK) - Human Papilloma Virus Infection
5.24 FSME/IMMUN-TicoVac (Pfizer) - Tick-Borne Encephalitis
5.25 Ixiaro (Valneva) - Encephalitis
6. Regional and Leading Developed National Vaccines Markets, 2018-2029
6.1 North America Top 25 Vaccines Market, 2018-2029
6.1.1 US Top 25 Vaccines Market, 2018
6.1.2 Canada Top 25 Vaccines Market, 2018
6.2 Europe Top 25 Vaccines Market, 2018-2029
6.2.1 German Top 25 Vaccines Market, 2018 - 2029
6.2.2 UK Top 25 Vaccines Market, 2018-2029
6.2.3 French Top 25 Vaccines Market, 2018-2029
6.2.4 Italian Top 25 Vaccines Market, 2018-2029
6.2.5 Spanish Top 25 Vaccines Market, 2018-2029
6.3 Asia-Pacific Top 25 Vaccines Market, 2018-2029
6.3.1 Japanese Top 25 Vaccines Market, 2018-2029
6.3.2 Chinese Top 25 Vaccines Market, 2018-2029
6.3.3 Indian Top 25 Vaccines Market, 2018-2029
6.4 RoW Top 25 Vaccines Market, 2018-2029
6.4.1 Brazilian Top 25 Vaccines Market, 2018-2029
6.4.2 Russian Top 25 Vaccines Market, 2018-2029
6.4.3 Mexican Top 25 Vaccines Market, 2018-2029
6.4.4 South Africa Top 25 Vaccines Market, 2018-2029
7. Leading Manufacturers of Vaccines for Human Use
7.1 GlaxoSmithKline (GSK)
7.1.1 GSK Vaccine Performance
7.1.2 GSK Developments
7.1.2.1 Mergers and Acquisitions
7.1.2.2 GSK Vaccine Pipeline
7.2 Merck& Co.
7.2.1 Merck Vaccine Performance
7.2.2 Merck Developments
7.2.2.1 Merck Market Movements
7.2.2.2 Collaborations
7.2.2.3 Merck Pipeline
7.3 Sanofi
7.3.1 Sanofi Vaccine Performance
7.3.2 Sanofi Developments
7.3.2.1 Acquisitions & Expansions
7.3.2.2 Sanofi Vaccine Pipeline
7.4 Pfizer
7.4.1 Pfizer Vaccine Performance
7.4.2 Pfizer Developments
7.4.2.1 Pfizer Mergers & Acquisitions
7.4.2.2 Pfizer Pipeline
7.5 Johnson & Johnson
7.5.1 Financial Overview
7.6 AstraZeneca
7.6.1 Financial Overview
7.7 Eli Lilly and Company
7.7.1 Eli Lilly and Company Vaccine Performance
7.7.2 Eli Lilly and Company Developments
7.8 Takeda Pharmaceutical Company Limited
7.8.1 Takeda Pharmaceutical Company Limited Vaccine Performance
7.8.2 Financial Overview
7.9 Serum Institute of India Private Limited
7.9.1 Serum Institute of India Private Limited Vaccine Performance
7.10 Emergent BioSolutions Inc.
7.10.1 Emergent BioSolutions Inc.Vaccine Performance
7.10.2 Key Strategic Acquisitions and Collaborations
8. Research & Development, 2018
8.1 Prophylactic Vaccines R&D Pipeline
8.1.1 Paediatric Vaccines R&D Pipeline
8.1.2 Adult Vaccines R&D Pipeline
8.1.3 Elderly Vaccines R&D Pipeline
8.1.4 Travel Vaccines R&D Pipeline
8.2 Therapeutic Vaccines R&D Pipeline
9. Qualitative Analysis of the World Vaccines Market
9.1 SWOT Analysis of the World Human Vaccines Market
9.1.1 Strengths
9.1.1.1 Prevention is Better than Cure
9.1.1.2 Demand from Emerging Markets Continue
9.1.1.3 Promising R&D Pipeline
9.1.1.4 Increasing Awareness
9.1.2 Weaknesses
9.1.2.1 High Manufacturing Costs
9.1.2.2 Time Constraints
9.1.2.3 Barriers to Market Entry
9.1.3 Opportunities
9.1.3.1 Constant Improvements in Vaccine Technology and Delivery Methods
9.1.3.2 Shifting Focus on Adults Vaccines
9.1.4 Threats
9.1.4.1 Oligarchic Presence of Pharmaceutical Giants
9.1.4.2 Productivity Gap
9.2 STEP Analysis of the World Human Vaccines Industry and Market
9.2.1 Social Factors
9.2.1.1 Maintaining a Healthier Workforce
9.2.1.2 Public Hesitation - Fear of Unwanted Side-Effects
9.2.2 Technological Forces
9.2.2.1 Evolution of Vaccine Technology Pave the Way for Prophylactics and Therapeutics
9.2.3 Economic Factors
9.2.3.1 High Costs of Production
9.2.3.2 Soaring Vaccines Demand from Developing Countries
9.2.4 Political Factors
9.2.4.1 Governments Play Crucial Roles in Vaccination
10. Conclusions
10.1 Segment Market Share Shift
10.3 Endemic Infections Drive Travel Vaccines Growth
10.4 Emerging Markets: High Demand for Vaccines
10.5 Demand in Mature Pharma Markets Continues: in Particular Japan Will Show Sales Growth
10.6 Strong and Diverse Research and Development
10.7 Concluding Remarks
Appendices
Associated Visiongain Reports
Visiongain Report Sales Order Form
About Visiongain
Visiongain Report Evaluation Form
List of Tables
Table 3.1 The Global Top 25 Vaccines Market: Revenue Forecast ($bn), AGR (%), CAGRs (%), 2018-2029
Table 5.1 Prevnar Revenue Forecast ($bn), AGR (%) and CAGR (%), 2018-2029
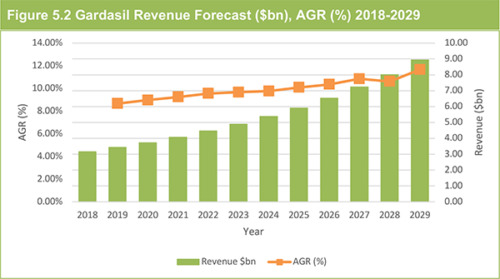
Table 5.2 Gardasil Revenue Forecast ($bn), AGR (%) and CAGR (%), 2018-2029
Table 5.3 Fluzone/Vaxigrip Revenue Forecast ($bn), AGR (%) and CAGR (%), 2018-2029
Table 5.4 Pentacel Revenue Forecast ($bn), AGR (%) and CAGR (%), 2018-2029
Table 5.5 ProQuad Revenue Forecast ($bn), AGR (%) and CAGR (%), 2018-2029
Table 5.6 Infanrix/Pediarix Revenue Forecast ($bn), AGR (%) and CAGR (%), 2018-2029
Table 5.7 Zostavax Revenue Forecast ($bn), AGR (%) and CAGR (%), 2018-2029
Table 5.8 RotaTeq Revenue Forecast ($bn), AGR (%) and CAGR (%), 2018-2029
Table 5.9 GSK Hepatitis Top 25 Vaccines Revenue Forecast ($bn), AGR (%) and CAGR (%), 2018-2029
Table 5.10 Menactra Revenue Forecast ($bn), AGR (%) and CAGR (%), 2018-2029
Table 5.11 Pneumovax 23 Revenue Forecast ($bn), AGR (%) and CAGR (%), 2018-2029
Table 5.12 Varivax Revenue Forecast ($bn), AGR (%) and CAGR (%), 2018-2029
Table 5.13 Bexsero Revenue Forecast ($bn), AGR (%) and CAGR (%), 2018-2029
Table 5.14 Boostrix Revenue Forecast ($bn), AGR (%) and CAGR (%), 2018-2029
Table 5.15 FluMist/Fluenz Revenue Forecast ($bn), AGR (%) and CAGR (%), 2018-2029
Table 5.16 Rotarix Revenue Forecast ($bn), AGR (%) and CAGR (%), 2018-2029
Table 5.17 Synflorix Revenue Forecast ($bn), AGR (%) and CAGR (%), 2018-2029
Table 5.18 FluLaval / Fluarix Revenue Forecast ($bn), AGR (%) and CAGR (%), 2018-2029
Table 5.19 M-M-R II Revenue Forecast ($bn), AGR (%) and CAGR (%), 2018-2029
Table 5.20 Adacel Revenue Forecast ($bn), AGR (%) and CAGR (%), 2018-2029
Table 5.21 Menveo Revenue Forecast ($bn), AGR (%) and CAGR (%), 2018-2029
Table 5.22 Repevax Revenue Forecast ($bn), AGR (%) and CAGR (%), 2018-2029
Table 5.23 Cervarix Revenue Forecast ($bn), AGR (%) and CAGR (%), 2018-2029
Table 5.24 FSME/IMMUN-TicoVac Revenue Forecast ($bn), AGR (%) and CAGR (%), 2018-2029
Table 5.25 Ixiaro Revenue Forecast ($bn), AGR (%) and CAGR (%), 2018-2029
Table 6.1 Leading National Market Revenue Forecasts ($bn), 2018, 2024, 2029
Table 6.2 Leading Developed National Markets Revenue Forecasts ($bn), 2018, 2024, 2029
Table 6.3 Leading Developed National Market Shares (%), 2018, 2024, 2029
Table 6.4 North America Vaccines Revenue Forecast by Leading Vaccines ($bn), Annual Growth (%) and CAGR (%), 2018-2029
Table 6.5 The US Top 25 Vaccines Revenue Forecast ($bn), AGR (%) and CAGR (%), 2018-2029
Table 6.6 Canada Top 25 Vaccines Revenue Forecast ($bn), AGR (%) and CAGR (%), 2018-2029
Table 6.7 Europe Vaccines Revenue Forecast by Leading Vaccines ($bn), Annual Growth (%) and CAGR (%), 2018-2029
Table 6.8 The German Top 25 Vaccines Revenue Forecast ($bn), AGR (%) and CAGR (%), 2018-2029
Table 6.9 The UK Top 25 Vaccines Revenue Forecast ($bn), AGR (%) and CAGR (%), 2018-2029
Table 6.10 France Top 25 Vaccines Revenue Forecast ($bn), AGR (%) and CAGR (%), 2018-2029
Table 6.11 Italy Top 25 Vaccines Revenue Forecast ($bn), AGR (%) and CAGR (%), 2018-2029
Table 6.12 Spain Top 25 Vaccines Revenue Forecast ($bn), AGR (%) and CAGR (%), 2018-2029
Table 6.13 Asia-Pacific Vaccines Revenue Forecast by Leading Vaccines ($bn), Annual Growth (%) and CAGR (%), 2018-2029
Table 6.14 Japan Top 25 Vaccines Revenue Forecast ($bn), AGR (%) and CAGR (%), 2018-2029
Table 6.15 China Top 25 Vaccines Revenue Forecast ($bn), AGR (%) and CAGR (%), 2018-2029
Table 6.16 India Top 25 Vaccines Revenue Forecast ($bn), AGR (%) and CAGR (%), 2018-2029
Table 6.17 RoW Vaccines Revenue Forecast by Leading Vaccines ($bn), AGR (%) and CAGR (%), 2018-2029
Table 6.18 Brazil Top 25 Vaccines Revenue Forecast ($bn), AGR (%) and CAGR (%), 2018-2029
Table 6.19 Russia Top 25 Vaccines Revenue Forecast ($bn), AGR (%) and CAGR (%), 2018-2029
Table 6.20 Mexican Top 25 Vaccines Revenue Forecast ($bn), Annual Growth (%) and CAGR (%), 2018-2029
Table 6.21 South Africa Top 25 Vaccines Revenue Forecast ($bn), AGR (%) and CAGR (%), 2018-2029
Table 8.1 Prophylactic Vaccines in Development, 2018
Table 8.2 Paediatric Vaccines in Development, 2018
Table 8.3 Adult Vaccines in Development, 2018
Table 8.4 Elderly Vaccines in Development, 2018
Table 8.5 Travel Vaccines in Development, 2018
Table 8.6 Therapeutic Vaccines in Development, 2018
List of Figures
Figure 3.1 Vaccines Market Share within Global Pharmaceutical Market (%), 2018
Figure 3.2 Global Top 25 Vaccines Revenue Share Forecast (%) by Leading Vaccine 2018-2029
Figure 4.1 World Vaccines Market: Drivers and Restraints
Figure 5.1 Prevnar Revenue Forecast ($bn), AGR (%) 2018-2029
Figure 5.2 Gardasil Revenue Forecast ($bn), AGR (%) 2018-2029
Figure 5.3 Fluzone/Vaxigrip Revenue Forecast ($bn), AGR (%) 2018-2029
Figure 5.4 Pentacel Revenue Forecast ($bn), AGR (%) 2018-2029
Figure 5.5 ProQuad Revenue Forecast ($bn), AGR (%) 2018-2029
Figure 5.6 Infanrix/Pediarix Revenue Forecast ($bn), AGR (%) 2018-2029
Figure 5.7 Zostavax Revenue Forecast ($bn), AGR (%) 2018-2029
Figure 5.8 RotaTeq Revenue Forecast ($bn), AGR (%) 2018-2029
Figure 5.9 GSK Hepatitis Top 25 Vaccines Revenue Forecast ($bn), AGR (%) 2018-2029
Figure 5.10 Menactra Revenue Forecast ($bn), AGR (%) 2018-2029
Figure 5.11 Pneumovax 23 Revenue Forecast ($bn), AGR (%), 2018-2029
Figure 5.12 Varivax Revenue Forecast ($bn), AGR (%) 2018-2029
Figure 5.13 Bexsero Revenue Forecast ($bn), AGR (%) 2018-2029
Figure 5.14 Boostrix Revenue Forecast ($bn), AGR (%) 2018-2029
Figure 5.15 FluMist/Fluenz Revenue Forecast ($bn), AGR (%) 2018-2029
Figure 5.16 Rotarix Revenue Forecast ($bn), AGR (%) 2018-2029
Figure 5.17 Synflorix Revenue Forecast ($bn), AGR (%) 2018-2029
Figure 5.18 FluLaval / Fluarix Revenue Forecast ($bn), AGR (%) 2018-2029
Figure 5.19 M-M-R II Revenue Forecast ($bn), AGR (%) 2018-2029
Figure 5.20 Adacel Revenue Forecast ($bn), AGR (%) 2018-2029
Figure 5.21 Menveo Revenue Forecast ($bn), AGR (%) 2018-2029
Figure 5.22 Repevax Revenue Forecast ($bn), AGR (%) 2018-2029
Figure 5.23 Cervarix Revenue Forecast ($bn), AGR (%) 2018-2029
Figure 5.24 FSME/IMMUN-TicoVac Revenue Forecast ($bn), AGR (%) 2018-2029
Figure 5.25 Ixiaro Revenue Forecast ($bn), AGR (%) 2018-2029
Figure 6.1 North America Top 25 Vaccines Market Revenue Share (%) 2018-2029
Figure 6.2 The US Top 25 Vaccines Revenue Forecast ($bn), AGR (%) 2018-2029
Figure 6.3 Canada Top 25 Vaccines Revenue Forecast ($bn), AGR (%) 2018-2029
Figure 6.4 Europe Top 25 Vaccines Market Revenue Share (%) 2018-2029
Figure 6.5 The German Top 25 Vaccines Revenue Forecast ($bn), 2018-2029
Figure 6.6 The UK Top 25 Vaccines Revenue Forecast ($bn), 2018-2029
Figure 6.7 The French Top 25 Vaccines Revenue Forecast ($bn), AGR (%) 2018-2029
Figure 6.8 Italian Top 25 Vaccines Revenue Forecast ($bn), AGR (%) 2018-2029
Figure 6.9 Spanish Top 25 Vaccines Revenue Forecast ($bn), 2018-2029
Figure 6.10 Asia-Pacific Top 25 Vaccines Market Revenue Share (%) 2018-2029
Figure 6.11 Japanese Top 25 Vaccines Revenue Forecast ($bn), 2018-2029
Figure 6.12 Chinese Top 25 Vaccines Revenue Forecast ($bn), AGR (%) 2018-2029
Figure 6.13 The Indian Top 25 Vaccines Revenue Forecast ($bn), AGR (%) 2018-2029
Figure 6.14 RoW Top 25 Vaccines Market Revenue Share (%) 2018-2029
Figure 6.15 Brazilian Top 25 Vaccines Revenue Forecast ($bn), 2018-2029
Figure 6.16 Russian Top 25 Vaccines Revenue Forecast ($bn), AGR (%) 2018-2029
Figure 6.17 Mexican Top 25 Vaccines Revenue Forecast ($bn), AGR (%) 2018-2029
Figure 6.18 South Africa Top 25 Vaccines Revenue Forecast ($bn), AGR (%) 2018-2029
Figure 7.1 GSK Vaccines Revenue ($bn), 2015-2017
Figure 7.2 GSK Vaccines Region Breakdown (%), 2017
Figure 7.3 Merck Vaccines Revenue (%), 2017
Figure 7.4 Sanofi Vaccines Revenue ($bn), 2014-2017
Figure 7.5 Pfizer Revenue ($bn), 2014-2017
Figure 7.6 J&J Revenue ($bn), 2014-2017
Figure 7.7 AstraZeneca Revenue ($bn), 2014-2017
Figure 7.8 Eli Lilly and Company Revenue ($bn), 2014-2017
Figure 7.9 Takeda Pharmaceutical Revenue ($bn), 2014-2017
Figure 9.1 SWOT Analysis of the World Vaccines Market
Figure 9.2 STEP Analysis of the World Vaccines Market
Figure 10.1 World Top 25 Vaccines Revenue Forecast %) by Leading Vaccine 2018-2029
Figure 10.2 World Top 25 Vaccines Revenue Forecast %) by Country 2018-2029

