Industries > Pharma > Global ePharmacy Market 2018-2028
Global ePharmacy Market 2018-2028
US, Canada, Mexico, UK, Germany, Italy, France, Spain, Portugal, India, China, Japan, Australia, GCC, Egypt, South Africa
The global ePharmacy market is expected to grow at a CAGR of 16.7% in the first half of the forecast period. North America held the highest market share in the global ePharmacy market in 2017 with an estimated share of 41.69%.
How this report will benefit you
Read on to discover how you can exploit the future business opportunities emerging in this sector.
In this brand new 156-page report you will receive 70 tables and 64 figures– all unavailable elsewhere.
The 156-page report provides clear detailed insight into the global ePharmacy market. Discover the key drivers and challenges affecting the market.
By ordering and reading our brand-new report today you stay better informed and ready to act.
Report Scope
• Global ePharmacy market forecasts from 2018-2028
• This report also breaks down the revenue forecast for the global ePharmacy market by regional and national market:
– North America: US, Canada, Mexico
– Europe: UK, Germany, Italy, France, Spain & Portugal, Rest of Europe
– Asia-Pacific: India, China, Japan, Australia, Rest of Asia-Pacific
– Middle East and Africa: GCC, Egypt, South Africa, Rest of MEA
– Rest of the World
This report provides an estimated internet penetration (% of population) by country from 2018-2028
• Our study gives qualitative analysis of the ePharmacy market. It discusses:
– Laws and Regulations for ePharmacy in different countries: US, Canada, Europe, UK, Germany, Freance, Italy, India, China and Japan
– Market Drivers, Restraints, Opportunities and Challenges
– Information on recent Merger and Acquisition as well as Agreement and Collaboration
– Porter’s Five Forces Analysis of the ePharmacy Market
• Our study discusses the selected leading companies that are the major players in the ePharmacy industry:
– DocMorris
– CVS Caremark
– Lloyds Pharma
– Walgreens Boots Alliance
– Pharmacy2U
– Rowlands Pharmacy
Visiongain’s study is intended for anyone requiring commercial analyses for the global ePharmacy market. You find data, trends and predictions.
Buy our report today Global ePharmacy Market 2018-2028: US, Canada, Mexico, UK, Germany, Italy, France, Spain, Portugal, India, China, Japan, Australia, GCC, Egypt, South Africa.
Visiongain is a trading partner with the US Federal Government
CCR Ref number: KD4R6
1. Report Overview
1.1 Global ePharmacy Market Overview
1.2 Why you should Read This Report
1.3 How this Report Delivers
1.4 Key Questions Answered by This Report
1.5 Who is this Report for?
1.6 Research and Analysis Methods
1.7 Frequently Asked Questions (FAQ)
1.8 Some Associated Reports
1.9 About Visiongain
2. Introduction to ePharmacy
2.1 ePharmacy Structure Overview
2.2 ePharmacy Market Regulations Across Country
2.2.1 USA Laws for ePharmacy Market
2.2.2 Canada Laws for ePharmacy Market
2.2.3 European Union Laws
2.2.4 UK Laws for ePharmacy Market
2.2.5 Germany Laws for ePharmacy Market
2.2.6 France Laws for ePharmacy Market
2.2.7 Italy Laws for ePharmacy Market
2.2.8 India Laws for ePharmacy Market
2.2.9 China Laws for ePharmacy Market
2.2.10 Japan Laws for ePharmacy Market
2.3 Market Overviews
2.3.1 Market Drivers
2.3.2 Market Restraints
2.3.3 Market Opportunities
2.3.4 Market Challenges
3. Global ePharmacy Market 2018 – 2028: Segmentation by Geography
3.1 North America ePharmacy Market 2018-2028
3.1.1 US ePharmacy Market 2018-2028
3.1.2 Canada ePharmacy Market 2018-2028
3.1.3 Mexico ePharmacy Market 2018-2028
3.2 Europe ePharmacy Market 2018-2028
3.2.1 United Kingdom ePharmacy Market 2018-2028
3.2.2 Germany ePharmacy Market 2018-2028
3.2.3 Italy ePharmacy Market 2018-2028
3.2.4 France ePharmacy Market 2018-2028
3.2.5 Spain and Portugal ePharmacy Market 2018-2028
3.2.6 Rest of Europe ePharmacy Market 2018-2028
3.3 Asia-Pacific ePharmacy Market 2018-2028
3.3.1 India ePharmacy Market 2018-2028
3.3.2 China ePharmacy Market 2018-2028
3.3.3 Japan ePharmacy Market 2018-2028
3.3.4 Australia ePharmacy Market 2018-2028
3.3.5 Rest of Asia-Pacific Market 2018-2028
3.4 Middle East and Africa ePharmacy Market 2018-2028
3.4.1 GCC ePharmacy Market 2018-2028
3.4.2 Egypt ePharmacy Market 2018-2028
3.4.3 South Africa ePharmacy Market 2018-2028
3.4.4 Rest of MEA ePharmacy Market 2018-2028
3.5 Rest of the World ePharmacy Market 2018-2028
4. Competitive Landscape
4.1 Market Share Analysis
4.2 Merger and Acquisition
4.3 Agreement and Collaboration
4.4 Amazon and Alibaba – a real threat
5. Leading Companies
5.1 DocMoris NV
5.1.1. Business Overview
5.1.2 Financials
5.2 CVS CareMark
5.2.1 Business Overview
5.2.2 Financials
5.3 Lloyds Pharmacy Ltd.
5.3.1 Business Overview
5.3.2 Financials
5.4 Walgreens Boots Alliance
5.4.1 Business Overview
5.4.2 Financials
5.5 Pharmacy2U
5.5.1 Business Overview
5.5.2 Financials
5.6 Rowlands Pharmacy
5.6.1 Business Overview
5.6.2 Financials
5.7 Other Online Pharmaceuticals
5.7.2 Financials
6. Industry Analysis of the Market players (Porter’s Five Forces Analysis)
6.1 Bargaining Power of Suppliers
6.2 Competitive Rivalry
6.3 Bargaining Power of Buyers
6.4 Threat of New Entrants
6.5 Threat of Substitute
7. Conclusions
7.1 ePharmacy – An emerging market
7.2 Current Leading Geographies
7.3 Future Outlook of the market
7.4 Investment Opportunities
Appendices
Associated Reports
Visiongain Report Sales Order Form
Appendix A
About Visiongain
Appendix B
Visiongain Report Evaluation Form
List of Tables
Table 2.1. Online Pharmacy Legitimacy Monitoring: List of Country Specific Regulatory Body
Table 2.2. Retail Market Price and Online Pharmacy Price Comparisons: Drug Name and Price
Table 2.3. Distribution of Internet Users in the World from 2011 - 2017
Table 2.4. Internet Users Estimation; 2017, 2022 and 2028
Table 2.5. Geographical Distribution of Internet Users: % of the Total Population, 2017-2028
Table 2.6. World Population Aged 60 Years and Above by Region: 2017 -2028
Table 2.7. Country Specific Cyber Breach Recorded in 2017
Table 2.8. Drug trafficking offenses per drug through online pharmacy (%), (2017)
Table 2.9. Electronic Health Record Distribution by Region (%), 2016
Table. 2.10. Growing Healthcare Expenditure (% of GDP)
Table 2.11. Approximate distribution of digital buyers in Asia-Pacific (millions), 2016-2028
Table 3.1. Global ePharmacy Market 2018-2028: Revenue ($m), AGR (%), CAGR (%)
Table 3.2. Global ePharmacy Market 2018-2028 by Geography: Revenue ($m), AGR (%), CAGR (%)
Table 3.3. ePharmacy Market by Regional Share (%): 2017, 2022, 2028
Table.3.4. North America ePharmacy Market 2018-2028: Revenue ($m), AGR (%), CAGR (%)
Table 3.5. US ePharmacy Market 2018-2028: Revenue ($m), AGR (%), CAGR (%)
Table 3.6. Estimated Internet Penetration in the US (2017-2028)
Table 3.7. Population of People Aged 65 years and Above: 2016, 2020 and 2030
Table 3.8. Canada ePharmacy Market 2018-2028: Revenue ($m), AGR (%), CAGR (%)
Table 3.9. Estimated Internet Penetration in Canada (2017-2028)
Table 3.10. Mexico ePharmacy Market 2018-2028: Revenue ($m), AGR (%), CAGR (%)
Table 3.11. Estimated Internet Penetration in Mexico (2017-2028)
Table. 3.12. Europe ePharmacy Market 2018-2028: Revenue ($m), AGR (%), CAGR (%)
Table 3.13. Europe ePharmacy Market by Country Share (%): 2017, 2022, 2028
Table 3.14. UK ePharmacy Market 2018-2028: Revenue ($m), AGR (%), CAGR (%)
Table 3.15. Estimated Internet Penetration in the UK (2017-2028)
Table 3.16. Germany ePharmacy Market 2018-2028: Revenue ($m), AGR (%), CAGR (%)
Table 3.17. Estimated Internet Penetration in Germany (2017-2028)
Table. 3.18 Top Germany ePharmacy Market Players (% Share), 2017
Table 3.19 Italy ePharmacy Market 2018-2028: Revenue ($m), AGR (%), CAGR (%)
Table 3.20. Estimated Internet Penetration in Italy (2017-2028)
Table 3.21. France ePharmacy Market 2018-2028: Revenue ($m), AGR (%), CAGR (%)
Table 3.22. Estimated Internet Penetration in France (2017-2028)
Table 3.23. Spain and Portugal ePharmacy Market 2018-2028: Revenue ($m), AGR (%), CAGR (%)
Table 3.24. Estimated Internet Penetration in Spain (2017-2028)
Table 3.25. Estimated Internet Penetration in Portugal (2017-2028)
Table 3.26. Rest of Europe ePharmacy Market 2018-2028: Revenue ($m), AGR (%), CAGR (%)
Table 3.27. Asia-Pacific ePharmacy Market 2018-2028: Revenue ($m), AGR (%), CAGR (%)
Table 3.28. Asia-Pacific ePharmacy Market by Country Share (%): 2017, 2022, 2028
Table 3.29. India ePharmacy Market 2018-2028: Revenue ($m), AGR (%), CAGR (%)
Table 3.30. Estimated Internet Penetration in India (2017-2028)
Table 3.31. China ePharmacy Market 2018-2028: Revenue ($m), AGR (%), CAGR (%)
Table 3.32. China ePharmacy Market by Type of Drugs (% Share), 2017
Table 3.33. Estimated Internet Penetration in China (2017-2028)
Table 3.34. Japan ePharmacy Market 2018-2028: Revenue ($m), AGR (%), CAGR (%)
Table 3.35. Estimated Internet Penetration in Japan (2017-2028)
Table 3.36. Australia ePharmacy Market 2018-2028: Revenue ($m), AGR (%), CAGR (%)
Table 3.37. Estimated Internet Penetration in Australia (2017-2028)
Table 3.38. Rest of Asia-Pacific ePharmacy Market 2018-2028: Revenue ($m), AGR (%), CAGR (%)
Table 3.39. Middle East and Africa ePharmacy Market 2018-2028: Revenue ($m), AGR (%), CAGR (%)
Table 3.40 Middle East and Africa ePharmacy Market by Country Share (%): 2017, 2022, 2028
Table 3.41. GCC ePharmacy Market 2018-2028: Revenue ($m), AGR (%), CAGR (%)
Table 3.42. Egypt ePharmacy Market 2018-2028: Revenue ($m), AGR (%), CAGR (%)
Table 3.43. Estimated Internet Penetration in Egypt (2017-2028)
Table 3.44. South Africa ePharmacy Market 2018-2028: Revenue ($m), AGR (%), CAGR (%)
Table 3.45. Estimated Internet Penetration in South Africa (2017-2028)
Table 3.46. Rest of MEA ePharmacy Market 2018-2028: Revenue ($m), AGR (%), CAGR (%)
Table 3.47. Rest of the World ePharmacy Market 2018-2028: Revenue ($m), AGR (%), CAGR (%)
Table 4.1. Market Players in the ePharmacy Market: (% Share) 2017, 2022 and 2028
Table 4.2 Merger and Acquisition
Table 4.3 Agreement and Collaboration
Table 5.1. DocMoris NV: Net Sales ($m), AGR (%), CAGR (%), 2017-2028
Table 5.2. CVS CareMark: Gross Sales ($m), AGR (%), CAGR (%), 2017-2028
Table 5.3. Lloyds Pharmacy Ltd.: Net Sales ($m), AGR (%), CAGR (%), 2017-2028
Table 5.4. Walgreens Boots Alliance.: Net Sales ($m), AGR (%), CAGR (%), 2017-2028
Table 5.5 Pharmacy2U: Net Sales ($m), AGR (%), CAGR (%), 2017-2028
Table 5.6. Rowlands Pharmacy: Net Sales ($m), AGR (%), CAGR (%), 2017-2028
Table 5.7 Other ePharmacy Companies
Table 5.8. Other ePharmacy Companies: Net Sales ($m), AGR (%), CAGR (%), 2017-2028
Table 7.1. ePharmacy Market: Leading National Market (%) 2017, 2022, 2028
List of Figures
Figure 2.1 Internet User Distribution Over the Years
Figure 2.2 Distribution of Internet Users: 2017, 2022 and 2028
Figure 2.3 Geographical Distribution of Internet Users: % of the Total Population, 2017-2028
Figure 2.4 World Population Aged 60 Years and Above by Region: 2017 -2028
Figure 2.5 Country Specific Cyber Breach Recorded in 2017
Figure 2.6 Drug Trafficking Offenses per Drug through Online Pharmacy (%), 2017
Figure 2.7 Distribution of the Electronic Health Record by Region (%), 2016
Figure 2.8 Growing Healthcare Expenditure: % of GDP
Figure 2.9 Approximate distribution of digital buyers in Asia-Pacific (millions), 2016-2028
Figure 3.1 Global ePharmacy Market 2017-2028: Revenue ($m), AGR (%)
Figure 3.2 ePharmacy Market by Regional Share (%), 2017
Figure 3.3 ePharmacy Market by Regional Share (%), 2022
Figure 3.4 ePharmacy Market by Regional Share (%), 2028
Figure 3.5 North America ePharmacy Market 2017-2028: Revenue ($m), AGR (%)
Figure 3.6 US ePharmacy Market 2017-2028: Revenue ($m), AGR (%)
Figure 3.7 Canada ePharmacy Market 2017-2028: Revenue ($m), AGR (%)
Figure 3.8 Mexico ePharmacy Market 2017-2028: Revenue ($m), AGR (%)
Figure 3.9 Europe ePharmacy Market 2017-2028: Revenue ($m), AGR (%)
Figure 3.10 Europe ePharmacy Market by Country Share (%), 2017
Figure 3.11 Europe ePharmacy Market by Country Share (%), 2012
Figure 3.12 Europe ePharmacy Market by Country Share (%), 2028
Figure 3.13 UK ePharmacy Market 2017-2028: Revenue ($m), AGR (%)
Figure 3.14 Top UK ePharmacy Market Players (% Share), 2017
Figure 3.15 Germany ePharmacy Market 2017-2028: Revenue ($m), AGR (%)
Figure 3.16 Germany ePharmacy Market by Type of Drugs (% Share), 2017
Figure 3.17 Top Germany ePharmacy Market Players (% Share), 2017
Figure 3.18 Italy ePharmacy Market 2017-2028: Revenue ($m), AGR (%)
Figure 3.19 France ePharmacy Market 2017-2028: Revenue ($m), AGR (%)
Figure 3.20 Spain and Portugal ePharmacy Market 2017-2028: Revenue ($m), AGR (%)
Figure 3.21 Rest of Europe ePharmacy Market 2017-2028: Revenue ($m), AGR (%)
Figure 3.22 Asia-Pacific ePharmacy Market 2017-2028: Revenue ($m), AGR (%)
Figure 3.23 Asia-Pacific ePharmacy Market by Country Share (%), 2017
Figure 3.24 Asia-Pacific ePharmacy Market by Country Share (%), 2022
Figure 3.25 Asia-Pacific ePharmacy Market by Country Share (%), 2028
Figure 3.26 India ePharmacy Market 2017-2028: Revenue ($m), AGR (%)
Figure 3.27 China ePharmacy Market 2017-2028: Revenue ($m), AGR (%)
Figure 3.28 China ePharmacy by Type of Drugs (% Share), 2017
Figure 3.29 Japan ePharmacy Market 2017-2028: Revenue ($m), AGR (%)
Figure 3.30 Australia ePharmacy Market 2017-2028: Revenue ($m), AGR (%)
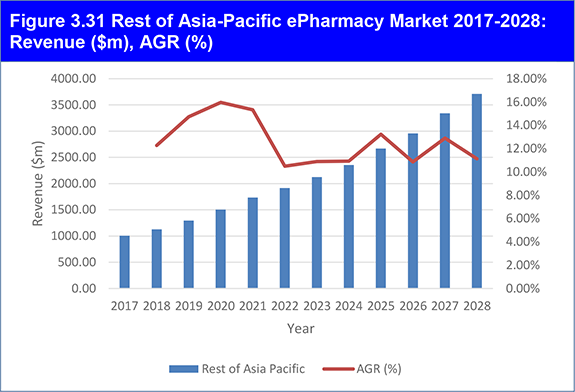
Figure 3.31 Rest of Asia-Pacific ePharmacy Market 2017-2028: Revenue ($m), AGR (%)
Figure 3.32 Middle East and Africa ePharmacy Market 2017-2028: Revenue ($m), AGR (%)
Figure 3.33 Middle ePharmacy Market by Country Share (%), 2017
Figure 3.34 Middle ePharmacy Market by Country Share (%), 2022
Figure 3.35 Middle ePharmacy Market by Country Share (%), 2028
Figure 3.36 GCC ePharmacy Market 2017-2028: Revenue ($m), AGR (%)
Figure 3.37 Egypt ePharmacy Market 2017-2028: Revenue ($m), AGR (%)
Figure 3.38 South Africa ePharmacy Market 2017-2028: Revenue ($m), AGR (%)
Figure 3.39 Rest of MEA ePharmacy Market 2017-2028: Revenue ($m), AGR (%)
Figure 3.40 Rest of the World ePharmacy Market 2017-2028: Revenue ($m), AGR (%)
Figure 4.1 Market Players in the ePharmacy Market: (% Share) 2017
Figure 4.2 Market Players in the ePharmacy Market: (% Share) 2022
Figure 4.3 Market Players in the ePharmacy Market: (% Share) 2028
Figure 5.1 DocMoris NV: Net Sales ($m), AGR (%), 2017-2028
Figure 5.2 CVS CareMark: Gross Sales ($m), AGR (%), 2017-2028
Figure 5.3 Lloyds Pharmacy Ltd.: Net Sales ($m), AGR (%), 2017-2028
Figure 5.4 Walgreens Boots Alliance: Net Sales ($m), AGR (%), 2017-2028
Figure 5.5 Pharmacy2U: Net Sales ($m), AGR (%), 2017-2028
Figure 5.6 Rowlands Pharmacy: Net Sales ($m), AGR (%), 2017-2028
Figure 5.7 Other ePharmacy Companies: Net Sales ($m), AGR (%), 2017-2028
Figure 6.1 Bargaining Power of Suppliers
Figure 6.2 Competitive Rivalry
Figure 6.3 Bargaining Power of Buyers
Figure 6.4 Threat of New Entrants
Figure 6.5 Threat of Substitute
0800 DocMorris
1mg
AAH Pharmaceuticals Ltd
Accredo
AHA Worldwide Ltd
Alibaba
Alliance Rx
Amazon
Apotheke Zue Rose
ASDA
Aster Pharmacy
AsterOnline
Banner Health
Boots
Briova
Celesio AG
Chemist Ware House
ChemistDirect
China Jo-Jo Drugstores
CVS Caremark
CVS Health
Deutsche Internet Apotheke
Deutsches Institut für Medizinische Dokumentation und Information (DIMDI)
Diplomat
DocMorris NV
Dr Fox Pharmacy
Drugs.com
Enzymatica
Eurapon Pharmahandel GmbH
Europa Apotheek
European Pharma handle GmBH
Express Scripts Holdings
Fareva LLC
FDA
Fouda Pharmacy
Giant Eagle Inc
GuoDa
Kroger Co
Kubilay Talu
Lloyds Pharmacy
Medisave
Medsafe
MedStar Health
MTS
MyCare
Myra
Netmeds
OptumRx
Pharma24
Pharmacy Guild of New Zealand
Pharmacy2U
Pharmacyonline.au
PharmEasy
PHOENIX group
PillsBills
PlanetRx.com
Prime Alliance LLP
Prime Therapeutics LLC
Rite Aid Stores
Rowlands Pharmacy
Royal Pharmaceutical Society of Great Britain
Sainsbury
SaniCare
Shop Apotheke NV
Superdrug
SurgiChem
Tesco
VitalSana
Walgreens Boots Alliance
Walmart
WebMD
Zue Rose Group, AG
List of Organisations Mentioned in the Report
Agence nationale de sécurité du medicament (ANSM)
Agence Régionale de Santé
Agência Nacional de Vigilância Sanitária (ANVISA)
Agenzia Italiana del Farmaco (AIFA)
All India Organization of Chemists & Druggists (AIOCD)
Canada Customs and Revenue Agency
Central Drugs Standards Control Organization (CDSCO)
China Food and Drug Administration
College ter Beoordeling van Geneesmiddelen / Medicines Evaluation Board
Department of Health and Ageing
European Court of Justice (ECJ)
European Union
General Pharmaceutical Council (GPhC)
Health Canada
Health Care Inspectorate (IGZ)
Health Products Regulatory Authority
Health Sciences Authority (HSA)
Indian Ministry of Health and Family Welfare
Instituto Nacional de Estadística (INE)
International Telecommunication Union
Israeli Ministry of Health
Italian Competition Authority (ICA)
Koninklijke Nederlandsche Maatschappij ter bevordering der Pharmacie (KNMP)
Medical and Healthcare Products Regulatory Agency (MHRA)
Ministère des Affaires sociales et de la Santé,
Ministry of Commerce of China
National Association of Board of Pharmacy (NABP)
National Association of Pharmacy Regulatory Authorities (NAPRA)
Ordre National des Pharmaciens
Pharmaceutical Society of New Zealand
Pharmacy Council of India
Professional Association of the State Boards of Pharmacy (NABP)
Singapore Pharmacy Council
The European Medicines Agency
The Federal Association of German Mail-Order Pharmacy
The General Pharmaceutical Council
The German Association of Pharmacists
The Pharmaceutical Society of Australia
The Pharmacy Guild of Australia
The Saudi Arabia Food Development Agency (SFDA)
Therapeutic Goods Administration
Therapeutic Products Directorate
United Nations Department of Economic and Social Affair
United Nations Office of Drugs and Crime
US Drug Enforcement Administration (DEA)
Download sample pages
Complete the form below to download your free sample pages for Global ePharmacy Market 2018-2028
Related reports
-

Top 25 Vaccines Market Forecast to 2029
Visiongain expects market growth from $25.19bn in 2018 to $40.80bn in 2024, growing at a CAGR of 8.42%. The developing...
Full DetailsPublished: 27 February 2020 -

Pharma Leader Series: Top 26 Asthma & COPD Companies 2020-2030
The global asthma & COPD therapies market was valued at $36.21bn in 2018 and is projected to grow to $60.8bn...
Full DetailsPublished: 17 February 2020 -

Global Vaccine Contract Manufacturing Market Report 2019-2029
The global vaccine contract manufacturing market was worth $1.9bn in 2018 and is expected to grow at a CAGR of...
Full DetailsPublished: 02 April 2019 -

Novel Coronavirus (COVID-19) Drugs in Development Market Forecast 2020-2030
Our 180+ page report provides 100+ tables, charts, and graphs. Read on to discover the most key areas in the...
Full DetailsPublished: 18 May 2020 -

Global Influenza Vaccines Market Outlook 2019-2029
The latest report from business intelligence provider visiongain offers comprehensive analysis of the global influenza vaccines market. Visiongain assesses that...
Full DetailsPublished: 05 July 2019 -

Clinical Trial Supply and Logistics Market for Pharma 2019-2029
The global clinical trial supply and logistics market for pharma is estimated to have reach $17.1bn in 2018, dominated by...
Full DetailsPublished: 18 April 2019 -

Global Clinical Trial Management System Market Forecast 2020-2030
The global market for clinical trial management systems was valued to be $1,152m in 2019 and is valued to reach...
Full DetailsPublished: 17 March 2020 -

Global Live Vaccines Market Forecast 2020-2030
The global live vaccines market was valued at $10,423.4 mn in 2019 and is anticipated to surpass $ 20,020 mn...
Full DetailsPublished: 12 March 2020
Download sample pages
Complete the form below to download your free sample pages for Global ePharmacy Market 2018-2028
Do you have any custom requirements we can help you with?
Any specific country, geo region, market segment or specific company information?
Email us today, we can discuss your needs and see how we can help: jamie.roberts@visiongain.com
Would you like a free report overview of the report of your choice?
If so, please drop an email to Jamie Roberts stating your chosen report title to jamie.roberts@visiongain.com
Visiongain’s reports are based on comprehensive primary and secondary research. Those studies provide global market forecasts (sales by drug and class, with sub-markets and leading nations covered) and analyses of market drivers and restraints (including SWOT analysis) and current pipeline developments. To find out more about our reports methodology, please email jamie.roberts@visiongain.com
“Thank you for this Gene Therapy R&D Market report and for how easy the process was. Your colleague was very helpful and the report is just right for my purpose. This is the 2nd good report from Visiongain and a good price.”
Dr Luz Chapa Azuella, Mexico
American Association of Colleges of Pharmacy
American College of Clinical Pharmacy
American Pharmacists Association
American Society for Pharmacy Law
American Society of Consultant Pharmacists
American Society of Health-System Pharmacists
Association of Special Pharmaceutical Manufacturers
Australian College of Pharmacy
Biotechnology Industry Organization
Canadian Pharmacists Association
Canadian Society of Hospital Pharmacists
Chinese Pharmaceutical Association
College of Psychiatric and Neurologic Pharmacists
Danish Association of Pharmaconomists
European Association of Employed Community Pharmacists in Europe
European Medicines Agency
Federal Drugs Agency
General Medical Council
Head of Medicines Agency
International Federation of Pharmaceutical Manufacturers & Associations
International Pharmaceutical Federation
International Pharmaceutical Students’ Federation
Medicines and Healthcare Products Regulatory Agency
National Pharmacy Association
Norwegian Pharmacy Association
Ontario Pharmacists Association
Pakistan Pharmacists Association
Pharmaceutical Association of Mauritius
Pharmaceutical Group of the European Union
Pharmaceutical Society of Australia
Pharmaceutical Society of Ireland
Pharmaceutical Society Of New Zealand
Pharmaceutical Society of Northern Ireland
Professional Compounding Centers of America
Royal Pharmaceutical Society
The American Association of Pharmaceutical Scientists
The BioIndustry Association
The Controlled Release Society
The European Federation of Pharmaceutical Industries and Associations
The European Personalised Medicine Association
The Institute of Clinical Research
The International Society for Pharmaceutical Engineering
The Pharmaceutical Association of Israel
The Pharmaceutical Research and Manufacturers of America
The Pharmacy Guild of Australia
The Society of Hospital Pharmacists of Australia
Latest Pharma news
Visiongain Publishes Drug Delivery Technologies Market Report 2024-2034
The global Drug Delivery Technologies market is estimated at US$1,729.6 billion in 2024 and is projected to grow at a CAGR of 5.5% during the forecast period 2024-2034.
23 April 2024
Visiongain Publishes Cell Therapy Technologies Market Report 2024-2034
The cell therapy technologies market is estimated at US$7,041.3 million in 2024 and is projected to grow at a CAGR of 10.7% during the forecast period 2024-2034.
18 April 2024
Visiongain Publishes Automation in Biopharma Industry Market Report 2024-2034
The global Automation in Biopharma Industry market is estimated at US$1,954.3 million in 2024 and is projected to grow at a CAGR of 7% during the forecast period 2024-2034.
17 April 2024
Visiongain Publishes Anti-obesity Drugs Market Report 2024-2034
The global Anti-obesity Drugs market is estimated at US$11,540.2 million in 2024 and is expected to register a CAGR of 21.2% from 2024 to 2034.
12 April 2024


