Industries > Aviation > Top 20 Commercial Airline Low Cost Carrier (LCC) Companies 2019
Top 20 Commercial Airline Low Cost Carrier (LCC) Companies 2019
Market Share Analysis, Revenue & Ranking of Leading Companies in the Budget Aviation Market Plus Analysis of Market by Service Type (Passenger Travel, Baggage Handling, Aircraft Operating Lease, and Freight Services)
The growing prevalence of low cost carriers (LCC) has led Visiongain to publish this unique report, which may be crucial to your company’s improved success.
The emergence of the budget aviation market for passenger transport and freight has had a transformative effect on the way in which people travel for leisure and work. Visiongain’s report analyses the leading 20 companies providing this vital service and reveals their competitive positioning.
Read on to discover how this definitive report can transform your own research and save you time.
• Do you need definitive data for the low cost carrier (LCC) competitive landscape?
• Succinct low cost carrier market commentary?
• Aviation industry insight?
• Clear competitor analysis?
• Actionable business recommendations?
Report highlights
• 163 tables, charts, and graphs
Market Share Analysis, Revenues And Ranking Of The Top 20 Low Cost Carrier (LCC) Companies
• Air Canada
• AirAsia
• Alaska Air Group
• Azul Brazilian Airlines
• EasyJet
• Eurowings
• Gol Tranportes Aereos
• IndiGo
• Jet Airways
• Jet2.com
• Jetblue
• Jetstar Airways
• Norwegian
• Pal Express
• Ryanair
• Southwest Airlines
• Spirit Airlines
• Vueling Airlines
• WestJet
• Wizz Air
The Following Information Is Provided For Each Of The Top 20 Companies
• LCC market share %
• LCC revenues $m
• LCC ranking
And In Most Cases The Following Information Is Also Provided
• Major Subsidiaries
• Aircraft Fleet
• Operating Revenue
• Segment Revenues
• Regional Revenues
• Net Profit/Loss
• Future Outlook
Key Questions Answered
• Who are the leading players, where are they positioned in the market and what are their future prospects?
• What are the market shares and revenues for each leading company in the low cost carrier market?
• How is the low cost carrier market evolving?
• What is driving and restraining low cost carrier market dynamics?
• Which individual technologies trends will prevail and how will these shifts be responded to?
• What will be the main drivers of the overall market?
• How will the leading companies adapt their strategies to accommodate changes in market conditions?
Target audience
• Airline operators
• Aircraft OEM’s & manufacturers
• Aircraft leasing companies
• Aircraft component manufacturers
• Freight companies
• Logistics companies
• Maintenance, Repair & Overhaul (MRO) Companies
• Modernization, Upgrade & Retrofit companies
• Disassembly, Dismantling & Recycling companies
• Cabin Seating & Interiors companies
• Charter companies,
• Package holiday companies
• Airports
• Regulators
• Consultants
• Market analysts
• Banks
• Government
• Investors
• CEO’s
• Business development managers
• Agencies
• Industry organizations’
Visiongain is a trading partner with the US Federal Government
CCR Ref number: KD4R6
1.1. Global Low Cost Carrier Market Overview
1.1.1. Low Cost Carrier Market: By Service Type
1.2. Why You Should Read This Report
1.3. How This Report Delivers
1.4. Key Questions Answered by This Analytical Report Include:
1.5. Who is This Report For?
1.6. Methodology
1.6.1. Primary Research
1.6.2. Secondary Research
1.6.3. Market Evaluation & Forecasting Methodology
1.7. Frequently Asked Questions (FAQ)
1.8. Associated Visiongain Reports
1.9. About Visiongain
2. Low Cost Carrier Analysis By Service Type
2.1. Introduction
2.2. Passenger Revenue Market Analysis
2.3. Baggage Fees Market Analysis
2.4. Aircraft Operating Lease Income Analysis
2.5. Freight Services Income Analysis
3. Market Dynamics
3.1. Low Cost Carrier Market Drivers
3.1.1. Low Operating Cost
3.1.2. High Load factor
3.1.3. Lower number of employee per departure
3.2. Low Cost Carrier Market Restraints
3.2.1. Increasing Fuel Prices
3.2.2. Stringent Government Rules and Regulations
3.3. Low Cost Carrier Market Opportunities
3.3.1. Increasing Passenger Traffic and Cargo Activity
3.3.2. Growth in Regional Connectivity in Developing Countries
4. Top-20 Companies Positioning in the Low Cost Carrier Market
4.1. Ranking of the Leading 20 Companies by Revenues in the Low Cost Carrier Market in 2017
4.2. What is the Level of Revenue Concentration in the Low Cost Carriers Marketplace in 2017?
4.3. AirAsia Company Overview
4.3.1. AirAsia Airlines Portfolio
4.3.2. AirAsia Airlines Aircraft Fleet
4.3.3. AirAsia Total Company Revenue 2013-2017
4.3.4. AirAsia Company Segment Revenue 2017
4.3.5. AirAsia Net Profit in 2013-2017
4.3.6. AirAsia Operating Profit 2013-2017
4.3.7. AirAsia Future Outlook
4.4. Norwegian Air Shuttle ASA Overview
4.4.1. Norwegian Major Subsidiaries
4.4.2. Norwegian Aircraft Fleet
4.4.3. Norwegian Air Shuttle Operating revenue in 2013-2017
4.4.4. Norwegian Air Shuttle Segment Revenue 2017
4.4.5. Norwegian Air Shuttle Regional Revenue 2017
4.4.6. Norwegian Air Shuttle EBIT in 2013-2017
4.4.7. Norwegian Air Shuttle Net Profit/Loss in 2013-2017
4.4.8. Norwegian Air Shuttle Future Outlook
4.5. EasyJet Company Overview
4.5.1. Easyjet Major Subsidiaries
4.5.2. Easyjet Aircraft Fleet
4.5.3. Easyjet Total Revenue 2014-2018
4.5.4. Easyjet Total Segment Revenue 2017
4.5.5. Easyjet Passenger Revenue 2014-2018
4.5.6. Easyjet Profit before Tax 2014-2018
4.5.7. Easyjet Future Outlook
4.6. Jetstar Airways Company Overview
4.6.1. Jetstar Group Major Subsidiaries
4.6.2. Jetstar Group Aircraft Fleet
4.6.3. Jetstar Group (Qantas) Total Company Revenue 2014-2018
4.6.4. Jetstar Group (Qantas) Operations Revenue 2014-2018 (US$m, AGR %)
4.6.5. Jetstar Group (Qantas) Segment Revenue 2017 (%)
4.6.6. Jetstar Group (Qantas) Net Capital Expenditure 2014-2018
4.6.7. Jetstar Future Outlook
4.7. Gol Transportes Aereos Company Overview
4.7.1. Gol Transportes Aereos (Gol Air) Aircraft Fleet
4.7.2. Gol Transportes Aereos (Gol Air) Total Revenue 2014-2017
4.7.3. Gol Transportes Aereos (Gol Air) Net Income 2013-2017
4.7.4. Gol Transportes Aereos (Gol Air) Segment Revenue 2017 (%)
4.7.5. Gol Transportes Aereos (Gol Air) Geographical Revenue 2017 (%)
4.7.6. Gol Future Scope
4.8. WestJet Company Overview
4.8.1. Westjet Major Subsidiaries
4.8.2. Westjet Aircraft Fleet
4.8.3. Westjet Total Revenue 2013-2017
4.8.4. Westjet Segmental Revenue 2017
4.8.5. Westjet Net Earning 2013-2017
4.8.6. Westjet Future Outlook
4.9. IndiGo Company Overview
4.9.1. IndiGo Major Subsidiary
4.9.2. IndiGo Aircraft Fleet
4.9.3. IndiGo Operating Revenue 2013-2017
4.9.4. IndiGo Net Income 2013-2017
4.9.5. IndiGo Segmental Revenue 2017 (%)
4.9.6. IndiGo Future Outlook
4.10. Southwest Airlines Company Overview
4.10.1. Southwest Airlines Major Subsidiaries
4.10.2. Southwest Airlines Operating Revenue 2013-2017
4.10.3. Southwest Airlines Segmental Revenue 2017(%)
4.10.4. Southwest Airlines Operating Income 2013-2017
4.10.5. Southwest Airlines Net Income 2013-2017
4.10.6. Southwest Airlines Future Outlook
4.11. Eurowing Company Overview
4.11.1. Eurowing Major Subsidiary
4.11.2. Eurowing Aircraft Fleet
4.11.3. Eurowing Parent Company Revenue 2013-2017
4.11.4. Eurowing Parent Segmental Revenue 2017 (%)
4.11.5. Eurowing Parent Company Net Profit 2013-2017
4.11.6. Eurowing Parent Company EBIT 2013-2017
4.11.7. Eurowing Future Outlook
4.12. Jetblue Company Overview
4.12.1. Jetblue Aircraft Fleet
4.12.2. Jetblue Company Revenue 2013-2017
4.12.3. Jetblue Company Net Income 2013-2017
4.12.4. Jetblue Segmental Revenue 2017(%)
4.12.5. Jetblue Future Outlook
4.13. Ryanair Company Overview
4.13.1. Ryanair Major Subsidiaries
4.13.2. Ryanair Total Operating Revenue 2013-2017
4.13.3. Ryanair Segmental Revenue 2017 (%)
4.13.4. Ryanair Operating Income 2013-2017
4.13.5. Ryanair Profit after Tax 2013-2017
4.13.6. Ryanair Future Outlook
4.14. Spirit Airlines Company Overview
4.14.1. Spirit Airlines Aircraft Fleet
4.14.2. Spirit Airlines Company Revenue 2013-2017
4.14.3. Spirit Airlines Company Net Income 2013-2017
4.14.4. Spirit Airlines Segmental Revenue 2017(%)
4.14.5. Spirit Airlines Future Outlook
4.15. Alaska Air Group Company Overview
4.15.1. Alaska Air Group Aircraft Fleet
4.15.2. Alaska Air Group Company Revenue 2013-2017
4.15.3. Alaska Air Group Company Net Income 2013-2017
4.15.4. Alaska Air Group Segmental Revenue 2017(%)
4.15.5. Alaska Air Group Future Outlook
4.16. Jet2.com Company Overview
4.16.1. Jet2.com Aircraft Fleet
4.16.2. Jet2.com Company Revenue 2013-2017
4.16.3. Jet2.com Company Operating Profit 2013-2017
4.16.4. Jet2.com Future Outlook
4.17. Pal Express (Air Philippine) Company Overview
4.17.1. Pal Express Future Outlook
4.18. Wizz Air Company Overview
4.18.1. Wizz Air Aircraft Fleet
4.18.2. Wizz Air Company Revenue 2014-2018
4.18.3. Wizz Air Company Net Profit 2014-2018
4.18.4. Wizz Air Segmental Revenue 2018 (%)
4.18.5. Wizz Air Future Outlook
4.19. Vueling Airline Company Overview
4.19.1. Vueling Airline Major Subsidiary
4.19.2. Vueling Airline Aircraft Fleet
4.19.3. Vueling Airlines Total Revenue 2013-2017
4.19.4. Vueling Airlines Segmental Revenue 2017 (%)
4.19.5. Vueling Airlines Operating Income 2013-2017
4.19.6. Vueling Airline Future Outlook
4.20 Jet Airways Company Overview
4.20.1. Jet Airways Major Subsidiary
4.20.2. Jet Airways Company Revenue 2013-2017
4.20.3. Jet Airways Company Profit After Tax 2013-2017
4.20.4. Jet Airways Future Outlook
4.21. Azul Brazilian Airlines Company Overview
4.21.1. Azul Brazilian Airline Aircraft Fleet
4.21.2. Azul Brazilian Airline Total Revenue 2014-2017
4.21.3. Azul Brazilian Airline Net Income 2013-2017
4.21.4. Azul Brazilian Airline Segment Revenue 2017 (%)
4.21.5. Azul Brazilian Airline Future Outlook
4.22. Air Canada Company Overview
4.22.1. Air Canada Parent Company Operating Revenue 2013-2017
4.22.2. Air Canada Parent Company Operating Income 2013-2017
4.22.3. Air Canada Parent Company Net Income 2013-2017
4.22.4. Air Canada Future Outlook
5. Glossary
5.1. Other Companies in the Low Cost Carrier Market
5.2. Abbreviations
List of Tables
Table 1.1 Overview of the 20 Low Cost Carrier Airlines Analysed
Table 4.1 20 Leading Suppliers Revenues in the Low Cost Carrier Market in 2017, Market Share (%)($, bn)
Table 4.2 AirAsia Company Overview (Company Revenue, Revenue, Ranking & Market Share in the Low Cost Airlines Market 2018, Low Cost carrier Segment, Service Portfolio, HQ, Employees, Website)
Table 4.3. AirAsia Airlines Product Portfolio
Table 4.4 AirAsia Total Fleet Size 2017
Table 4.5 AirAsia Total Company Revenue 2013-2017 (US$m, AGR %)
Table 4.6 AirAsia Net Profit in 2013-2017 (US$m, AGR %)
Table 4.7 AirAsia Operating Profit 2013-2017 (US$m, AGR %)
Table 4.8 Norwegian Air Shuttle ASA Overview (Company Revenue, Revenue, Ranking & Market Share in the Airline Market 2017, Segment, Product/Services Portfolio, HQ, Ticker, Employees, Website)
Table 4.9 Norwegian Major Subsidiaries
Table 4.10 Norwegian Total Fleet Size 2017
Table 4.11 Norwegian Air Shuttle Operating Revenue in 2013-2017 (US$m, AGR %)
Table 4.12 Norwegian Air Shuttle EBIT in 2013-2017 (US$m, AGR %)
Table 4.13 Norwegian Air Shuttle Net Profit/Loss in 2013-2017 (US$m, AGR %)
Table.4.14 EasyJet Overview (Company Revenue, Revenue, Ranking & Market Share in the Low Cost Carrier Market 2018, Segment, Portfolio, HQ, Ticker, Employees, Website)
Table.4.15 Easyjet Major Subsidiaries
Table 4.16 Easyjet Total Fleet Size 2017
Table 4.17 Easyjet Total Revenue 2014-2018 (US$m, AGR %)
Table 4.18 Easyjet Passenger Revenue 2014-2018 (US$m, AGR %)
Table 4.19 Easyjet Profit before Tax 2014-2018 (US$m, AGR %)
Table 4.20 Jetstar Airways Overview (Company Revenue, Revenue, Ranking & Market Share in the Low Cost Carrier Market 2018, Airline Segment, Portfolio, HQ, Ticker, Employees, Website)
Table 4.21 Jetstar Group Major Subsidiaries
Table 4.22 Jetstar Group (Qantas) Total Fleet Size 2017
Table 4.23 Jetstar Group (Qantas) Total Company Revenue 2014-2018 (US$m, AGR %)
Table 4.24 Jetstar Group (Qantas) Operations Revenue 2014-2018 (US$m, AGR %)
Table 4.25 Jetstar Group (Qantas) Net Capital Expenditure 2014-2018
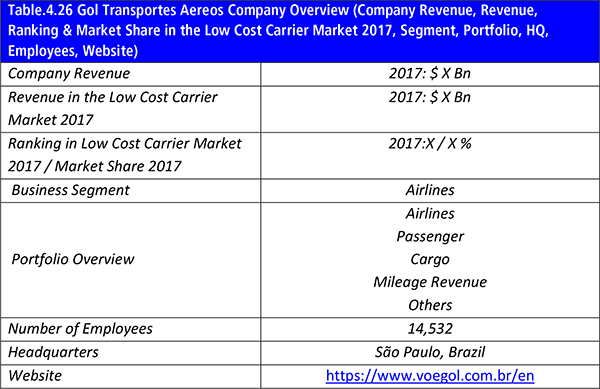
Table.4.26 Gol Transportes Aereos Company Overview (Company Revenue, Revenue, Ranking & Market Share in the Low Cost Carrier Market 2017, Segment, Portfolio, HQ, Employees, Website)
Table 4.27 Gol Transportes Aereos (Gol Air) Total Fleet Size 2017
Table 4.28 Gol Transportes Aereos (Gol Air) Total Revenue 2014-2017 (US$m, AGR %)
Table 4.29 Gol Transportes Aereos (Gol Air) Net Income 2013-2017 (US$m, AGR %)
Table.4.30 WestJet Company Overview (Company Revenue, Revenue, Ranking & Market Share in the Low Cost Carrier Market 2017, Airline Segment, HQ, Employees, Website)
Table.4.31 Westjet Major Subsidiaries
Table 4.32 Westjet Total Fleet Size 2017
Table 4.33 Westjet Total Revenue 2013-2017 (US$m, AGR %)
Table 4.34 Westjet Net Earning 2013-2017 (US$m, AGR %)
Table.4.35 IndiGo Company Overview (Company Revenue, Revenue, Ranking & Market Share in the Low Cost Carrier Market 2018, Airlines Segment, Portfolio, HQ, Employees, Website)
Table.4.36 IndiGo Major Subsidiary
Table 4.37 IndiGo Total Fleet Size 2018
Table 4.38 IndiGo Operating Revenue 2013-2017 (US$m, AGR %)
Table 4.39 IndiGo Net Income 2013-2017 (US$m, AGR %)
Table.4.40 Southwest Airlines Company Overview (Company Revenue, Revenue, Ranking & Market Share in the Low Cost Carrier Market 2017, Segment, Portfolio, HQ,Ticker, Website)
Table 4.41 Southwest Airlines Major Subsidiaries
Table 4.42 Southwest Airlines Operating Revenue 2013-2017 (US$m, AGR %)
Table 4.43 Southwest Airlines Operating Income 2013-2017 (US$m)
Table 4.44 Southwest Airlines Net Income 2013-2017 (US$m)
Table.4.45 Eurowing Company Overview (Company Revenue, Revenue, Ranking & Market Share in the Low Cost Carrier Market 2017, Segment, Portfolio, HQ, Employees, Website)
Table.4.46 Eurowing Major Subsidiary
Table 4.47 Eurowing (Group) Total Fleet Size 2017
Table 4.48 Eurowing Parent Company Revenue 2013-2017 (US$m, AGR %)
Table 4.49 Eurowing Parent Company Net Profit 2013-2017 (US$m, AGR %)
Table 4.50 Eurowing Parent Company EBIT 2013-2017 (US$m, AGR %)
Table.4.51 Jetblue Company Overview (Company Revenue, Revenue, Ranking & Market Share in the Low Cost Carrier Market 2017, Segment, Portfolio, HQ, Ticker, Website)
Table 4.52 Eurowing (Group) Total Fleet Size 2017
Table 4.53 Jetblue Company Revenue 2013-2017 (US$m, AGR %)
Table 4.54 Jetblue Net Income 2013-2017 (US$m, AGR %)
Table.4.55 Ryanair Company Overview (Company Revenue, Revenue, Ranking & Market Share in the Low Cost Carrier Market 2017, Segment, Portfolio, HQ, Employees, Website)
Table.4.56 Ryanair Major Subsidiaries
Table 4.57 Ryanair Total Operating Revenue 2013-2017 (US$m, AGR %)
Table 4.58 Ryanair Operating Income 2013-2017 (US$m, AGR %)
Table 4.59 Ryanair Profit after Tax 2013-2017 (US$m, AGR %)
Table.4.60 Spirit Airlines Company Overview (Company Revenue, Revenue, Ranking & Market Share in the Low Cost Carrier Market 2017, Segment, Portfolio, HQ, Employees, Website)
Table 4.61 Spirit Airlines Total Fleet Size 2017
Table 4.62 Spirit Airlines Company Revenue 2013-2017 (US$m, AGR %)
Table 4.63 Spirit Airlines Net Income 2013-2017 (US$m, AGR %)
Table.4.64 Alaska Air Group Company Overview (Company Revenue, Revenue, Ranking & Market Share in the Low Cost Carrier Market 2017, Segment, Portfolio, HQ, Employees, Website)
Table.4.65 Alaska Air Group Major Subsidiaries
Table 4.66 Alaska Air Group Total Fleet Size 2017
Table 4.67 Alaska Air Group Company Revenue 2013-2017 (US$m, AGR %)
Table 4.68 Alaska Air Group Net Income 2013-2017 (US$m, AGR %)
Table.4.69 Jet2.com Company Overview (Company Revenue, Revenue, Ranking & Market Share in the Sensor Market 2017, Segment, Portfolio, HQ, Employees, Website)
Table 4.70 Jet2.com Group Total Fleet Size 2017
Table 4.71 Jet2.com Company Revenue 2013-2017 (US$m, AGR %)
Table 4.72 Jet2.com Operating Profit 2013-2017 (US$m, AGR %)
Table.4.73 Pal Express (Air Philippine) Company Overview (Company Revenue, Revenue, Ranking & Market Share in the low cost carrier Market 2018, Segment, Portfolio, HQ, Employees, Website)
Table.4.74 Wizz Air Company Overview (Company Revenue, Revenue, Ranking & Market Share in the Low Cost Carrier Market 2017, Segment, Portfolio, HQ, Employees, Website)
Table 4.75 Jet2.com Group Total Fleet Size 2018
Table 4.76 Wizz Air Company Revenue 2014-2018 (US$m, AGR %)
Table 4.77 Wizz Air Net Profit 2014-2018 (US$m, AGR %)
Table.4.78 Vueling Airline Overview 2017 (Company Revenue, Revenue, Ranking & Market Share in the Low Cost Carrier Market 2017, Segment, Portfolio, HQ, Ticker, Contact, Employees, Website)
Table 4.79 Vueling Airlines Major Subsidiary
Table 4.80 Vueling Airline Total Fleet Size 2017
Table 4.81 Vueling Airline Total Revenue 2013-2017 (US$m, AGR %)
Table 4.82 Vueling Airlines Operating Income 2013-2017 (US$m, AGR %)
Table.4.83 Jet Airways Overview (Company Revenue, Revenue, Ranking & Market Share in the Low Cost Carrier Market 2017, Segment, Portfolio, HQ, Employees, Website)
Table.4.84 Jet Airways Major Subsidiary
Table 4.85 Jet Airways Company Revenue 2013-2017 (US$m, AGR %)
Table 4.86 Jet Airways Profit After Tax 2013-2017 (US$m, AGR %)
Table.4.87 Azul Brazilian Airlines Overview (Company Revenue, Revenue, Ranking & Market Share in the Low Cost Carrier Market 2017, Segment, Portfolio, HQ, Employees, Website)
Table 4.88 Azul Brazilian Airline Total Fleet Size 2017
Table 4.89 Azul Brazilian Airline Total Revenue 2014-2017 (US$m, AGR %)
Table 4.90 Azul Brazilian Airline Net Income 2013-2017 (US$m, AGR %)
Table.4.91 Air Canada Overview (Company Revenue, Revenue, Ranking & Market Share in the Low Cost Carrier Market 2018, Segment, Portfolio, HQ, Employees, Website)
Table 4.92 Air Canada Parent Company Operating Revenue 2013-2017 (US$m, AGR %)
Table 4.93 Air Canada Parent Company Operating Income 2013-2017 (US$m, AGR %)
Table 4.94 Air Canada Parent Company Net Income 2013-2017 (US$m, AGR %)
List of Figures
Figure 2.1 Low Cost Carrier Market by Service Type
Figure 4.1: Market Share of the 20 Leading Suppliers by Revenues in the Low Cost Carrier Market in 2017 ($bn)
Figure 4.2 Ranking of the 20 Leading Suppliers by Revenues in the Low Cost Carrier Market in 2017 ($bn)
Figure 4.3 Allocation of Market Shares in the Top-20 Low Cost Carrier Ranking (%, Top 5, Top 6-10, Top 11-15, Top 16-20, Other)
Figure 4.4 AirAsia Total Company Revenue 2013-2017 (US$m, AGR %)
Figure 4.5 AirAsia Company Segment Revenue 2017 (%)
Figure 4.6 AirAsia Net Profit in 2013-2017 (US$m, AGR %)
Figure 4.7 AirAsia Operating Profit 2013-2017 (US$m, AGR %)
Figure 4.8 Norwegian Air Shuttle Operating Revenue in 2013-2017 (US$m, AGR %)
Figure 4.9 Norwegian Air Shuttle Segment Revenue 2017 (%)
Figure 4.10 Norwegian Air Shuttle Regional Revenue 2017 (%)
Figure 4.11 Norwegian Air Shuttle EBIT in 2013-2017 (US$m, AGR %)
Figure 4.12 Norwegian Air Shuttle Net Profit/Loss in 2013-2017 (US$m, AGR %)
Figure 4.13 Easyjet Total Revenue 2014-2018 (US$m, AGR %)
Figure 4.14 Easyjet Total Segment Revenue 2017 (%)
Figure 4.15 Easyjet Passenger Revenue 2014-2018 (US$m, AGR %)
Figure 4.16 Easyjet Profit before Tax 2014-2018 (US$m, AGR %)
Figure 4.17 Jetstar Group (Qantas) Total Company Revenue 2014-2018 (US$m, AGR %)
Figure 4.18 Jetstar Group (Qantas) Operations Revenue 2014-2018 (US$m, AGR %)
Figure 4.19 Jetstar Group (Qantas) Segment Revenue 2017 (%)
Figure 4.20 Jetstar Group (Qantas) Net Capital Expenditure 2014-2018
Figure 4.21 Gol Transportes Aereos (Gol Air) Total Revenue 2014-2017 (US$m, AGR %)
Figure 4.22 Gol Transportes Aereos (Gol Air) Net Income 2013-2017 (US$m, AGR %)
Figure 4.23 Gol Transportes Aereos (Gol Air) Segment Revenue 2017 (%)
Figure 4.24 Gol Transportes Aereos (Gol Air) Geographical Revenue 2017 (%)
Figure 4.25 Westjet Total Revenue 2013-2017 (US$m, AGR %)
Figure 4.26 Westjet Segmental Revenue 2017 (US$ %)
Figure 4.27 Westjet Net Earning 2013-2017 (US$m, AGR %)
Figure 4.28 IndiGo Operating Revenue 2013-2017 (US$m, AGR %)
Figure 4.29 IndiGo Net Income 2013-2017 (US$m, AGR %)
Figure 4.30 IndiGo Segmental Revenue 2017 (%)
Figure 4.31 Southwest Airlines Operating Revenue 2013-2017 (US$m, AGR %)
Figure 4.32 Southwest Airlines Segmental Revenue 2017 ( %)
Figure 4.33 Southwest Airlines Operating Income 2013-2017 (US$m)
Figure 4.34 Southwest Airlines Net Income 2013-2017 (US$m)
Figure 4.35 Eurowing Parent Company Revenue 2013-2017 (US$m, AGR %)
Figure 4.36 Eurowing Parent Segmental Revenue 2017 (%)
Figure 4.37 Eurowing Parent Company Net Profit 2013-2017 (US$m, AGR %)
Figure 4.38 Eurowing Parent Company EBIT 2013-2017 (US$m, AGR %)
Figure 4.39 Jetblue Company Revenue 2013-2017 (US$m, AGR %)
Figure 4.40 Jetblue Net Income 2013-2017 (US$m, AGR %)
Figure 4.41 Jetblue Segmental Revenue 2017 ( %)
Figure 4.42 Ryanair Total Operating Revenue 2013-2017 (US$m, AGR %)
Figure 4.43 Ryanair Total Segmental Revenue 2017 (%)
Figure 4.44 Ryanair Operating Income 2013-2017 (US$m, AGR %)
Figure 4.45 Ryanair Profit after Tax 2013-2017 (US$m, AGR %)
Figure 4.46 Spirit Airlines Company Revenue 2013-2017 (US$m, AGR %)
Figure 4.47 Spirit Airlines Net Income 2013-2017 (US$m, AGR %)
Figure 4.48 Spirit Airlines Segmental Revenue 2017 ( %)
Figure 4.49 Alaska Air Group Company Revenue 2013-2017 (US$m, AGR %)
Figure 4.50 Alaska Air Group Net Income 2013-2017 (US$m, AGR %)
Figure 4.51 Alaska Air Group Segmental Revenue 2017 ( %)
Figure 4.52 Jet2.com Company Revenue 2013-2017 (US$m, AGR %)
Figure 4.53 Jet2.com Operating Profit 2013-2017 (US$m, AGR %)
Figure 4.54 Wizz Air Company Revenue 2014-2018 (US$m, AGR %)
Figure 4.55 Wizz Air Net Profit 2014-2018 (US$m, AGR %)
Figure 4.56 Wizz Air Segmental Revenue 2018 (%)
Figure 4.57 Vueling Airlines Total Revenue 2013-2017 (US$m, AGR %)
Figure 4.58 Vueling Airlines Segmental Revenue 2017 (%)
Figure 4.59 Vueling Airlines Operating Income 2013-2017 (US$m, AGR %)
Figure 4.60 Jet Airways Company Revenue 2013-2017 (US$m, AGR %)
Figure 4.61 Jet Airways Profit After Tax 2013-2017 (US$m, AGR %)
Figure 4.62 Azul Brazilian Airline Total Revenue 2014-2017 (US$m, AGR %)
Figure 4.63 Azul Brazilian Airline Net Income 2013-2017 (US$m, AGR %)
Figure 4.64 Azul Brazilian Airline Segment Revenue 2017 (%)
Figure 4.65 Air Canada Parent Company Operating Revenue 2013-2017 (US$m, AGR %)
Figure 4.66 Air Canada Parent Company Operating Income 2013-2017 (US$m, AGR %)
Figure 4.67 Air Canada Parent Company Net Income 2013-2017 (US$m, AGR %)
Agile Airport Services Private Limited.
Air Arabia
Air Arabia Egypt
Air Arabia Maroc
Air Busan
Air Cairo
Air Canada
Air Canada Rouge
Air Georgian
Air Manas
Air Pohang
Air Seoul
Air Transat
AirAsia India
AirAsia Indonesia
AirAsia Japan
AirAsia Philippines
AirAsia X Indonesia
AirAsia X Malaysia
AirAsia X Thailand
AirAsia
AirAsia Japan
AirAsia Malaysia
AirAsia Thailand
AirAsia X
airBaltic
Airblue
Airbus
Airjet Engineering Services Limited
Airjet Ground Services Limited
Airjet Security and Allied Services Limited
Airjet Training Services Limited
AirTran Holdings
Alaska Air Group
Allegiant Air
Anisec Luftfahrt
API Terminal, Inc.
Arctic Aviation Assets Ltd
Azul Brazilian Airlines
Beijing Capital Airlines
Blue Air
BlueBermuda Insurance LTD
Bombardier
Brussels Airlines
Buta Airways
Buzz Limited
Buzz Stansted Limited
Cathay Pacific
Cebgo
Cebu Pacific
China Airlines
China Everbright Group
China United Airlines
Citilink
Coinside Limited
Colorful Guizhou Airlines
Dy7 Aviation Ireland Limited
Eastar Jet
Easyfly
EasyInternetcafé
EasyJet
Easyjet Aircraft Company Limited
EasyJet Airline Company Limited
Easyjet Leasing Limited
Easyjet Malta Limited
Easyjet Sterling Limited
Easyjet Switzerland
EasySky
Embraer
Ethihad Airways
Eurowings
Exploits Valley Air
Fastjet
Fastjet Mozambique
Fastjet Tanzania
Fastjet Zimbabwe
Flair Airlines
Fly540
flyadeal
Flybondi
Flycana
flyDubai
Flynas
FlyOne
FlySafair
French Bee
Frontier Airlines
GAC Inc.
Germanwings
GoAir
Gol Dominicana Lineas Aereas SAS
Gol Finance Inc.
GOL Finance LLP.
Gol LuxCo S.A.
Gol Transportes Aereos (Gol Air) S.A.
Gulf Air
Hawaiian Airlines
HOP!
Iberia Express
IndiGo
Interjet
International Airlines Group (IAG).
Jambojet
Jazeera Airways
Jazz Sky Regional
Jeju Air
Jet Airways
Jet Airways (India) Limited
Jet Airways Europe Services N.V.
Jet Airways Training Academy Private Limited
Jet2.com
Jet2holidays
Jetblue
JetBlue Airways Corp Sucursal Colombia
Jetblue Travel Products
JetKonnect, Jet Airways Of India Inc.
Jetstar Airways
Jetstar Asia Airways
Jetstar Japan
Jetstar Pacific Airlines
Jiangxi Air
Jin Air
Kulula
Lanmei Airlines
Laudamotion (Amira Air)
Level
Lucky Air
Mango
Nas Asset Management Ltd
Nas Asset Management Norway AS
Nile Air
Nippon Airway
Nok Air
Norwegian Air Argentina
Norwegian Air International
Norwegian Air Norway AS
Norwegian Air Resources Holding Limited
Norwegian Air Shuttle
Norwegian Air Shuttle Polska Sp.Zo.O
Norwegian Air UK
Norwegian Cargo AS
Norwegian Holiday AS
Norwegian Long Haul AS
Novoair
Pal Express (Philippines Airline)
Peach Aviation
Pegasus Airlines
Philippines AirAsia
Pobeda
Qantas
Ruili Airlines
Ryanair Limited
Ryanair Sun
RyanAtlantic
Salam Air
Sky Airline
Skymark Airlines
SkyUp
Smiles Fidelidade
SN Airholding NV
Solaseed Air
Southwest ABQ RES Center, Inc.
Southwest Airlines
Southwest Airlines Eurofinance N.V.
Southwest Jet Fuel Co.
SpiceJet
Spirit Airlines
Spring Airlines
Spring Airlines Japan
Sun Country Airlines
Sunwing Airlines
Swoop
The Airline Group Limited
Tigerair Australia
Transavia
Transavia France
Triple Crown Insurance Co., Ltd
Tune Group
Turkish Airlines
T'way Air
Urumqi Air
US Bureau of Transportation
VietJet Air
Viva Air Peru
VivaAerobus
VivaColombia
Volaris
Volaris Costa Rica
Volotea
VRG Linhas Aéreas S.A.
Vueling Airlines
West Jet
WestJet
Westjet Encore
Westjet Link
Westjet Vacations Inc.
Wizz Air
WoW Air
Xiamen Airlines
Download sample pages
Complete the form below to download your free sample pages for Top 20 Commercial Airline Low Cost Carrier (LCC) Companies 2019
Related reports
-
Top 100 Connected Aircraft Companies: Ones to Watch in 2019
The emergence of connected aircraft and increasing R&D spending on the development of fully connected aircraft, has led Visiongain to...Full DetailsPublished: 12 December 2018 -

Commercial Aircraft Cabin Seating & Interiors Market Forecast 2018-2028
Visiongain assessed that the world market for commercial aircraft cabin seating & interiors will reach $16.4 billion in 2018....Full DetailsPublished: 11 September 2018 -

Unmanned Cargo Aircraft (UCA) Systems Market Report 2019-2029
The latest report from business intelligence provider Visiongain offers comprehensive analysis of the global unmanned cargo aircraft market. Visiongain assesses...
Full DetailsPublished: 26 October 2018 -

Commercial Aircraft Modernization, Upgrade and Retrofit Market Report 2018-2028
This brand new report on the commercial aircraft Modernisation upgrade and retrofit market features market sizing, forecasts and detailed contract...
Full DetailsPublished: 12 April 2018 -

Commercial Aircraft Maintenance, Repair & Overhaul (MRO) Market Report 2018-2028
Commercial aircraft MRO continues to play a critical role in the aviation industry Visiongain evaluates this market to be worth...
Full DetailsPublished: 16 May 2018 -

Manned Electric Aircraft Market Report 2019-2029
The latest demand in manned electric aircraft has led Visiongain to publish this unique report, which is crucial to your...Full DetailsPublished: 29 March 2019 -

Top 20 Commercial Aircraft Maintenance, Repair & Overhaul (MRO) Companies 2018
With an incredible amount of attention devoted to the commercial aircraft MRO market, actually deriving clear market information for the...
Full DetailsPublished: 24 April 2018 -

Chinese Commercial Aviation Market Forecast 2019-2029
Continuing development in China’s economy over the last decade has led to significant impacts on the domestic commercial aviation market....Full DetailsPublished: 11 January 2019 -

Commercial Aircraft Disassembly, Dismantling & Recycling Market Report 2018-2028
Visiongain assesses that the Commercial Aircraft Disassembly, Dismantling & Recycling market will reach US$6.1bn in 2018. ...Full DetailsPublished: 13 September 2018 -

Commercial Aircraft NextGen Avionics Market Report 2018-2028
Are you interested or involved in the $5.6bn Commercial Aircraft NextGen Avionics market? Visiongain has produced an in depth market...
Full DetailsPublished: 06 August 2018
Download sample pages
Complete the form below to download your free sample pages for Top 20 Commercial Airline Low Cost Carrier (LCC) Companies 2019
Do you have any custom requirements we can help you with?
Any specific country, geo region, market segment or specific company information?
Email us today, we can discuss your needs and see how we can help: jamie.roberts@visiongain.com
Visiongain aviation reports are compiled using a broad and rich mixture of both primary and secondary information to produce an overall industry outlook. In order to provide our clients with the best product possible product, we do not rely on any one single source of information. Visiongain analysts reach out to market-leading vendors and automotive industry experts but also review a wealth of financial data and product information from a vast range of sources. To find out more about our reports methodology please email jamie.roberts@visiongain.com
Would you like a free report overview of the report of your choice?
If so, please drop an email to Jamie Roberts stating your chosen report title to jamie.roberts@visiongain.com
Would you like to get the latest Visiongain aviation reports catalogue?
What are the dynamic growth sectors? where are the regional business opportunities?
Which technologies will prevail and who are the leading companies succeeding in these sectors and why?
If you want definitive answers to business critical questions, discover Visiongain’s full range of business intelligence reports.
If so, please email Jamie Roberts on jamie.roberts@visiongain.com or call her today on +44 207 336 6100
Airline Passenger Experience Association (APEX)
Airlines for America
Airport Consultants Council (ACC)
Airports Council International (ACI)
Airports Council International-North America
American Association of Airport Executives
Arab Air Carriers Organization (AACO)
European Aerospace Cluster Partnership
Global Business Travel Association (GBTA)
International Air Transport Association (IATA)
Security Industry Association (SIA)
Security Manufacturers Coalition
Women in Aviation
World Aviation Services
Don’t Miss Out!
Subscribe to receive the latest Industry news, trending insight and analysis straight to your inbox.Choose your preferences:
Latest Aviation news
Aircraft Computers Market
The global Aircraft Computers market is projected to grow at a CAGR of 5.7% by 2034
24 June 2024
Space Mining Market
The global Space Mining market is projected to grow at a CAGR of 20.7% by 2034
07 June 2024
Connected Aircraft Market
The global Connected Aircraft market is projected to grow at a CAGR of 17.2% by 2034
05 June 2024
Satellite Ground Station Market
The global Satellite Ground Station market was valued at US$65.69 billion in 2023 and is projected to grow at a CAGR of 13.3% during the forecast period 2024-2034.
21 May 2024
