Industries > Aviation > Chinese Commercial Aviation Market Forecast 2019-2029
Chinese Commercial Aviation Market Forecast 2019-2029
Forecasts & Analysis by Type (Narrow Body, Wide Body, Regional Jets, Very Large Aircraft), by Application (Passenger, Freight) Plus Analysis of Leading Companies Supplying Aircraft to Domestic Airlines & Freight Carriers
Continuing development in China’s economy over the last decade has led to significant impacts on the domestic commercial aviation market. Visiongain’s report on this sector gives a detailed overview of this market, creating an accurate picture that will offer clarity to anyone involved in the Aviation industry, especially with a focus on East Asia. Importantly, the report also delivers forecasts of key sectors and companies, giving you an insight into the future opportunities that exist in the Chinese Commercial Aviation market.
This report offers a global forecast, which is then broken down by the following segments:
• Chinese Commercial Aviation Market Forecast
• Chinese Commercial Aviation Market by Type
• Chinese Commercial Aviation Market by Application
• Chinese Commercial Aviation Market Restraints
• Chinese Commercial Aviation Market Drivers
And the following subsegments:
• Chinese Commercial Aviation Narrow Body Aircraft
• Chinese Commercial Aviation Wide Body Aircraft
• Chinese Commercial Aviation Regional Aircraft
• Chinese Commercial Aviation Super Jumbo Aircraft
• Chinese Commercial Aviation Passenger Submarket
• Chinese Commercial Aviation Freight Submarket
• Chinese Commercial Aviation Position of buyers, manufacturers and entrants in the industry
In order to offer an accurate snapshot of the current market, Visiongain has also profiled the following leading companies:
• United Aircraft Corporation
• Mitsubishi Heavy Industries
• Gulfstream Aerospace
• Embraer
• Boeing
• Airbus
• Textron Group
• Dassault
• Bombardier
With 150 tables and charts and a total length of over 150 pages, this report is a fantastic opportunity to increase your knowledge of this sector. SWOT/PEST analysis tables, as well as analysis of the drivers and restraints for the overall market concisely informs you of the major factors affecting this market, whilst Visiongain’s data-rich approach provides greater insight into this market.
Visiongain is a trading partner with the US Federal Government
CCR Ref number: KD4R6
1.1 Chinese Commercial Aviation Market Overview
1.2 Why You Should Read This Report
1.3 How This Report Delivers
1.4 Key Questions Answered by This Analytical Report Include:
1.5 Who is This Report For?
1.6 Methodology
1.6.1 Secondary Research
1.6.2 Market Evaluation & Forecasting Methodology
1.7 Frequently Asked Questions (FAQ)
1.8 Associated Visiongain Reports
1.9 About Visiongain
2. Introduction to the Chinese Commercial Aviation Market
2.1 Chinese Commercial Aviation Market Structure
2.2 Market Definition
2.3 Chinese Commercial Aviation Market by Type Definitions
2.3.1 Regional Aircraft Submarket Definition
2.3.2 Narrow Body Aircraft Submarket Definition
2.3.3 Wide Body Aircraft Submarket Definition
2.3.4 Super Jumbo Aircraft Submarket Definition
2.4 Chinese Commercial Aviation Market by Application Definitions
2.4.1 Passenger Submarket Definition
2.4.2 Freight Submarket Definition
3. Chinese Commercial Aviation Market 2019-2029
3.1 Chinese Commercial Aviation Market Forecast 2019-2029
3.2 Chinese Commercial Aviation Volume Forecast 2019-2029
3.3 Chinese Commercial Aviation Market Drivers & Restraints
3.3.1 Chinese Commercial Aviation Market Drivers 2019
3.3.1.1 Increasing traffic
3.3.1.2 Increasing income
3.3.1.3 Increasing demand for international travel
3.3.1.4 Increasing demand for cargo transport
3.3.1.5 Governmental support
3.3.2 Chinese Commercial Aviation Market Restraints 2019
3.3.2.1 Oligopolistic market structure
3.3.2.2 Airport infrastructure
4. Chinese Commercial Aviation Type Submarket Forecast 2019-2029
4.1 Chinese Commercial Aviation Market by Type Forecast 2019-2029
4.1.1 Narrow Body Aircraft
4.1.2 Wide Body Aircraft
4.1.3 Regional Aircraft
4.1.4 Super Jumbo Aircraft
4.2 Chinese Commercial Aviation Volume by Type Forecast 2019-2029
5. Chinese Commercial Aviation Application Submarket Forecast 2019-2029
5.1 Chinese Commercial Aviation Market by Application Forecast 2019-2029
5.1.1 Passenger Aircraft
5.1.2 Freight Aircraft
6. Porter’s Five Forces Analysis
6.1 Threat of New Entrants
6.2 Threat of Substitutes
6.3 Bargaining Power of Suppliers
6.4 Bargaining Power of Buyers
6.5 Intensity of Competitive Rivalry
7. Leading 10 Companies Supplying the Commercial Aviation Market
7.1 Leading 10 Chinese Commercial Aviation Companies 2018
7.2 Airbus SE
7.2.1 Introduction
7.2.2 Airbus Forecasts Chinese Aviation Market
7.2.3 Airbus SE Total Company Sales 2013 - 2017
7.2.4 Airbus SE Sales by Segment of Business 2013-2017
7.2.5 Airbus SE Net Income / Loss 2013-2017
7.2.6 Airbus SE Sales by Regional Segment of Business 2013-2017
7.2.7 Airbus SE Selected Recent Contracts, Partnership, and New Product Launches 2014-2018
7.2.8 Airbus SE Analysis
7.2.8.1 SWOT Analysis
7.2.8.2 Airbus SE Future Outlook
7.3 The Boeing Company
7.3.1 Introduction
7.3.2 Boeing’s China Aviation Market Forecast
7.3.3 The Boeing Company Total Company Sales 2013-2017
7.3.4 The Boeing Company Sales by Segment of Business 2013-2017
7.3.5 The Boeing Company Net Income / Loss 2013-2017
7.3.6 The Boeing Company Sales by Regional Segment of Business 2013-2017
7.3.7 The Boeing Company Selected Recent Programmes 2015-2018
7.3.8 The Boeing Company Analysis
7.3.8.1 SWOT Analysis
7.3.8.2 The Boeing Company Future Outlook
7.4 Bombardier
7.4.1 Introduction
7.4.2 Bombardier Total Company Sales 2013-2017
7.4.3 Bombardier Sales by Segment of Business 2013-2017
7.4.4 Bombardier Net Income / Loss 2013-2017
7.4.5 Bombardier Sales by Regional Segment of Business 2013-2017
7.4.6 Bombardier China Commercial Aviation Market Selected Recent Programmes 2015-2018
7.4.7 Bombardier Analysis
7.4.7.1 SWOT Analysis
7.4.7.2 Bombardier Future Outlook
7.5 Textron Group
7.5.1 Introduction
7.5.2 Textron Group Total Company Sales 2013-2017
7.5.3 Textron Group Sales by Segment of Business 2013-2017
7.5.4 Textron Group Net Income / Loss 2013-2017
7.4.5 Textron Group Sales by Regional Segment of Business 2013-2017
7.5.6 Textron Group Selected Recent Acquisitions, Contracts, and New Product Launches 2015-2017
7.5.7 Textron Group Analysis
7.5.7.1 SWOT Analysis
7.5.7.2 Textron Group Future Outlook
7.6 Commercial Aircraft Corporation of China,Ltd. (Comac)
7.6.1 Introduction
7.6.2 COMAC Selected Recent Acquisitions, Contracts, and New Product Launches 2015-2017
7.7 Dassault Aviation
7.7.1 Introduction
7.7.2 Dassault Aviation Total Company Sales 2013-2017
7.7.3 Dassault Aviation Sales by Segment of Business 2013-2017
7.7.4 Dassault Aviation Net Income / Loss 2013-2017
7.7.5 Dassault Aviation Sales by Regional Segment of Business 2013 - 2017
7.7.6 Dassault Aviation Analysis
7.7.6.1 SWOT Analysis
7.8 Embraer
7.8.1 Introduction
7.8.2 Embraer Total Company Sales 2013-2017
7.8.3 Embraer Sales by Segment of Business 2013-2017
7.8.4 Embraer Net Income / Loss 2013-2017
7.8.5 Embraer Selected Recent Contracts/New Product Launch/Merger & Acquisition/Partnership 2013-2017
7.8.6 Embraer Analysis
7.8.6.1 SWOT Analysis
7.9 Gulfstream Aerospace
7.9.1 Introduction
7.9.2 Gulfstream Aerospace Selected Recent Contracts/New Product Launch/Merger & Acquisition/Partnership 2014-18
7.10 Mitsubishi Heavy Industries
7.10.1 Introduction
7.10.2 Mitsubishi Heavy Industries Total Company Sales 2013-2017
7.10.3 Mitsubishi Heavy Industries Sales by Segment of Business 2016 - 2017
7.10.4 Mitsubishi Heavy Industries Net Income / Loss 2013-2017
7.10.5 Mitsubishi Heavy Industries Sales by Regional Segment of Business 2013-2017
7.10.6 Mitsubishi Heavy Industries China Commercial Aviation Market Selected Recent Contract (Singular) 2016
7.11 United Aircraft Corporation
7.11.1 Introduction
7.11.2 United Aircraft Corporation Total Company Sales 2013-2017
7.11.3 United Aircraft Corporation Sales by Segment of Business 2013-2016
7.11.4 United Aircraft Corporation Net Income / Loss 2017-2018
7.11.5 United Aircraft Corporation China Commercial Aviation Market Selected Recent Programmes 2016
8. Conclusions and Recommendations
9. Glossary
Associated Visiongain Reports
Visiongain Report Sales Order Form
Appendix A
About Visiongain
Appendix B
Visiongain report evaluation form
List of Tables
Table 3.1 Chinese Commercial Aviation Market Forecast 2019-2029 (US$B, AGR %, CAGR %, Cumulative)
Table 3.2 Chinese Commercial Aviation Volume Forecast 2019-2029 (Units, AGR %, CAGR %, Cumulative)
Table 3.3 Chinese Commercial Aviation Market Drivers & Restraints 2019
Table 4.1 Chinese Commercial Aviation Market by Type Submarket Forecast 2019-2029 (US$B, AGR %, CAGR %, Cumulative)
Table 4.2 Chinese Commercial Aviation Submarket CAGR Forecast 2019-2024, 2024-2029, 2019-2029 (CAGR %)
Table 4.3 Chinese Commercial Aviation Submarket Percentage Change in Market Share 2019-2024, 2024-2029, 2019-2029 (% Change)
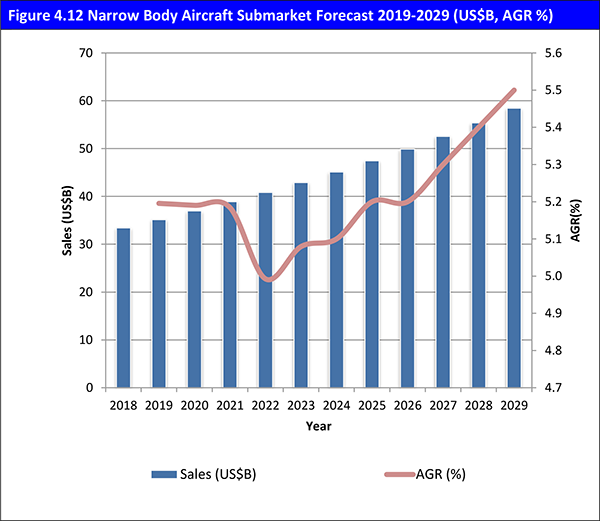
Table 4.3 Narrow Body Aircraft Submarket Forecast 2019-2029 (US$B, AGR %, CAGR %, Cumulative)
Table 4.4 Wide Body Aircraft Submarket Forecast 2019-2029 (US$B, AGR %, CAGR %, Cumulative)
Table 4.5 Regional Aircraft Submarket Forecast 2019-2029 (US$B, AGR %, CAGR %, Cumulative)
Table 4.6 Super Jumbo Aircraft Submarket Forecast 2019-2029 (US$B, AGR %, CAGR %, Cumulative)
Table 4.7 Chinese Commercial Aviation Volume by Type Submarket Forecast 2019-2029 (Units, AGR %, CAGR %, Cumulative)
Table 5.1 Chinese Commercial Aviation Market by Application Submarket Forecast 2019-2029 ($m, AGR %, CAGR %, Cumulative)
Table 5.2 Chinese Commercial Aviation Application Submarket CAGR Forecast 2019-2024, 2024-2029, 2019-2029 (CAGR %)
Table 5.3 Chinese Commercial Aviation Application Submarket Percentage Change in Market Share 2019-2024, 2024-2029, 2019-2029 (% Change)
Table 5.4 Passenger Aircraft Submarket Forecast 2019-2029 (US$B, AGR %, CAGR %, Cumulative)
Table 5.5 Freight Aircraft Submarket Forecast 2019-2029 (US$B, AGR %, CAGR %, Cumulative)
Table 7.1 Leading 10 Commercial Aviation Companies Supplying the Chinese Commercial Aviation Market - Listed Alphabetically (Company, FY 2017 Total Company Sales US$m Latest, HQ)
Table 7.2 Airbus SE Profile 2017 (CEO, Total Company Sales US$m, Net Income US$m, HQ, Founded, No. of Employees, Ticker, Website)
Table 7.3 Airbus SE Total Company Sales 2013-2017 (US$m, AGR %)
Table 7.4 Airbus SE Sales by Segment of Business 2013-2017 (US$m, AGR %)
Table 7.5 Airbus SE Net Income / Loss 2013-2017 (US$m)
Table 7.6 Airbus SE Sales by Regional Segment of Business 2013-2017 (US$m, AGR %)
Table 7.7 Airbus SE Connectivity Selected Recent Contracts, Partnership, and New Product Launches 2015-2018 (Date, Programme Type, Details)
Table 7.8 Airbus SE SWOT Analysis
Table 7.9 The Boeing Company Profile 2017 (CEO, Total Company Sales US$m, Net Income US$m, HQ, Founded, No. of Employees FY2017, Ticker, Website)
Table 7.10 The Boeing Company Total Company Sales 2013-2017 (US$m, AGR %)
Table 7.11 The Boeing Company Sales by Segment of Business 2013-2017 (US$m, AGR %)
Table 7.12 The Boeing Company Net Income / Loss 2013-2017 (US$m)
Table 7.13 The Boeing Company Sales by Regional Segment of Business 2013-2017 (US$m, AGR %)
Table 7.14 The Boeing Company Selected Recent Programme 2015-2018 (Date, Development Type, Details)
Table 7.15 The Boeing Company SWOT Analysis
Table 7.16 Bombardier Profile 2017 (CEO, Total Company Sales US$m, Net Income US$m, HQ, Founded, No. of Employees, Ticker, Website)
Table 7.17 Bombardier Total Company Sales 2013-2017 (US$m, AGR %)
Table 7.18 Bombardier Sales by Segment of Business 2014-2017 (US$m, AGR %)
Table 7.19 Bombardier Net Income / Loss 2013-2017 (US$m)
Table 7.20 Bombardier Sales by Regional Segment of Business 2013-2017 (US$m, AGR %)
Table 7.21 Bombardier Selected Recent New Contracts/Product Launches/ Developments/Mergers &Acquisitions/ Partnership agreements 2015-2018 (Date, Programme Type, Details)
Table 7.22 Bombardier SWOT Analysis
Table 7.23 Textron Group Profile 2017 (CEO, Total Company Sales US$m, Net Income US$m, HQ, Founded, No. of Employees, Ticker, Website)
Table 7.24 Textron Group Total Company Sales 2013-2017 (US$m, AGR %)
Table 7.25 Textron Group Sales by Segment of Business 2013-2017 (US$m, AGR %)
Table 7.26 Textron Group Net Income / Loss 2013-2017 (US$m)
Table 7.27 Textron Group Sales by Regional Segment of Business 2013-2017 (US$m, AGR %)
Table 7.28 Textron Group Selected Recent Acquisitions, Contracts, and New Product Launches 2015-2018 (Date, Programme Type, Details)
Table 7.29 Textron Group SWOT Analysis
Table 7.30 Comac Profile 2017 (CEO, Total Company Sales US$m, Net Income US$m, HQ, Founded, No. of Employees, Ticker, Website)
Table 7.31 COMAC Selected Recent Acquisitions, Contracts, and New Product Launches 2018 (Date, Programme Type, Details)
Table 7.32 Dassault Aviation Profile 2017 (CEO, Total Company Sales US$m, Net Income US$m, HQ, Founded, No. of Employees, Ticker, Website)
Table 7.33 Dassault Aviation Total Company Sales 2013-2017 (US$m, AGR %)
Table 7.34 Dassault Aviation Sales by Segment of Business 2013-2017 (US$m, AGR %)
Table 7.35 Dassault Aviation Net Income / Loss 2013-2017 (US$m)
Table 7.36 Dassault Aviation Sales by Regional Segment of Business 2013-2017(US$m, AGR %)
Table 7.37 Dassault Aviation SWOT Analysis
Table 7.38 Embraer Profile 2017 (CEO, Total Company Sales US$m, Net Income US$m, HQ, Founded, No. of Employees FY2016, Ticker, Website)
Table 7.39 Embraer Total Company Sales 2013-2017 (US$m, AGR %)
Table 7.40 Embraer Sales by Segment of Business 2013-2017 (US$m, AGR %)
Table 7.41 Embraer Net Income / Loss 2013-2017 (US$m)
Table 7.42 Embraer Selected Recent Contracts/New Product Launch/Merger & Acquisition/Partnership 2013-17 (Date, Programme Type, Details)
Table 7.43 Embraer SWOT Analysis
Table 7.44 General Dynamics Profile 2017 (CEO, Total Company Sales US$m, Net Income US$m, HQ, Founded, No. of Employees FY2016, Ticker, Website)
Table 7.45 Gulfstream Aerospace Selected Recent Contracts/New Product Launch/Merger & Acquisition/Partnership 2018 (Date, Programme Type, Details)
Table 7.46 Mitsubishi Heavy Industries Profile 2016 (CEO, Total Company Sales US$m, Net Income US$m, HQ, Founded, No. of Employees, Ticker, Website)
Table 7.47 Mitsubishi Heavy Industries Total Company Sales 2014-2018 (US$m, AGR %)
Table 7.48 Mitsubishi Heavy Industries Sales by Segment of Business 2016-2017 (US$m, AGR %)
Table 7.49 Mitsubishi Heavy Industries Net Income / Loss 2014-2018 (US$m)
Table 7.50 Mitsubishi Heavy Industries Sales by Regional Segment of Business 2013-2017 (US$m, AGR %)
Table 7.51 Mitsubishi Heavy Industries Selected Recent Partnership(Singular) 2016 (Date, Programme Type, Details)
Table 7.52 UAC Profile 2017 (CEO, Total Company Sales US$m, Net Income US$m, HQ, Founded, No. of Employees, Ticker, Website)
Table 7.53 United Aircraft Corporation Total Company Sales 2014-2018 (US$m, AGR %)
Table 7.54 United Aircraft Corporation Sales by Segment of Business 2013-2017 (US$m, AGR %)
Table 7.55 United Aircraft Corporation Net Income / Loss 2013-2017 (US$m)
Table 7.56 United Aircraft Corporation Selected Recent Partnership 2016 (Date, Programme Type, Details)
Table 7.57 Irkut Corporation Profile 2017 (CEO, Total Company Sales US$m, Net Income US$m, HQ, Founded, No. of Employees, Ticker, Website)
Table 7.58 United Aircraft Corporation Total Company Sales 2012-2016 (US$m, AGR %)
Table 7.59 Irkut Corporation Sales by Segment of Business 2012-2017 (US$m, AGR %)
Table 7.60 United Aircraft Corporation Net Income / Loss 2013-2017 (US$m)
Table 7.61 United Aircraft Corporation Selected Recent Partnership 2016 (Date, Programme Type, Details)
Table 7.62 ATR Profile 2017 (CEO, Total Company Sales US$m, Net Income US$m, HQ, Founded, No. of Employees, Ticker, Website)
Table 7.63 ATR Selected Recent Partnership 2016 (Date, Programme Type, Details)
List of Figures
Figure 2.1 Chinese Commercial Aviation Market Segmentation Overview
Figure 3.1 Chinese Commercial Aviation Market Forecast 2019-2029 ($, AGR %)
Figure 3.2 Chinese Commercial Aviation Volume Forecast 2019-2029 (Units, AGR %)
Figure 3.3 Passenger traffic growth in China (units in millions, AGR %)
Figure 3.4 GDP Per Capita in China ($, AGR %) 2008-2017
Figure 4.1 Chinese Commercial Aviation Market by Type Submarket AGR Forecast 2019-2029 (AGR %)
Figure 4.2 Chinese Commercial Aviation Market by Type Submarket Forecast 2019-2029 (US$B, AGR %)
Figure 4.3 Chinese Commercial Aviation Market by Expenditure Submarket Market Shares 2019 (% Share)
Figure 4.4 Chinese Commercial Aviation Market by Expenditure Submarket Market Shares 2024 (% Share)
Figure 4.5 Chinese Commercial Aviation Market by Expenditure Submarket Market Shares 2029 (% Share)
Figure 4.6 Chinese Commercial Aviation Submarket CAGR Forecast 2019-2024 (CAGR %)
Figure 4.7 Chinese Commercial Aviation Submarket CAGR Forecast 2024-2029 (CAGR %)
Figure 4.8 Chinese Commercial Aviation Submarket CAGR Forecast 2019-2029 (CAGR %)
Figure 4.9 Chinese Commercial Aviation Submarket Percentage Change in Market Share 2017-2022 (% Change)
Figure 4.10 Chinese Commercial Aviation Submarket Percentage Change in Market Share 2022-2027 (% Change)
Figure 4.11 Chinese Commercial Aviation Submarket Percentage Change in Market Share 2017-2027 (% Change)
Figure 4.12 Narrow Body Aircraft Submarket Forecast 2019-2029 (US$B, AGR %)
Figure 4.13 Wide Body Aircraft Submarket Forecast 2019-2029 (US$B, AGR %)
Figure 4.14 Regional Aircraft Submarket Forecast 2019-2029 (US$B, AGR %)
Figure 4.15 Super Jumbo Aircraft Submarket Forecast 2019-2029 (US$B, AGR %)
Figure 4.16 Chinese Commercial Aviation Market by Type Submarket AGR Forecast 2019-2029 (AGR %)
Figure 4.17 Chinese Commercial Aviation Market by Type Submarket Forecast 2019-2029 (Units, AGR %)
Figure 5.1 Chinese Commercial Aviation Market by Type Submarket AGR Forecast 2019-2029 (AGR %)
Figure 5.2 Chinese Commercial Aviation Market by Application Submarket Forecast 2019-2029 (US$B, AGR %)
Figure 5.3 Chinese Commercial Aviation Market by Expenditure Submarket Market Shares 2019 (% Share)
Figure 5.4 Chinese Commercial Aviation Market by Expenditure Submarket Market Shares 2024 (% Share)
Figure 5.5 Chinese Commercial Aviation Market by Expenditure Submarket Market Shares 2029 (% Share)
Figure 5.6 Chinese Commercial Aviation Application Submarket CAGR Forecast 2019-2024 (CAGR %)
Figure 5.7 Chinese Commercial Aviation Application Submarket CAGR Forecast 2024-2029 (CAGR %)
Figure 5.8 Chinese Commercial Aviation Application Submarket CAGR Forecast 2019-2029 (CAGR %)
Figure 5.9 Chinese Commercial Aviation Application Submarket Percentage Change in Market Share 2017-2022 (% Change)
Figure 5.10 Chinese Commercial Aviation Application Submarket Percentage Change in Market Share 2022-2027 (% Change)
Figure 5.11 Chinese Commercial Aviation Application Submarket Percentage Change in Market Share 2017-2027 (% Change)
Figure 5.12 Passenger Aircraft Submarket Forecast 2019-2029 (US$B, AGR %)
Figure 5.13 Freight Submarket Forecast 2019-2029 (US$B, AGR %)
Figure 7.1 Airbus SE Total Company Sales 2013-2017 (US$ M, AGR %)
Figure 7.2 Airbus SE Sales by Segment of Business 2013-2017 (US$m, Total Company Sales AGR %)
Figure 7.3 Airbus SE Sales AGR by Segment of Business 2014-2017 (AGR %)
Figure 7.4 Airbus SE Net Income / Loss 2013-2017 (US$m)
Figure 7.5 Airbus SE Sales by Regional Segment of Business 2013-2017 (US$m, Total Company Sales AGR %)
Figure 7.6 Airbus SE Sales AGR by Regional Segment of Business 2014-2017 (AGR %)
Figure 7.7 The Boeing Company Total Company Sales 2013-2017 (US$m, AGR %)
Figure 7.8 The Boeing Company Sales by Segment of Business 2013-2017 (US$m, Total Company Sales AGR %)
Figure 7.9 The Boeing Company Sales AGR by Segment of Business 2014-2017 (AGR %)
Figure 7.10 The Boeing Company Net Income / Loss 2013-2017 (US$m)
Figure 7.11 The Boeing Company Sales by Regional Segment of Business 2013-2017 (US$m, Total Company Sales AGR %)
Figure 7.12 The Boeing Company Sales AGR by Regional Segment of Business 2013-2017 (AGR %)
Figure 7.13 Bombardier Total Company Sales 2013-2017 (US$m, AGR %)
Figure 7.14 Bombardier Sales by Segment of Business 2013-2017 (US$m)
Figure 7.15 Bombardier Sales AGR by Segment of Business 2014-2017 (US$m)
Figure 7.16 Bombardier Net Income / Loss 2013-2017 (US$m)
Figure 7.17 Bombardier Sales by Regional Segment of Business 2013-2017 (US$m, Total Company Sales AGR %)
Figure 7.18 Bombardier Sales AGR by Regional Segment of Business 2014-2017 (AGR %)
Figure 7.19 Textron Group Total Company Sales 2013-2017 (US$m, AGR %)
Figure 7.20 Textron Group Sales by Segment of Business 2013-2017 (US$m, Total Company Sales AGR %)
Figure 7.21 Textron Group Sales AGR by Segment of Business 2014-2017 (AGR %)
Figure 7.22 Textron Group Net Income / Loss 2013-2017 (US$m)
Figure 7.23 Textron Group Sales by Regional Segment of Business 2013-2017 (US$m, Total Company Sales AGR %)
Figure 7.24 Textron Group Sales AGR by Regional Segment of Business 2014-2017 (AGR %)
Figure 7.25 Dassault Aviation Total Company Sales 2013-2017 (US$m, AGR %)
Figure 7.26 Dassault Aviation Sales by Segment of Business 2013-2017 (US$m)
Figure 7.27 Dassault Aviation Sales AGR by Segment of Business 2014-2017 (AGR %)
Figure 7.28 Dassault Aviation Net Income / Loss 2013-2017 (US$m)
Figure 7.29 Dassault Aviation Sales by Regional Segment of Business 2013-2017 (US$m)
Figure 7.30 Dassault Aviation Sales AGR by Regional Segment of Business 2014-2017 (AGR %)
Figure 7.31 Embraer Total Company Sales 2013-2017 (US$m, AGR %)
Figure 7.32 Embraer Sales by Segment of Business 2013-2017 (US$m)
Figure 7.33 Embraer Sales AGR by Segment of Business 2014-2017 (AGR %)
Figure 7.34 Embraer Net Income / Loss 2013-2017 (US$m)
Figure 7.35 Mitsubishi Heavy Industries Total Company Sales 2013-2017 (US$m, AGR %)
Figure 7.36 Mitsubishi Heavy Industries Sales by Segment of Business 2016 -2017 (US$m)
Figure 7.37 Mitsubishi Heavy Industries Net Income / Loss 2013-2017
Figure 7.38 Mitsubishi Heavy Industries Sales by Regional Segment of Business 2013-2017 (US$m)
Figure 7.39 Mitsubishi Heavy Industries Sales AGR by Regional Segment of Business 2014-2017 (AGR %)
Figure 7.40 United Aircraft Corporation Total Company Sales 2013-2017 (US$m, AGR %)
Figure 7.41 United Aircraft Corporation Sales by Segment of Business 2013-2016 (US$m)
Figure 7.42 United Aircraft Corporation Sales AGR by Segment of Business 2014-2016 (AGR %)
Figure 7.43 United Aircraft Corporation Net Income / Loss 2013-2017 (US$m)
Adient Aerospace
Aero Engine Corporation of China (AECC)
Aero Equipment S.A.S
Airbus
Airbus Americas, Inc
Airbus Engineering Centre Ltd
Airbus Group SE
Airbus ProSky
Aviation Industry Corporation of China Ltd (AVIC)
Beechcraft Corporation
Beijing Aeronautical Scince and technology Research institute (BASTRI)
Boeing
Bombardier
Changchun Longija Airport
China Aircraft Leasing Company
China Aviation Supplies Holding Company (CASC)
China Eastern Air Holding Group
China Eastern Airlines
China Express Airlines
China National Aviation Holding Group
China Postal Airlines
China Southern Air Holding Group
China-Russia Aircraft International Co, Ltd (CRAIC)
Colorful Guizhou Airlines
Colorful Yunnan General Aviation Co., Ltd
Commercial Aircraft Corporation of China (COMAC)
Dassault
Donghai Airlines
Embraer
General Dynamics
Genghis Khan Airlines
Hairuo General Aviation Co
Hawker Pacific Asia
Hebei Sky-Blue International Aviation Academy Co., Ltd
Hohhot Baita Airport
Hong Kong Airlines
Industrial Bank Financial Leasing Co, Ltd (CIB Leasing)
Irkut Corporation
Juneyao Airlines
KID-Systems
Leonardo
Lockheed Martin Corporation
Mandarin Airlines (Taiwan)
Matsusaka Aircraft Parts Manufacturing Company
Meggitt Polymers Composites
Mirage
Thales Group
Mitsubishi Heavy Industries
Nanchang Changbei Airport
Northrop Grumman Corporation
Okay Airlines
PEMCO World Air Services
Rafale
Ruili Airlines
Shaanxi tianju Investment Group
Shanghai Aircraft Manufacturing Co., Ltd (SAMC)
Shinwa Industry
Sukhoi Aviation Holding Company
Tainjin Free Trade Zone Investing Company (TJFTZ)
Taiyuan Wusu Airport
Textron Group
United Aircraft Corporation
Urumqi Air
HNA Group
Xiamen Airlines
Xuzhou Hantong Aviation Development Co., LTD
Download sample pages
Complete the form below to download your free sample pages for Chinese Commercial Aviation Market Forecast 2019-2029
Related reports
-

Global Autonomous Aircraft Market Report 2019-2029
Evolution of smart drones and reduced emissions has increased the autonomous aircraft market size.
...Full DetailsPublished: 01 January 1970 -

Lithium-Ion Battery Market Report 2019-2029
Visiongain values the lithium-ion battery market at $42.3bn in 2019.
...Full DetailsPublished: 16 May 2019 -

Aircraft Battery Market Report 2019-2030
This timely, 166-page study will enhance your strategic decision making, update you with crucial market developments and, ultimately, help to...
Full DetailsPublished: 24 July 2019 -

Commercial Aircraft Disassembly, Dismantling & Recycling Market Report 2018-2028
Visiongain assesses that the Commercial Aircraft Disassembly, Dismantling & Recycling market will reach US$6.1bn in 2018. ...Full DetailsPublished: 13 September 2018 -

Commercial Aircraft Cabin Seating & Interiors Market Forecast 2018-2028
Visiongain assessed that the world market for commercial aircraft cabin seating & interiors will reach $16.4 billion in 2018....Full DetailsPublished: 11 September 2018 -

Commercial Aircraft Modernization, Upgrade and Retrofit Market Report 2018-2028
This brand new report on the commercial aircraft Modernisation upgrade and retrofit market features market sizing, forecasts and detailed contract...
Full DetailsPublished: 12 April 2018 -

Top 20 Commercial Airline Low Cost Carrier (LCC) Companies 2019
The growing prevalence of low cost carriers (LCC) has led Visiongain to publish this unique report, which may be crucial...Full DetailsPublished: 06 February 2019 -

Top 20 Lithium-Ion Battery Manufacturing Companies 2018
The development of the automotive battery market is important for the automotive sector as batteries serve different automotive applications in...Full DetailsPublished: 09 August 2018 -

Global Aircraft Health Monitoring Market Report 2019-2029
The growing IT expenditure among emerging nations and technological advancements for workflow optimization is expected to fuel the demand for...
Full DetailsPublished: 01 January 1970 -

Aviation Cyber Security Market Report 2018-2028
The global aviation cyber security market will reach $2,691m in 2018.
...Full DetailsPublished: 25 September 2018
Download sample pages
Complete the form below to download your free sample pages for Chinese Commercial Aviation Market Forecast 2019-2029
Do you have any custom requirements we can help you with?
Any specific country, geo region, market segment or specific company information?
Email us today, we can discuss your needs and see how we can help: jamie.roberts@visiongain.com
Visiongain aviation reports are compiled using a broad and rich mixture of both primary and secondary information to produce an overall industry outlook. In order to provide our clients with the best product possible product, we do not rely on any one single source of information. Visiongain analysts reach out to market-leading vendors and automotive industry experts but also review a wealth of financial data and product information from a vast range of sources. To find out more about our reports methodology please email jamie.roberts@visiongain.com
Would you like a free report overview of the report of your choice?
If so, please drop an email to Jamie Roberts stating your chosen report title to jamie.roberts@visiongain.com
Would you like to get the latest Visiongain aviation reports catalogue?
What are the dynamic growth sectors? where are the regional business opportunities?
Which technologies will prevail and who are the leading companies succeeding in these sectors and why?
If you want definitive answers to business critical questions, discover Visiongain’s full range of business intelligence reports.
If so, please email Jamie Roberts on jamie.roberts@visiongain.com or call her today on +44 207 336 6100
Airline Passenger Experience Association (APEX)
Airlines for America
Airport Consultants Council (ACC)
Airports Council International (ACI)
Airports Council International-North America
American Association of Airport Executives
Arab Air Carriers Organization (AACO)
European Aerospace Cluster Partnership
Global Business Travel Association (GBTA)
International Air Transport Association (IATA)
Security Industry Association (SIA)
Security Manufacturers Coalition
Women in Aviation
World Aviation Services
Don’t Miss Out!
Subscribe to receive the latest Industry news, trending insight and analysis straight to your inbox.Choose your preferences:
Latest Aviation news
Aircraft Computers Market
The global Aircraft Computers market is projected to grow at a CAGR of 5.7% by 2034
24 June 2024
Space Mining Market
The global Space Mining market is projected to grow at a CAGR of 20.7% by 2034
07 June 2024
Connected Aircraft Market
The global Connected Aircraft market is projected to grow at a CAGR of 17.2% by 2034
05 June 2024
Satellite Ground Station Market
The global Satellite Ground Station market was valued at US$65.69 billion in 2023 and is projected to grow at a CAGR of 13.3% during the forecast period 2024-2034.
21 May 2024
