Industries > Energy > Thermal Enhanced Oil Recovery (EOR) Market Report 2021-2031
 Market Report 2021-2031")
Thermal Enhanced Oil Recovery (EOR) Market Report 2021-2031
Forecasts by Spending (CAPEX, OPEX), by End-Product (Oil Sand, Thermal Heavy Oil), by Technology (Fast Steam Assisted Gravity Drainage (SAGD), Non-Condensable Gas Injection with Steam (NCG-SAGD), Once Through Heat Recovery Steam Generators (OTSG), Solar Thermal Enhanced Oil Recovery (ST-EOR), Thermally-Assisted Gas-Oil Gravity Drainage (TAGOGD), Tertiary Gravity Drainage (TGD)), by Method (Hot Fluid Injection Process, In-Situ Combustion (ISC), Electric Heating Methods, Electromagnetic Method) AND Regional and Leading National Market Analysis PLUS Analysis of Leading Thermal EOR Companies AND COVID-19 Recovery Scenarios
As a key player in thermal enhanced oil recovery, it is important for you to remain up to date with news surrounding COVID-19 and the reactor industry
Thankfully, you don’t have to look any further. Visiongain has collated important thermal enhanced oil recovery industry updates from across the country. With the scale of the COVID-19 pandemic, no sector has been left unaffected. This is true for the oil industry. The last few months have seen a shift in rules and regulation surrounding the commercial market. It is important to stay abreast to the market activities to get an edge over competitors in the global thermal enhanced oil recovery market.
Thermal Enhanced Oil Recovery Market–our new study reveals trends, R&D progress, and predicted revenues
In the coming decade, enhanced oil recovery strategies are set to be increasingly relevant in the international petroleum industry with increased global energy requirements, ageing oil fields and the shortage of traditional oil finds. However, their durability is enhanced by the fact that EOR thermal approaches are no longer limited to a few select countries, with industries around the world starting to incorporate programmes that maximise the value of the available resources.
If you read only 1 thermal enhanced oil recovery market report this year – this is the report you need to read. Take a look at our report on thermal enhanced oil recovery. It’ll give you an idea of what activities are in the global market and how you can leverage your products and services to generate revenue.
Key questions answered in this exclusive report are:
• What are the implication of thermal enhanced oil recovery projects taking place now and over the next 10 years?
• Is there a greater need for product commercialisation to further scale the thermal enhanced oil recovery market?
• Where is the thermal enhanced oil recovery market heading? And how can you ensure you are at the forefront of the market?
You need to discover how this will impact the thermal enhanced oil recovery market today, and over the next 10 years:
• Our 703-page report provides 452 tables and 446 charts/graphs exclusively to you.
• The report highlights key lucrative areas in the industry so you can target them – NOW.
• Contains in-depth analyse of global and national sales and growth
• Highlights for you the key successful trends, changes and revenue projections made by your competitors
This report tells you TODAY how the thermal enhanced oil recovery market will develop in the next 10 years, and in-line with the variations in COVID-19 economic recession and bounce. This market is more critical now than at any point over the last 10 years.
This report includes data analysis and invaluable insight into how COVID-19 will affect your industry. Access this report today.
To access the data contained in this document please email contactus@visiongain.com
Forecasts to 2031 and other analyses reveal the commercial prospects
• In addition to revenue forecasting to 2031, our new study provides you with recent results, growth rates, and market shares.
• You find original analyses, with business outlooks and developments.
• Discover qualitative analyses (including market dynamics, drivers, opportunities, restraints and challenges), cost structure, the impact of rising thermal enhanced oil recovery prices and recent developments.
This report includes data analysis and invaluable insight into how COVID-19 will affect your industry. Four COVID-19 recovery patterns and their impact, namely, V, L, W and U are discussed in this report.
Global Thermal Enhanced Oil Recovery Market by Spending (COVID Impact Analysis)
• CAPEX
• OPEX
Global Thermal Enhanced Oil Recovery Market by End-Product (COVID Impact Analysis)
• Oil Sand
• Thermal Heavy Oil
Global Thermal Enhanced Oil Recovery Market by Technology (COVID Impact Analysis)
• Fast Steam Assisted Gravity Drainage (SAGD)
• Non-Condensable Gas Injection with Steam (NCG-SAGD)
• Once Through Heat Recovery Steam Generators (OTSG)
• Solar Thermal Enhanced Oil Recovery (ST‐EOR)
• Thermally-Assisted Gas-Oil Gravity Drainage (TAGOGD)
• Tertiary Gravity Drainage (TGD)
Global Thermal Enhanced Oil Recovery Market by Method (COVID Impact Analysis)
• Hot Fluid Injection Processes
• In-Situ Combustion (ISC)
• Electric Heating Methods
• Electromagnetic Method
• Other Methods

In addition to the revenue predictions for the overall world market and segments, you will also find revenue forecasts for 10 leading national markets:
Canada Thermal Enhanced Oil Recovery Market, 2021 to 2031 Market Forecast & COVID Impact Analysis
• Total CAPEX ($Million)
• Total OPEX ($Million)
• Total Production (MBPD)
U.S. Thermal Enhanced Oil Recovery Market, 2021 to 2031 Market Forecast & COVID Impact Analysis
• Total CAPEX ($Million)
• Total OPEX ($Million)
• Total Production (MBPD)
Venezuela Thermal Enhanced Oil Recovery Market, 2021 to 2031 Market Forecast & COVID Impact Analysis
• Total CAPEX ($Million)
• Total OPEX ($Million)
• Total Production (MBPD)
Indonesia Thermal Enhanced Oil Recovery Market, 2021 to 2031 Market Forecast & COVID Impact Analysis
• Total CAPEX ($Million)
• Total OPEX ($Million)
• Total Production (MBPD)
Kuwait Thermal Enhanced Oil Recovery Market, 2021 to 2031 Market Forecast & COVID Impact Analysis
• Total CAPEX ($Million)
• Total OPEX ($Million)
• Total Production (MBPD)
Oman Thermal Enhanced Oil Recovery Market, 2021 to 2031 Market Forecast & COVID Impact Analysis
• Total CAPEX ($Million)
• Total OPEX ($Million)
• Total Production (MBPD)
China Thermal Enhanced Oil Recovery Market, 2021 to 2031 Market Forecast & COVID Impact Analysis
• Total CAPEX ($Million)
• Total OPEX ($Million)
• Total Production (MBPD)
Russia Thermal Enhanced Oil Recovery Market, 2021 to 2031 Market Forecast & COVID Impact Analysis
• Total CAPEX ($Million)
• Total OPEX ($Million)
• Total Production (MBPD)
Bahrain Thermal Enhanced Oil Recovery Market, 2021 to 2031 Market Forecast & COVID Impact Analysis
• Total CAPEX ($Million)
• Total OPEX ($Million)
• Total Production (MBPD)
Saudi Arabia Thermal Enhanced Oil Recovery Market, 2021 to 2031 Market Forecast & COVID Impact Analysis
• Total CAPEX ($Million)
• Total OPEX ($Million)
• Total Production (MBPD)
RoW Thermal Enhanced Oil Recovery Market, 2021 to 2031 Market Forecast & COVID Impact Analysis
• Total CAPEX ($Million)
• Total OPEX ($Million)
• Total Production (MBPD)
Need industry data? Please contact us today.
The report also includes profiles and for some of the leading companies in the Thermal Enhanced Oil Recovery Market, 2021 to 2031, with a focus on this segment of these companies’ operations. 20 Leading companies and the potential for market growth:
• Chevron Corporation (Chevron)
• Suncor Energy Inc
• BP plc
• Petróleos de Venezuela S.A.(PDVSA)
• ConocoPhillips
• China Petroleum & Chemical Corporation
• Exxon Mobil Corporation
• Royal Dutch Shell
• Total SE
• Petroleo Brasileiro S.A.
• Imperial Oil Limited
• Cenovus Energy Inc
• China Petroleum & Chemical Corporation
• Occidental Petroleum Corporation
• China National Offshore Oil Corporation (CNOOC)
• Kinder Morgan, Inc.
• Halliburton Company
• Equinor ASA
• Canadian Natural Resources Limited
• Ferus Pvt. Ltd
According to Visiongain analysis, global spending on thermal enhanced oil recovery is estimated to be valued at US$xx million in 2020 and is projected to reach at a market value of US$xx million by 2031. We predict strong revenue growth through to 2031. Our work identifies which organizations hold the greatest potential. Discover their capabilities, progress, and commercial prospects, helping you stay ahead.
How the Thermal Enhanced Oil Recovery Market, 2021 to 2031 Market report helps you?
In summary, our 700+ page report provides you with the following knowledge:
• Revenue forecasts to 2031 for Thermal Enhanced Oil Recovery Market, 2021 to 2031 Market, with forecasts for CAPEX, OPEX, Production, Technology, End-Product, Method each forecasted at a global and country level– discover the industry’s prospects, finding the most lucrative places for investments and revenues
• Revenue forecasts to 2031 for global and 10 key national markets – See forecasts for the Thermal Enhanced Oil Recovery Market, 2021 to 2031 market in the US, Canada, China, Oman, Bahrain, Russia, Indonesia, Venezuela, Kuwait, and Saudi Arabia among other prominent economies.
• Prospects for established firms and those seeking to enter the market– including company profiles for 20 of the major companies involved in the Thermal Enhanced Oil Recovery Market, 2021 to 2031 Market.
Find quantitative and qualitative analyses with independent predictions. Receive information that only our report contains, staying informed with this invaluable business intelligence.
Information found nowhere else
With our newly report title, you are less likely to fall behind in knowledge or miss out on opportunities. See how our work could benefit your research, analyses, and decisions. Visiongain’s study is for everybody needing commercial analyses for the Thermal Enhanced Oil Recovery Market, 2021 to 2031 Market and leading companies. You will find data, trends and predictions.
To access the data contained in this document please email contactus@visiongain.com
Buy our report today Thermal Enhanced Oil Recovery (EOR) Market Report 2021-2031: Forecasts by Spending (CAPEX, OPEX), by End-Product (Oil Sand, Thermal Heavy Oil), by Technology (Fast Steam Assisted Gravity Drainage (SAGD), Non-Condensable Gas Injection with Steam (NCG-SAGD), Once Through Heat Recovery Steam Generators (OTSG), Solar Thermal Enhanced Oil Recovery (ST-EOR), Thermally-Assisted Gas-Oil Gravity Drainage (TAGOGD), Tertiary Gravity Drainage (TGD)), by Method (Hot Fluid Injection Process, In-Situ Combustion (ISC), Electric Heating Methods, Electromagnetic Method) AND Regional and Leading National Market Analysis PLUS Analysis of Leading Thermal EOR Companies AND COVID-19 Recovery Scenarios. Avoid missing out by staying informed – order our report now.
Visiongain is a trading partner with the US Federal Government
CCR Ref number: KD4R6
Do you have any custom requirements we can help you with? Any need for a specific country, geo region, market segment or specific company information? Contact us today, we can discuss your needs and see how we can help: sara.peerun@visiongain.com
1.1 Introduction to Global Thermal Enhanced Oil Recovery Market
1.2 Global Thermal Enhanced Oil Recovery Market Overview
1.3 What are the Objectives of this Report?
1.4 What is the Scope of the Report?
1.5 Global Thermal Enhanced Oil Recovery Market Definition
1.6 Why You Should Read This Report
1.7 What This Report Delivers
1.8 Key Questions Answered By This Analytical Report Include:
1.9 Who is This Report for?
1.10 Research Methodology
1.10.1 Primary Research
1.10.2 Secondary Research
1.10.3 Market Evaluation & Forecasting Methodology
1.11 Frequently Asked Questions (FAQs)
1.12 Associated Visiongain Reports
1.13 About Visiongain
2 Executive Summary
2.1 What are the methods of Steam Thermal Recovery Improvement Oil (ERO)?
2.2 How does thermal oil recovery work?
2.3 Is thermal enhanced oil recovery is proved?
2.4 What changes are happened while processing?
2.5 How much waste forms do Thermal EOR manufacture?
3 Global Thermal Enhanced Oil Recovery Industry Structure
3.1 Stages of Oil Extraction
3.1.1 Primary Recovery
3.1.2 Secondary Recovery
3.1.3 Tertiary Recovery
3.2 Thermal EOR Processes
3.2.1 Steam Injection
3.2.2 Steam Flooding
3.2.3 Cyclic Steam Stimulation (CSS)
3.3 Small Scale Commercial EOR Technologies
3.3.1 Toe-to-Heel Air Injection (THAI)
3.3.2 Electro-Thermal Dynamic Stripping Process (ET-DSP)
3.3.3 Synchronised Thermal Additional Recovery (STAR)
3.3.4 Expanding Solvent Steam-Assisted Gravity Drainage (ES-SAGD)
3.3.5 Steam and Gas Push (SAGP)
3.3.6 Controlled Atmospheric Pressure Resin Infusion (CAPRI)
3.3.7 Combustion Overhead Gravity Drainage (COGD)
3.4 Oil Supply Chain
3.4.1 Identify
3.4.2 Explore
3.4.3 Design and Construct
3.4.4 Produce
3.4.5 Storage
3.4.6 Refine
3.4.7 Feedstocks
3.4.8 Terminal
3.4.9 Transport
3.4.10 Point of Sale
3.5 Modes of Transportation
3.5.1 Oil Tankers
3.5.2 LNG tankers
3.5.3 Pipelines
3.5.4 Barges
3.5.5 Railroad / Tank Trucks
3.5.6 Tugboats
4 Global Market Dynamics
4.1 Market Driving Factors
4.1.1 Focus is more on Maximizing Recovery Factor
4.1.2 Progress in techniques and technology of oil recovery
4.1.3 Steam Injection Method Gains Momentum On The Global Market
4.1.4 The Bulk of EOR Ventures Are Thermal EOR
4.2 Market Restraining Factors
4.2.1 High Costs
4.2.2 Transportation Issues
4.2.3 Environmental Concerns
4.2.4 Carbon Taxation
4.2.5 EOR as decreasing Water Quality
4.2.6 Poor Regulation of Movement and Extreme Viscous Fingering
4.3 Opportunities in the Global Market
4.3.1 Increasing significance of the recovery of solar thermal oil (S-EOR)
4.3.2 S-EOR are chances for countries which have no natural gas
4.3.3 Using traditional EOR and IOR combinations
4.3.4 Nanotechnology integration in EOR
4.4 Challenges in the Global Market
4.4.1 EOR Project is a great challenge Selection and execution
4.4.2 Thermal EOR process restrictions are a huge obstacle for businesses
5 PEST Analysis
6 SWOT Analysis
7 Global Thermal Enhanced Oil Recovery Market Analysis
7.1 Global Market Outlook
7.2 Global Market Size Estimation and Forecast
7.2.1 Pre-COVID-19 Market Scenario
7.2.2 Post-COVID-19 Market Scenarios (V, W, U, L-Shaped Recovery Analysis)
7.3 Global Market Size Estimation and Forecast by CAPEX and OPEX
7.3.1 Pre-COVID-19 Market Scenario
7.3.2 Post-COVID-19 Market Scenarios (V, W, U, L-Shaped Recovery Analysis)
7.4 Global Market Size Estimation and Forecast by Production
7.4.1 Pre-COVID-19 Market Scenario
7.4.2 Post-COVID-19 Market Scenarios (V, W, U, L-Shaped Recovery Analysis)
7.5 Global Market Size Estimation and Forecast by End-Product
7.5.1 EOR End- Product Outlook
7.5.2 Pre-COVID-19 Market Scenario
7.5.3 Post-COVID-19 Market Scenarios (V, W, U, L-Shaped Recovery Analysis)
7.6 Global Market Size Estimation and Forecast by Technology
7.6.1 EOR Technology Outlook
7.6.2 Pre-COVID-19 Market Scenario
7.6.3 Post-COVID-19 Market Scenarios (V, W, U, L-Shaped Recovery Analysis)
7.7 Global Market Size Estimation and Forecast by Method
7.7.1 EOR Methods Outlook
7.7.2 Pre-COVID-19 Market Scenario
7.7.3 Post-COVID-19 Market Scenarios (V, W, U, L-Shaped Recovery Analysis)
7.8 Global Market Size Estimation and Forecast by Country
7.8.1 Pre-COVID-19 Market Scenario
7.8.2 Post-COVID-19 Market Scenarios (V, W, U, L-Shaped Recovery Analysis)
7.9 Global Market Size Estimation and Forecast by Country
7.9.1 Pre-COVID-19 Market Scenario
7.9.2 Post-COVID-19 Market Scenarios (V, W, U, L-Shaped Recovery Analysis)
8 Canada Global Thermal Enhanced Oil Recovery Market Analysis
8.1 Canada Market Outlook
8.1.1 Enhanced Oil Recovery Projects
8.2 Canada Market Size Estimation and Forecast
8.2.1 Pre-COVID-19 Market Scenario
8.2.2 Post-COVID-19 Market Scenarios (V, W, U, L-Shaped Recovery Analysis)
8.3 Canada Market Forecast by CAPEX and OPEX
8.3.1 Pre-COVID-19 Market Scenario
8.3.2 Post-COVID-19 Market Scenarios (V, W, U, L-Shaped Recovery Analysis)
8.4 Canada Market Size Estimation and Forecast by Production
8.4.1 Pre-COVID-19 Market Scenario
8.4.2 Post-COVID-19 Market Scenarios (V, W, U, L-Shaped Recovery Analysis)
8.5 Canada Market Size Estimation and Forecast by End Product
8.5.1 Pre-COVID-19 Market Scenario
8.5.2 Post-COVID-19 Market Scenarios (V, W, U, L-Shaped Recovery Analysis)
8.6 Canada Market Size Estimation and Forecast by Technology
8.6.1 Pre-COVID-19 Market Scenario
8.6.2 Post-COVID-19 Market Scenarios (V, W, U, L-Shaped Recovery Analysis)
8.7 Canada Market Size Estimation and Forecast by Method
8.7.1 Pre-COVID-19 Market Scenario
8.7.2 Post-COVID-19 Market Scenarios (V, W, U, L-Shaped Recovery Analysis)
9 US Global Thermal Enhanced Oil Recovery Market Analysis
9.1 US Market Outlook
9.1.1 Enhanced Oil Recovery Projects
9.2 US Market Size Estimation and Forecast
9.2.1 Pre-COVID-19 Market Scenario
9.2.2 Post-COVID-19 Market Scenarios (V, W, U, L-Shaped Recovery Analysis)
9.3 US Market Size Forecast by CAPEX And OPEX
9.3.1 Pre-COVID-19 Market Scenario
9.3.2 Post-COVID-19 Market Scenarios (V, W, U, L-Shaped Recovery Analysis)
9.4 US Market Size Estimation and Forecast by Production
9.4.1 Pre-COVID-19 Market Scenario
9.4.2 Post-COVID-19 Market Scenarios (V, W, U, L-Shaped Recovery Analysis)
9.5 US Market Size Estimation and Forecast by End- Product
9.5.1 Pre-COVID-19 Market Scenario
9.5.2 Post-COVID-19 Market Scenarios (V, W, U, L-Shaped Recovery Analysis)
9.6 US Market Size Estimation and Forecast by Technology
9.6.1 Pre-COVID-19 Market Scenario
9.6.2 Post-COVID-19 Market Scenarios (V, W, U, L-Shaped Recovery Analysis)
9.7 US Market Size Estimation and Forecast by Method
9.7.1 Pre-COVID-19 Market Scenario
9.7.2 Post-COVID-19 Market Scenarios (V, W, U, L-Shaped Recovery Analysis)
10 Venezuela Global Thermal Enhanced Oil Recovery Market Analysis
10.1 Venezuela Market Outlook
10.1.1 Enhanced Oil Recovery Projects
10.2 Venezuela Market Size Estimation and Forecast
10.2.1 Pre-COVID-19 Market Scenario
10.2.2 Post-COVID-19 Market Scenarios (V, W, U, L-Shaped Recovery Analysis)
10.3 Venezula Market Forecast by CAPEX And OPEX
10.3.1 Pre-COVID-19 Market Scenario
10.3.2 Post-COVID-19 Market Scenarios (V, W, U, L-Shaped Recovery Analysis)
10.4 Venezuela Market Size Estimation and Forecast by Production
10.4.1 Pre-COVID-19 Market Scenario
10.4.2 Post-COVID-19 Market Scenarios (V, W, U, L-Shaped Recovery Analysis)
10.5 Venezuela Market Size Estimation and Forecast by End- Product
10.5.1 Pre-COVID-19 Market Scenario
10.5.2 Post-COVID-19 Market Scenarios (V, W, U, L-Shaped Recovery Analysis)
10.6 Venezuela Market Size Estimation and Forecast by Technology
10.6.1 Pre-COVID-19 Market Scenario
10.6.2 Post-COVID-19 Market Scenarios (V, W, U, L-Shaped Recovery Analysis)
10.7 Venezuela Market Size Estimation and Forecast by Method
10.7.1 Pre-COVID-19 Market Scenario
10.7.2 Post-COVID-19 Market Scenarios (V, W, U, L-Shaped Recovery Analysis)
11 Indonesia Global Thermal Enhanced Oil Recovery Market Analysis
11.1 Indonesia Market Outlook
11.1.1 Enhanced Oil Recovery Projects
11.2 Indonesia Market Size Estimation and Forecast
11.2.1 Pre-COVID-19 Market Scenario
11.2.2 Post-COVID-19 Market Scenarios (V, W, U, L-Shaped Recovery Analysis)
11.3 Indonesia Market Size Estimation and Forecast by CAPEX And OPEX
11.3.1 Pre-COVID-19 Market Scenario
11.3.2 Post-COVID-19 Market Scenarios (V, W, U, L-Shaped Recovery Analysis)
11.4 Indonesia Market Size Estimation and Forecast by Production
11.4.1 Pre-COVID-19 Market Scenario
11.4.2 Post-COVID-19 Market Scenarios (V, W, U, L-Shaped Recovery Analysis)
11.5 Indonesia Market Size Estimation and Forecast by End- Product
11.5.1 Pre-COVID-19 Market Scenario
11.5.2 Post-COVID-19 Market Scenarios (V, W, U, L-Shaped Recovery Analysis)
11.6 Indonesia Market Size Estimation and Forecast by Technology
11.6.1 Pre-COVID-19 Market Scenario
11.6.2 Post-COVID-19 Market Scenarios (V, W, U, L-Shaped Recovery Analysis)
11.7 Indonesia Market Size Estimation and Forecast by Method
11.7.1 Pre-COVID-19 Market Scenario
11.7.2 Post-COVID-19 Market Scenarios (V, W, U, L-Shaped Recovery Analysis)
12 Kuwait Global Thermal Enhanced Oil Recovery Market Analysis
12.1 Kuwait Market Outlook
12.1.1 Enhanced Oil Recovery Projects
12.2 Kuwait Market Size Estimation and Forecast
12.2.1 Pre-COVID-19 Market Scenario
12.2.2 Post-COVID-19 Market Scenarios (V, W, U, L-Shaped Recovery Analysis)
12.3 Kuwait Market Size Estimation and Forecast by CAPEX And OPEX
12.3.1 Pre-COVID-19 Market Scenario
12.3.2 Post-COVID-19 Market Scenarios (V, W, U, L-Shaped Recovery Analysis)
12.4 Kuwait Market Size Estimation and Forecast by Production
12.4.1 Pre-COVID-19 Market Scenario
12.4.2 Post-COVID-19 Market Scenarios (V, W, U, L-Shaped Recovery Analysis)
12.5 Kuwait Market Size Estimation and Forecast by End- Product
12.5.1 Pre-COVID-19 Market Scenario
12.5.2 Post-COVID-19 Market Scenarios (V, W, U, L-Shaped Recovery Analysis)
12.6 Kuwait Market Size Estimation and Forecast by Technology
12.6.1 Pre-COVID-19 Market Scenario
12.6.2 Post-COVID-19 Market Scenarios (V, W, U, L-Shaped Recovery Analysis)
12.7 Kuwait Market Size Estimation and Forecast by Method
12.7.1 Pre-COVID-19 Market Scenario
12.7.2 Post-COVID-19 Market Scenarios (V, W, U, L-Shaped Recovery Analysis)
13 Oman Global Thermal Enhanced Oil Recovery Market Analysis
13.1 Oman Market Outlook
13.1.1 Enhanced Oil Recovery Projects
13.2 Oman Market Size Estimation and Forecast
13.2.1 Pre-COVID-19 Market Scenario
13.2.2 Post-COVID-19 Market Scenarios (V, W, U, L-Shaped Recovery Analysis)
13.3 Oman Market Size Estimation and Forecast by CAPEX And OPEX
13.3.1 Pre-COVID-19 Market Scenario
13.3.2 Post-COVID-19 Market Scenarios (V, W, U, L-Shaped Recovery Analysis)
13.4 Oman Market Size Estimation and Forecast by Production
13.4.1 Pre-COVID-19 Market Scenario
13.4.2 Post-COVID-19 Market Scenarios (V, W, U, L-Shaped Recovery Analysis)
13.5 Oman Market Size Estimation and Forecast by End- Product
13.5.1 Pre-COVID-19 Market Scenario
13.5.2 Post-COVID-19 Market Scenarios (V, W, U, L-Shaped Recovery Analysis)
13.6 Oman Market Size Estimation and Forecast by Technology
13.6.1 Pre-COVID-19 Market Scenario
13.6.2 Post-COVID-19 Market Scenarios (V, W, U, L-Shaped Recovery Analysis)
13.7 Oman Market Size Estimation and Forecast by Method
13.7.1 Pre-COVID-19 Market Scenario
13.7.2 Post-COVID-19 Market Scenarios (V, W, U, L-Shaped Recovery Analysis)
14 China Global Thermal Enhanced Oil Recovery Market Analysis
14.1 China Market Outlook
14.1.1 Enhanced Oil Recovery Projects
14.2 China Market Size Estimation and Forecast
14.2.1 Pre-COVID-19 Market Scenario
14.2.2 Post-COVID-19 Market Scenarios (V, W, U, L-Shaped Recovery Analysis)
14.3 China Market Size Estimation and Forecast by CAPEX And OPEX
14.3.1 Pre-COVID-19 Market Scenario
14.3.2 Post-COVID-19 Market Scenarios (V, W, U, L-Shaped Recovery Analysis)
14.4 China Market Size Estimation and Forecast by Production
14.4.1 Pre-COVID-19 Market Scenario
14.4.2 Post-COVID-19 Market Scenarios (V, W, U, L-Shaped Recovery Analysis)
14.5 China Market Size Estimation and Forecast by End- Product
14.5.1 Pre-COVID-19 Market Scenario
14.5.2 Post-COVID-19 Market Scenarios (V, W, U, L-Shaped Recovery Analysis)
14.6 China Market Size Estimation and Forecast by Technology
14.6.1 Pre-COVID-19 Market Scenario
14.6.2 Post-COVID-19 Market Scenarios (V, W, U, L-Shaped Recovery Analysis)
14.7 China Market Size Estimation and Forecast by Method
14.7.1 Pre-COVID-19 Market Scenario
14.7.2 Post-COVID-19 Market Scenarios (V, W, U, L-Shaped Recovery Analysis)
15 Russia Global Thermal Enhanced Oil Recovery Market Analysis
15.1 Russia Market Outlook
15.1.1 Enhanced Oil Recovery Projects
15.2 Russia Market Size Estimation and Forecast
15.2.1 Pre-COVID-19 Market Scenario
15.2.2 Post-COVID-19 Market Scenarios (V, W, U, L-Shaped Recovery Analysis)
15.3 Russia Market Size Estimation and Forecast by CAPEX And OPEX
15.3.1 Pre-COVID-19 Market Scenario
15.3.2 Post-COVID-19 Market Scenarios (V, W, U, L-Shaped Recovery Analysis)
15.4 Russia Market Size Estimation and Forecast by Production
15.4.1 Pre-COVID-19 Market Scenario
15.4.2 Post-COVID-19 Market Scenarios (V, W, U, L-Shaped Recovery Analysis)
15.5 Russia Market Size Estimation and Forecast by End- Product
15.5.1 Pre-COVID-19 Market Scenario
15.5.2 Post-COVID-19 Market Scenarios (V, W, U, L-Shaped Recovery Analysis)
15.6 Russia Market Size Estimation and Forecast by Technology
15.6.1 Pre-COVID-19 Market Scenario
15.6.2 Post-COVID-19 Market Scenarios (V, W, U, L-Shaped Recovery Analysis)
15.7 Russia Market Size Estimation and Forecast by Method
15.7.1 Pre-COVID-19 Market Scenario
15.7.2 Post-COVID-19 Market Scenarios (V, W, U, L-Shaped Recovery Analysis)
16 Bahrain Global Thermal Enhanced Oil Recovery Market Analysis
16.1 Bahrain Market Outlook
16.1.1 Enhanced Oil Recovery Projects
16.2 Bahrain Market Size Estimation and Forecast
16.2.1 Pre-COVID-19 Market Scenario
16.2.2 Post-COVID-19 Market Scenarios (V, W, U, L-Shaped Recovery Analysis)
16.3 Bahrain Market Size Estimation and Forecast by CAPEX And OPEX
16.3.1 Pre-COVID-19 Market Scenario
16.3.2 Post-COVID-19 Market Scenarios (V, W, U, L-Shaped Recovery Analysis)
16.4 Bahrain Market Size Estimation and Forecast by Production
16.4.1 Pre-COVID-19 Market Scenario
16.4.2 Post-COVID-19 Market Scenarios (V, W, U, L-Shaped Recovery Analysis)
16.5 Bahrain Market Size Estimation and Forecast by End- Product
16.5.1 Pre-COVID-19 Market Scenario
16.5.2 Post-COVID-19 Market Scenarios (V, W, U, L-Shaped Recovery Analysis)
16.6 Bahrain Market Size Estimation and Forecast by Technology
16.6.1 Pre-COVID-19 Market Scenario
16.6.2 Post-COVID-19 Market Scenarios (V, W, U, L-Shaped Recovery Analysis)
16.7 Bahrain Market Size Estimation and Forecast by Method
16.7.1 Pre-COVID-19 Market Scenario
16.7.2 Post-COVID-19 Market Scenarios (V, W, U, L-Shaped Recovery Analysis)
17 South Arabia Global Thermal Enhanced Oil Recovery Market Analysis
17.1 South Arabia Market Outlook
17.1.1 Enhanced Oil Recovery Projects
17.2 South Arabia Market Size Estimation and Forecast
17.2.1 Pre-COVID-19 Market Scenario
17.2.2 Post-COVID-19 Market Scenarios (V, W, U, L-Shaped Recovery Analysis)
17.3 South Arabia Market Size Estimation and Forecast by CAPEX And OPEX
17.3.1 Pre-COVID-19 Market Scenario
17.3.2 Post-COVID-19 Market Scenarios (V, W, U, L-Shaped Recovery Analysis)
17.4 South Arabia Market Size Estimation and Forecast by Production
17.4.1 Pre-COVID-19 Market Scenario
17.4.2 Post-COVID-19 Market Scenarios (V, W, U, L-Shaped Recovery Analysis)
17.5 South Arabia Market Size Estimation and Forecast by End- Product
17.5.1 Pre-COVID-19 Market Scenario
17.5.2 Post-COVID-19 Market Scenarios (V, W, U, L-Shaped Recovery Analysis)
17.6 South Arabia Market Size Estimation and Forecast by Technology
17.6.1 Pre-COVID-19 Market Scenario
17.6.2 Post-COVID-19 Market Scenarios (V, W, U, L-Shaped Recovery Analysis)
17.7 South Arabia Market Size Estimation and Forecast by Method
17.7.1 Pre-COVID-19 Market Scenario
17.7.2 Post-COVID-19 Market Scenarios (V, W, U, L-Shaped Recovery Analysis)
18 Rest Of World Global Thermal Enhanced Oil Recovery Market Analysis
18.1 ROW Market Outlook
18.1.1 Brazil
18.1.2 Germany
18.1.3 Trinidad
18.1.4 India
18.2 ROW Market Size Estimation and Forecast
18.2.1 Pre-COVID-19 Market Scenario
18.2.2 Post-COVID-19 Market Scenarios (V, W, U, L-Shaped Recovery Analysis)
18.3 ROW Market Size Estimation and Forecast by CAPEX And OPEX
18.3.1 Pre-COVID-19 Market Scenario
18.3.2 Post-COVID-19 Market Scenarios (V, W, U, L-Shaped Recovery Analysis)
18.4 ROW Market Size Estimation and Forecast by Production
18.4.1 Pre-COVID-19 Market Scenario
18.4.2 Post-COVID-19 Market Scenarios (V, W, U, L-Shaped Recovery Analysis)
18.5 ROW Market Size Estimation and Forecast by End- Product
18.5.1 Pre-COVID-19 Market Scenario
18.5.2 Post-COVID-19 Market Scenarios (V, W, U, L-Shaped Recovery Analysis)
18.6 ROW Market Size Estimation and Forecast by Technology
18.6.1 Pre-COVID-19 Market Scenario
18.6.2 Post-COVID-19 Market Scenarios (V, W, U, L-Shaped Recovery Analysis)
18.7 ROW Market Size Estimation and Forecast by Method
18.7.1 Pre-COVID-19 Market Scenario
18.7.2 Post-COVID-19 Market Scenarios (V, W, U, L-Shaped Recovery Analysis)
19 Leading Company Profiles
19.1 Chevron Corporation
19.1.1 Company Snapshot
19.1.2 Company Overview
19.1.3 Company Financial Profile
19.1.4 Company Product Benchmarking
19.1.5 Company Technology
19.1.6 Company Recent Developments
19.2 Suncor Energy Inc
19.2.1 Company Snapshot
19.2.2 Company Overview
19.2.3 Company Financial Profile
19.2.4 Company Product Benchmarking
19.2.5 Company Technology
19.2.6 Company Recent Developments
19.3 BP Plc.
19.3.1 Company Snapshot
19.3.2 Company Overview
19.3.3 Company Financial Profile
19.3.4 Company Product and Services Benchmarking
19.3.5 Company Recent Developments
19.4 Petróleos de Venezuela S.A.(PDVSA)
19.4.1 Company Snapshot
19.4.2 Company Overview
19.4.3 Company Financial Profile
19.4.4 Company Product Benchmarking
19.4.5 Company Recent Developments
19.5 ConocoPhillips
19.5.1 Company Snapshot
19.5.2 Company Overview
19.5.3 Company Financial Profile
19.5.4 Company Product Benchmarking
19.5.5 Company Recent Developments
19.6 China Petroleum & Chemical Corporation
19.6.1 Company Snapshot
19.6.2 Company Overview
19.6.3 Company Financial Profile
19.6.4 Company Product Benchmarking
19.6.5 Company Recent Developments
19.7 Exxon Mobil Corporation.
19.7.1 Company Snapshot
19.7.2 Company Overview
19.7.3 Company Financial Profile
19.7.4 Company Product Benchmarking
19.7.5 Company Recent Developments
19.8 Royal Dutch Shell
19.8.1 Company Snapshot
19.8.2 Company Overview
19.8.3 Company Financial Profile
19.8.4 Company Product Benchmarking
19.8.5 Company Recent Developments
19.9 Total SE
19.9.1 Company Snapshot
19.9.2 Company Overview
19.9.3 Company Financial Profile
19.9.4 Company Product Benchmarking
19.9.5 Company Recent Developments
19.10 Petroleo Brasileiro S.A
19.10.1 Company Snapshot
19.10.2 Company Overview
19.10.3 Company Financial Profile
19.10.4 Performance and Activities
19.10.5 Main Operations of the Company
19.10.6 Company Product Benchmarking
19.10.7 Company Recent Developments
19.11 Imperial Oil Limited
19.11.1 Company Snapshot
19.11.2 Company Overview
19.11.3 Company Financial Profile
19.11.4 Company Operations
19.11.5 Company Product Benchmarking
19.11.6 Company Recent Developments
19.12 Cenovus Energy Inc.
19.12.1 Company Snapshot
19.12.2 Company Overview
19.12.3 Company Financial Profile
19.12.4 Company Operation
19.12.5 Company Recent Developments
19.13 China Petroleum & Chemical Corporation
19.13.1 Company Snapshot
19.13.2 Company Overview
19.13.3 Company Financial Profile
19.13.4 Company Product Benchmarking
19.13.5 Company Recent Developments
19.14 Occidental Petroleum Corporation
19.14.1 Company Snapshot
19.14.2 Company Overview
19.14.3 Company Financial Profile
19.14.4 Company Product Benchmarking
19.14.5 Company Recent Developments
19.15 China National Offshore Oil Corporation (CNOOC)
19.15.1 Company Snapshot
19.15.2 Company Overview
19.15.3 Company Financial Profile
19.15.4 Company Product Benchmarking
19.15.5 Company Recent Developments
19.16 Kinder Morgan, Inc
19.16.1 Company Snapshot
19.16.2 Company Overview
19.16.3 Company Financial Profile
19.16.4 Company Product Benchmarking
19.16.5 Company Recent Developments
19.17 Halliburton Company
19.17.1 Company Snapshot
19.17.2 Company Overview
19.17.3 Company Financial Profile
19.17.4 Company Technology
19.17.5 Company Product Benchmarking
19.17.6 Company Recent Developments
19.18 Equinor ASA
19.18.1 Company Snapshot
19.18.2 Company Overview
19.18.3 Company Financial Profile
19.18.4 Company Product Benchmarking
19.18.5 Company Recent Developments
19.19 Canadian Natural Resources Limited
19.19.1 Company Snapshot
19.19.2 Company Overview
19.19.3 Company Financial Profile
19.19.4 Company Product Benchmarking
19.19.5 Company Recent Developments
19.20 Ferus Pvt. Ltd.
19.20.1 Company Snapshot
19.20.2 Company Overview
19.20.3 Company Financial Profile
19.20.4 Company Product Benchmarking
19.20.5 Company Recent Developments
20 Conclusion and Recommendation
20.1 Recommendations
21 Glossary Terms
List of Tables
Table 1. Global Thermal Enhanced Oil Recovery Market Forecast, 2021-2031 (USD Mn, AGR (%), CAGR(%))
Table 2. Global Thermal Enhanced Oil Recovery Market Snapshot, 2021 & 2031 (US$million, CAGR %)
Table 3. Global Thermal Enhanced Oil Recovery Market Forecast PEST Analysis
Table 4. Global Thermal Enhanced Oil Recovery Market SWOT Analysis
Table 5. Global Thermal Enhanced Oil Recovery Market Forecast, 2021-2031 (USD Mn, AGR (%), CAGR(%))
Table 6. Global Thermal Enhanced Oil Recovery Market Forecast, 2021-2031 (USD Mn, AGR (%), CAGR(%)) (V- Shaped Recovery)
Table 7. Global Thermal Enhanced Oil Recovery Market Forecast, 2021-2031 (USD Mn, AGR (%), CAGR(%)) (W- Shaped Recovery)
Table 8. Global Thermal Enhanced Oil Recovery Market Forecast, 2021-2031 (USD Mn, AGR (%), CAGR(%)) (U- Shaped Recovery)
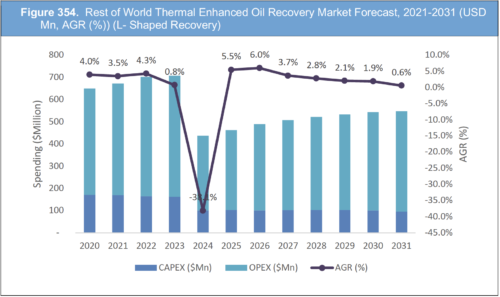
Table 9. Global Thermal Enhanced Oil Recovery Market Forecast, 2021-2031 (USD Mn, AGR (%), CAGR(%)) (L- Shaped Recovery)
Table 10. Global Thermal Enhanced Oil Recovery Market Forecast, 2021-2031 (USD Mn, AGR (%), CAGR(%))
Table 11. Global Thermal Enhanced Oil Recovery Market Forecast, 2021-2031 (USD Mn, AGR (%), CAGR(%)) (V- Shaped Recovery)
Table 12. Global Thermal Enhanced Oil Recovery Market Forecast, 2021-2031 (USD Mn, AGR (%), CAGR(%)) (W- Shaped Recovery)
Table 13. Global Thermal Enhanced Oil Recovery Market Forecast, 2021-2031 (USD Mn, AGR (%), CAGR(%)) (U- Shaped Recovery)
Table 14. Global Thermal Enhanced Oil Recovery Market Forecast, 2021-2031 (USD Mn, AGR (%), CAGR(%)) (L- Shaped Recovery)
Table 15. Global Thermal Enhanced Oil Recovery Market Forecast by Production, 2021-2031 (MBPD, AGR (%), CAGR(%))
Table 16. Global Thermal Enhanced Oil Recovery Market Forecast by Production, 2021-2031 (MBPD, AGR (%), CAGR(%)) (V- Shaped Recovery)
Table 17. Global Thermal Enhanced Oil Recovery Market Forecast by Production, 2021-2031 (MBPD, AGR (%), CAGR(%)) (W- Shaped Recovery)
Table 18. Global Thermal Enhanced Oil Recovery Market Forecast by Production, 2021-2031 (MBPD, AGR (%), CAGR(%)) (U- Shaped Recovery)
Table 19. Global Thermal Enhanced Oil Recovery Market Forecast by Production, 2021-2031 (MBPD, AGR (%), CAGR(%)) (L- Shaped Recovery)
Table 20. Global Thermal Enhanced Oil Recovery Market Forecast by End-Product, 2021-2031 (MBPD, AGR (%), CAGR(%))
Table 21. Global Thermal Enhanced Oil Recovery Market Forecast by End-Product, 2021-2031 (MBPD, AGR (%), CAGR(%)) (V- Shaped Recovery)
Table 22. Global Thermal Enhanced Oil Recovery Market Forecast by End-Product, 2021-2031 (MBPD, AGR (%), CAGR(%)) (W- Shaped Recovery)
Table 23. Global Thermal Enhanced Oil Recovery Market Forecast by End-Product, 2021-2031 (MBPD, AGR (%), CAGR(%)) (U- Shaped Recovery)
Table 24. Global Thermal Enhanced Oil Recovery Market Forecast by End-Product, 2021-2031 (MBPD, AGR (%), CAGR(%)) (L- Shaped Recovery)
Table 25. Global Thermal Enhanced Oil Recovery Market by Technology, 2021-2031 (MBPD, AGR (%), CAGR(%))
Table 26. Global Thermal Enhanced Oil Recovery Market by Technology, 2021-2031 (MBPD, AGR (%), CAGR(%)) (V- Shaped Recovery)
Table 27. Global Thermal Enhanced Oil Recovery Market by Technology, 2021-2031 (MBPD, AGR (%), CAGR(%)) (W- Shaped Recovery)
Table 28. Global Thermal Enhanced Oil Recovery Market by Technology, 2021-2031 (MBPD, AGR (%), CAGR(%)) (U- Shaped Recovery)
Table 29. Global Thermal Enhanced Oil Recovery Market by Technology, 2021-2031 (MBPD, AGR (%), CAGR(%)) (L- Shaped Recovery)
Table 30. Global Thermal Enhanced Oil Recovery Market by Method, 2021-2031 (MBPD, AGR (%), CAGR(%))
Table 31. Global Thermal Enhanced Oil Recovery Market by Method, 2021-2031 (MBPD, AGR (%), CAGR(%)) (V- Shaped Recovery)
Table 32. Global Thermal Enhanced Oil Recovery Market by Method, 2021-2031 (MBPD, AGR (%), CAGR(%)) (W- Shaped Recovery)
Table 33. Global Thermal Enhanced Oil Recovery Market by Method, 2021-2031 (MBPD, AGR (%), CAGR(%)) (U- Shaped Recovery)
Table 34. Global Thermal Enhanced Oil Recovery Market by Method, 2021-2031 (MBPD, AGR (%), CAGR(%)) (L- Shaped Recovery)
Table 35. Global Thermal Enhanced Oil Recovery Market by Country, 2021-2031 (USD Mn, AGR (%), CAGR(%))
Table 36. Global Thermal Enhanced Oil Recovery Market by Country, 2021-2031 (USD Mn, AGR (%), CAGR(%)) (V- Shaped Recovery)
Table 37. Global Thermal Enhanced Oil Recovery Market by Country, 2021-2031 (USD Mn, AGR (%), CAGR(%)) (W- Shaped Recovery)
Table 38. Global Thermal Enhanced Oil Recovery Market by Country, 2021-2031 (USD Mn, AGR (%), CAGR(%)) (U- Shaped Recovery)
Table 39. Global Thermal Enhanced Oil Recovery Market by Country, 2021-2031 (USD Mn, AGR (%), CAGR(%)) (L- Shaped Recovery)
Table 40. Global Thermal Enhanced Oil Recovery Market by Country, 2021-2031 (USD Mn, AGR (%), CAGR(%))
Table 41. Global Thermal Enhanced Oil Recovery Market by Country, 2021-2031 (USD Mn, AGR (%), CAGR(%)) (V- Shaped Recovery)
Table 42. Global Thermal Enhanced Oil Recovery Market by Country, 2021-2031 (USD Mn, AGR (%), CAGR(%)) (W- Shaped Recovery)
Table 43. Global Thermal Enhanced Oil Recovery Market by Country, 2021-2031 (USD Mn, AGR (%), CAGR(%)) (U- Shaped Recovery)
Table 44. Global Thermal Enhanced Oil Recovery Market by Country, 2021-2031 (USD Mn, AGR (%), CAGR(%)) (L- Shaped Recovery)
Table 45. Canada Thermal Enhanced Oil Recovery Market Forecast, 2021-2031 (USD Mn, AGR (%), CAGR(%))
Table 46. Canada Thermal Enhanced Oil Recovery Market Forecast, 2021-2031 (USD Mn, AGR (%), CAGR(%)) (V- Shaped Recovery)
Table 47. Canada Thermal Enhanced Oil Recovery Market Forecast, 2021-2031 (USD Mn, AGR (%), CAGR(%)) (W- Shaped Recovery)
Table 48. Canada Thermal Enhanced Oil Recovery Market Forecast, 2021-2031 (USD Mn, AGR (%), CAGR(%)) (U- Shaped Recovery)
Table 49. Canada Thermal Enhanced Oil Recovery Market Forecast, 2021-2031 (USD Mn, AGR (%), CAGR(%)) (L- Shaped Recovery)
Table 50. Canada Thermal Enhanced Oil Recovery Market Forecast, 2021-2031 (USD Mn, AGR (%), CAGR(%))
Table 51. Canada Thermal Enhanced Oil Recovery Market Forecast, 2021-2031 (USD Mn, AGR (%), CAGR(%)) (V- Shaped Recovery)
Table 52. Canada Thermal Enhanced Oil Recovery Market Forecast, 2021-2031 (USD Mn, AGR (%), CAGR(%)) (W- Shaped Recovery)
Table 53. Canada Thermal Enhanced Oil Recovery Market Forecast, 2021-2031 (USD Mn, AGR (%), CAGR(%)) (U- Shaped Recovery)
Table 54. Canada Thermal Enhanced Oil Recovery Market Forecast, 2021-2031 (USD Mn, AGR (%), CAGR(%)) (L- Shaped Recovery)
Table 55. Canada Thermal Enhanced Oil Recovery Market Forecast by Production, 2021-2031 (MBPD, AGR (%), CAGR(%))
Table 56. Canada Thermal Enhanced Oil Recovery Market Forecast by Production, 2021-2031 (MBPD, AGR (%), CAGR(%)) (V- Shaped Recovery)
Table 57. Canada Thermal Enhanced Oil Recovery Market Forecast by Production, 2021-2031 (MBPD, AGR (%), CAGR(%)) (W- Shaped Recovery)
Table 58. Canada Thermal Enhanced Oil Recovery Market Forecast by Production, 2021-2031 (MBPD, AGR (%), CAGR(%)) (U- Shaped Recovery)
Table 59. Canada Thermal Enhanced Oil Recovery Market Forecast by Production, 2021-2031 (MBPD, AGR (%), CAGR(%)) (L- Shaped Recovery)
Table 60. Canada Thermal Enhanced Oil Recovery Market Forecast by End-Product, 2021-2031 (MBPD, AGR (%), CAGR(%))
Table 61. Canada Thermal Enhanced Oil Recovery Market Forecast by End-Product, 2021-2031 (MBPD, AGR (%), CAGR(%)) (V- Shaped Recovery)
Table 62. Canada Thermal Enhanced Oil Recovery Market Forecast by End-Product, 2021-2031 (MBPD, AGR (%), CAGR(%)) (W- Shaped Recovery)
Table 63. Canada Thermal Enhanced Oil Recovery Market Forecast by End-Product, 2021-2031 (MBPD, AGR (%), CAGR(%)) (U- Shaped Recovery)
Table 64. Canada Thermal Enhanced Oil Recovery Market Forecast by End-Product, 2021-2031 (MBPD, AGR (%), CAGR(%)) (L- Shaped Recovery)
Table 65. Canada Thermal Enhanced Oil Recovery Market by Technology, 2021-2031 (MBPD, AGR (%), CAGR(%))
Table 66. Canada Thermal Enhanced Oil Recovery Market by Technology, 2021-2031 (MBPD, AGR (%), CAGR(%)) (V- Shaped Recovery)
Table 67. Canada Thermal Enhanced Oil Recovery Market by Technology, 2021-2031 (MBPD, AGR (%), CAGR(%)) (W- Shaped Recovery)
Table 68. Canada Thermal Enhanced Oil Recovery Market by Technology, 2021-2031 (MBPD, AGR (%), CAGR(%)) (U- Shaped Recovery)
Table 69. Canada Thermal Enhanced Oil Recovery Market by Technology, 2021-2031 (MBPD, AGR (%), CAGR(%)) (L- Shaped Recovery)
Table 70. Canada Thermal Enhanced Oil Recovery Market by Method, 2021-2031 (MBPD, AGR (%), CAGR(%))
Table 71. Canada Thermal Enhanced Oil Recovery Market by Method, 2021-2031 (MBPD, AGR (%), CAGR(%)) (V- Shaped Recovery)
Table 72. Canada Thermal Enhanced Oil Recovery Market by Method, 2021-2031 (MBPD, AGR (%), CAGR(%)) (W- Shaped Recovery)
Table 73. Canada Thermal Enhanced Oil Recovery Market by Method, 2021-2031 (MBPD, AGR (%), CAGR(%)) (U- Shaped Recovery)
Table 74. Canada Thermal Enhanced Oil Recovery Market by Method, 2021-2031 (MBPD, AGR (%), CAGR(%)) (L- Shaped Recovery)
Table 75. US Thermal Enhanced Oil Recovery Market Current Projects
Table 76. US Thermal Enhanced Oil Recovery Market Forecast, 2021-2031 (USD Mn, AGR (%), CAGR(%))
Table 77. US Thermal Enhanced Oil Recovery Market Forecast, 2021-2031 (USD Mn, AGR (%), CAGR(%)) (V- Shaped Recovery)
Table 78. US Thermal Enhanced Oil Recovery Market Forecast, 2021-2031 (USD Mn, AGR (%), CAGR(%)) (W- Shaped Recovery)
Table 79. US Thermal Enhanced Oil Recovery Market Forecast, 2021-2031 (USD Mn, AGR (%), CAGR(%)) (U- Shaped Recovery)
Table 80. US Thermal Enhanced Oil Recovery Market Forecast, 2021-2031 (USD Mn, AGR (%), CAGR(%)) (L- Shaped Recovery)
Table 81. US Thermal Enhanced Oil Recovery Market Forecast, 2021-2031 (USD Mn, AGR (%), CAGR(%))
Table 82. US Thermal Enhanced Oil Recovery Market Forecast, 2021-2031 (USD Mn, AGR (%), CAGR(%)) (V- Shaped Recovery)
Table 83. US Thermal Enhanced Oil Recovery Market Forecast, 2021-2031 (USD Mn, AGR (%), CAGR(%)) (W- Shaped Recovery)
Table 84. US Thermal Enhanced Oil Recovery Market Forecast, 2021-2031 (USD Mn, AGR (%), CAGR(%)) (U- Shaped Recovery)
Table 85. US Thermal Enhanced Oil Recovery Market Forecast, 2021-2031 (USD Mn, AGR (%), CAGR(%)) (L- Shaped Recovery)
Table 86. US Thermal Enhanced Oil Recovery Market Forecast by Production, 2021-2031 (MBPD, AGR (%), CAGR(%))
Table 87. US Thermal Enhanced Oil Recovery Market Forecast by Production, 2021-2031 (MBPD, AGR (%), CAGR(%)) (V- Shaped Recovery)
Table 88. US Thermal Enhanced Oil Recovery Market Forecast by Production, 2021-2031 (MBPD, AGR (%), CAGR(%)) (W- Shaped Recovery)
Table 89. US Thermal Enhanced Oil Recovery Market Forecast by Production, 2021-2031 (MBPD, AGR (%), CAGR(%)) (U- Shaped Recovery)
Table 90. US Thermal Enhanced Oil Recovery Market Forecast by Production, 2021-2031 (MBPD, AGR (%), CAGR(%)) (L- Shaped Recovery)
Table 91. US Thermal Enhanced Oil Recovery Market Forecast by End-Product, 2021-2031 (MBPD, AGR (%), CAGR(%))
Table 92. US Thermal Enhanced Oil Recovery Market Forecast by End-Product, 2021-2031 (MBPD, AGR (%), CAGR(%)) (V- Shaped Recovery)
Table 93. US Thermal Enhanced Oil Recovery Market Forecast by End-Product, 2021-2031 (MBPD, AGR (%), CAGR(%)) (W- Shaped Recovery)
Table 94. US Thermal Enhanced Oil Recovery Market Forecast by End-Product, 2021-2031 (MBPD, AGR (%), CAGR(%)) (U- Shaped Recovery)
Table 95. US Thermal Enhanced Oil Recovery Market Forecast by End-Product, 2021-2031 (MBPD, AGR (%), CAGR(%)) (L- Shaped Recovery)
Table 96. US Thermal Enhanced Oil Recovery Market by Technology, 2021-2031 (MBPD, AGR (%), CAGR(%))
Table 97. US Thermal Enhanced Oil Recovery Market by Technology, 2021-2031 (MBPD, AGR (%), CAGR(%)) (V- Shaped Recovery)
Table 98. US Thermal Enhanced Oil Recovery Market by Technology, 2021-2031 (MBPD, AGR (%), CAGR(%)) (W- Shaped Recovery)
Table 99. US Thermal Enhanced Oil Recovery Market by Technology, 2021-2031 (MBPD, AGR (%), CAGR(%)) (U- Shaped Recovery)
Table 100. US Thermal Enhanced Oil Recovery Market by Technology, 2021-2031 (MBPD, AGR (%), CAGR(%)) (L- Shaped Recovery)
Table 101. US Thermal Enhanced Oil Recovery Market by Method, 2021-2031 (MBPD, AGR (%), CAGR(%))
Table 102. US Thermal Enhanced Oil Recovery Market by Method, 2021-2031 (MBPD, AGR (%), CAGR(%)) (V- Shaped Recovery)
Table 103. US Thermal Enhanced Oil Recovery Market by Method, 2021-2031 (MBPD, AGR (%), CAGR(%)) (W- Shaped Recovery)
Table 104. US Thermal Enhanced Oil Recovery Market by Method, 2021-2031 (MBPD, AGR (%), CAGR(%)) (U- Shaped Recovery)
Table 105. US Thermal Enhanced Oil Recovery Market by Method, 2021-2031 (MBPD, AGR (%), CAGR(%)) (L- Shaped Recovery)
Table 106. Venezuela Thermal Enhanced Oil Recovery Market Project
Table 107. Venezuela Thermal Enhanced Oil Recovery Market Forecast, 2021-2031 (USD Mn, AGR (%), CAGR(%))
Table 108. Venezuela Thermal Enhanced Oil Recovery Market Forecast, 2021-2031 (USD Mn, AGR (%), CAGR(%)) (V- Shaped Recovery)
Table 109. Venezuela Thermal Enhanced Oil Recovery Market Forecast, 2021-2031 (USD Mn, AGR (%), CAGR(%)) (W- Shaped Recovery)
Table 110. Venezuela Thermal Enhanced Oil Recovery Market Forecast, 2021-2031 (USD Mn, AGR (%), CAGR(%)) (U- Shaped Recovery)
Table 111. Venezuela Thermal Enhanced Oil Recovery Market Forecast, 2021-2031 (USD Mn, AGR (%), CAGR(%)) (L- Shaped Recovery)
Table 112. Venezuela Thermal Enhanced Oil Recovery Market Forecast, 2021-2031 (USD Mn, AGR (%), CAGR(%))
Table 113. Venezuela Thermal Enhanced Oil Recovery Market Forecast, 2021-2031 (USD Mn, AGR (%), CAGR(%)) (V- Shaped Recovery)
Table 114. Venezuela Thermal Enhanced Oil Recovery Market Forecast, 2021-2031 (USD Mn, AGR (%), CAGR(%)) (W- Shaped Recovery)
Table 115. Venezuela Thermal Enhanced Oil Recovery Market Forecast, 2021-2031 (USD Mn, AGR (%), CAGR(%)) (U- Shaped Recovery)
Table 116. Venezuela Thermal Enhanced Oil Recovery Market Forecast, 2021-2031 (USD Mn, AGR (%), CAGR(%)) (L- Shaped Recovery)
Table 117. Venezuela Thermal Enhanced Oil Recovery Market Forecast by Production, 2021-2031 (MBPD, AGR (%), CAGR(%))
Table 118. Venezuela Thermal Enhanced Oil Recovery Market Forecast by Production, 2021-2031 (MBPD, AGR (%), CAGR(%)) (V- Shaped Recovery)
Table 119. Venezuela Thermal Enhanced Oil Recovery Market Forecast by Production, 2021-2031 (MBPD, AGR (%), CAGR(%)) (W- Shaped Recovery)
Table 120. Venezuela Thermal Enhanced Oil Recovery Market Forecast by Production, 2021-2031 (MBPD, AGR (%), CAGR(%)) (U- Shaped Recovery)
Table 121. Venezuela Thermal Enhanced Oil Recovery Market Forecast by Production, 2021-2031 (MBPD, AGR (%), CAGR(%)) (L- Shaped Recovery)
Table 122. Venezuela Thermal Enhanced Oil Recovery Market Forecast by End-Product, 2021-2031 (MBPD, AGR (%), CAGR(%))
Table 123. Venezuela Thermal Enhanced Oil Recovery Market Forecast by End-Product, 2021-2031 (MBPD, AGR (%), CAGR(%)) (V- Shaped Recovery)
Table 124. Venezuela Thermal Enhanced Oil Recovery Market Forecast by End-Product, 2021-2031 (MBPD, AGR (%), CAGR(%)) (W- Shaped Recovery)
Table 125. Venezuela Thermal Enhanced Oil Recovery Market Forecast by End-Product, 2021-2031 (MBPD, AGR (%), CAGR(%)) (U- Shaped Recovery)
Table 126. Venezuela Thermal Enhanced Oil Recovery Market Forecast by End-Product, 2021-2031 (MBPD, AGR (%), CAGR(%)) (L- Shaped Recovery)
Table 127. Venezuela Thermal Enhanced Oil Recovery Market by Technology, 2021-2031 (MBPD, AGR (%), CAGR(%))
Table 128. Venezuela Thermal Enhanced Oil Recovery Market by Technology, 2021-2031 (MBPD, AGR (%), CAGR(%)) (V- Shaped Recovery)
Table 129. Venezuela Thermal Enhanced Oil Recovery Market by Technology, 2021-2031 (MBPD, AGR (%), CAGR(%)) (W- Shaped Recovery)
Table 130. Venezuela Thermal Enhanced Oil Recovery Market by Technology, 2021-2031 (MBPD, AGR (%), CAGR(%)) (U- Shaped Recovery)
Table 131. Venezuela Thermal Enhanced Oil Recovery Market by Technology, 2021-2031 (MBPD, AGR (%), CAGR(%)) (L- Shaped Recovery)
Table 132. Venezuela Thermal Enhanced Oil Recovery Market by Method, 2021-2031 (MBPD, AGR (%), CAGR(%))
Table 133. Venezuela Thermal Enhanced Oil Recovery Market by Method, 2021-2031 (MBPD, AGR (%), CAGR(%)) (V- Shaped Recovery)
Table 134. Venezuela Thermal Enhanced Oil Recovery Market by Method, 2021-2031 (MBPD, AGR (%), CAGR(%)) (W- Shaped Recovery)
Table 135. Venezuela Thermal Enhanced Oil Recovery Market by Method, 2021-2031 (MBPD, AGR (%), CAGR(%)) (U- Shaped Recovery)
Table 136. Venezuela Thermal Enhanced Oil Recovery Market by Method, 2021-2031 (MBPD, AGR (%), CAGR(%)) (L- Shaped Recovery)
Table 137. Indonesia Thermal Enhanced Oil Recovery Market Forecast, 2021-2031 (USD Mn, AGR (%), CAGR(%))
Table 138. Indonesia Thermal Enhanced Oil Recovery Market Forecast, 2021-2031 (USD Mn, AGR (%), CAGR(%)) (V- Shaped Recovery)
Table 139. Indonesia Thermal Enhanced Oil Recovery Market Forecast, 2021-2031 (USD Mn, AGR (%), CAGR(%)) (W- Shaped Recovery)
Table 140. Indonesia Thermal Enhanced Oil Recovery Market Forecast, 2021-2031 (USD Mn, AGR (%), CAGR(%)) (U- Shaped Recovery)
Table 141. Indonesia Thermal Enhanced Oil Recovery Market Forecast, 2021-2031 (USD Mn, AGR (%), CAGR(%)) (L- Shaped Recovery)
Table 142. Indonesia Thermal Enhanced Oil Recovery Market Forecast, 2021-2031 (USD Mn, AGR (%), CAGR(%))
Table 143. Indonesia Thermal Enhanced Oil Recovery Market Forecast, 2021-2031 (USD Mn, AGR (%), CAGR(%)) (V- Shaped Recovery)
Table 144. Indonesia Thermal Enhanced Oil Recovery Market Forecast, 2021-2031 (USD Mn, AGR (%), CAGR(%)) (W- Shaped Recovery)
Table 145. Indonesia Thermal Enhanced Oil Recovery Market Forecast, 2021-2031 (USD Mn, AGR (%), CAGR(%)) (U- Shaped Recovery)
Table 146. Indonesia Thermal Enhanced Oil Recovery Market Forecast, 2021-2031 (USD Mn, AGR (%), CAGR(%)) (L- Shaped Recovery)
Table 147. Indonesia Thermal Enhanced Oil Recovery Market Forecast by Production, 2021-2031 (MBPD, AGR (%), CAGR(%))
Table 148. Indonesia Thermal Enhanced Oil Recovery Market Forecast by Production, 2021-2031 (MBPD, AGR (%), CAGR(%)) (V- Shaped Recovery)
Table 149. Indonesia Thermal Enhanced Oil Recovery Market Forecast by Production, 2021-2031 (MBPD, AGR (%), CAGR(%)) (W- Shaped Recovery)
Table 150. Indonesia Thermal Enhanced Oil Recovery Market Forecast by Production, 2021-2031 (MBPD, AGR (%), CAGR(%)) (U- Shaped Recovery)
Table 151. Indonesia Thermal Enhanced Oil Recovery Market Forecast by Production, 2021-2031 (MBPD, AGR (%), CAGR(%)) (L- Shaped Recovery)
Table 152. Indonesia Thermal Enhanced Oil Recovery Market Forecast by End-Product, 2021-2031 (MBPD, AGR (%), CAGR(%))
Table 153. Indonesia Thermal Enhanced Oil Recovery Market Forecast by End-Product, 2021-2031 (MBPD, AGR (%), CAGR(%)) (V- Shaped Recovery)
Table 154. Indonesia Thermal Enhanced Oil Recovery Market Forecast by End-Product, 2021-2031 (MBPD, AGR (%), CAGR(%)) (W- Shaped Recovery)
Table 155. Indonesia Thermal Enhanced Oil Recovery Market Forecast by End-Product, 2021-2031 (MBPD, AGR (%), CAGR(%)) (U- Shaped Recovery)
Table 156. Indonesia Thermal Enhanced Oil Recovery Market Forecast by End-Product, 2021-2031 (MBPD, AGR (%), CAGR(%)) (L- Shaped Recovery)
Table 157. Indonesia Thermal Enhanced Oil Recovery Market by Technology, 2021-2031 (MBPD, AGR (%), CAGR(%))
Table 158. Indonesia Thermal Enhanced Oil Recovery Market by Technology, 2021-2031 (MBPD, AGR (%), CAGR(%)) (V- Shaped Recovery)
Table 159. Indonesia Thermal Enhanced Oil Recovery Market by Technology, 2021-2031 (MBPD, AGR (%), CAGR(%)) (W- Shaped Recovery)
Table 160. Indonesia Thermal Enhanced Oil Recovery Market by Technology, 2021-2031 (MBPD, AGR (%), CAGR(%)) (U- Shaped Recovery)
Table 161. Indonesia Thermal Enhanced Oil Recovery Market by Technology, 2021-2031 (MBPD, AGR (%), CAGR(%)) (L- Shaped Recovery)
Table 162. Indonesia Thermal Enhanced Oil Recovery Market by Method, 2021-2031 (MBPD, AGR (%), CAGR(%))
Table 163. Indonesia Thermal Enhanced Oil Recovery Market by Method, 2021-2031 (MBPD, AGR (%), CAGR(%)) (V- Shaped Recovery)
Table 164. Indonesia Thermal Enhanced Oil Recovery Market by Method, 2021-2031 (MBPD, AGR (%), CAGR(%)) (W- Shaped Recovery)
Table 165. Indonesia Thermal Enhanced Oil Recovery Market by Method, 2021-2031 (MBPD, AGR (%), CAGR(%)) (U- Shaped Recovery)
Table 166. Indonesia Thermal Enhanced Oil Recovery Market by Method, 2021-2031 (MBPD, AGR (%), CAGR(%)) (L- Shaped Recovery)
Table 167. Kuwait Thermal Enhanced Oil Recovery Market Forecast, 2021-2031 (USD Mn, AGR (%), CAGR(%))
Table 168. Kuwait Thermal Enhanced Oil Recovery Market Forecast, 2021-2031 (USD Mn, AGR (%), CAGR(%)) (V- Shaped Recovery)
Table 169. Kuwait Thermal Enhanced Oil Recovery Market Forecast, 2021-2031 (USD Mn, AGR (%), CAGR(%)) (W- Shaped Recovery)
Table 170. Kuwait Thermal Enhanced Oil Recovery Market Forecast, 2021-2031 (USD Mn, AGR (%), CAGR(%)) (U- Shaped Recovery)
Table 171. Kuwait Thermal Enhanced Oil Recovery Market Forecast, 2021-2031 (USD Mn, AGR (%), CAGR(%)) (L- Shaped Recovery)
Table 172. Kuwait Thermal Enhanced Oil Recovery Market Forecast, 2021-2031 (USD Mn, AGR (%), CAGR(%))
Table 173. Kuwait Thermal Enhanced Oil Recovery Market Forecast, 2021-2031 (USD Mn, AGR (%), CAGR(%)) (V- Shaped Recovery)
Table 174. Kuwait Thermal Enhanced Oil Recovery Market Forecast, 2021-2031 (USD Mn, AGR (%), CAGR(%)) (W- Shaped Recovery)
Table 175. Kuwait Thermal Enhanced Oil Recovery Market Forecast, 2021-2031 (USD Mn, AGR (%), CAGR(%)) (U- Shaped Recovery)
Table 176. Kuwait Thermal Enhanced Oil Recovery Market Forecast, 2021-2031 (USD Mn, AGR (%), CAGR(%)) (L- Shaped Recovery)
Table 177. Kuwait Thermal Enhanced Oil Recovery Market Forecast by Production, 2021-2031 (MBPD, AGR (%), CAGR(%))
Table 178. Kuwait Thermal Enhanced Oil Recovery Market Forecast by Production, 2021-2031 (MBPD, AGR (%), CAGR(%)) (V- Shaped Recovery)
Table 179. Kuwait Thermal Enhanced Oil Recovery Market Forecast by Production, 2021-2031 (MBPD, AGR (%), CAGR(%)) (W- Shaped Recovery)
Table 180. Kuwait Thermal Enhanced Oil Recovery Market Forecast by Production, 2021-2031 (MBPD, AGR (%), CAGR(%)) (U- Shaped Recovery)
Table 181. Kuwait Thermal Enhanced Oil Recovery Market Forecast by Production, 2021-2031 (MBPD, AGR (%), CAGR(%)) (L- Shaped Recovery)
Table 182. Kuwait Thermal Enhanced Oil Recovery Market Forecast by End-Product, 2021-2031 (MBPD, AGR (%), CAGR(%))
Table 183. Kuwait Thermal Enhanced Oil Recovery Market Forecast by End-Product, 2021-2031 (MBPD, AGR (%), CAGR(%)) (V- Shaped Recovery)
Table 184. Kuwait Thermal Enhanced Oil Recovery Market Forecast by End-Product, 2021-2031 (MBPD, AGR (%), CAGR(%)) (W- Shaped Recovery)
Table 185. Kuwait Thermal Enhanced Oil Recovery Market Forecast by End-Product, 2021-2031 (MBPD, AGR (%), CAGR(%)) (U- Shaped Recovery)
Table 186. Kuwait Thermal Enhanced Oil Recovery Market Forecast by End-Product, 2021-2031 (MBPD, AGR (%), CAGR(%)) (L- Shaped Recovery)
Table 187. Kuwait Thermal Enhanced Oil Recovery Market by Technology, 2021-2031 (MBPD, AGR (%), CAGR(%))
Table 188. Kuwait Thermal Enhanced Oil Recovery Market by Technology, 2021-2031 (MBPD, AGR (%), CAGR(%)) (V- Shaped Recovery)
Table 189. Kuwait Thermal Enhanced Oil Recovery Market by Technology, 2021-2031 (MBPD, AGR (%), CAGR(%)) (W- Shaped Recovery)
Table 190. Kuwait Thermal Enhanced Oil Recovery Market by Technology, 2021-2031 (MBPD, AGR (%), CAGR(%)) (U- Shaped Recovery)
Table 191. Kuwait Thermal Enhanced Oil Recovery Market by Technology, 2021-2031 (MBPD, AGR (%), CAGR(%)) (L- Shaped Recovery)
Table 192. Kuwait Thermal Enhanced Oil Recovery Market by Method, 2021-2031 (MBPD, AGR (%), CAGR(%))
Table 193. Kuwait Thermal Enhanced Oil Recovery Market by Method, 2021-2031 (MBPD, AGR (%), CAGR(%)) (V- Shaped Recovery)
Table 194. Kuwait Thermal Enhanced Oil Recovery Market by Method, 2021-2031 (MBPD, AGR (%), CAGR(%)) (W- Shaped Recovery)
Table 195. Kuwait Thermal Enhanced Oil Recovery Market by Method, 2021-2031 (MBPD, AGR (%), CAGR(%)) (U- Shaped Recovery)
Table 196. Kuwait Thermal Enhanced Oil Recovery Market by Method, 2021-2031 (MBPD, AGR (%), CAGR(%)) (L- Shaped Recovery)
Table 197. Oman Thermal Enhanced Oil Recovery Market Forecast, 2021-2031 (USD Mn, AGR (%), CAGR(%))
Table 198. Oman Thermal Enhanced Oil Recovery Market Forecast, 2021-2031 (USD Mn, AGR (%), CAGR(%)) (V- Shaped Recovery)
Table 199. Oman Thermal Enhanced Oil Recovery Market Forecast, 2021-2031 (USD Mn, AGR (%), CAGR(%)) (W- Shaped Recovery)
Table 200. Oman Thermal Enhanced Oil Recovery Market Forecast, 2021-2031 (USD Mn, AGR (%), CAGR(%)) (U- Shaped Recovery)
Table 201. Oman Thermal Enhanced Oil Recovery Market Forecast, 2021-2031 (USD Mn, AGR (%), CAGR(%)) (L- Shaped Recovery)
Table 202. Oman Thermal Enhanced Oil Recovery Market Forecast, 2021-2031 (USD Mn, AGR (%), CAGR(%))
Table 203. Oman Thermal Enhanced Oil Recovery Market Forecast, 2021-2031 (USD Mn, AGR (%), CAGR(%)) (V- Shaped Recovery)
Table 204. Oman Thermal Enhanced Oil Recovery Market Forecast, 2021-2031 (USD Mn, AGR (%), CAGR(%)) (W- Shaped Recovery)
Table 205. Oman Thermal Enhanced Oil Recovery Market Forecast, 2021-2031 (USD Mn, AGR (%), CAGR(%)) (U- Shaped Recovery)
Table 206. Oman Thermal Enhanced Oil Recovery Market Forecast, 2021-2031 (USD Mn, AGR (%), CAGR(%)) (L- Shaped Recovery)
Table 207. Oman Thermal Enhanced Oil Recovery Market Forecast by Production, 2021-2031 (MBPD, AGR (%), CAGR(%))
Table 208. Oman Thermal Enhanced Oil Recovery Market Forecast by Production, 2021-2031 (MBPD, AGR (%), CAGR(%)) (V- Shaped Recovery)
Table 209. Oman Thermal Enhanced Oil Recovery Market Forecast by Production, 2021-2031 (MBPD, AGR (%), CAGR(%)) (W- Shaped Recovery)
Table 210. Oman Thermal Enhanced Oil Recovery Market Forecast by Production, 2021-2031 (MBPD, AGR (%), CAGR(%)) (U- Shaped Recovery)
Table 211. Oman Thermal Enhanced Oil Recovery Market Forecast by Production, 2021-2031 (MBPD, AGR (%), CAGR(%)) (L- Shaped Recovery)
Table 212. Oman Thermal Enhanced Oil Recovery Market Forecast by End-Product, 2021-2031 (MBPD, AGR (%), CAGR(%))
Table 213. Oman Thermal Enhanced Oil Recovery Market Forecast by End-Product, 2021-2031 (MBPD, AGR (%), CAGR(%)) (V- Shaped Recovery)
Table 214. Oman Thermal Enhanced Oil Recovery Market Forecast by End-Product, 2021-2031 (MBPD, AGR (%), CAGR(%)) (W- Shaped Recovery)
Table 215. Oman Thermal Enhanced Oil Recovery Market Forecast by End-Product, 2021-2031 (MBPD, AGR (%), CAGR(%)) (U- Shaped Recovery)
Table 216. Oman Thermal Enhanced Oil Recovery Market Forecast by End-Product, 2021-2031 (MBPD, AGR (%), CAGR(%)) (L- Shaped Recovery)
Table 217. Oman Thermal Enhanced Oil Recovery Market by Technology, 2021-2031 (MBPD, AGR (%), CAGR(%))
Table 218. Oman Thermal Enhanced Oil Recovery Market by Technology, 2021-2031 (MBPD, AGR (%), CAGR(%)) (V- Shaped Recovery)
Table 218. Oman Thermal Enhanced Oil Recovery Market by Technology, 2021-2031 (MBPD, AGR (%), CAGR(%)) (W- Shaped Recovery)
Table 218. Oman Thermal Enhanced Oil Recovery Market by Technology, 2021-2031 (MBPD, AGR (%), CAGR(%)) (U- Shaped Recovery)
Table 218. Oman Thermal Enhanced Oil Recovery Market by Technology, 2021-2031 (MBPD, AGR (%), CAGR(%)) (L- Shaped Recovery)
Table 222. Oman Thermal Enhanced Oil Recovery Market by Method, 2021-2031 (MBPD, AGR (%), CAGR(%))
Table 223. Oman Thermal Enhanced Oil Recovery Market by Method, 2021-2031 (MBPD, AGR (%), CAGR(%)) (V- Shaped Recovery)
Table 224. Oman Thermal Enhanced Oil Recovery Market by Method, 2021-2031 (MBPD, AGR (%), CAGR(%)) (W- Shaped Recovery)
Table 225. Oman Thermal Enhanced Oil Recovery Market by Method, 2021-2031 (MBPD, AGR (%), CAGR(%)) (U- Shaped Recovery)
Table 226. Oman Thermal Enhanced Oil Recovery Market by Method, 2021-2031 (MBPD, AGR (%), CAGR(%)) (L- Shaped Recovery)
Table 227. China Thermal Enhanced Oil Recovery Market Forecast, 2021-2031 (USD Mn, AGR (%), CAGR(%))
Table 228. China Thermal Enhanced Oil Recovery Market Forecast, 2021-2031 (USD Mn, AGR (%), CAGR(%)) (V- Shaped Recovery)
Table 229. China Thermal Enhanced Oil Recovery Market Forecast, 2021-2031 (USD Mn, AGR (%), CAGR(%)) (W- Shaped Recovery)
Table 230. China Thermal Enhanced Oil Recovery Market Forecast, 2021-2031 (USD Mn, AGR (%), CAGR(%)) (U- Shaped Recovery)
Table 231. China Thermal Enhanced Oil Recovery Market Forecast, 2021-2031 (USD Mn, AGR (%), CAGR(%)) (L- Shaped Recovery)
Table 232. China Thermal Enhanced Oil Recovery Market Forecast, 2021-2031 (USD Mn, AGR (%), CAGR(%))
Table 233. China Thermal Enhanced Oil Recovery Market Forecast, 2021-2031 (USD Mn, AGR (%), CAGR(%)) (V- Shaped Recovery)
Table 234. China Thermal Enhanced Oil Recovery Market Forecast, 2021-2031 (USD Mn, AGR (%), CAGR(%)) (W- Shaped Recovery)
Table 235. China Thermal Enhanced Oil Recovery Market Forecast, 2021-2031 (USD Mn, AGR (%), CAGR(%)) (U- Shaped Recovery)
Table 236. China Thermal Enhanced Oil Recovery Market Forecast, 2021-2031 (USD Mn, AGR (%), CAGR(%)) (L- Shaped Recovery)
Table 237. China Thermal Enhanced Oil Recovery Market Forecast by Production, 2021-2031 (MBPD, AGR (%), CAGR(%))
Table 238. China Thermal Enhanced Oil Recovery Market Forecast by Production, 2021-2031 (MBPD, AGR (%), CAGR(%)) (V- Shaped Recovery)
Table 239. China Thermal Enhanced Oil Recovery Market Forecast by Production, 2021-2031 (MBPD, AGR (%), CAGR(%)) (W- Shaped Recovery)
Table 240. China Thermal Enhanced Oil Recovery Market Forecast by Production, 2021-2031 (MBPD, AGR (%), CAGR(%)) (U- Shaped Recovery)
Table 241. China Thermal Enhanced Oil Recovery Market Forecast by Production, 2021-2031 (MBPD, AGR (%), CAGR(%)) (L- Shaped Recovery)
Table 242. China Thermal Enhanced Oil Recovery Market Forecast by End-Product, 2021-2031 (MBPD, AGR (%), CAGR(%))
Table 243. China Thermal Enhanced Oil Recovery Market Forecast by End-Product, 2021-2031 (MBPD, AGR (%), CAGR(%)) (V- Shaped Recovery)
Table 244. China Thermal Enhanced Oil Recovery Market Forecast by End-Product, 2021-2031 (MBPD, AGR (%), CAGR(%)) (W- Shaped Recovery)
Table 245. China Thermal Enhanced Oil Recovery Market Forecast by End-Product, 2021-2031 (MBPD, AGR (%), CAGR(%)) (U- Shaped Recovery)
Table 246. China Thermal Enhanced Oil Recovery Market Forecast by End-Product, 2021-2031 (MBPD, AGR (%), CAGR(%)) (L- Shaped Recovery)
Table 247. China Thermal Enhanced Oil Recovery Market by Technology, 2021-2031 (MBPD, AGR (%), CAGR(%))
Table 248. China Thermal Enhanced Oil Recovery Market by Technology, 2021-2031 (MBPD, AGR (%), CAGR(%)) (V- Shaped Recovery)
Table 249. China Thermal Enhanced Oil Recovery Market by Technology, 2021-2031 (MBPD, AGR (%), CAGR(%)) (W- Shaped Recovery)
Table 250. China Thermal Enhanced Oil Recovery Market by Technology, 2021-2031 (MBPD, AGR (%), CAGR(%)) (U- Shaped Recovery)
Table 251. China Thermal Enhanced Oil Recovery Market by Technology, 2021-2031 (MBPD, AGR (%), CAGR(%)) (L- Shaped Recovery)
Table 252. China Thermal Enhanced Oil Recovery Market by Method, 2021-2031 (MBPD, AGR (%), CAGR(%))
Table 253. China Thermal Enhanced Oil Recovery Market by Method, 2021-2031 (MBPD, AGR (%), CAGR(%)) (V- Shaped Recovery)
Table 254. China Thermal Enhanced Oil Recovery Market by Method, 2021-2031 (MBPD, AGR (%), CAGR(%)) (W- Shaped Recovery)
Table 255. China Thermal Enhanced Oil Recovery Market by Method, 2021-2031 (MBPD, AGR (%), CAGR(%)) (U- Shaped Recovery)
Table 256. China Thermal Enhanced Oil Recovery Market by Method, 2021-2031 (MBPD, AGR (%), CAGR(%)) (L- Shaped Recovery)
Table 257. Russia Thermal Enhanced Oil Recovery Market Forecast, 2021-2031 (USD Mn, AGR (%), CAGR(%))
Table 258. Russia Thermal Enhanced Oil Recovery Market Forecast, 2021-2031 (USD Mn, AGR (%), CAGR(%)) (V- Shaped Recovery)
Table 259. Russia Thermal Enhanced Oil Recovery Market Forecast, 2021-2031 (USD Mn, AGR (%), CAGR(%)) (W- Shaped Recovery)
Table 260. Russia Thermal Enhanced Oil Recovery Market Forecast, 2021-2031 (USD Mn, AGR (%), CAGR(%)) (U- Shaped Recovery)
Table 261. Russia Thermal Enhanced Oil Recovery Market Forecast, 2021-2031 (USD Mn, AGR (%), CAGR(%)) (L- Shaped Recovery)
Table 262. Russia Thermal Enhanced Oil Recovery Market Forecast, 2021-2031 (USD Mn, AGR (%), CAGR(%))
Table 263. Russia Thermal Enhanced Oil Recovery Market Forecast, 2021-2031 (USD Mn, AGR (%), CAGR(%)) (V- Shaped Recovery)
Table 264. Russia Thermal Enhanced Oil Recovery Market Forecast, 2021-2031 (USD Mn, AGR (%), CAGR(%)) (W- Shaped Recovery)
Table 265. Russia Thermal Enhanced Oil Recovery Market Forecast, 2021-2031 (USD Mn, AGR (%), CAGR(%)) (U- Shaped Recovery)
Table 266. Russia Thermal Enhanced Oil Recovery Market Forecast, 2021-2031 (USD Mn, AGR (%), CAGR(%)) (L- Shaped Recovery)
Table 267. Russia Thermal Enhanced Oil Recovery Market Forecast by Production, 2021-2031 (MBPD, AGR (%), CAGR(%))
Table 268. Russia Thermal Enhanced Oil Recovery Market Forecast by Production, 2021-2031 (MBPD, AGR (%), CAGR(%)) (V- Shaped Recovery)
Table 269. Russia Thermal Enhanced Oil Recovery Market Forecast by Production, 2021-2031 (MBPD, AGR (%), CAGR(%)) (W- Shaped Recovery)
Table 270. Russia Thermal Enhanced Oil Recovery Market Forecast by Production, 2021-2031 (MBPD, AGR (%), CAGR(%)) (U- Shaped Recovery)
Table 271. Russia Thermal Enhanced Oil Recovery Market Forecast by Production, 2021-2031 (MBPD, AGR (%), CAGR(%)) (L- Shaped Recovery)
Table 272. Russia Thermal Enhanced Oil Recovery Market Forecast by End-Product, 2021-2031 (MBPD, AGR (%), CAGR(%))
Table 273. Russia Thermal Enhanced Oil Recovery Market Forecast by End-Product, 2021-2031 (MBPD, AGR (%), CAGR(%)) (V- Shaped Recovery)
Table 274. Russia Thermal Enhanced Oil Recovery Market Forecast by End-Product, 2021-2031 (MBPD, AGR (%), CAGR(%)) (W- Shaped Recovery)
Table 275. Russia Thermal Enhanced Oil Recovery Market Forecast by End-Product, 2021-2031 (MBPD, AGR (%), CAGR(%)) (U- Shaped Recovery)
Table 276. Russia Thermal Enhanced Oil Recovery Market Forecast by End-Product, 2021-2031 (MBPD, AGR (%), CAGR(%)) (L- Shaped Recovery)
Table 277. Russia Thermal Enhanced Oil Recovery Market by Technology, 2021-2031 (MBPD, AGR (%), CAGR(%))
Table 278. Russia Thermal Enhanced Oil Recovery Market by Technology, 2021-2031 (MBPD, AGR (%), CAGR(%)) (V- Shaped Recovery)
Table 279. Russia Thermal Enhanced Oil Recovery Market by Technology, 2021-2031 (MBPD, AGR (%), CAGR(%)) (W- Shaped Recovery)
Table 280. Russia Thermal Enhanced Oil Recovery Market by Technology, 2021-2031 (MBPD, AGR (%), CAGR(%)) (U- Shaped Recovery)
Table 281. Russia Thermal Enhanced Oil Recovery Market by Technology, 2021-2031 (MBPD, AGR (%), CAGR(%)) (L- Shaped Recovery)
Table 282. Russia Thermal Enhanced Oil Recovery Market by Method, 2021-2031 (MBPD, AGR (%), CAGR(%))
Table 283. Russia Thermal Enhanced Oil Recovery Market by Method, 2021-2031 (MBPD, AGR (%), CAGR(%)) (V- Shaped Recovery)
Table 284. Russia Thermal Enhanced Oil Recovery Market by Method, 2021-2031 (MBPD, AGR (%), CAGR(%)) (W- Shaped Recovery)
Table 285. Russia Thermal Enhanced Oil Recovery Market by Method, 2021-2031 (MBPD, AGR (%), CAGR(%)) (U- Shaped Recovery)
Table 286. Russia Thermal Enhanced Oil Recovery Market by Method, 2021-2031 (MBPD, AGR (%), CAGR(%)) (L- Shaped Recovery)
Table 287. Bahrain Thermal Enhanced Oil Recovery Market Forecast, 2021-2031 (USD Mn, AGR (%), CAGR(%))
Table 288. Bahrain Thermal Enhanced Oil Recovery Market Forecast, 2021-2031 (USD Mn, AGR (%), CAGR(%)) (V- Shaped Recovery)
Table 289. Bahrain Thermal Enhanced Oil Recovery Market Forecast, 2021-2031 (USD Mn, AGR (%), CAGR(%)) (W- Shaped Recovery)
Table 290. Bahrain Thermal Enhanced Oil Recovery Market Forecast, 2021-2031 (USD Mn, AGR (%), CAGR(%)) (U- Shaped Recovery)
Table 291. Bahrain Thermal Enhanced Oil Recovery Market Forecast, 2021-2031 (USD Mn, AGR (%), CAGR(%)) (L- Shaped Recovery)
Table 292. Bahrain Thermal Enhanced Oil Recovery Market Forecast, 2021-2031 (USD Mn, AGR (%), CAGR(%))
Table 293. Bahrain Thermal Enhanced Oil Recovery Market Forecast, 2021-2031 (USD Mn, AGR (%), CAGR(%)) (V- Shaped Recovery)
Table 294. Bahrain Thermal Enhanced Oil Recovery Market Forecast, 2021-2031 (USD Mn, AGR (%), CAGR(%)) (W- Shaped Recovery)
Table 295. Bahrain Thermal Enhanced Oil Recovery Market Forecast, 2021-2031 (USD Mn, AGR (%), CAGR(%)) (U- Shaped Recovery)
Table 296. Bahrain Thermal Enhanced Oil Recovery Market Forecast, 2021-2031 (USD Mn, AGR (%), CAGR(%)) (L- Shaped Recovery)
Table 297. Bahrain Thermal Enhanced Oil Recovery Market Forecast by Production, 2021-2031 (MBPD, AGR (%), CAGR(%))
Table 298. Bahrain Thermal Enhanced Oil Recovery Market Forecast by Production, 2021-2031 (MBPD, AGR (%), CAGR(%)) (V- Shaped Recovery)
Table 299. Bahrain Thermal Enhanced Oil Recovery Market Forecast by Production, 2021-2031 (MBPD, AGR (%), CAGR(%)) (W- Shaped Recovery)
Table 300. Bahrain Thermal Enhanced Oil Recovery Market Forecast by Production, 2021-2031 (MBPD, AGR (%), CAGR(%)) (U- Shaped Recovery)
Table 301. Bahrain Thermal Enhanced Oil Recovery Market Forecast by Production, 2021-2031 (MBPD, AGR (%), CAGR(%)) (L- Shaped Recovery)
Table 302. Bahrain Thermal Enhanced Oil Recovery Market Forecast by End-Product, 2021-2031 (MBPD, AGR (%), CAGR(%))
Table 303. Bahrain Thermal Enhanced Oil Recovery Market Forecast by End-Product, 2021-2031 (MBPD, AGR (%), CAGR(%)) (V- Shaped Recovery)
Table 304. Bahrain Thermal Enhanced Oil Recovery Market Forecast by End-Product, 2021-2031 (MBPD, AGR (%), CAGR(%)) (W- Shaped Recovery)
Table 305. Bahrain Thermal Enhanced Oil Recovery Market Forecast by End-Product, 2021-2031 (MBPD, AGR (%), CAGR(%)) (U- Shaped Recovery)
Table 306. Bahrain Thermal Enhanced Oil Recovery Market Forecast by End-Product, 2021-2031 (MBPD, AGR (%), CAGR(%)) (L- Shaped Recovery)
Table 307. Bahrain Thermal Enhanced Oil Recovery Market by Technology, 2021-2031 (MBPD, AGR (%), CAGR(%))
Table 308. Bahrain Thermal Enhanced Oil Recovery Market by Technology, 2021-2031 (MBPD, AGR (%), CAGR(%)) (V- Shaped Recovery)
Table 309. Bahrain Thermal Enhanced Oil Recovery Market by Technology, 2021-2031 (MBPD, AGR (%), CAGR(%)) (W- Shaped Recovery)
Table 310. Bahrain Thermal Enhanced Oil Recovery Market by Technology, 2021-2031 (MBPD, AGR (%), CAGR(%)) (U- Shaped Recovery)
Table 311. Bahrain Thermal Enhanced Oil Recovery Market by Technology, 2021-2031 (MBPD, AGR (%), CAGR(%)) (L- Shaped Recovery)
Table 312. Bahrain Thermal Enhanced Oil Recovery Market by Method, 2021-2031 (MBPD, AGR (%), CAGR(%))
Table 313. Bahrain Thermal Enhanced Oil Recovery Market by Method, 2021-2031 (MBPD, AGR (%), CAGR(%)) (V- Shaped Recovery)
Table 314. Bahrain Thermal Enhanced Oil Recovery Market by Method, 2021-2031 (MBPD, AGR (%), CAGR(%)) (W- Shaped Recovery)
Table 315. Bahrain Thermal Enhanced Oil Recovery Market by Method, 2021-2031 (MBPD, AGR (%), CAGR(%)) (U- Shaped Recovery)
Table 316. Bahrain Thermal Enhanced Oil Recovery Market by Method, 2021-2031 (MBPD, AGR (%), CAGR(%)) (L- Shaped Recovery)
Table 317. Saudi Arabia Thermal Enhanced Oil Recovery Market Forecast, 2021-2031 (USD Mn, AGR (%), CAGR(%))
Table 318. Saudi Arabia Thermal Enhanced Oil Recovery Market Forecast, 2021-2031 (USD Mn, AGR (%), CAGR(%)) (V- Shaped Recovery)
Table 319. Saudi Arabia Thermal Enhanced Oil Recovery Market Forecast, 2021-2031 (USD Mn, AGR (%), CAGR(%)) (W- Shaped Recovery)
Table 320. Saudi Arabia Thermal Enhanced Oil Recovery Market Forecast, 2021-2031 (USD Mn, AGR (%), CAGR(%)) (U- Shaped Recovery)
Table 321. Saudi Arabia Thermal Enhanced Oil Recovery Market Forecast, 2021-2031 (USD Mn, AGR (%), CAGR(%)) (L- Shaped Recovery)
Table 322. Saudi Arabia Thermal Enhanced Oil Recovery Market Forecast, 2021-2031 (USD Mn, AGR (%), CAGR(%))
Table 323. Saudi Arabia Thermal Enhanced Oil Recovery Market Forecast, 2021-2031 (USD Mn, AGR (%), CAGR(%)) (V- Shaped Recovery)
Table 324. Saudi Arabia Thermal Enhanced Oil Recovery Market Forecast, 2021-2031 (USD Mn, AGR (%), CAGR(%)) (W- Shaped Recovery)
Table 325. Saudi Arabia Thermal Enhanced Oil Recovery Market Forecast, 2021-2031 (USD Mn, AGR (%), CAGR(%)) (U- Shaped Recovery)
Table 326. Saudi Arabia Thermal Enhanced Oil Recovery Market Forecast, 2021-2031 (USD Mn, AGR (%), CAGR(%)) (L- Shaped Recovery)
Table 327. Saudi Arabia Thermal Enhanced Oil Recovery Market Forecast by Production, 2021-2031 (MBPD, AGR (%), CAGR(%))
Table 328. Saudi Arabia Thermal Enhanced Oil Recovery Market Forecast by Production, 2021-2031 (MBPD, AGR (%), CAGR(%)) (V- Shaped Recovery)
Table 329. Saudi Arabia Thermal Enhanced Oil Recovery Market Forecast by Production, 2021-2031 (MBPD, AGR (%), CAGR(%)) (W- Shaped Recovery)
Table 330. Saudi Arabia Thermal Enhanced Oil Recovery Market Forecast by Production, 2021-2031 (MBPD, AGR (%), CAGR(%)) (U- Shaped Recovery)
Table 331. Saudi Arabia Thermal Enhanced Oil Recovery Market Forecast by Production, 2021-2031 (MBPD, AGR (%), CAGR(%)) (L- Shaped Recovery)
Table 332. Saudi Arabia Thermal Enhanced Oil Recovery Market Forecast by End-Product, 2021-2031 (MBPD, AGR (%), CAGR(%))
Table 333. Saudi Arabia Thermal Enhanced Oil Recovery Market Forecast by End-Product, 2021-2031 (MBPD, AGR (%), CAGR(%)) (V- Shaped Recovery)
Table 334. Saudi Arabia Thermal Enhanced Oil Recovery Market Forecast by End-Product, 2021-2031 (MBPD, AGR (%), CAGR(%)) (W- Shaped Recovery)
Table 335. Saudi Arabia Thermal Enhanced Oil Recovery Market Forecast by End-Product, 2021-2031 (MBPD, AGR (%), CAGR(%)) (U- Shaped Recovery)
Table 336. Saudi Arabia Thermal Enhanced Oil Recovery Market Forecast by End-Product, 2021-2031 (MBPD, AGR (%), CAGR(%)) (L- Shaped Recovery)
Table 337. Saudi Arabia Thermal Enhanced Oil Recovery Market by Technology, 2021-2031 (MBPD, AGR (%), CAGR(%))
Table 338. Saudi Arabia Thermal Enhanced Oil Recovery Market by Technology, 2021-2031 (MBPD, AGR (%), CAGR(%)) (V- Shaped Recovery)
Table 339. Saudi Arabia Thermal Enhanced Oil Recovery Market by Technology, 2021-2031 (MBPD, AGR (%), CAGR(%)) (W- Shaped Recovery)
Table 340. Saudi Arabia Thermal Enhanced Oil Recovery Market by Technology, 2021-2031 (MBPD, AGR (%), CAGR(%)) (U- Shaped Recovery)
Table 341. Saudi Arabia Thermal Enhanced Oil Recovery Market by Technology, 2021-2031 (MBPD, AGR (%), CAGR(%)) (L- Shaped Recovery)
Table 342. Saudi Arabia Thermal Enhanced Oil Recovery Market by Method, 2021-2031 (MBPD, AGR (%), CAGR(%))
Table 343. Saudi Arabia Thermal Enhanced Oil Recovery Market by Method, 2021-2031 (MBPD, AGR (%), CAGR(%)) (V- Shaped Recovery)
Table 344. Saudi Arabia Thermal Enhanced Oil Recovery Market by Method, 2021-2031 (MBPD, AGR (%), CAGR(%)) (W- Shaped Recovery)
Table 345. Saudi Arabia Thermal Enhanced Oil Recovery Market by Method, 2021-2031 (MBPD, AGR (%), CAGR(%)) (U- Shaped Recovery)
Table 346. Saudi Arabia Thermal Enhanced Oil Recovery Market by Method, 2021-2031 (MBPD, AGR (%), CAGR(%)) (L- Shaped Recovery)
Table 347. Rest of World Thermal Enhanced Oil Recovery Market Forecast, 2021-2031 (USD Mn, AGR (%), CAGR(%))
Table 348. Rest of World Thermal Enhanced Oil Recovery Market Forecast, 2021-2031 (USD Mn, AGR (%), CAGR(%)) (V- Shaped Recovery)
Table 349. Rest of World Thermal Enhanced Oil Recovery Market Forecast, 2021-2031 (USD Mn, AGR (%), CAGR(%)) (W- Shaped Recovery)
Table 350. Rest of World Thermal Enhanced Oil Recovery Market Forecast, 2021-2031 (USD Mn, AGR (%), CAGR(%)) (U- Shaped Recovery)
Table 351. Rest of World Thermal Enhanced Oil Recovery Market Forecast, 2021-2031 (USD Mn, AGR (%), CAGR(%)) (L- Shaped Recovery)
Table 352. Rest of World Thermal Enhanced Oil Recovery Market Forecast, 2021-2031 (USD Mn, AGR (%), CAGR(%))
Table 353. Rest of World Thermal Enhanced Oil Recovery Market Forecast, 2021-2031 (USD Mn, AGR (%), CAGR(%)) (V- Shaped Recovery)
Table 354. Rest of World Thermal Enhanced Oil Recovery Market Forecast, 2021-2031 (USD Mn, AGR (%), CAGR(%)) (W- Shaped Recovery)
Table 355. Rest of World Thermal Enhanced Oil Recovery Market Forecast, 2021-2031 (USD Mn, AGR (%), CAGR(%)) (U- Shaped Recovery)
Table 356. Rest of World Thermal Enhanced Oil Recovery Market Forecast, 2021-2031 (USD Mn, AGR (%), CAGR(%)) (L- Shaped Recovery)
Table 357. Rest of World Thermal Enhanced Oil Recovery Market Forecast by Production, 2021-2031 (MBPD, AGR (%), CAGR(%))
Table 358. Rest of World Thermal Enhanced Oil Recovery Market Forecast by Production, 2021-2031 (MBPD, AGR (%), CAGR(%)) (V- Shaped Recovery)
Table 359. Rest of World Thermal Enhanced Oil Recovery Market Forecast by Production, 2021-2031 (MBPD, AGR (%), CAGR(%)) (W- Shaped Recovery)
Table 360. Rest of World Thermal Enhanced Oil Recovery Market Forecast by Production, 2021-2031 (MBPD, AGR (%), CAGR(%)) (U- Shaped Recovery)
Table 361. Rest of World Thermal Enhanced Oil Recovery Market Forecast by Production, 2021-2031 (MBPD, AGR (%), CAGR(%)) (L- Shaped Recovery)
Table 362. Rest of World Thermal Enhanced Oil Recovery Market Forecast by End-Product, 2021-2031 (MBPD, AGR (%), CAGR(%))
Table 363. Rest of World Thermal Enhanced Oil Recovery Market Forecast by End-Product, 2021-2031 (MBPD, AGR (%), CAGR(%)) (V- Shaped Recovery)
Table 364. Rest of World Thermal Enhanced Oil Recovery Market Forecast by End-Product, 2021-2031 (MBPD, AGR (%), CAGR(%)) (W- Shaped Recovery)
Table 365. Rest of World Thermal Enhanced Oil Recovery Market Forecast by End-Product, 2021-2031 (MBPD, AGR (%), CAGR(%)) (U- Shaped Recovery)
Table 366. Rest of World Thermal Enhanced Oil Recovery Market Forecast by End-Product, 2021-2031 (MBPD, AGR (%), CAGR(%)) (L- Shaped Recovery)
Table 367. Rest of World Thermal Enhanced Oil Recovery Market by Technology, 2021-2031 (MBPD, AGR (%), CAGR(%))
Table 368. Rest of World Thermal Enhanced Oil Recovery Market by Technology, 2021-2031 (MBPD, AGR (%), CAGR(%)) (V- Shaped Recovery)
Table 369. Rest of World Thermal Enhanced Oil Recovery Market by Technology, 2021-2031 (MBPD, AGR (%), CAGR(%)) (W- Shaped Recovery)
Table 370. Rest of World Thermal Enhanced Oil Recovery Market by Technology, 2021-2031 (MBPD, AGR (%), CAGR(%)) (U- Shaped Recovery)
Table 371. Rest of World Thermal Enhanced Oil Recovery Market by Technology, 2021-2031 (MBPD, AGR (%), CAGR(%)) (L- Shaped Recovery)
Table 372. Rest of World Thermal Enhanced Oil Recovery Market by Method, 2021-2031 (MBPD, AGR (%), CAGR(%))
Table 373. Rest of World Thermal Enhanced Oil Recovery Market by Method, 2021-2031 (MBPD, AGR (%), CAGR(%)) (V- Shaped Recovery)
Table 374. Rest of World Thermal Enhanced Oil Recovery Market by Method, 2021-2031 (MBPD, AGR (%), CAGR(%)) (W- Shaped Recovery)
Table 375. Rest of World Thermal Enhanced Oil Recovery Market by Method, 2021-2031 (MBPD, AGR (%), CAGR(%)) (U- Shaped Recovery)
Table 376. Rest of World Thermal Enhanced Oil Recovery Market by Method, 2021-2031 (MBPD, AGR (%), CAGR(%)) (L- Shaped Recovery)
Table 377. Chevron Corporation.: Company Information
Table 378. Chevron Corporation.: Company Revenue 2016-2020(US$Mn, AGR %)
Table 379. Chevron Corporation.: Company Product and Service Benchmarking
Table 380. Chevron Corporation.: Company Recent Developments till Mar,2021
Table 381. Suncor Energy Inc : Company Information
Table 382. Suncor Energy Inc : Company Revenue 2016-2020(US$Mn, AGR %)
Table 383. Suncor Energy Inc : Company Product and Service Benchmarking
Table 384. Suncor Energy Inc : Company Recent Developments till Mar,2021
Table 385. BP Plc.: Company Information
Table 386. BP Plc.: Company Revenue 2016-2020(US$Mn, AGR %)
Table 387. BP Plc.: Company Recent Developments till Mar,2021
Table 388. Petróleos de Venezuela S.A.(PDVSA).: Company Information
Table 389. Petróleos de Venezuela S.A.(PDVSA) .: Company Product and Service Benchmarking
Table 390. Petróleos de Venezuela S.A.(PDVSA) .: Company Recent Developments till Apr,2021
Table 391. ConocoPhillips.: Company Information
Table 392. ConocoPhillips.: Company Revenue 2016-2020 (US$Mn, AGR %)
Table 393. ConocoPhillips.: Company Recent Developments till Feb,2021
Table 394. China Petroleum & Chemical Corporation.: Company Information
Table 395. China Petroleum & Chemical Corporation Company Revenue 2016-2020(US$Mn, AGR %)
Table 396. China Petroleum & Chemical Corporation Company Product and Service
Table 397.China Petroleum & Chemical Corporation Company Recent Developments till Feb,2021
Table 398. Exxon Mobil Corporation.: Company Information
Table 399. Exxon Mobil Corporation.: Company Revenue 2016-2020(US$Mn, AGR %)
Table 400. Exxon Mobil Corporation.: Company Product and Service Benchmarking
Table 401. Exxon Mobil Corporation.: Company Recent Developments till Feb,2021
Table 402. Royal Dutch Shell: Company Information
Table 403. Royal Dutch Shell: Company Revenue 2016-2020(US$Mn, AGR %)
Table 404. Royal Dutch Shell: Company Product and Service
Table 405. Royal Dutch Shell.: Company Recent Developments till Feb,2021
Table 406. Total SE.: Company Information
Table 407. Total SE.: Company Revenue 2016-2020 (US$Mn, AGR %)
Table 408. Total SE.: Company Product and Service Benchmarking
Table 409.Total SE.: Company Recent Developments till Mar,2021
Table 410.Petroleo Brasileiro S.A.: Company Information
Table 411. Petroleo Brasileiro S.A.: Company Revenue 2016-2020(US$Mn, AGR %)
Table 412. Petroleo Brasileiro S.A.: Company Product and Service
Table 413.Petroleo Brasileiro S.A Company Recent Developments till Apr,2021
Table 414.Imperial Oil Limited.: Company Information
Table 415. Imperial Oil Limited.: Company Revenue 2016-2020(US$Mn, AGR %)
Table 416. Imperial Oil Limited.: Company Product and Service Pipeline
Table 417. Imperial Oil Limited Company Recent Developments till Feb,2021
Table 418. Cenovus Energy Inc.: Company Information
Table 419. Cenovus Energy Inc.: Company Revenue 2016-2020 (US$Mn, AGR %)
Table 420. Cenovus Energy Inc .: Company Operation
Table 421.Cenovus Energy Inc .: Company Recent Developments till Mar,2021
Table 422.China Petroleum & Chemical Corporation .: Company Information
Table 423. China Petroleum & Chemical Corporation.: Company Revenue 2015-2019 (US$Mn, AGR %)
Table 424. China Petroleum & Chemical Corporation.: Company Product and Service
Table 425.China Petroleum & Chemical Corporation.: Company Recent Developments till Feb,2021
Table 426.Occidental Petroleum Corporation.: Company Information
Table 427. Occidental Petroleum Corporation.: Company Revenue 2016-2020(US$Mn, AGR %)
Table 428. Occidental Petroleum Corporation.: Company Product and Service
Table 429.Occidental Petroleum Corporation: Company Recent Developments till Feb,2021
Table 430.China National Offshore Oil Corporation (CNOOC).: Company Information
Table 431. China National Offshore Oil Corporation (CNOOC).: Company Revenue 2016-2020 (US$Mn, AGR %)
Table 432. China National Offshore Oil Corporation (CNOOC).: Company Product and Service
Table 433. China National Offshore Oil Corporation (CNOOC) Company Recent Developments till Apr,2021
Table 434. Kinder Morgan, Inc.: Company Information
Table 435. Kinder Morgan, Inc.: Company Revenue 2016-2020 (US$Mn, AGR %)
Table 436. Kinder Morgan, Inc.: Company Product and Service
Table 437.Kinder Morgan, Inc Company Recent Developments till Feb,2021
Table 438.Halliburton Company.: Company Information
Table 439. Halliburton Company.: Company Revenue 2016-2020 (US$Mn, AGR %)
Table 440. Halliburton Company.: Company Product and Service
Table 441.Halliburton Company Recent Developments till Feb,2021
Table 442.Equinor ASA.: Company Information
Table 443. Equinor ASA.: Company Revenue 2016-2020 (US$Mn, AGR %)
Table 444. Equinor ASA.: Company Product and Service
Table 445.Equinor ASA Company Recent Developments till Feb,2021
Table 446.Canadian Natural Resources Limited: Company Information
Table 447. Canadian Natural Resources Limited.: Company Revenue 2016-2020 (US$Mn, AGR %)
Table 448. Canadian Natural Resources Limited: Company Product and Service
Table 449.Canadian Natural Resources Limited Company Recent Developments till Feb,2021
Table 450.Ferus Pvt. Ltd..: Company Information
Table 451. Ferus Pvt. Ltd..: Company Product and Service
Table 452.Ferus Pvt. Ltd. Company Recent Developments till Feb,2021
List of Figures
Figure 1. Criteria and Alternatives of EOR Selection Problem
Figure 2. Global Thermal Enhanced Oil Recovery Market Forecast, 2021-2031 (USD Mn, AGR (%))
Figure 3. Global Thermal Enhanced Oil Recovery Market Segmentation
Figure 4. Oil Supply Chain and Distribution
Figure 5. Global Thermal Enhanced Oil Recovery Market Forecast, 2021-2031 (USD Mn, AGR (%))
Figure 6. Global Thermal Enhanced Oil Recovery Market Forecast, 2021-2031 (USD Mn, AGR (%)) (V- Shaped Recovery)
Figure 7. Global Thermal Enhanced Oil Recovery Market Forecast, 2021-2031 (USD Mn, AGR (%)) (W- Shaped Recovery)
Figure 8. Global Thermal Enhanced Oil Recovery Market Forecast, 2021-2031 (USD Mn, AGR (%)) (U- Shaped Recovery)
Figure 9. Global Thermal Enhanced Oil Recovery Market Forecast, 2021-2031 (USD Mn, AGR (%)) (L- Shaped Recovery)
Figure 10. Global Thermal Enhanced Oil Recovery Market Forecast, 2021-2031 (USD Mn, AGR (%))
Figure 11. Global Thermal Enhanced Oil Recovery Market Forecast, 2021-2031 (USD Mn, AGR (%)) (V- Shaped Recovery)
Figure 12. Global Thermal Enhanced Oil Recovery Market Forecast, 2021-2031 (USD Mn, AGR (%)) (W- Shaped Recovery)
Figure 13. Global Thermal Enhanced Oil Recovery Market Forecast, 2021-2031 (USD Mn, AGR (%)) (U- Shaped Recovery)
Figure 14. Global Thermal Enhanced Oil Recovery Market Forecast, 2021-2031 (USD Mn, AGR (%)) (L- Shaped Recovery)
Figure 15. Global Thermal Enhanced Oil Recovery Market Forecast by Production, 2021-2031 (MBPD, AGR (%))
Figure 16. Global Thermal Enhanced Oil Recovery Market Forecast by Production, 2021-2031 (MBPD, AGR (%)) (V- Shaped Recovery)
Figure 17. Global Thermal Enhanced Oil Recovery Market Forecast by Production, 2021-2031 (MBPD, AGR (%)) (W- Shaped Recovery)
Figure 18. Global Thermal Enhanced Oil Recovery Market Forecast by Production, 2021-2031 (MBPD, AGR (%)) (U- Shaped Recovery)
Figure 19. Global Thermal Enhanced Oil Recovery Market Forecast by Production, 2021-2031 (MBPD, AGR (%)) (L- Shaped Recovery)
Figure 20. Global Thermal Enhanced Oil Recovery Market Forecast by End-Product, 2021-2031 (MBPD, AGR (%))
Figure 21. Global Thermal Enhanced Oil Recovery Market Forecast by End-Product, 2021-2031 (MBPD, AGR (%)) (V- Shaped Recovery)
Figure 22. Global Thermal Enhanced Oil Recovery Market Forecast by End-Product, 2021-2031 (MBPD, AGR (%)) (W- Shaped Recovery)
Figure 23. Global Thermal Enhanced Oil Recovery Market Forecast by End-Product, 2021-2031 (MBPD, AGR (%)) (U- Shaped Recovery)
Figure 24. Global Thermal Enhanced Oil Recovery Market Forecast by End-Product, 2021-2031 (MBPD, AGR (%)) (L- Shaped Recovery)
Figure 25. Global Thermal Enhanced Oil Recovery Market by Technology, 2021-2031 (MBPD, AGR (%))
Figure 26. Global Thermal Enhanced Oil Recovery Market by Technology, 2021-2031 (MBPD, AGR (%)) (V- Shaped Recovery)
Figure 27. Global Thermal Enhanced Oil Recovery Market by Technology, 2021-2031 (MBPD, AGR (%)) (W- Shaped Recovery)
Figure 28. Global Thermal Enhanced Oil Recovery Market by Technology, 2021-2031 (MBPD, AGR (%)) (U- Shaped Recovery)
Figure 29. Global Thermal Enhanced Oil Recovery Market by Technology, 2021-2031 (MBPD, AGR (%)) (L- Shaped Recovery)
Figure 30. Global Thermal Enhanced Oil Recovery Market by Method, 2021-2031 (MBPD, AGR (%))
Figure 31. Global Thermal Enhanced Oil Recovery Market by Method, 2021-2031 (MBPD, AGR (%)) (V- Shaped Recovery)
Figure 32. Global Thermal Enhanced Oil Recovery Market by Method, 2021-2031 (MBPD, AGR (%)) (W- Shaped Recovery)
Figure 33. Global Thermal Enhanced Oil Recovery Market by Method, 2021-2031 (MBPD, AGR (%)) (U- Shaped Recovery)
Figure 34. Global Thermal Enhanced Oil Recovery Market by Method, 2021-2031 (MBPD, AGR (%)) (L- Shaped Recovery)
Figure 35. Global Thermal Enhanced Oil Recovery Market by Country, 2021-2031 (USD Mn, AGR (%))
Figure 36. Global Thermal Enhanced Oil Recovery Market by Country, 2021-2031 (USD Mn, AGR (%)) (V- Shaped Recovery)
Figure 37. Global Thermal Enhanced Oil Recovery Market by Country, 2021-2031 (USD Mn, AGR (%)) (W- Shaped Recovery)
Figure 38. Global Thermal Enhanced Oil Recovery Market by Country, 2021-2031 (USD Mn, AGR (%)) (U- Shaped Recovery)
Figure 39. Global Thermal Enhanced Oil Recovery Market by Country, 2021-2031 (USD Mn, AGR (%)) (L- Shaped Recovery)
Figure 40. Global Thermal Enhanced Oil Recovery Market by Country, 2021-2031 (USD Mn, AGR (%))
Figure 41. Global Thermal Enhanced Oil Recovery Market by Country, 2021-2031 (USD Mn, AGR (%)) (V- Shaped Recovery)
Figure 42. Global Thermal Enhanced Oil Recovery Market by Country, 2021-2031 (USD Mn, AGR (%)) (W- Shaped Recovery)
Figure 43. Global Thermal Enhanced Oil Recovery Market by Country, 2021-2031 (USD Mn, AGR (%)) (U- Shaped Recovery)
Figure 44. Global Thermal Enhanced Oil Recovery Market by Country, 2021-2031 (USD Mn, AGR (%)) (L- Shaped Recovery)
Figure 45. Canada Thermal Enhanced Oil Recovery Market Forecast, 2021-2031 (USD Mn, AGR (%))
Figure 46. Canada Thermal Enhanced Oil Recovery Market Forecast, 2021-2031 (USD Mn, AGR (%)) (V- Shaped Recovery)
Figure 47. Canada Thermal Enhanced Oil Recovery Market Forecast, 2021-2031 (USD Mn, AGR (%)) (W- Shaped Recovery)
Figure 48. Canada Thermal Enhanced Oil Recovery Market Forecast, 2021-2031 (USD Mn, AGR (%)) (U- Shaped Recovery)
Figure 49. Canada Thermal Enhanced Oil Recovery Market Forecast, 2021-2031 (USD Mn, AGR (%)) (L- Shaped Recovery)
Figure 50. Canada Thermal Enhanced Oil Recovery Market Forecast, 2021-2031 (USD Mn, AGR (%))
Figure 51. Canada Thermal Enhanced Oil Recovery Market Forecast, 2021-2031 (USD Mn, AGR (%)) (V- Shaped Recovery)
Figure 52. Canada Thermal Enhanced Oil Recovery Market Forecast, 2021-2031 (USD Mn, AGR (%)) (W- Shaped Recovery)
Figure 53. Canada Thermal Enhanced Oil Recovery Market Forecast, 2021-2031 (USD Mn, AGR (%)) (U- Shaped Recovery)
Figure 54. Canada Thermal Enhanced Oil Recovery Market Forecast, 2021-2031 (USD Mn, AGR (%)) (L- Shaped Recovery)
Figure 55. Canada Thermal Enhanced Oil Recovery Market Forecast by Production, 2021-2031 (MBPD, AGR (%))
Figure 56. Canada Thermal Enhanced Oil Recovery Market Forecast by Production, 2021-2031 (MBPD, AGR (%)) (V- Shaped Recovery)
Figure 57. Canada Thermal Enhanced Oil Recovery Market Forecast by Production, 2021-2031 (MBPD, AGR (%)) (W- Shaped Recovery)
Figure 58. Canada Thermal Enhanced Oil Recovery Market Forecast by Production, 2021-2031 (MBPD, AGR (%)) (U- Shaped Recovery)
Figure 59. Canada Thermal Enhanced Oil Recovery Market Forecast by Production, 2021-2031 (MBPD, AGR (%)) (L- Shaped Recovery)
Figure 60. Canada Thermal Enhanced Oil Recovery Market Forecast by End-Product, 2021-2031 (MBPD, AGR (%))
Figure 61. Canada Thermal Enhanced Oil Recovery Market Forecast by End-Product, 2021-2031 (MBPD, AGR (%)) (V- Shaped Recovery)
Figure 62. Canada Thermal Enhanced Oil Recovery Market Forecast by End-Product, 2021-2031 (MBPD, AGR (%)) (W- Shaped Recovery)
Figure 63. Canada Thermal Enhanced Oil Recovery Market Forecast by End-Product, 2021-2031 (MBPD, AGR (%)) (U- Shaped Recovery)
Figure 64. Canada Thermal Enhanced Oil Recovery Market Forecast by End-Product, 2021-2031 (MBPD, AGR (%)) (L- Shaped Recovery)
Figure 65. Canada Thermal Enhanced Oil Recovery Market by Technology, 2021-2031 (MBPD, AGR (%))
Figure 66. Canada Thermal Enhanced Oil Recovery Market by Technology, 2021-2031 (MBPD, AGR (%)) (V- Shaped Recovery)
Figure 67. Canada Thermal Enhanced Oil Recovery Market by Technology, 2021-2031 (MBPD, AGR (%)) (W- Shaped Recovery)
Figure 68. Canada Thermal Enhanced Oil Recovery Market by Technology, 2021-2031 (MBPD, AGR (%)) (U- Shaped Recovery)
Figure 69. Canada Thermal Enhanced Oil Recovery Market by Technology, 2021-2031 (MBPD, AGR (%)) (L- Shaped Recovery)
Figure 70. Canada Thermal Enhanced Oil Recovery Market by Method, 2021-2031 (MBPD, AGR (%))
Figure 71. Canada Thermal Enhanced Oil Recovery Market by Method, 2021-2031 (MBPD, AGR (%)) (V- Shaped Recovery)
Figure 72. Canada Thermal Enhanced Oil Recovery Market by Method, 2021-2031 (MBPD, AGR (%)) (W- Shaped Recovery)
Figure 73. Canada Thermal Enhanced Oil Recovery Market by Method, 2021-2031 (MBPD, AGR (%)) (U- Shaped Recovery)
Figure 74. Canada Thermal Enhanced Oil Recovery Market by Method, 2021-2031 (MBPD, AGR (%)) (L- Shaped Recovery)
Figure 75. US Thermal Enhanced Oil Recovery Market Forecast, 2021-2031 (USD Mn, AGR (%))
Figure 76. US Thermal Enhanced Oil Recovery Market Forecast, 2021-2031 (USD Mn, AGR (%)) (V- Shaped Recovery)
Figure 77. US Thermal Enhanced Oil Recovery Market Forecast, 2021-2031 (USD Mn, AGR (%)) (W- Shaped Recovery)
Figure 78. US Thermal Enhanced Oil Recovery Market Forecast, 2021-2031 (USD Mn, AGR (%)) (U- Shaped Recovery)
Figure 79. US Thermal Enhanced Oil Recovery Market Forecast, 2021-2031 (USD Mn, AGR (%)) (L- Shaped Recovery)
Figure 80. US Thermal Enhanced Oil Recovery Market Forecast, 2021-2031 (USD Mn, AGR (%))
Figure 81. US Thermal Enhanced Oil Recovery Market Forecast, 2021-2031 (USD Mn, AGR (%)) (V- Shaped Recovery)
Figure 82. US Thermal Enhanced Oil Recovery Market Forecast, 2021-2031 (USD Mn, AGR (%)) (W- Shaped Recovery)
Figure 83. US Thermal Enhanced Oil Recovery Market Forecast, 2021-2031 (USD Mn, AGR (%)) (U- Shaped Recovery)
Figure 84. US Thermal Enhanced Oil Recovery Market Forecast, 2021-2031 (USD Mn, AGR (%)) (L- Shaped Recovery)
Figure 85. US Thermal Enhanced Oil Recovery Market Forecast by Production, 2021-2031 (MBPD, AGR (%))
Figure 86. US Thermal Enhanced Oil Recovery Market Forecast by Production, 2021-2031 (MBPD, AGR (%)) (V- Shaped Recovery)
Figure 87. US Thermal Enhanced Oil Recovery Market Forecast by Production, 2021-2031 (MBPD, AGR (%)) (W- Shaped Recovery)
Figure 88. US Thermal Enhanced Oil Recovery Market Forecast by Production, 2021-2031 (MBPD, AGR (%)) (U- Shaped Recovery)
Figure 89. US Thermal Enhanced Oil Recovery Market Forecast by Production, 2021-2031 (MBPD, AGR (%)) (L- Shaped Recovery)
Figure 90. US Thermal Enhanced Oil Recovery Market Forecast by End-Product, 2021-2031 (MBPD, AGR (%))
Figure 91. US Thermal Enhanced Oil Recovery Market Forecast by End-Product, 2021-2031 (MBPD, AGR (%)) (V- Shaped Recovery)
Figure 92. US Thermal Enhanced Oil Recovery Market Forecast by End-Product, 2021-2031 (MBPD, AGR (%)) (W- Shaped Recovery)
Figure 93. US Thermal Enhanced Oil Recovery Market Forecast by End-Product, 2021-2031 (MBPD, AGR (%)) (U- Shaped Recovery)
Figure 94. US Thermal Enhanced Oil Recovery Market Forecast by End-Product, 2021-2031 (MBPD, AGR (%)) (L- Shaped Recovery)
Figure 95. US Thermal Enhanced Oil Recovery Market by Technology, 2021-2031 (MBPD, AGR (%))
Figure 96. US Thermal Enhanced Oil Recovery Market by Technology, 2021-2031 (MBPD, AGR (%)) (V- Shaped Recovery)
Figure 97. US Thermal Enhanced Oil Recovery Market by Technology, 2021-2031 (MBPD, AGR (%)) (W- Shaped Recovery)
Figure 98. US Thermal Enhanced Oil Recovery Market by Technology, 2021-2031 (MBPD, AGR (%)) (U- Shaped Recovery)
Figure 99. US Thermal Enhanced Oil Recovery Market by Technology, 2021-2031 (MBPD, AGR (%)) (L- Shaped Recovery)
Figure 100. US Thermal Enhanced Oil Recovery Market by Method, 2021-2031 (MBPD, AGR (%))
Figure 101. US Thermal Enhanced Oil Recovery Market by Method, 2021-2031 (MBPD, AGR (%)) (V- Shaped Recovery)
Figure 102. US Thermal Enhanced Oil Recovery Market by Method, 2021-2031 (MBPD, AGR (%)) (W- Shaped Recovery)
Figure 103. US Thermal Enhanced Oil Recovery Market by Method, 2021-2031 (MBPD, AGR (%)) (U- Shaped Recovery)
Figure 104. US Thermal Enhanced Oil Recovery Market by Method, 2021-2031 (MBPD, AGR (%)) (L- Shaped Recovery)
Figure 105. Venezuela Thermal Enhanced Oil Recovery Market Forecast, 2021-2031 (USD Mn, AGR (%))
Figure 106. Venezuela Thermal Enhanced Oil Recovery Market Forecast, 2021-2031 (USD Mn, AGR (%)) (V- Shaped Recovery)
Figure 107. Venezuela Thermal Enhanced Oil Recovery Market Forecast, 2021-2031 (USD Mn, AGR (%)) (W- Shaped Recovery)
Figure 108. Venezuela Thermal Enhanced Oil Recovery Market Forecast, 2021-2031 (USD Mn, AGR (%)) (U- Shaped Recovery)
Figure 109. Venezuela Thermal Enhanced Oil Recovery Market Forecast, 2021-2031 (USD Mn, AGR (%)) (L- Shaped Recovery)
Figure 110. Venezuela Thermal Enhanced Oil Recovery Market Forecast, 2021-2031 (USD Mn, AGR (%), CAGR(%))
Figure 111. Venezuela Thermal Enhanced Oil Recovery Market Forecast, 2021-2031 (USD Mn, AGR (%), CAGR(%)) (V- Shaped Recovery)
Figure 112. Venezuela Thermal Enhanced Oil Recovery Market Forecast, 2021-2031 (USD Mn, AGR (%), CAGR(%)) (W- Shaped Recovery)
Figure 113. Venezuela Thermal Enhanced Oil Recovery Market Forecast, 2021-2031 (USD Mn, AGR (%), CAGR(%)) (U- Shaped Recovery)
Figure 114. Venezuela Thermal Enhanced Oil Recovery Market Forecast, 2021-2031 (USD Mn, AGR (%), CAGR(%)) (L- Shaped Recovery)
Figure 115. Venezuela Thermal Enhanced Oil Recovery Market Forecast by Production, 2021-2031 (MBPD, AGR (%))
Figure 116. Venezuela Thermal Enhanced Oil Recovery Market Forecast by Production, 2021-2031 (MBPD, AGR (%)) (V- Shaped Recovery)
Figure 117. Venezuela Thermal Enhanced Oil Recovery Market Forecast by Production, 2021-2031 (MBPD, AGR (%)) (W- Shaped Recovery)
Figure 118. Venezuela Thermal Enhanced Oil Recovery Market Forecast by Production, 2021-2031 (MBPD, AGR (%)) (U- Shaped Recovery)
Figure 119. Venezuela Thermal Enhanced Oil Recovery Market Forecast by Production, 2021-2031 (MBPD, AGR (%)) (L- Shaped Recovery)
Figure 120. Venezuela Thermal Enhanced Oil Recovery Market Forecast by End-Product, 2021-2031 (MBPD, AGR (%))
Figure 121. Venezuela Thermal Enhanced Oil Recovery Market Forecast by End-Product, 2021-2031 (MBPD, AGR (%)) (V- Shaped Recovery)
Figure 122. Venezuela Thermal Enhanced Oil Recovery Market Forecast by End-Product, 2021-2031 (MBPD, AGR (%)) (W- Shaped Recovery)
Figure 123. Venezuela Thermal Enhanced Oil Recovery Market Forecast by End-Product, 2021-2031 (MBPD, AGR (%)) (U- Shaped Recovery)
Figure 124. Venezuela Thermal Enhanced Oil Recovery Market Forecast by End-Product, 2021-2031 (MBPD, AGR (%)) (L- Shaped Recovery)
Figure 125. Venezuela Thermal Enhanced Oil Recovery Market by Technology, 2021-2031 (MBPD, AGR (%))
Figure 126. Venezuela Thermal Enhanced Oil Recovery Market by Technology, 2021-2031 (MBPD, AGR (%)) (V- Shaped Recovery)
Figure 127. Venezuela Thermal Enhanced Oil Recovery Market by Technology, 2021-2031 (MBPD, AGR (%)) (W- Shaped Recovery)
Figure 128. Venezuela Thermal Enhanced Oil Recovery Market by Technology, 2021-2031 (MBPD, AGR (%)) (U- Shaped Recovery)
Figure 129. Venezuela Thermal Enhanced Oil Recovery Market by Technology, 2021-2031 (MBPD, AGR (%)) (L- Shaped Recovery)
Figure 130. Venezuela Thermal Enhanced Oil Recovery Market by Method, 2021-2031 (MBPD, AGR (%))
Figure 131. Venezuela Thermal Enhanced Oil Recovery Market by Method, 2021-2031 (MBPD, AGR (%)) (V- Shaped Recovery)
Figure 132. Venezuela Thermal Enhanced Oil Recovery Market by Method, 2021-2031 (MBPD, AGR (%)) (W- Shaped Recovery)
Figure 133. Venezuela Thermal Enhanced Oil Recovery Market by Method, 2021-2031 (MBPD, AGR (%)) (U- Shaped Recovery)
Figure 134. Venezuela Thermal Enhanced Oil Recovery Market by Method, 2021-2031 (MBPD, AGR (%)) (L- Shaped Recovery)
Figure 135. Indonesia Thermal Enhanced Oil Recovery Market Forecast, 2021-2031 (USD Mn, AGR (%))
Figure 136. Indonesia Thermal Enhanced Oil Recovery Market Forecast, 2021-2031 (USD Mn, AGR (%)) (V- Shaped Recovery)
Figure 137. Indonesia Thermal Enhanced Oil Recovery Market Forecast, 2021-2031 (USD Mn, AGR (%)) (W- Shaped Recovery)
Figure 138. Indonesia Thermal Enhanced Oil Recovery Market Forecast, 2021-2031 (USD Mn, AGR (%)) (U- Shaped Recovery)
Figure 139. Indonesia Thermal Enhanced Oil Recovery Market Forecast, 2021-2031 (USD Mn, AGR (%)) (L- Shaped Recovery)
Figure 140. Indonesia Thermal Enhanced Oil Recovery Market Forecast, 2021-2031 (USD Mn, AGR (%))
Figure 141. Indonesia Thermal Enhanced Oil Recovery Market Forecast, 2021-2031 (USD Mn, AGR (%)) (V- Shaped Recovery)
Figure 142. Indonesia Thermal Enhanced Oil Recovery Market Forecast, 2021-2031 (USD Mn, AGR (%)) (W- Shaped Recovery)
Figure 143. Indonesia Thermal Enhanced Oil Recovery Market Forecast, 2021-2031 (USD Mn, AGR (%)) (U- Shaped Recovery)
Figure 144. Indonesia Thermal Enhanced Oil Recovery Market Forecast, 2021-2031 (USD Mn, AGR (%)) (L- Shaped Recovery)
Figure 145. Indonesia Thermal Enhanced Oil Recovery Market Forecast by Production, 2021-2031 (MBPD, AGR (%))
Figure 146. Indonesia Thermal Enhanced Oil Recovery Market Forecast by Production, 2021-2031 (MBPD, AGR (%)) (V- Shaped Recovery)
Figure 147. Indonesia Thermal Enhanced Oil Recovery Market Forecast by Production, 2021-2031 (MBPD, AGR (%)) (W- Shaped Recovery)
Figure 148. Indonesia Thermal Enhanced Oil Recovery Market Forecast by Production, 2021-2031 (MBPD, AGR (%)) (U- Shaped Recovery)
Figure 149. Indonesia Thermal Enhanced Oil Recovery Market Forecast by Production, 2021-2031 (MBPD, AGR (%)) (L- Shaped Recovery)
Figure 150. Indonesia Thermal Enhanced Oil Recovery Market Forecast by End-Product, 2021-2031 (MBPD, AGR (%))
Figure 151. Indonesia Thermal Enhanced Oil Recovery Market Forecast by End-Product, 2021-2031 (MBPD, AGR (%)) (V- Shaped Recovery)
Figure 152. Indonesia Thermal Enhanced Oil Recovery Market Forecast by End-Product, 2021-2031 (MBPD, AGR (%)) (W- Shaped Recovery)
Figure 153. Indonesia Thermal Enhanced Oil Recovery Market Forecast by End-Product, 2021-2031 (MBPD, AGR (%)) (U- Shaped Recovery)
Figure 154. Indonesia Thermal Enhanced Oil Recovery Market Forecast by End-Product, 2021-2031 (MBPD, AGR (%)) (L- Shaped Recovery)
Figure 155. Indonesia Thermal Enhanced Oil Recovery Market by Technology, 2021-2031 (MBPD, AGR (%))
Figure 156. Indonesia Thermal Enhanced Oil Recovery Market by Technology, 2021-2031 (MBPD, AGR (%)) (V- Shaped Recovery)
Figure 157. Indonesia Thermal Enhanced Oil Recovery Market by Technology, 2021-2031 (MBPD, AGR (%)) (W- Shaped Recovery)
Figure 158. Indonesia Thermal Enhanced Oil Recovery Market by Technology, 2021-2031 (MBPD, AGR (%)) (U- Shaped Recovery)
Figure 159. Indonesia Thermal Enhanced Oil Recovery Market by Technology, 2021-2031 (MBPD, AGR (%)) (L- Shaped Recovery)
Figure 160. Indonesia Thermal Enhanced Oil Recovery Market by Method, 2021-2031 (MBPD, AGR (%))
Figure 161. Indonesia Thermal Enhanced Oil Recovery Market by Method, 2021-2031 (MBPD, AGR (%)) (V- Shaped Recovery)
Figure 162. Indonesia Thermal Enhanced Oil Recovery Market by Method, 2021-2031 (MBPD, AGR (%)) (W- Shaped Recovery)
Figure 163. Indonesia Thermal Enhanced Oil Recovery Market by Method, 2021-2031 (MBPD, AGR (%)) (U- Shaped Recovery)
Figure 164. Indonesia Thermal Enhanced Oil Recovery Market by Method, 2021-2031 (MBPD, AGR (%)) (L- Shaped Recovery)
Figure 165. Kuwait Thermal Enhanced Oil Recovery Market Forecast, 2021-2031 (USD Mn, AGR (%))
Figure 166. Kuwait Thermal Enhanced Oil Recovery Market Forecast, 2021-2031 (USD Mn, AGR (%)) (V- Shaped Recovery)
Figure 167. Kuwait Thermal Enhanced Oil Recovery Market Forecast, 2021-2031 (USD Mn, AGR (%)) (W- Shaped Recovery)
Figure 168. Kuwait Thermal Enhanced Oil Recovery Market Forecast, 2021-2031 (USD Mn, AGR (%)) (U- Shaped Recovery)
Figure 169. Kuwait Thermal Enhanced Oil Recovery Market Forecast, 2021-2031 (USD Mn, AGR (%)) (L- Shaped Recovery)
Figure 170. Kuwait Thermal Enhanced Oil Recovery Market Forecast, 2021-2031 (USD Mn, AGR (%))
Figure 171. Kuwait Thermal Enhanced Oil Recovery Market Forecast, 2021-2031 (USD Mn, AGR (%)) (V- Shaped Recovery)
Figure 172. Kuwait Thermal Enhanced Oil Recovery Market Forecast, 2021-2031 (USD Mn, AGR (%)) (W- Shaped Recovery)
Figure 173. Kuwait Thermal Enhanced Oil Recovery Market Forecast, 2021-2031 (USD Mn, AGR (%)) (U- Shaped Recovery)
Figure 174. Kuwait Thermal Enhanced Oil Recovery Market Forecast, 2021-2031 (USD Mn, AGR (%)) (L- Shaped Recovery)
Figure 175. Kuwait Thermal Enhanced Oil Recovery Market Forecast by Production, 2021-2031 (MBPD, AGR (%))
Figure 176. Kuwait Thermal Enhanced Oil Recovery Market Forecast by Production, 2021-2031 (MBPD, AGR (%)) (V- Shaped Recovery)
Figure 177. Kuwait Thermal Enhanced Oil Recovery Market Forecast by Production, 2021-2031 (MBPD, AGR (%)) (W- Shaped Recovery)
Figure 178. Kuwait Thermal Enhanced Oil Recovery Market Forecast by Production, 2021-2031 (MBPD, AGR (%)) (U- Shaped Recovery)
Figure 179. Kuwait Thermal Enhanced Oil Recovery Market Forecast by Production, 2021-2031 (MBPD, AGR (%)) (L- Shaped Recovery)
Figure 180. Kuwait Thermal Enhanced Oil Recovery Market Forecast by End-Product, 2021-2031 (MBPD, AGR (%))
Figure 181. Kuwait Thermal Enhanced Oil Recovery Market Forecast by End-Product, 2021-2031 (MBPD, AGR (%)) (V- Shaped Recovery)
Figure 182. Kuwait Thermal Enhanced Oil Recovery Market Forecast by End-Product, 2021-2031 (MBPD, AGR (%)) (W- Shaped Recovery)
Figure 183. Kuwait Thermal Enhanced Oil Recovery Market Forecast by End-Product, 2021-2031 (MBPD, AGR (%)) (U- Shaped Recovery)
Figure 184. Kuwait Thermal Enhanced Oil Recovery Market Forecast by End-Product, 2021-2031 (MBPD, AGR (%)) (L- Shaped Recovery)
Figure 185. Kuwait Thermal Enhanced Oil Recovery Market by Technology, 2021-2031 (MBPD, AGR (%))
Figure 186. Kuwait Thermal Enhanced Oil Recovery Market by Technology, 2021-2031 (MBPD, AGR (%))(V-Shaped Recovery)-
Figure 187. Kuwait Thermal Enhanced Oil Recovery Market by Technology, 2021-2031 (MBPD, AGR (%))(W-Shaped Recovery)
Figure 188. Kuwait Thermal Enhanced Oil Recovery Market by Technology, 2021-2031 (MBPD, AGR (%))(U-Shaped Recovery)
Figure 189. Kuwait Thermal Enhanced Oil Recovery Market by Technology, 2021-2031 (MBPD, AGR (%))(L-Shaped Recovery)
Figure 190. Kuwait Thermal Enhanced Oil Recovery Market by Method, 2021-2031 (MBPD, AGR (%))
Figure 191. Kuwait Thermal Enhanced Oil Recovery Market by Method, 2021-2031 (MBPD, AGR (%)) (V- Shaped Recovery)
Figure 192. Kuwait Thermal Enhanced Oil Recovery Market by Method, 2021-2031 (MBPD, AGR (%)) (W- Shaped Recovery)
Figure 193. Kuwait Thermal Enhanced Oil Recovery Market by Method, 2021-2031 (MBPD, AGR (%)) (U- Shaped Recovery)
Figure 194. Kuwait Thermal Enhanced Oil Recovery Market by Method, 2021-2031 (MBPD, AGR (%)) (L- Shaped Recovery)
Figure 195. Oman Thermal Enhanced Oil Recovery Market Forecast, 2021-2031 (USD Mn, AGR (%))
Figure 196. Oman Thermal Enhanced Oil Recovery Market Forecast, 2021-2031 (USD Mn, AGR (%)) (V- Shaped Recovery)
Figure 197. Oman Thermal Enhanced Oil Recovery Market Forecast, 2021-2031 (USD Mn, AGR (%)) (W- Shaped Recovery)
Figure 198. Oman Thermal Enhanced Oil Recovery Market Forecast, 2021-2031 (USD Mn, AGR (%)) (U- Shaped Recovery)
Figure 199. Oman Thermal Enhanced Oil Recovery Market Forecast, 2021-2031 (USD Mn, AGR (%)) (L- Shaped Recovery)
Figure 200. Oman Thermal Enhanced Oil Recovery Market Forecast, 2021-2031 (USD Mn, AGR (%))
Figure 201. Oman Thermal Enhanced Oil Recovery Market Forecast, 2021-2031 (USD Mn, AGR (%)) (V- Shaped Recovery)
Figure 202. Oman Thermal Enhanced Oil Recovery Market Forecast, 2021-2031 (USD Mn, AGR (%)) (W- Shaped Recovery)
Figure 203. Oman Thermal Enhanced Oil Recovery Market Forecast, 2021-2031 (USD Mn, AGR (%)) (U- Shaped Recovery)
Figure 204. Oman Thermal Enhanced Oil Recovery Market Forecast, 2021-2031 (USD Mn, AGR (%)) (L- Shaped Recovery)
Figure 205. Oman Thermal Enhanced Oil Recovery Market Forecast by Production, 2021-2031 (MBPD, AGR (%))
Figure 206. Oman Thermal Enhanced Oil Recovery Market Forecast by Production, 2021-2031 (MBPD, AGR (%)) (V- Shaped Recovery)
Figure 207. Oman Thermal Enhanced Oil Recovery Market Forecast by Production, 2021-2031 (MBPD, AGR (%)) (W- Shaped Recovery)
Figure 208. Oman Thermal Enhanced Oil Recovery Market Forecast by Production, 2021-2031 (MBPD, AGR (%)) (U- Shaped Recovery)
Figure 209. Oman Thermal Enhanced Oil Recovery Market Forecast by Production, 2021-2031 (MBPD, AGR (%)) (L- Shaped Recovery)
Figure 210. Oman Thermal Enhanced Oil Recovery Market Forecast by End-Product, 2021-2031 (MBPD, AGR (%))
Figure 211. Oman Thermal Enhanced Oil Recovery Market Forecast by End-Product, 2021-2031 (MBPD, AGR (%)) (V- Shaped Recovery)
Figure 212. Oman Thermal Enhanced Oil Recovery Market Forecast by End-Product, 2021-2031 (MBPD, AGR (%)) (W- Shaped Recovery)
Figure 213. Oman Thermal Enhanced Oil Recovery Market Forecast by End-Product, 2021-2031 (MBPD, AGR (%)) (U- Shaped Recovery)
Figure 214. Oman Thermal Enhanced Oil Recovery Market Forecast by End-Product, 2021-2031 (MBPD, AGR (%)) (L- Shaped Recovery)
Figure 215. Oman Thermal Enhanced Oil Recovery Market by Technology, 2021-2031 (MBPD, AGR (%))
Figure 216. Oman Thermal Enhanced Oil Recovery Market by Technology, 2021-2031 (MBPD, AGR (%)) (V- Shaped Recovery)
Figure 217. Oman Thermal Enhanced Oil Recovery Market by Technology, 2021-2031 (MBPD, AGR (%)) (W- Shaped Recovery)
Figure 218. Oman Thermal Enhanced Oil Recovery Market by Technology, 2021-2031 (MBPD, AGR (%)) (U- Shaped Recovery)
Figure 219. Oman Thermal Enhanced Oil Recovery Market by Technology, 2021-2031 (MBPD, AGR (%)) (L- Shaped Recovery)
Figure 220. Oman Thermal Enhanced Oil Recovery Market by Method, 2021-2031 (MBPD, AGR (%))
Figure 221. Oman Thermal Enhanced Oil Recovery Market by Method, 2021-2031 (MBPD, AGR (%)) (V- Shaped Recovery)
Figure 222. Oman Thermal Enhanced Oil Recovery Market by Method, 2021-2031 (MBPD, AGR (%)) (W- Shaped Recovery)
Figure 223. Oman Thermal Enhanced Oil Recovery Market by Method, 2021-2031 (MBPD, AGR (%)) (U- Shaped Recovery)
Figure 224. Oman Thermal Enhanced Oil Recovery Market by Method, 2021-2031 (MBPD, AGR (%)) (L- Shaped Recovery)
Figure 225. China Thermal Enhanced Oil Recovery Market Forecast, 2021-2031 (USD Mn, AGR (%))
Figure 226. China Thermal Enhanced Oil Recovery Market Forecast, 2021-2031 (USD Mn, AGR (%)) (V- Shaped Recovery)
Figure 227. China Thermal Enhanced Oil Recovery Market Forecast, 2021-2031 (USD Mn, AGR (%)) (W- Shaped Recovery)
Figure 228. China Thermal Enhanced Oil Recovery Market Forecast, 2021-2031 (USD Mn, AGR (%)) (U- Shaped Recovery)
Figure 229. China Thermal Enhanced Oil Recovery Market Forecast, 2021-2031 (USD Mn, AGR (%)) (L- Shaped Recovery)
Figure 230. China Thermal Enhanced Oil Recovery Market Forecast, 2021-2031 (USD Mn, AGR (%))
Figure 231. China Thermal Enhanced Oil Recovery Market Forecast, 2021-2031 (USD Mn, AGR (%)) (V- Shaped Recovery)
Figure 232. China Thermal Enhanced Oil Recovery Market Forecast, 2021-2031 (USD Mn, AGR (%)) (W- Shaped Recovery)
Figure 233. China Thermal Enhanced Oil Recovery Market Forecast, 2021-2031 (USD Mn, AGR (%)) (U- Shaped Recovery)
Figure 234. China Thermal Enhanced Oil Recovery Market Forecast, 2021-2031 (USD Mn, AGR (%)) (L- Shaped Recovery)
Figure 235. China Thermal Enhanced Oil Recovery Market Forecast by Production, 2021-2031 (MBPD, AGR (%))
Figure 236. China Thermal Enhanced Oil Recovery Market Forecast by Production, 2021-2031 (MBPD, AGR (%)) (V- Shaped Recovery)
Figure 237. China Thermal Enhanced Oil Recovery Market Forecast by Production, 2021-2031 (MBPD, AGR (%)) (W- Shaped Recovery)
Figure 238. China Thermal Enhanced Oil Recovery Market Forecast by Production, 2021-2031 (MBPD, AGR (%)) (U- Shaped Recovery)
Figure 239. China Thermal Enhanced Oil Recovery Market Forecast by Production, 2021-2031 (MBPD, AGR (%)) (L- Shaped Recovery)
Figure 240. China Thermal Enhanced Oil Recovery Market Forecast by End-Product, 2021-2031 (MBPD, AGR (%))
Figure 241. China Thermal Enhanced Oil Recovery Market Forecast by End-Product, 2021-2031 (MBPD, AGR (%)) (V- Shaped Recovery)
Figure 242. China Thermal Enhanced Oil Recovery Market Forecast by End-Product, 2021-2031 (MBPD, AGR (%)) (W- Shaped Recovery)
Figure 243. China Thermal Enhanced Oil Recovery Market Forecast by End-Product, 2021-2031 (MBPD, AGR (%)) (U- Shaped Recovery)
Figure 244. China Thermal Enhanced Oil Recovery Market Forecast by End-Product, 2021-2031 (MBPD, AGR (%)) (L- Shaped Recovery)
Figure 245. China Thermal Enhanced Oil Recovery Market by Technology, 2021-2031 (MBPD, AGR (%))
Figure 246. China Thermal Enhanced Oil Recovery Market by Technology, 2021-2031 (MBPD, AGR (%)) (V- Shaped Recovery)
Figure 247. China Thermal Enhanced Oil Recovery Market by Technology, 2021-2031 (MBPD, AGR (%)) (W- Shaped Recovery)
Figure 248. China Thermal Enhanced Oil Recovery Market by Technology, 2021-2031 (MBPD, AGR (%)) (U- Shaped Recovery)
Figure 249. China Thermal Enhanced Oil Recovery Market by Technology, 2021-2031 (MBPD, AGR (%)) (L- Shaped Recovery)
Figure 250. China Thermal Enhanced Oil Recovery Market by Method, 2021-2031 (MBPD, AGR (%))
Figure 251. China Thermal Enhanced Oil Recovery Market by Method, 2021-2031 (MBPD, AGR (%)) (V- Shaped Recovery)
Figure 252. China Thermal Enhanced Oil Recovery Market by Method, 2021-2031 (MBPD, AGR (%)) (W- Shaped Recovery)
Figure 253. China Thermal Enhanced Oil Recovery Market by Method, 2021-2031 (MBPD, AGR (%)) (U- Shaped Recovery)
Figure 254. China Thermal Enhanced Oil Recovery Market by Method, 2021-2031 (MBPD, AGR (%)) (L- Shaped Recovery)
Figure 255. Russia Thermal Enhanced Oil Recovery Market Forecast, 2021-2031 (USD Mn, AGR (%))
Figure 256. Russia Thermal Enhanced Oil Recovery Market Forecast, 2021-2031 (USD Mn, AGR (%)) (V- Shaped Recovery)
Figure 257. Russia Thermal Enhanced Oil Recovery Market Forecast, 2021-2031 (USD Mn, AGR (%)) (W- Shaped Recovery)
Figure 258. Russia Thermal Enhanced Oil Recovery Market Forecast, 2021-2031 (USD Mn, AGR (%)) (U- Shaped Recovery)
Figure 259. Russia Thermal Enhanced Oil Recovery Market Forecast, 2021-2031 (USD Mn, AGR (%)) (L- Shaped Recovery)
Figure 260. Russia Thermal Enhanced Oil Recovery Market Forecast, 2021-2031 (USD Mn, AGR (%))
Figure 261. Russia Thermal Enhanced Oil Recovery Market Forecast, 2021-2031 (USD Mn, AGR (%)) (V- Shaped Recovery)
Figure 262. Russia Thermal Enhanced Oil Recovery Market Forecast, 2021-2031 (USD Mn, AGR (%)) (W- Shaped Recovery)
Figure 263. Russia Thermal Enhanced Oil Recovery Market Forecast, 2021-2031 (USD Mn, AGR (%)) (U- Shaped Recovery)
Figure 264. Russia Thermal Enhanced Oil Recovery Market Forecast, 2021-2031 (USD Mn, AGR (%)) (L- Shaped Recovery)
Figure 265. Russia Thermal Enhanced Oil Recovery Market Forecast by Production, 2021-2031 (MBPD, AGR (%))
Figure 266. Russia Thermal Enhanced Oil Recovery Market Forecast by Production, 2021-2031 (MBPD, AGR (%)) (V- Shaped Recovery)
Figure 267. Russia Thermal Enhanced Oil Recovery Market Forecast by Production, 2021-2031 (MBPD, AGR (%)) (W- Shaped Recovery)
Figure 268. Russia Thermal Enhanced Oil Recovery Market Forecast by Production, 2021-2031 (MBPD, AGR (%)) (U- Shaped Recovery)
Figure 269. Russia Thermal Enhanced Oil Recovery Market Forecast by Production, 2021-2031 (MBPD, AGR (%)) (L- Shaped Recovery)
Figure 270. Russia Thermal Enhanced Oil Recovery Market Forecast by End-Product, 2021-2031 (MBPD, AGR (%))
Figure 271. Russia Thermal Enhanced Oil Recovery Market Forecast by End-Product, 2021-2031 (MBPD, AGR (%)) (V- Shaped Recovery)
Figure 272. Russia Thermal Enhanced Oil Recovery Market Forecast by End-Product, 2021-2031 (MBPD, AGR (%)) (W- Shaped Recovery)
Figure 273. Russia Thermal Enhanced Oil Recovery Market Forecast by End-Product, 2021-2031 (MBPD, AGR (%)) (U- Shaped Recovery)
Figure 274. Russia Thermal Enhanced Oil Recovery Market Forecast by End-Product, 2021-2031 (MBPD, AGR (%)) (L- Shaped Recovery)
Figure 275. Russia Thermal Enhanced Oil Recovery Market by Technology, 2021-2031 (MBPD, AGR (%))
Figure 276. Russia Thermal Enhanced Oil Recovery Market by Technology, 2021-2031 (MBPD, AGR (%)) (V- Shaped Recovery)
Figure 277. Russia Thermal Enhanced Oil Recovery Market by Technology, 2021-2031 (MBPD, AGR (%)) (W- Shaped Recovery)
Figure 278. Russia Thermal Enhanced Oil Recovery Market by Technology, 2021-2031 (MBPD, AGR (%)) (U- Shaped Recovery)
Figure 279. Russia Thermal Enhanced Oil Recovery Market by Technology, 2021-2031 (MBPD, AGR (%)) (L- Shaped Recovery)
Figure 280. Russia Thermal Enhanced Oil Recovery Market by Method, 2021-2031 (MBPD, AGR (%))
Figure 281. Russia Thermal Enhanced Oil Recovery Market by Method, 2021-2031 (MBPD, AGR (%)) (V- Shaped Recovery)
Figure 282. Russia Thermal Enhanced Oil Recovery Market by Method, 2021-2031 (MBPD, AGR (%)) (W- Shaped Recovery)
Figure 283. Russia Thermal Enhanced Oil Recovery Market by Method, 2021-2031 (MBPD, AGR (%)) (U- Shaped Recovery)
Figure 284. Russia Thermal Enhanced Oil Recovery Market by Method, 2021-2031 (MBPD, AGR (%)) (L- Shaped Recovery)
Figure 285. Bahrain Thermal Enhanced Oil Recovery Market Forecast, 2021-2031 (USD Mn, AGR (%))
Figure 286. Bahrain Thermal Enhanced Oil Recovery Market Forecast, 2021-2031 (USD Mn, AGR (%)) (V- Shaped Recovery)
Figure 287. Bahrain Thermal Enhanced Oil Recovery Market Forecast, 2021-2031 (USD Mn, AGR (%)) (W- Shaped Recovery)
Figure 288. Bahrain Thermal Enhanced Oil Recovery Market Forecast, 2021-2031 (USD Mn, AGR (%)) (U- Shaped Recovery)
Figure 289. Bahrain Thermal Enhanced Oil Recovery Market Forecast, 2021-2031 (USD Mn, AGR (%)) (L- Shaped Recovery)
Figure 290. Bahrain Thermal Enhanced Oil Recovery Market Forecast, 2021-2031 (USD Mn, AGR (%))
Figure 291. Bahrain Thermal Enhanced Oil Recovery Market Forecast, 2021-2031 (USD Mn, AGR (%)) (V- Shaped Recovery)
Figure 292. Bahrain Thermal Enhanced Oil Recovery Market Forecast, 2021-2031 (USD Mn, AGR (%)) (W- Shaped Recovery)
Figure 293. Bahrain Thermal Enhanced Oil Recovery Market Forecast, 2021-2031 (USD Mn, AGR (%)) (U- Shaped Recovery)
Figure 294. Bahrain Thermal Enhanced Oil Recovery Market Forecast, 2021-2031 (USD Mn, AGR (%)) (L- Shaped Recovery)
Figure 295. Bahrain Thermal Enhanced Oil Recovery Market Forecast by Production, 2021-2031 (MBPD, AGR (%))
Figure 296. Bahrain Thermal Enhanced Oil Recovery Market Forecast by Production, 2021-2031 (MBPD, AGR (%)) (V- Shaped Recovery)
Figure 297. Bahrain Thermal Enhanced Oil Recovery Market Forecast by Production, 2021-2031 (MBPD, AGR (%)) (W- Shaped Recovery)
Figure 298. Bahrain Thermal Enhanced Oil Recovery Market Forecast by Production, 2021-2031 (MBPD, AGR (%)) (U- Shaped Recovery)
Figure 299. Bahrain Thermal Enhanced Oil Recovery Market Forecast by Production, 2021-2031 (MBPD, AGR (%)) (L- Shaped Recovery)
Figure 300. Bahrain Thermal Enhanced Oil Recovery Market Forecast by End-Product, 2021-2031 (MBPD, AGR (%))
Figure 301. Bahrain Thermal Enhanced Oil Recovery Market Forecast by End-Product, 2021-2031 (MBPD, AGR (%)) (V- Shaped Recovery)
Figure 302. Bahrain Thermal Enhanced Oil Recovery Market Forecast by End-Product, 2021-2031 (MBPD, AGR (%)) (W- Shaped Recovery)
Figure 303. Bahrain Thermal Enhanced Oil Recovery Market Forecast by End-Product, 2021-2031 (MBPD, AGR (%)) (U- Shaped Recovery)
Figure 304. Bahrain Thermal Enhanced Oil Recovery Market Forecast by End-Product, 2021-2031 (MBPD, AGR (%)) (L- Shaped Recovery)
Figure 305. Bahrain Thermal Enhanced Oil Recovery Market by Technology, 2021-2031 (MBPD, AGR (%))
Figure 306. Bahrain Thermal Enhanced Oil Recovery Market by Technology, 2021-2031 (MBPD, AGR (%)) (V- Shaped Recovery)
Figure 307. Bahrain Thermal Enhanced Oil Recovery Market by Technology, 2021-2031 (MBPD, AGR (%)) (W- Shaped Recovery)
Figure 308. Bahrain Thermal Enhanced Oil Recovery Market by Technology, 2021-2031 (MBPD, AGR (%)) (U- Shaped Recovery)
Figure 309. Bahrain Thermal Enhanced Oil Recovery Market by Technology, 2021-2031 (MBPD, AGR (%)) (L- Shaped Recovery)
Figure 310. Bahrain Thermal Enhanced Oil Recovery Market by Method, 2021-2031 (MBPD, AGR (%))
Figure 311. Bahrain Thermal Enhanced Oil Recovery Market by Method, 2021-2031 (MBPD, AGR (%)) (V- Shaped Recovery)
Figure 312. Bahrain Thermal Enhanced Oil Recovery Market by Method, 2021-2031 (MBPD, AGR (%)) (W- Shaped Recovery)
Figure 313. Bahrain Thermal Enhanced Oil Recovery Market by Method, 2021-2031 (MBPD, AGR (%)) (U- Shaped Recovery)
Figure 314. Bahrain Thermal Enhanced Oil Recovery Market by Method, 2021-2031 (MBPD, AGR (%)) (L- Shaped Recovery)
Figure 315. Saudi Arabia Thermal Enhanced Oil Recovery Market Forecast, 2021-2031 (USD Mn, AGR (%))
Figure 316. Saudi Arabia Thermal Enhanced Oil Recovery Market Forecast, 2021-2031 (USD Mn, AGR (%)) (V- Shaped Recovery)
Figure 317. Saudi Arabia Thermal Enhanced Oil Recovery Market Forecast, 2021-2031 (USD Mn, AGR (%)) (W- Shaped Recovery)
Figure 318. Saudi Arabia Thermal Enhanced Oil Recovery Market Forecast, 2021-2031 (USD Mn, AGR (%)) (U- Shaped Recovery)
Figure 319. Saudi Arabia Thermal Enhanced Oil Recovery Market Forecast, 2021-2031 (USD Mn, AGR (%)) (L- Shaped Recovery)
Figure 320. Saudi Arabia Thermal Enhanced Oil Recovery Market Forecast, 2021-2031 (USD Mn, AGR (%))
Figure 321. Saudi Arabia Thermal Enhanced Oil Recovery Market Forecast, 2021-2031 (USD Mn, AGR (%)) (V- Shaped Recovery)
Figure 322. Saudi Arabia Thermal Enhanced Oil Recovery Market Forecast, 2021-2031 (USD Mn, AGR (%)) (W- Shaped Recovery)
Figure 323. Saudi Arabia Thermal Enhanced Oil Recovery Market Forecast, 2021-2031 (USD Mn, AGR (%)) (U- Shaped Recovery)
Figure 324. Saudi Arabia Thermal Enhanced Oil Recovery Market Forecast, 2021-2031 (USD Mn, AGR (%)) (L- Shaped Recovery)
Figure 325. Saudi Arabia Thermal Enhanced Oil Recovery Market Forecast by Production, 2021-2031 (MBPD, AGR (%))
Figure 326. Saudi Arabia Thermal Enhanced Oil Recovery Market Forecast by Production, 2021-2031 (MBPD, AGR (%)) (V- Shaped Recovery)
Figure 327. Saudi Arabia Thermal Enhanced Oil Recovery Market Forecast by Production, 2021-2031 (MBPD, AGR (%)) (W- Shaped Recovery)
Figure 328. Saudi Arabia Thermal Enhanced Oil Recovery Market Forecast by Production, 2021-2031 (MBPD, AGR (%)) (U- Shaped Recovery)
Figure 329. Saudi Arabia Thermal Enhanced Oil Recovery Market Forecast by Production, 2021-2031 (MBPD, AGR (%)) (L- Shaped Recovery)
Figure 330. Saudi Arabia Thermal Enhanced Oil Recovery Market Forecast by End-Product, 2021-2031 (MBPD, AGR (%))
Figure 331. Saudi Arabia Thermal Enhanced Oil Recovery Market Forecast by End-Product, 2021-2031 (MBPD, AGR (%)) (V- Shaped Recovery)
Figure 332. Saudi Arabia Thermal Enhanced Oil Recovery Market Forecast by End-Product, 2021-2031 (MBPD, AGR (%)) (W- Shaped Recovery)
Figure 333. Saudi Arabia Thermal Enhanced Oil Recovery Market Forecast by End-Product, 2021-2031 (MBPD, AGR (%)) (U- Shaped Recovery)
Figure 334. Saudi Arabia Thermal Enhanced Oil Recovery Market Forecast by End-Product, 2021-2031 (MBPD, AGR (%)) (L- Shaped Recovery)
Figure 335. Saudi Arabia Thermal Enhanced Oil Recovery Market by Technology, 2021-2031 (MBPD, AGR (%))
Figure 336. Saudi Arabia Thermal Enhanced Oil Recovery Market by Technology, 2021-2031 (MBPD, AGR (%)) (V- Shaped Recovery)
Figure 337. Saudi Arabia Thermal Enhanced Oil Recovery Market by Technology, 2021-2031 (MBPD, AGR (%)) (W- Shaped Recovery)
Figure 338. Saudi Arabia Thermal Enhanced Oil Recovery Market by Technology, 2021-2031 (MBPD, AGR (%)) (U- Shaped Recovery)
Figure 339. Saudi Arabia Thermal Enhanced Oil Recovery Market by Technology, 2021-2031 (MBPD, AGR (%)) (L- Shaped Recovery)
Figure 340. Saudi Arabia Thermal Enhanced Oil Recovery Market by Method, 2021-2031 (MBPD, AGR (%))
Figure 341. Saudi Arabia Thermal Enhanced Oil Recovery Market by Method, 2021-2031 (MBPD, AGR (%)) (V- Shaped Recovery)
Figure 342. Saudi Arabia Thermal Enhanced Oil Recovery Market by Method, 2021-2031 (MBPD, AGR (%)) (W- Shaped Recovery)
Figure 343. Saudi Arabia Thermal Enhanced Oil Recovery Market by Method, 2021-2031 (MBPD, AGR (%)) (U- Shaped Recovery)
Figure 344. Saudi Arabia Thermal Enhanced Oil Recovery Market by Method, 2021-2031 (MBPD, AGR (%)) (L- Shaped Recovery)
Figure 345. Rest of World Thermal Enhanced Oil Recovery Market Forecast, 2021-2031 (USD Mn, AGR (%))
Figure 346. Rest of World Thermal Enhanced Oil Recovery Market Forecast, 2021-2031 (USD Mn, AGR (%)) (V- Shaped Recovery)
Figure 347. Rest of World Thermal Enhanced Oil Recovery Market Forecast, 2021-2031 (USD Mn, AGR (%)) (W- Shaped Recovery)
Figure 348. Rest of World Thermal Enhanced Oil Recovery Market Forecast, 2021-2031 (USD Mn, AGR (%)) (U- Shaped Recovery)
Figure 349. Rest of World Thermal Enhanced Oil Recovery Market Forecast, 2021-2031 (USD Mn, AGR (%)) (L- Shaped Recovery)
Figure 350. Rest of World Thermal Enhanced Oil Recovery Market Forecast, 2021-2031 (USD Mn, AGR (%))
Figure 351. Rest of World Thermal Enhanced Oil Recovery Market Forecast, 2021-2031 (USD Mn, AGR (%)) (V- Shaped Recovery)
Figure 352. Rest of World Thermal Enhanced Oil Recovery Market Forecast, 2021-2031 (USD Mn, AGR (%)) (W- Shaped Recovery)
Figure 353. Rest of World Thermal Enhanced Oil Recovery Market Forecast, 2021-2031 (USD Mn, AGR (%)) (U- Shaped Recovery)
Figure 354. Rest of World Thermal Enhanced Oil Recovery Market Forecast, 2021-2031 (USD Mn, AGR (%)) (L- Shaped Recovery)
Figure 355. Rest of World Thermal Enhanced Oil Recovery Market Forecast by Production, 2021-2031 (MBPD, AGR (%))
Figure 356. Rest of World Thermal Enhanced Oil Recovery Market Forecast by Production, 2021-2031 (MBPD, AGR (%)) (V- Shaped Recovery)
Figure 357. Rest of World Thermal Enhanced Oil Recovery Market Forecast by Production, 2021-2031 (MBPD, AGR (%)) (W- Shaped Recovery)
Figure 358. Rest of World Thermal Enhanced Oil Recovery Market Forecast by Production, 2021-2031 (MBPD, AGR (%)) (U- Shaped Recovery)
Figure 359. Rest of World Thermal Enhanced Oil Recovery Market Forecast by Production, 2021-2031 (MBPD, AGR (%)) (L- Shaped Recovery)
Figure 360. Rest of World Thermal Enhanced Oil Recovery Market Forecast by End-Product, 2021-2031 (MBPD, AGR (%))
Figure 361. Rest of World Thermal Enhanced Oil Recovery Market Forecast by End-Product, 2021-2031 (MBPD, AGR (%)) (V- Shaped Recovery)
Figure 362. Rest of World Thermal Enhanced Oil Recovery Market Forecast by End-Product, 2021-2031 (MBPD, AGR (%)) (W- Shaped Recovery)
Figure 363. Rest of World Thermal Enhanced Oil Recovery Market Forecast by End-Product, 2021-2031 (MBPD, AGR (%)) (U- Shaped Recovery)
Figure 364. Rest of World Thermal Enhanced Oil Recovery Market Forecast by End-Product, 2021-2031 (MBPD, AGR (%)) (L- Shaped Recovery)
Figure 365. Rest of World Thermal Enhanced Oil Recovery Market by Technology, 2021-2031 (MBPD, AGR (%))
Figure 366. Rest of World Thermal Enhanced Oil Recovery Market by Technology, 2021-2031 (MBPD, AGR (%)) (V- Shaped Recovery)
Figure 367. Rest of World Thermal Enhanced Oil Recovery Market by Technology, 2021-2031 (MBPD, AGR (%)) (W- Shaped Recovery)
Figure 368. Rest of World Thermal Enhanced Oil Recovery Market by Technology, 2021-2031 (MBPD, AGR (%)) (U- Shaped Recovery)
Figure 369. Rest of World Thermal Enhanced Oil Recovery Market by Technology, 2021-2031 (MBPD, AGR (%)) (L- Shaped Recovery)
Figure 370. Rest of World Thermal Enhanced Oil Recovery Market by Method, 2021-2031 (MBPD, AGR (%))
Figure 371. Rest of World Thermal Enhanced Oil Recovery Market by Method, 2021-2031 (MBPD, AGR (%)) (V- Shaped Recovery)
Figure 372. Rest of World Thermal Enhanced Oil Recovery Market by Method, 2021-2031 (MBPD, AGR (%)) (W- Shaped Recovery)
Figure 373. Rest of World Thermal Enhanced Oil Recovery Market by Method, 2021-2031 (MBPD, AGR (%)) (U- Shaped Recovery)
Figure 374. Rest of World Thermal Enhanced Oil Recovery Market by Method, 2021-2031 (MBPD, AGR (%)) (L- Shaped Recovery)
Figure 375. Chevron Corporation.: Company Revenue 2016-2020(US$Mn, AGR %)
Figure 376. Chevron Corporation.: Company Operating Income 2016-2020(US$Mn, AGR %)
Figure 377. Chevron Corporation.: Company Net Income 2016-2020(US$Mn, AGR %)
Figure 378. Chevron Corporation: Company EBITDA 2016-2020(US$Mn, AGR %)
Figure 379. Suncor Energy Inc : Company Revenue 2016-2020(US$Mn, AGR %)
Figure 380. Suncor Energy Inc : Company Operating Income 2016-2020(US$Mn, AGR %)
Figure 381. Suncor Energy Inc : Company Net Income 2016-2020(US$Mn, AGR %)
Figure 382. Suncor Energy Inc : Company EBITDA 2016-2020(US$Mn, AGR %)
Figure 383. BP Plc.: Company Revenue 2016-2020(US$Mn, AGR %)
Figure 384. BP Plc.: Company Operating Income 2016-2020(US$Mn, AGR %)
Figure 385. BP Plc.: Company Net Income 2016-2020(US$Mn, AGR %)
Figure 386. BP Plc.: Company EBITDA 2016-2020(US$Mn, AGR %)
Figure 387. ConocoPhillips.: Company Revenue 2016-2020 (US$Mn, AGR %)
Figure 388. ConocoPhillips.: Company Operating Income 2016-2020 (US$Mn, AGR %)
Figure 389. ConocoPhillips.: Company Net Income 2016-2020 (US$Mn, AGR %)
Figure 390. ConocoPhillips.: Company EBITDA 2016-2020 (US$Mn, AGR %)
Figure 391. China Petroleum & Chemical Corporation Company Revenue 2015-2019(US$Mn, AGR %)
Figure 392. China Petroleum & Chemical Corporation Company Operating Income 2015-2019(US$Mn, AGR %)
Figure 393. China Petroleum & Chemical Corporation Company Net Income 2015-2019(US$Mn, AGR %)
Figure 394. China Petroleum & Chemical Corporation Company EBITDA 2015-2019(US$Mn, AGR %)
Figure 395. Exxon Mobil Corporation.: Company Revenue 2016-2020(US$Mn, AGR %)
Figure 396. Exxon Mobil Corporation.: Company Operating Income 2016-2020(US$Mn, AGR %)
Figure 397. Exxon Mobil Corporation.: Company Net Income 2016-2020(US$Mn, AGR %)
Figure 398. Exxon Mobil Corporation.: Company EBITDA 2016-2020(US$Mn, AGR %)
Figure 399. Royal Dutch Shell: Company Revenue 2016-2020(US$Mn, AGR %)
Figure 400. Royal Dutch Shell: Company Operating Income 2016-2020(US$Mn, AGR %)
Figure 401. Royal Dutch Shell: Company Net Income 2016-2020(US$Mn, AGR %)
Figure 402. Royal Dutch Shell: Company EBITDA 2016-2020(US$Mn, AGR %)
Figure 403. Total SE.: Company Revenue 2016-2020 (US$Mn, AGR %)
Figure 404. Total SE.: Company Operating Income 2016-2020 (US$Mn, AGR %)
Figure 405. Total SE.: Company Net Income 2016-2020 (US$Mn, AGR %)
Figure 406. Total SE.: Company EBITDA 2016-2020 (US$Mn, AGR %)
Figure 407. Petroleo Brasileiro S.A.: Company Revenue 2016-2020(US$Mn, AGR %)
Figure 408. Petroleo Brasileiro S.A.: Company Operating Income 2016-2020(US$Mn, AGR %)
Figure 409. Petroleo Brasileiro S.A.: Company Net Income 2016-2020(US$Mn, AGR %)
Figure 410. Petroleo Brasileiro S.A.: Company EBITDA 2016-2020(US$Mn, AGR %)
Figure 411. Imperial Oil Limited.: Company Revenue 2016-2020(US$Mn, AGR %)
Figure 412. Imperial Oil Limited.: Company Operating Income 2016-2020(US$Mn, AGR %)
Figure 413. Imperial Oil Limited.: Company Net Income 2016-2020(US$Mn, AGR %)
Figure 414. Imperial Oil Limited.: Company EBITDA 2016-2020(US$Mn, AGR %)
Figure 415. Cenovus Energy Inc.: Company Revenue 2016-2020 (US$Mn, AGR %)
Figure 416. Cenovus Energy Inc .: Company Operating Income 2016-2020 (US$Mn, AGR %)
Figure 417. Cenovus Energy Inc.: Company Net Income 2016-2020 (US$Mn, AGR %)
Figure 418. Cenovus Energy Inc.: Company EBITDA 2016-2020(US$Mn, AGR %)
Figure 419. China Petroleum & Chemical Corporation.: Company Revenue 2015-2019 (US$Mn, AGR %)
Figure 420. China Petroleum & Chemical Corporation.: Company Operating Income 2015-2019 (US$Mn, AGR %)
Figure 421. China Petroleum & Chemical Corporation.: Company Net Income 2015-2019 (US$Mn, AGR %)
Figure 422. China Petroleum & Chemical Corporation.: Company EBITDA 2015-2019 (US$Mn, AGR %)
Figure 423. Occidental Petroleum Corporation: Company Revenue 2016-2020(US$Mn, AGR %)
Figure 424. Occidental Petroleum Corporation: Company Operating Income 2016-2020(US$Mn, AGR %)
Figure 425. Occidental Petroleum Corporation: Company Net Income 2016-2020(US$Mn, AGR %)
Figure 426. Occidental Petroleum Corporation: Company EBITDA 2016-2020(US$Mn, AGR %)
Figure 427. China National Offshore Oil Corporation (CNOOC).: Company Revenue 2016-2020 (US$Mn, AGR %)
Figure 428. China National Offshore Oil Corporation (CNOOC).: Company Operating Income 2016-2020 (US$Mn, AGR %)
Figure 429. China National Offshore Oil Corporation (CNOOC).: Company Net Income 2016-2020 (US$Mn, AGR %)
Figure 430. China National Offshore Oil Corporation (CNOOC).: Company EBITDA 2016-2020 (US$Mn, AGR %)
Figure 431. Kinder Morgan, Inc.: Company Revenue 2016-2020 (US$Mn, AGR %)
Figure 432. Kinder Morgan, Inc.: Company Operating Income 2016-2020 (US$Mn, AGR %)
Figure 433. Kinder Morgan, Inc.: Company Net Income 2016-2020 (US$Mn, AGR %)
Figure 434. Kinder Morgan, Inc.: Company EBITDA 2016-2020 (US$Mn, AGR %)
Figure 435. Halliburton Company.: Company Revenue 2016-2020 (US$Mn, AGR %)
Figure 436. Halliburton Company.: Company Operating Income 2016-2020 (US$Mn, AGR %)
Figure 437. Halliburton Company: Company Net Income 2016-2020 (US$Mn, AGR %)
Figure 438. Halliburton Company: Company EBITDA 2016-2020 (US$Mn, AGR %)
Figure 439. Equinor ASA.: Company Revenue 2016-2020 (US$Mn, AGR %)
Figure 440. Equinor ASA.: Company Operating Income 2016-2020 (US$Mn, AGR %)
Figure 441. Equinor ASA.: Company Net Income 2016-2020 (US$Mn, AGR %)
Figure 442. Equinor ASA.: Company EBITDA 2016-2020 (US$Mn, AGR %)
Figure 443. Canadian Natural Resources Limited.: Company Revenue 2016-2020 (US$Mn, AGR %)
Figure 444. Canadian Natural Resources Limited.: Company Operating Income 2016-2020 (US$Mn, AGR %)
Figure 445. Canadian Natural Resources Limited.: Company Net Income 2016-2020 (US$Mn, AGR %)
Figure 446. Canadian Natural Resources Limited.: Company EBITDA 2016-2020 (US$Mn, AGR %)
BP plc
Canadian Natural Resources Limited
Cenovus Energy Inc
Chevron Corporation (Chevron)
China National Offshore Oil Corporation (CNOOC)
China Petroleum & Chemical Corporation
China Petroleum & Chemical Corporation
ConocoPhillips
Equinor ASA
Exxon Mobil Corporation
Ferus Pvt. Ltd
Halliburton Company
Imperial Oil Limited
Kinder Morgan, Inc.
Occidental Petroleum Corporation
Petroleo Brasileiro S.A.
Petróleos de Venezuela S.A.(PDVSA)
Royal Dutch Shell
Suncor Energy Inc
Total SE
Other Companies Mentioned in the Report
Aera Energy
Athabasca Oil
Bayou State
Bayshore Petroleum
Blackpearl Resources
BP Migas
Brion Energy
Cenovus
Chevron Corporation
Chrysalix Energy venture Capital
Citgo Petroleum Group
CNPC
CNRL
Connacher
ConocoPhillips
Continental Resources
Denbury Resources
Devon Energy
E-T Energy
ENI
Equinor
Excelsior Energy
Exxon Mobil
Gazprom
Glass Point
Harvest Operations
Hot-Tec Energy
Husky Energy
Imperial Oil
Japan Canada Oil Sands
KGOC
Laricina Energy
Linn Energy
Lukoil
Maha Energy
MEG Energy
Naftex
NAM
Nexen
NOC
Nth Power
Occidental
Osum Oil Sands
Pacific Exploration
Pacific Rubiales
PDO
Pengrowth Energy
Petro-Canada
Petróleos de Venezuela S.A. PDVSA
Reliance
RockPort Capital
Rosneft
Royal Dutch Shell
Salym Petroleum Development N.V.
Sinopec
SKSPMIGAS
SOE
Suncor
Sunshine Oil Sands
Surgutneftegaz
Tatweer Petroleum
Tipco
Total
Touchstone
Valero
Wintershall
Zarubezhneft
List of Associations/Organizations
Algerian Energy Ministry
California Department of Oil, Gas & Geothermal Resources (DOGGR)
California Resources Corporation
China National Offshore Oil Corporation (CNOOC)
China National Petroleum Corporation (CNPC)
International Energy Agency (IEA)
OPEC
Petroleum Administration for Defense Districts
United States Geological Survey (USGS)
Download sample pages
Complete the form below to download your free sample pages for Thermal Enhanced Oil Recovery (EOR) Market Report 2021-2031Related reports
-
Global Lubricants Market 2020-2030
Visiongain has calculated that the global lubricants market will see a capital expenditure (CAPEX) of $154,951mn in 2017. Read on...
Full DetailsPublished: 01 January 1970 -
Marine Growth Removal Market Report 2020-2030
Marine growth is one of the common factors that cause problems in sea submerged equipment, machines or ships. Increase in...
Full DetailsPublished: 01 January 1970 -
Microbial Enhanced Oil Recovery Market Report 2020-2030
This latest report by business intelligence provider Visiongain assesses that Microbial Enhanced Oil Recovery Market spending will reach US$ 730...
Full DetailsPublished: 01 January 1970 -

Carbon Dioxide (CO2) Enhanced Oil Recovery (EOR) Market 2020-2030
Are you aware that CO2 EOR spending will reach $22.13bn in 2020?
...Full DetailsPublished: 24 January 2020 -
Carbon Dioxide (CO2) Enhanced Oil Recovery (EOR) Market Report 2021-2031
We predict strong revenue growth through to 2031. Our work identifies which organizations hold the greatest potential. Discover their capabilities,...Full DetailsPublished: 24 May 2021 -
Top 20 Enhanced Oil Recovery (EOR) Companies 2019
The leading 20 players in the EOR market comprise a broad range of companies, including the six supermajors, large state-owned,...Full DetailsPublished: 18 December 2018 -
Chemical Enhanced Oil Recovery (EOR) Market Report 2022-2032
The Chemical Enhanced Oil Recovery (EOR) market was valued at more than US$4.00 billion in 2022 and is projected to...Full DetailsPublished: 18 November 2022 -
Small Modular Reactor Market Report 2022-2032
The global small modular reactors market was valued at US$9,725 million in 2021 and is projected to grow at a...Full DetailsPublished: 31 May 2022 -

Oilfield Crown Block Market Report 2020-2030
Forecasts by Type (Under 30T, 30T-100T, Above 100T), by Application (Onshore, Offshore), by Region (North America, Europe, Asia Pacific, Central...
Full DetailsPublished: 01 January 1970 -

Molten Salt Reactors Market Report 2021-2031
The aim of this report is to provide detailed market, technology and industry analyses to help readers quantify and qualify...Full DetailsPublished: 12 February 2021
Download sample pages
Complete the form below to download your free sample pages for Thermal Enhanced Oil Recovery (EOR) Market Report 2021-2031Do you have any custom requirements we can help you with?
Any specific country, geo region, market segment or specific company information?
Email us today, we can discuss your needs and see how we can help: jamie.roberts@visiongain.com
Would you like a free report overview of the report of your choice?
If so, please drop an email to Jamie Roberts stating your chosen report title to jamie.roberts@visiongain.com
Visiongain energy reports are compiled using a broad and rich mixture of both primary and secondary information to produce an overall industry outlook. In order to provide our clients with the best product possible product, we do not rely on any one single source of information. Visiongain analysts reach out to market-leading vendors and industry experts where possible but also review a wealth of financial data and product information from a vast range of sources. To find out more about our reports methodology, please email jamie.roberts@visiongain.com
Would you like to get the latest Visiongain energy reports catalogue?
What are the dynamic growth sectors? where are the regional business opportunities?
Which technologies will prevail and who are the leading companies succeeding in these sectors and why?
If you want definitive answers to business critical questions, discover Visiongain’s full range of business intelligence reports.
If so, please email Jamie Roberts on jamie.roberts@visiongain.com or call her today on +44 207 336 6100
“The Visiongain report was extremely insightful and helped us construct our basic go-to market strategy for our solution.”
H.
“F.B has used Visiongain to prepare two separate market studies on the ceramic proppants market over the last 12 months. These reports have been professionally researched and written and have assisted FBX greatly in developing its business strategy and investment plans.”
F.B
“We just received your very interesting report on the Energy Storage Technologies (EST) Market and this is a very impressive and useful document on that subject.”
I.E.N
“Visiongain does an outstanding job on putting the reports together and provides valuable insight at the right informative level for our needs. The EOR Visiongain report provided confirmation and market outlook data for EOR in MENA with the leading countries being Oman, Kuwait and eventually Saudi Arabia.”
E.S
“Visiongain produced a comprehensive, well-structured GTL Market report striking a good balance between scope and detail, global and local perspective, large and small industry segments. It is an informative forecast, useful for practitioners as a trusted and upto-date reference.”
Y.N Ltd
Association of Dutch Suppliers in the Oil & Gas Industry
Society of Naval Architects & Marine Engineers
Association of Diving Contractors
Association of Diving Contractors International
Associazione Imprese Subacquee Italiane
Australian Petroleum Production & Exploration Association
Brazilian Association of Offshore Support Companies
Brazilian Petroleum Institute
Canadian Energy Pipeline
Diving Medical Advisory Committee
European Diving Technology Committee
French Oil and Gas Industry Council
IMarEST – Institute of Marine Engineering, Science & Technology
International Association of Drilling Contractors
International Association of Geophysical Contractors
International Association of Oil & Gas Producers
International Chamber of Shipping
International Shipping Federation
International Marine Contractors Association
International Tanker Owners Pollution Federation
Leading Oil & Gas Industry Competitiveness
Maritime Energy Association
National Ocean Industries Association
Netherlands Oil and Gas Exploration and Production Association
NOF Energy
Norsk olje og gass Norwegian Oil and Gas Association
Offshore Contractors’ Association
Offshore Mechanical Handling Equipment Committee
Oil & Gas UK
Oil Companies International Marine Forum
Ontario Petroleum Institute
Organisation of the Petroleum Exporting Countries
Regional Association of Oil and Natural Gas Companies in Latin America and the Caribbean
Society for Underwater Technology
Society of Maritime Industries
Society of Petroleum Engineers
Society of Petroleum Enginners – Calgary
Step Change in Safety
Subsea UK
The East of England Energy Group
UK Petroleum Industry Association
All the events postponed due to COVID-19.
Don’t Miss Out!
Latest Energy news
Energy as a Service (EaaS) Market
The global Energy as a Service (EaaS) market is projected to grow at a CAGR of 12.6% by 2034
25 July 2024
Synthetic Fuels Market
The global Synthetic Fuels market is projected to grow at a CAGR of 23% by 2034
18 July 2024
Power-to-X (P2X) Market
The global Power-to-X (P2X) market is projected to grow at a CAGR of 10.6% by 2034
09 July 2024
Airborne Wind Energy Market
The global Airborne Wind Energy market is projected to grow at a CAGR of 9.7% by 2034
05 June 2024


