If you read only 1 CO2 enhanced oil recovery report this year – this is the report you need to read. Take a look at our report on CO2 enhanced oil recovery. It’ll give you an idea of what activities are in the global market and how you can leverage your products and services to generate revenue.
How to break through the COVID-19 bottleneck? This report analyses four recovery pathways and helps you to make decision based on our analysis.
Are you Ready To Grab the Big Opportunity?
Today most of the oil companies focus on optimising the recovery factor (RF) of their oilfields and maintaining the economic oil levels. It is because it is becoming more and more difficult to find new oilfields. The majority of sedimentary oil-containing basins were studied and new results were generally minimal. In remote and environmentally fragile regions, the remaining undeclared basins are situated worldwide. While unconventional concentrations of hydrocarbon, such as very viscous oils, shale oil shales, shale gas and gas hydrates, are extremely high in energy intensive technologies to extract these resources (e.g. steam injection).
What’s your business strategy to tackle stiff competition in the CO2 enhanced oil recovery Market?
• ExxonMobil and Global Thermostat have extended their joint development agreement on technology that absorbs carbon dioxide (CO2) directly from the air
• Total and Siemens Energy have signed a Technical Collaboration Agreement to research long-term CO2 emission reduction strategies.
• Project Tundra, a Minnkota Power Cooperative effort to construct the world’s largest carbon capture facility at the Milton R. Young Station coal-fired power plant near Center, North Dakota, has awarded a contract to Oxy Low Carbon Ventures, LLC, an Occidental subsidiary, to provide Carbon Storage Consulting Services.
Key questions answered in this exclusive report are:
• What are the implication to contract prices of CO2 enhanced oil recovery projects taking place now and over the next 10 years?
• Where is the CO2 enhanced oil recovery power market heading? And how can you ensure you are at the forefront of the market?
You need to discover how this will impact the CO2 enhanced oil recovery power market today, and over the next 10 years:
• Our 519-page report provides 350 tables and 330 charts/graphs exclusively to you.
• The report highlights key lucrative areas in the industry so you can target them – NOW.
• Contains in-depth analyse of global, regional and national sales and growth
• Highlights for you the key successful trends, changes and revenue projections made by your competitors
This report tells you TODAY how the CO2 Enhanced Oil Recovery market will develop in the next 10 years, and in-line with the variations in COVID-19 economic recession and bounce. This market is more critical now than at any point over the last 10 years.
This report includes data analysis and invaluable insight into how COVID-19 will affect your industry. Access this report today.
To access the data contained in this document please email contactus@visiongain.com
Forecasts to 2031 and other analyses reveal the commercial prospects
• In addition to revenue forecasting to 2031, our new study provides you with recent results, growth rates, and market shares.
• You find original analyses, with business outlooks and developments.
• Discover qualitative analyses (including market dynamics, drivers, opportunities, restraints and challenges), cost structure, impact of COVID on CO2 enhanced oil recovery project profiles and recent developments.
This report includes data analysis and invaluable insight into how COVID-19 will affect your industry. Four COVID-19 recovery patterns and their impact, namely, V, L, W and U are discussed in this report.
Global CO2 Enhanced Oil Recovery Market by Type (COVID Impact Analysis)
Global CO2 Enhanced Oil Recovery Market Breakdown By Spending & Volume (COVID Impact Analysis)
• CAPEX ($Mn)
• OPEX ($Mn)
• Production (MBPD)
Global CO2 Enhanced Oil Recovery Market by Type (COVID Impact Analysis)
• Miscible EOR
• Immiscible EOR
Global CO2 Enhanced Oil Recovery Market by Co2 Source (COVID Impact Analysis)
• Natural CO2 Deposits
• Carbon Capture & Storage
• Industrial CO2
• Other CO2 Sources
Global CO2 Enhanced Oil Recovery Market by Equipment (COVID Impact Analysis)
• Drilling Equipment
• Production Well
• Injection Well Equipment
• Lease Equipment
• Other Equipment

In addition to the revenue predictions for the overall world market and segments, you will also find revenue forecasts for 5 regional and 20 leading national markets:
• North America CO2 Enhanced Oil Recovery 2021 to 2031 Market Outlook
– U.S. CO2 Enhanced Oil Recovery 2021 to 2031 Market Forecast & COVID Impact Analysis
– Canada CO2 Enhanced Oil Recovery 2021 to 2031 Market Forecast & COVID Impact Analysis
• Europe CO2 Enhanced Oil Recovery 2021 to 2031 Market Outlook
– Germany CO2 Enhanced Oil Recovery 2021 to 2031 Market Forecast & COVID Impact Analysis
– UK CO2 Enhanced Oil Recovery 2021 to 2031 Market Forecast & COVID Impact Analysis
– Norway CO2 Enhanced Oil Recovery 2021 to 2031 Market Forecast & COVID Impact Analysis
– Italy CO2 Enhanced Oil Recovery 2021 to 2031 Market Forecast & COVID Impact Analysis
– Russia CO2 Enhanced Oil Recovery 2021 to 2031 Market Forecast & COVID Impact Analysis
– Rest of Europe CO2 Enhanced Oil Recovery 2021 to 2031 Market Forecast & COVID Impact Analysis
• Asia Pacific CO2 Enhanced Oil Recovery 2021 to 2031 Market Outlook
– China CO2 Enhanced Oil Recovery 2021 to 2031 Market Forecast & COVID Impact Analysis
– India CO2 Enhanced Oil Recovery 2021 to 2031 Market Forecast & COVID Impact Analysis
– Indonesia CO2 Enhanced Oil Recovery 2021 to 2031 Market Forecast & COVID Impact Analysis
– Rest of Asia Pacific CO2 Enhanced Oil Recovery 2021 to 2031 Market Forecast & COVID Impact Analysis
• Latin America CO2 Enhanced Oil Recovery 2021 to 2031 Market Outlook
– Brazil CO2 Enhanced Oil Recovery 2021 to 2031 Market Forecast & COVID Impact Analysis
– Rest of Latin America CO2 Enhanced Oil Recovery 2021 to 2031 Market Forecast & COVID Impact Analysis
• Middle East & Africa CO2 Enhanced Oil Recovery 2021 to 2031 Market Outlook
– Venezuela CO2 Enhanced Oil Recovery 2021 to 2031 Market Forecast & COVID Impact Analysis
– Kuwait CO2 Enhanced Oil Recovery 2021 to 2031 Market Forecast & COVID Impact Analysis
– Oman CO2 Enhanced Oil Recovery 2021 to 2031 Market Forecast & COVID Impact Analysis
– Bahrain CO2 Enhanced Oil Recovery 2021 to 2031 Market Forecast & COVID Impact Analysis
– Saudi Arabia CO2 Enhanced Oil Recovery 2021 to 2031 Market Forecast & COVID Impact Analysis
– Rest of Middle East & Africa CO2 Enhanced Oil Recovery 2021 to 2031 Market Forecast & COVID Impact Analysis
Need industry data? Please contact us today.
The report also includes profiles and for some of the leading companies in the CO2 Enhanced Oil Recovery 2021 to 2031 Market, with a focus on this segment of these companies’ operations.
Leading companies and the potential for market growth
• Exxon Mobil Corporation
• BP plc
• Total SE
• China Petroleum & Chemical Corporation
• Royal Dutch Shell
• Chevron Corporation (Chevron)
• Petroleo Brasileiro S.A.-Petrobras
• NK Lukoil PAO
• Cenovus Energy Inc
• Equinor ASA (formerly Statoil ASA)
• Abu Dhabi National Oil Company
• Air Products & Chemicals Inc.
• Occidental Petroleum Corp.
• Chesapeake Energy
• China National Offshore Oil Corporation (CNOOC)
• ConocoPhillips
• Halliburton Company
• Schlumberger N.V.
• Kinder Morgan, Inc.
Overall world revenue for CO2 Enhanced Oil Recovery 2021 to 2031 Market will surpass US$xx million in 2021, our work calculates. We predict strong revenue growth through to 2031. Our work identifies which organizations hold the greatest potential. Discover their capabilities, progress, and commercial prospects, helping you stay ahead.
How the CO2 Enhanced Oil Recovery 2021 to 2031 Market report helps you?
In summary, our 519-page report provides you with the following knowledge:
• Revenue forecasts to 2031 for CO2 Enhanced Oil Recovery 2021 to 2031 Market, with forecasts for Spending, CAPEX, OPEX, Production, Type, Equipment, each forecasted at a global and regional level– discover the industry’s prospects, finding the most lucrative places for investments and revenues
• Revenue forecasts to 2031 for 5 regional and 20 key national markets – See forecasts for the CO2 Enhanced Oil Recovery Market, 2021 to 2031 market in North America, Europe, Asia-Pacific and Latin America, Middle East & Africa. Also forecasted is the market in the US, Canada, Germany, Norway, UK, Italy, Russia, China, Indonesia, and Venezuela among other prominent economies.
• Prospects for established firms and those seeking to enter the market– including company profiles for 20 of the major companies involved in the CO2 Enhanced Oil Recovery 2021 to 2031 Market.
Find quantitative and qualitative analyses with independent predictions. Receive information that only our report contains, staying informed with this invaluable business intelligence.
Information found nowhere else
With our newly report title, you are less likely to fall behind in knowledge or miss out on opportunities. See how our work could benefit your research, analyses, and decisions. Visiongain’s study is for everybody needing commercial analyses for the CO2 Enhanced Oil Recovery 2021 to 2031 Market and leading companies. You will find data, trends and predictions.
To access the data contained in this document please email contactus@visiongain.com
Buy our report today Carbon Dioxide (CO2) Enhanced Oil Recovery (EOR) Market Report 2021-2031: Forecasts by Type (Miscible EOR, Immiscible EOR), by CO2 Source (Natural CO2 Deposits, Carbon Capture, & Storage, Industrial CO2, Other), by Equipment (Drilling Equipment, Production Well, Injection Well Equipment, Lease Equipment, Other) AND Regional and Leading National Market Analysis PLUS Analysis of Leading CO2 EOR Companies AND COVID-19 Recovery Scenarios. Avoid missing out by staying informed – order our report now.
Visiongain is a trading partner with the US Federal Government
CCR Ref number: KD4R6
Do you have any custom requirements we can help you with? Any need for a specific country, geo region, market segment or specific company information? Contact us today, we can discuss your needs and see how we can help: sara.peerun@visiongain.com
1 Report Overview
1.1 Introduction to CO2 Enhanced Oil Recovery Market
1.2 Global CO2 Enhanced Oil Recovery Market Overview
1.3 What are the Objectives of this Report?
1.4 What is the Scope of the Report?
1.5 CO2 Enhanced Oil Recovery Market Definition
1.6 Why You Should Read This Report
1.7 What This Report Delivers
1.8 Key Questions Answered By This Analytical Report Include:
1.9 Who is This Report for?
1.10 Research Methodology
1.10.1 Primary Research
1.10.2 Secondary Research
1.10.3 Market Evaluation & Forecasting Methodology
1.11 Frequently Asked Questions (FAQs)
1.12 Associated Visiongain Reports
1.13 About Visiongain
2 Executive Summary
2.1 Is CO2 EOR Controlled And Safe?
2.2 What Happens To The CO2 That Is Injected?
2.3 Has CO2 been stored using CO2-EOR?
3 CO2 Enhanced Oil Recovery Industry Structure
3.1 Overview
3.2 An Oil Field’s Life Cycle
3.2.1 First Phase
3.2.2 Second Phase
3.2.3 Final Phase
3.3 CO2 Injections into Oil Wells
3.4 Production and Injections Profiles
3.4.1 Phase 1
3.4.2 Phase 2
3.4.3 Phase 3
3.5 Storage Overview
3.5.1 CO2 Storage Sites
3.5.2 Saline Storage CO2
3.5.3 CO2-EOR
3.5.4 Stacked CO2 Storage
3.6 Methodology for Techno-Economic Evaluation
3.6.1 Operating strategy of CO2-EOR
3.6.2 Hybrid Performance Model
3.6.3 Economic Model for CO2-EOR
3.6.4 The CO2 Deposition Infrastructure
3.7 Infrastructure Development
3.7.1 CO2 Trunk Pipelines Are Being Built In Various States And Regions
3.7.2 Private Company Producers of CO2 And Clients Of The Oil Industry
3.8 Minimum Miscibility Pressure (MMP)
3.9 Reservoir Implications
3.9.1 Pressure
3.9.2 CO2 Mobility and Reservoir Heterogeneity
3.9.3 CO2 Utilization
3.10 Corrosion Control
3.10.1 Proper Cement Positioning
3.10.2 Acid-Resistant Cements Are Installed.
3.10.3 The Casing String Is Protected by Cathodic Security.
4 Cost Evaluation
4.1 Capital costs
4.1.1 Injection of CO2 Cost
4.1.2 Oil-Gas-Water Separation Cost
4.1.3 CO2 Recycling Cost
4.2 Operation and Maintenance Cost (O&M)
4.3 CO2-EOR Net Sales and CO2 Mitigation Costs
4.4 Costs of CO2 Storage and Net Oil Recovery
5 Global Market Dynamics
5.1 Market Driving Factors
5.1.1 Providing Low-Carbon Electricity That Can Be Dispatched
5.1.2 Technological progress and Oil Recovery Technology
5.1.3 More Emphasis On Maximising The Carbon Dioxide Recuperation Factor
5.2 Market Restraining Factors
5.2.1 Despite the Significant Technological Potential, The Attractiveness of Oil Production Outside the USA Is Not Seen
5.2.2 Liability Over the Long-Term Frameworks of Law and Regulation
5.2.3 Carbon Taxation Increasing
5.3 Opportunities in the Global Market
5.3.1 Environmental Advantages and Possibilities for Co2 Use
5.3.2 CO2 EOR Provides an Opportunity to Increase Domestic Oil Supply
5.3.3 Using traditional combinations of EOR and IOR
5.4 Challenges in the Global Market
5.4.1 Obstacles to Using More CO2 Per Barrel of Oil
5.4.2 CO2 Emissions Are Undervalued.
5.4.3 EOR Is An Extremely Expensive, Time Consuming And Multi-EOR Project
5.5 SWOT Analysis
5.6 PESTAL Analysis
6 Global CO2 Enhanced Oil Recovery Market Analysis
6.1 Global Market Outlook
6.2 Global Market Size Estimation and Forecast
6.2.1 Pre-COVID-19 Market Scenario
6.2.2 Post-COVID-19 Market Scenarios (V, W, U, L-Shaped Recovery Analysis)
7 Global Market Size Estimation and Forecast By Capex and Opex
7.1.1 Pre-COVID-19 Market Scenario
7.1.2 Post-COVID-19 Market Scenarios (V, W, U, L-Shaped Recovery Analysis)
7.2 Global Market Size Estimation and Forecast by Production
7.2.1 Pre-COVID-19 Market Scenario
7.2.2 Post-COVID-19 Market Scenarios (V, W, U, L-Shaped Recovery Analysis)
8 Global Market Size Estimation and Forecast By Type
8.1 Segment Outlook
8.1.1 Miscible EOR
8.1.2 Immiscible EOR
8.2 Pre-COVID-19 Market Scenario
8.3 Post-COVID-19 Market Scenarios (V, W, U, L-Shaped Recovery Analysis)
9 Global Market Size Estimation and Forecast by CO2 Source
9.1 Segment Overview
9.1.1 Natural CO2 Deposites
9.1.2 Carbon Capture & Storage
9.1.3 Industrial CO2
9.2 Pre-COVID-19 Market Scenario
9.3 Post-COVID-19 Market Scenarios (V, W, U, L-Shaped Recovery Analysis)
10 Global Market Size Estimation and Forecast by Equipment
10.1 Segment Overview
10.1.1 Drilling Equipment
10.1.2 Production Well
10.1.3 Injection Well Equipment
10.1.4 Lease Equipment
10.2 Pre-COVID-19 Market Scenario
10.3 Post-COVID-19 Market Scenarios (V, W, U, L-Shaped Recovery Analysis)
11 Global Market Size Estimation and Forecast By Region
11.1 Pre-COVID-19 Market Scenario
11.2 Post-COVID-19 Market Scenarios (V, W, U, L-Shaped Recovery Analysis)
12 Global Market Size Estimation and Forecast By Region
12.1 Pre-COVID-19 Market Scenario
12.2 Post-COVID-19 Market Scenarios (V, W, U, L-Shaped Recovery Analysis)
13 North America CO2 Enhanced Oil Recovery Market Analysis
13.1 North America Market Outlook
13.2 North America Market Size Estimation and Forecast
13.2.1 Pre-COVID-19 Market Scenario
13.2.2 Post-COVID-19 Market Scenarios (V, W, U, L-Shaped Recovery Analysis)
13.3 Market Size Estimation and Forecast By Capex and Opex
13.3.1 Pre-COVID-19 Market Scenario
13.3.2 Post-COVID-19 Market Scenarios (V, W, U, L-Shaped Recovery Analysis)
13.4 North America Market Size Estimation and Forecast Production
13.4.1 Pre-COVID-19 Market Scenario
13.4.2 Post-COVID-19 Market Scenarios (V, W, U, L-Shaped Recovery Analysis)
13.5 North America Market Size Estimation and Forecast By Type
13.5.1 Pre-COVID-19 Market Scenario
13.5.2 Post-COVID-19 Market Scenarios (V, W, U, L-Shaped Recovery Analysis)
13.6 North America Market Size Estimation and Forecast by CO2 Source
13.6.1 Pre-COVID-19 Market Scenario
13.6.2 Post-COVID-19 Market Scenarios (V, W, U, L-Shaped Recovery Analysis)
13.7 North America Market Size Estimation and Forecast by Equipment
13.7.1 Pre-COVID-19 Market Scenario
13.7.2 Post-COVID-19 Market Scenarios (V, W, U, L-Shaped Recovery Analysis)
13.8 North America Market Size Estimation and Forecast By Country’s Spending
13.8.1 Pre-COVID-19 Market Scenario
13.8.2 Post-COVID-19 Market Scenarios (V, W, U, L-Shaped Recovery Analysis)
13.9 North America Market Size Estimation and Forecast By Country’s Production
13.9.1 US Market Analysis
13.9.2 Canada Market Analysis
13.9.3 Pre-COVID-19 Market Scenario
13.9.4 Post-COVID-19 Market Scenarios (V, W, U, L-Shaped Recovery Analysis)
14 Europe CO2 Enhanced Oil Recovery Market Analysis
14.1 Europe Market Outlook
14.2 Europe Market Size Estimation and Forecast
14.2.1 Pre-COVID-19 Market Scenario
14.2.2 Post-COVID-19 Market Scenarios (V, W, U, L-Shaped Recovery Analysis)
14.3 Market Size Estimation and Forecast
14.3.1 Pre-COVID-19 Market Scenario
14.3.2 Post-COVID-19 Market Scenarios (V, W, U, L-Shaped Recovery Analysis)
14.4 Europe Market Size Estimation and Forecast Production
14.4.1 Pre-COVID-19 Market Scenario
14.4.2 Post-COVID-19 Market Scenarios (V, W, U, L-Shaped Recovery Analysis)
14.5 Europe Market Size Estimation and Forecast By Type
14.5.1 Pre-COVID-19 Market Scenario
14.5.2 Post-COVID-19 Market Scenarios (V, W, U, L-Shaped Recovery Analysis)
14.6 Europe Market Size Estimation and Forecast by CO2 Source
14.6.1 Pre-COVID-19 Market Scenario
14.6.2 Post-COVID-19 Market Scenarios (V, W, U, L-Shaped Recovery Analysis)
14.7 Europe Market Size Estimation and Forecast by Equipment
14.7.1 Pre-COVID-19 Market Scenario
14.7.2 Post-COVID-19 Market Scenarios (V, W, U, L-Shaped Recovery Analysis)
14.8 Europe Market Size Estimation and Forecast By Country
14.8.1 Pre-COVID-19 Market Scenario
14.8.2 Post-COVID-19 Market Scenarios (V, W, U, L-Shaped Recovery Analysis)
14.9 Europe Market Size Estimation and Forecast By Country
14.9.1 UK Market Analysis
14.9.2 Norway Market Analysis
14.9.3 Italy Market Analysis
14.9.4 Germany Market Analysis
14.9.5 Russia Market Analysis
14.9.6 Pre-COVID-19 Market Scenario
14.9.7 Post-COVID-19 Market Scenarios (V, W, U, L-Shaped Recovery Analysis)
15 Asia-Pacific CO2 Enhanced Oil Recovery Market Analysis
15.1 Asia-Pacific Market Outlook
15.2 Asia-Pacific Market Size Estimation and Forecast
15.2.1 Pre-COVID-19 Market Scenario
15.2.2 Post-COVID-19 Market Scenarios (V, W, U, L-Shaped Recovery Analysis)
15.3 Market Size Estimation and Forecast by Capex & Opex
15.3.1 Pre-COVID-19 Market Scenario
15.3.2 Post-COVID-19 Market Scenarios (V, W, U, L-Shaped Recovery Analysis)
15.4 Asia-Pacific Market Size Estimation and Forecast Production
15.4.1 Pre-COVID-19 Market Scenario
15.4.2 Post-COVID-19 Market Scenarios (V, W, U, L-Shaped Recovery Analysis)
15.5 Asia-Pacific Market Size Estimation and Forecast By Type
15.5.1 Pre-COVID-19 Market Scenario
15.5.2 Post-COVID-19 Market Scenarios (V, W, U, L-Shaped Recovery Analysis)
15.6 Asia-Pacific Market Size Estimation and Forecast by CO2 Source
15.6.1 Pre-COVID-19 Market Scenario
15.6.2 Post-COVID-19 Market Scenarios (V, W, U, L-Shaped Recovery Analysis)
15.7 Asia-Pacific Market Size Estimation and Forecast by Equipment
15.7.1 Pre-COVID-19 Market Scenario
15.7.2 Post-COVID-19 Market Scenarios (V, W, U, L-Shaped Recovery Analysis)
15.8 Asia-Pacific Market Size Estimation and Forecast By Country’s Spending
15.8.1 Indonesia Market Analysis
15.8.2 China Market Analysis
15.8.3 India Market Analysis
15.8.4 Pre-COVID-19 Market Scenario
15.8.5 Post-COVID-19 Market Scenarios (V, W, U, L-Shaped Recovery Analysis)
15.9 Asia-Pacific Market Size Estimation and Forecast By Country’s Production
15.9.1 Pre-COVID-19 Market Scenario
15.9.2 Post-COVID-19 Market Scenarios (V, W, U, L-Shaped Recovery Analysis)
16 Latin America Market Size Estimation and Forecast
16.1 Latin America Market Outlook
16.2 Latin America Market Size Estimation and Forecast
16.2.1 Pre-COVID-19 Market Scenario
16.2.2 Post-COVID-19 Market Scenarios (V, W, U, L-Shaped Recovery Analysis)
16.3 Market Size Estimation and Forecast by Capex & Opex
16.3.1 Pre-COVID-19 Market Scenario
16.3.2 Post-COVID-19 Market Scenarios (V, W, U, L-Shaped Recovery Analysis)
16.4 Latin America Market Size Estimation and Forecast Production
16.4.1 Pre-COVID-19 Market Scenario
16.4.2 Post-COVID-19 Market Scenarios (V, W, U, L-Shaped Recovery Analysis)
16.5 Latin America Market Size Estimation and Forecast By Type
16.5.1 Pre-COVID-19 Market Scenario
16.5.2 Post-COVID-19 Market Scenarios (V, W, U, L-Shaped Recovery Analysis)
16.6 Latin America Market Size Estimation and Forecast by CO2 Source
16.6.1 Pre-COVID-19 Market Scenario
16.6.2 Post-COVID-19 Market Scenarios (V, W, U, L-Shaped Recovery Analysis)
16.7 Latin America Market Size Estimation and Forecast by Equipment
16.7.1 Pre-COVID-19 Market Scenario
16.7.2 Post-COVID-19 Market Scenarios (V, W, U, L-Shaped Recovery Analysis)
16.8 Latin America Market Size Estimation and Forecast By Country’s Spending
16.8.1 Pre-COVID-19 Market Scenario
16.8.2 Post-COVID-19 Market Scenarios (V, W, U, L-Shaped Recovery Analysis)
16.9 Latin America Market Size Estimation and Forecast By Country’s Production
16.9.1 Brazil
16.9.2 Pre-COVID-19 Market Scenario
16.9.3 Post-COVID-19 Market Scenarios (V, W, U, L-Shaped Recovery Analysis)
17 Middle East & Africa Market Size Estimation and Forecast
17.1 Middle East & Africa Market Outlook
17.2 Middle East & Africa Market Size Estimation and Forecast
17.2.1 Pre-COVID-19 Market Scenario
17.2.2 Post-COVID-19 Market Scenarios (V, W, U, L-Shaped Recovery Analysis)
17.3 Market Size Estimation and Forecast by Capex & Opex
17.3.1 Pre-COVID-19 Market Scenario
17.3.2 Post-COVID-19 Market Scenarios (V, W, U, L-Shaped Recovery Analysis)
17.4 Middle East & Africa Market Size Estimation and Forecast Production
17.4.1 Pre-COVID-19 Market Scenario
17.4.2 Post-COVID-19 Market Scenarios (V, W, U, L-Shaped Recovery Analysis)
17.5 Middle East & Africa Market Size Estimation and Forecast By Type
17.5.1 Pre-COVID-19 Market Scenario
17.5.2 Post-COVID-19 Market Scenarios (V, W, U, L-Shaped Recovery Analysis)
17.6 Middle East & Africa Market Size Estimation and Forecast by CO2 Source
17.6.1 Pre-COVID-19 Market Scenario
17.6.2 Post-COVID-19 Market Scenarios (V, W, U, L-Shaped Recovery Analysis)
17.7 Middle East & Africa Market Size Estimation and Forecast by Equipment
17.7.1 Pre-COVID-19 Market Scenario
17.7.2 Post-COVID-19 Market Scenarios (V, W, U, L-Shaped Recovery Analysis)
17.8 Middle East & Africa Market Size Estimation and Forecast By Country’s Spending
17.8.1 Pre-COVID-19 Market Scenario
17.8.2 Post-COVID-19 Market Scenarios (V, W, U, L-Shaped Recovery Analysis)
17.9 Middle East & Africa Market Size Estimation and Forecast By Country’s Production
17.9.1 Venezuela Market Analysis
17.9.2 Kuwait Market Analysis
17.9.3 Oman Market Analysis
17.9.4 Bahrain Market Analysis
17.9.5 Saudi Arabia Market Analysis
17.9.6 Pre-COVID-19 Market Scenario
17.9.7 Post-COVID-19 Market Scenarios (V, W, U, L-Shaped Recovery Analysis)
18 Leading Company Profiles
18.1 Exxon Mobil Corporation
18.1.1 Company Snapshot
18.1.2 Company Overview
18.1.3 Company Financial Profile
18.1.4 Company Product Benchmarking
18.1.5 Company Recent Developments
18.2 BP Plc.
18.2.1 Company Snapshot
18.2.2 Company Overview
18.2.3 Company Financial Profile
18.2.4 Company Product and Services Benchmarking
18.2.5 Company Recent Developments
18.3 Total SE
18.3.1 Company Snapshot
18.3.2 Company Overview
18.3.3 Company Financial Profile
18.3.4 Company Product Benchmarking
18.3.5 Company Recent Developments
18.4 China Petroleum & Chemical Corporation
18.4.1 Company Snapshot
18.4.2 Company Overview
18.4.3 Company Financial Profile
18.4.4 Company Product Benchmarking
18.4.5 Company Recent Developments
18.5 Royal Dutch Shell
18.5.1 Company Snapshot
18.5.2 Company Overview
18.5.3 Company Financial Profile
18.5.4 Company Product Benchmarking
18.5.5 Company Recent Developments
18.6 Chevron Corporation
18.6.1 Company Snapshot
18.6.2 Company Overview
18.6.3 Company Financial Profile
18.6.4 Company Product Benchmarking
18.6.5 Company Technology
18.6.6 Company Recent Developments
18.7 Petroleo Brasileiro S.A
18.7.1 Company Snapshot
18.7.2 Company Overview
18.7.3 Company Financial Profile
18.7.4 Performance and Activities
18.7.5 Main Operations of the Company
18.7.6 Company Product Benchmarking
18.7.7 Company Recent Developments
18.8 LUKOIL
18.8.1 Company Snapshot
18.8.2 Company Overview
18.8.3 Company Financial Profile
18.8.4 Company Product Benchmarking
18.8.5 Company Recent Developments
18.9 Cenovus Energy Inc.
18.9.1 Company Snapshot
18.9.2 Company Overview
18.9.3 Company Financial Profile
18.9.4 Company Operation
18.9.5 Company Recent Developments
18.10 Equinor ASA
18.10.1 Company Snapshot
18.10.2 Company Overview
18.10.3 Company Financial Profile
18.10.4 Company Product Benchmarking
18.10.5 Company Recent Developments
18.11 Abu Dhabi National Oil Company
18.11.1. Company Snapshot
18.11.2 Company Overview
18.11.3 Company Financial Profile
18.11.4 Company Product Benchmarking
18.11.5 Company Recent Developments
18.12 Air Products & Chemicals Inc.
18.12.1 Company Snapshot
18.12.2 Company Overview
18.12.3 Company Financial Profile
18.12.4 Company Product Benchmarking
18.12.5 Company Recent Developments
18.13 Occidental Petroleum Corporation
18.13.1 Company Snapshot
18.13.2 Company Overview
18.13.3 Company Financial Profile
18.13.4 Company Product Benchmarking
18.13.5 Company Recent Developments
18.14 Chesapeake Energy
18.14.1 Company Snapshot
18.14.2 Company Overview
18.14.3 Company Financial Profile
18.14.4 Company Product Benchmarking
18.14.5 Company Recent Developments
18.15 China National Offshore Oil Corporation (CNOOC)
18.15.1 Company Snapshot
18.15.2 Company Overview
18.15.3 Company Financial Profile
18.15.4 Company Product Benchmarking
18.15.5 Company Recent Developments
18.16 ConocoPhillips
18.16.1 Company Snapshot
18.16.2 Company Overview
18.16.3 Company Financial Profile
18.16.4 Company Product Benchmarking
18.16.5 Company Recent Developments
18.17 Halliburton Company
18.17.1 Company Snapshot
18.17.2 Company Overview
18.17.3 Company Financial Profile
18.17.4 Company Technology
18.17.5 Company Product Benchmarking
18.17.6 Company Recent Developments
18.18 Equinor ASA
18.18.1 Company Snapshot
18.18.2 Company Overview
18.18.3 Company Financial Profile
18.18.4 Company Product Benchmarking
18.18.5 Company Recent Developments
18.19 Schlumderger N.V
18.19.1 Company Snapshot
18.19.2 Company Overview
18.19.3 Company Financial Profile
18.19.4 Company Product Benchmarking
18.19.5 Company Recent Developments
18.20 Kinder Morgan, Inc
18.20.1 Company Snapshot
18.20.2 Company Overview
18.20.3 Company Financial Profile
18.20.4 Company Product Benchmarking
18.20.5 Company Recent Developments
19 Conclusion and Recommendations
19.1 Recommendations
20 Glossary Terms
List of Tables
Table 1. Global CO2 Enhanced Oil Recovery Market Forecast, 2021-2031 (USD Mn, AGR (%), CAGR (%))
Table 2. Global CO2 Enhanced Oil Recovery Market Snapshot, 2021 & 2031 (US$million, CAGR %)
Table 3. Global CO2 Enhanced Oil Recovery Market Forecast, 2021-2031 (USD Mn, AGR (%), CAGR (%))
Table 4. Global CO2 Enhanced Oil Recovery Market Forecast, 2021-2031 (USD Mn, AGR (%), CAGR (%)) (V-Shaped Recovery)
Table 5. Global CO2 Enhanced Oil Recovery Market Forecast, 2021-2031 (USD Mn, AGR (%), CAGR (%))(W-Shaped Recovery)
Table 6. Global CO2 Enhanced Oil Recovery Market Forecast, 2021-2031 (USD Mn, AGR (%), CAGR (%))(U-Shaped Recovery)
Table 7. Global CO2 Enhanced Oil Recovery Market Forecast, 2021-2031 (USD Mn, AGR (%), CAGR (%))(L-Shaped Recovery)
Table 8. Global CO2 Enhanced Oil Recovery Market Forecast, 2021-2031 (USD Mn, AGR (%), CAGR (%))
Table 9. Global CO2 Enhanced Oil Recovery Market Forecast, 2021-2031 (USD Mn, AGR (%), CAGR (%))(V-Shaped Recovery)
Table 10. Global CO2 Enhanced Oil Recovery Market Forecast, 2021-2031 (USD Mn, AGR (%), CAGR (%))(W-Shaped Recovery)
Table 11. Global CO2 Enhanced Oil Recovery Market Forecast, 2021-2031 (USD Mn, AGR (%), CAGR (%))(U-Shaped Recovery)
Table 12. Global CO2 Enhanced Oil Recovery Market Forecast, 2021-2031 (USD Mn, AGR (%), CAGR (%))(L-Shaped Recovery)
Table 13. Global CO2 Enhanced Oil Recovery Market Forecast by Production, 2021-2031 (MBPD, AGR (%), CAGR (%))
Table 14. Global CO2 Enhanced Oil Recovery Market Forecast by Production, 2021-2031 (MBPD, AGR (%), CAGR (%))(V-Shaped Recovery)
Table 15. Global CO2 Enhanced Oil Recovery Market Forecast by Production, 2021-2031 (MBPD, AGR (%), CAGR (%))(W-Shaped Recovery)
Table 16. Global CO2 Enhanced Oil Recovery Market Forecast by Production, 2021-2031 (MBPD, AGR (%), CAGR (%))(U-Shaped Recovery)
Table 17. Global CO2 Enhanced Oil Recovery Market Forecast by Production, 2021-2031 (MBPD, AGR (%), CAGR (%))(L-Shaped Recovery)
Table 18. Global CO2 Enhanced Oil Recovery Market Forecast by Type, 2021-2031 (MBPD, AGR (%), CAGR (%))
Table 19. Global CO2 Enhanced Oil Recovery Market Forecast by Type, 2021-2031 (MBPD, AGR (%), CAGR (%))(V-Shaped Recovery)
Table 20. Global CO2 Enhanced Oil Recovery Market Forecast by Type, 2021-2031 (MBPD, AGR (%), CAGR (%))(W-Shaped Recovery)
Table 21. Global CO2 Enhanced Oil Recovery Market Forecast by Type, 2021-2031 (MBPD, AGR (%), CAGR (%))(U-Shaped Recovery)
Table 22. Global CO2 Enhanced Oil Recovery Market Forecast by Type, 2021-2031 (MBPD, AGR (%), CAGR (%))(L-Shaped Recovery)
Table 23. Global CO2 Enhanced Oil Recovery Market by CO2 Source, 2021-2031 (USD Million, AGR (%), CAGR (%))
Table 24. Global CO2 Enhanced Oil Recovery Market by CO2 Source, 2021-2031 (USD Million, AGR (%), CAGR (%))(V-Shaped Recovery)
Table 25. Global CO2 Enhanced Oil Recovery Market by CO2 Source, 2021-2031 (USD Million, AGR (%), CAGR (%))(W-Shaped Recovery)
Table 26. Global CO2 Enhanced Oil Recovery Market by CO2 Source, 2021-2031 (USD Million, AGR (%), CAGR (%))(U-Shaped Recovery)
Table 27. Global CO2 Enhanced Oil Recovery Market by CO2 Source, 2021-2031 (USD Million, AGR (%), CAGR (%))(L-Shaped Recovery)
Table 28. Global CO2 Enhanced Oil Recovery Market by Equipment, 2021-2031 (USD Million, AGR (%), CAGR (%))
Table 29. Global CO2 Enhanced Oil Recovery Market by Equipment, 2021-2031 (USD Million, AGR (%), CAGR (%))(V-Shaped Recovery)
Table 30. Global CO2 Enhanced Oil Recovery Market by Equipment, 2021-2031 (USD Million, AGR (%), CAGR (%))(W-Shaped Recovery)
Table 31. Global CO2 Enhanced Oil Recovery Market by Equipment, 2021-2031 (USD Million, AGR (%), CAGR (%))(U-Shaped Recovery)
Table 32. Global CO2 Enhanced Oil Recovery Market by Equipment, 2021-2031 (USD Million, AGR (%), CAGR (%))(L-Shaped Recovery)
Table 33. Global CO2 Enhanced Oil Recovery Market by Region, 2021-2031 (USD Mn, AGR (%), CAGR (%))
Table 34. Global CO2 Enhanced Oil Recovery Market by Region, 2021-2031 (USD Mn, AGR (%), CAGR (%))(V-Shaped Recovery)
Table 35. Global CO2 Enhanced Oil Recovery Market by Region, 2021-2031 (USD Mn, AGR (%), CAGR (%))(W-Shaped Recovery)
Table 36. Global CO2 Enhanced Oil Recovery Market by Region, 2021-2031 (USD Mn, AGR (%), CAGR (%))(U-Shaped Recovery)
Table 37. Global CO2 Enhanced Oil Recovery Market by Region, 2021-2031 (USD Mn, AGR (%), CAGR (%))(L-Shaped Recovery)
Table 38. Global CO2 Enhanced Oil Recovery Market by Region 2021-2031 (MBPD, AGR (%), CAGR (%))
Table 39. Global CO2 Enhanced Oil Recovery Market by Region, 2021-2031 (MBPD, AGR (%), CAGR (%))(V-Shaped Recovery)
Table 40. Global CO2 Enhanced Oil Recovery Market by Region, 2021-2031 (MBPD, AGR (%), CAGR (%))(W-Shaped Recovery)
Table 41. Global CO2 Enhanced Oil Recovery Market by Region, 2021-2031 (MBPD, AGR (%), CAGR (%))(U-Shaped Recovery)
Table 42. Global CO2 Enhanced Oil Recovery Market by Region, 2021-2031 (MBPD, AGR (%), CAGR (%))(L-Shaped Recovery)
Table 43. North America CO2 Enhanced Oil Recovery Market Forecast, 2021-2031 (USD Mn, AGR (%), CAGR (%))
Table 44. North America CO2 Enhanced Oil Recovery Market Forecast, 2021-2031 (USD Mn, AGR (%), CAGR (%))(V-Shaped Recovery)
Table 45. North America CO2 Enhanced Oil Recovery Market Forecast, 2021-2031 (USD Mn, AGR (%), CAGR (%))(W-Shaped Recovery)
Table 46. North America CO2 Enhanced Oil Recovery Market Forecast, 2021-2031 (USD Mn, AGR (%), CAGR (%))(U-Shaped Recovery)
Table 47. North America CO2 Enhanced Oil Recovery Market Forecast, 2021-2031 (USD Mn, AGR (%), CAGR (%))(L-Shaped Recovery)
Table 48. North America CO2 Enhanced Oil Recovery Market Forecast, 2021-2031 (USD Mn, AGR (%), CAGR (%))
Table 49. North America CO2 Enhanced Oil Recovery Market Forecast, 2021-2031 (USD Mn, AGR (%), CAGR (%))(V-Shaped Recovery)
Table 50. North America CO2 Enhanced Oil Recovery Market Forecast, 2021-2031 (USD Mn, AGR (%), CAGR (%))(W-Shaped Recovery)
Table 51. North America CO2 Enhanced Oil Recovery Market Forecast, 2021-2031 (USD Mn, AGR (%), CAGR (%))(U-Shaped Recovery)
Table 52. North America CO2 Enhanced Oil Recovery Market Forecast, 2021-2031 (USD Mn, AGR (%), CAGR (%))(L-Shaped Recovery)
Table 53. North America CO2 Enhanced Oil Recovery Market Forecast by Production, 2021-2031 (MBPD, AGR (%), CAGR (%))
Table 54. North America CO2 Enhanced Oil Recovery Market Forecast by Production, 2021-2031 (MBPD, AGR (%), CAGR (%))(V-Shaped Recovery)
Table 55. North America CO2 Enhanced Oil Recovery Market Forecast by Production, 2021-2031 (MBPD, AGR (%), CAGR (%))(W-Shaped Recovery)
Table 56. North America CO2 Enhanced Oil Recovery Market Forecast by Production, 2021-2031 (MBPD, AGR (%), CAGR (%))(U-Shaped Recovery)
Table 57. North America CO2 Enhanced Oil Recovery Market Forecast by Production, 2021-2031 (MBPD, AGR (%), CAGR (%))(L-Shaped Recovery)
Table 58. North America CO2 Enhanced Oil Recovery Market Forecast by Type, 2021-2031 (MBPD, AGR (%), CAGR (%))
Table 59. North America CO2 Enhanced Oil Recovery Market Forecast by Type, 2021-2031 (MBPD, AGR (%), CAGR (%))(V-Shaped Recovery)
Table 60. North America CO2 Enhanced Oil Recovery Market Forecast by Type, 2021-2031 (MBPD, AGR (%), CAGR (%))(W-Shaped Recovery)
Table 61. North America CO2 Enhanced Oil Recovery Market Forecast by Type, 2021-2031 (MBPD, AGR (%), CAGR (%))(U-Shaped Recovery)
Table 62. North America CO2 Enhanced Oil Recovery Market Forecast by Type, 2021-2031 (MBPD, AGR (%), CAGR (%))(L-Shaped Recovery)
Table 63. North America CO2 Enhanced Oil Recovery Market by CO2 Source, 2021-2031 (USD Million, AGR (%), CAGR (%))
Table 64. North America CO2 Enhanced Oil Recovery Market by CO2 Source, 2021-2031 (USD Million, AGR (%), CAGR (%))(V-Shaped Recovery)
Table 65. North America CO2 Enhanced Oil Recovery Market by CO2 Source, 2021-2031 (USD Million, AGR (%), CAGR (%))(W-Shaped Recovery)
Table 66. North America CO2 Enhanced Oil Recovery Market by CO2 Source, 2021-2031 (USD Million, AGR (%), CAGR (%))(U-Shaped Recovery)
Table 67. North America CO2 Enhanced Oil Recovery Market by CO2 Source, 2021-2031 (USD Million, AGR (%), CAGR (%))(L-Shaped Recovery)
Table 68. North America CO2 Enhanced Oil Recovery Market by Equipment, 2021-2031 (USD Million, AGR (%), CAGR (%))
Table 69. North America CO2 Enhanced Oil Recovery Market by Equipment, 2021-2031 (USD Million, AGR (%), CAGR (%))(V-Shaped Recovery)
Table 70. North America CO2 Enhanced Oil Recovery Market by Equipment, 2021-2031 (USD Million, AGR (%), CAGR (%))(W-Shaped Recovery)
Table 71. North America CO2 Enhanced Oil Recovery Market by Equipment, 2021-2031 (USD Million, AGR (%), CAGR (%))(U-Shaped Recovery)
Table 72. North America CO2 Enhanced Oil Recovery Market by Equipment, 2021-2031 (USD Million, AGR (%), CAGR (%))(L-Shaped Recovery)
Table 73. North America CO2 Enhanced Oil Recovery Market by Country, 2021-2031 (USD Mn, AGR (%), CAGR (%))
Table 74. North America CO2 Enhanced Oil Recovery Market by Country, 2021-2031 (USD Mn, AGR (%), CAGR (%))(V-Shaped Recovery)
Table 75. North America CO2 Enhanced Oil Recovery Market by Country, 2021-2031 (USD Mn, AGR (%), CAGR (%))(W-Shaped Recovery)
Table 76. North America CO2 Enhanced Oil Recovery Market by Country, 2021-2031 (USD Mn, AGR (%), CAGR (%))(U-Shaped Recovery)
Table 77. North America CO2 Enhanced Oil Recovery Market by Country, 2021-2031 (USD Mn, AGR (%), CAGR (%))(L-Shaped Recovery)
Table 78. North America CO2 Enhanced Oil Recovery Market by Country, 2021-2031 (MBPD, AGR (%), CAGR (%))
Table 79. North America CO2 Enhanced Oil Recovery Market by Country, 2021-2031 (MBPD, AGR (%), CAGR (%))(V-Shaped Recovery)
Table 80. North America CO2 Enhanced Oil Recovery Market by Country, 2021-2031 (MBPD, AGR (%), CAGR (%))(W-Shaped Recovery)
Table 81. North America CO2 Enhanced Oil Recovery Market by Country, 2021-2031 (MBPD, AGR (%), CAGR (%))(U-Shaped Recovery)
Table 82. North America CO2 Enhanced Oil Recovery Market by Country, 2021-2031 (MBPD, AGR (%), CAGR (%))(L-Shaped Recovery)
Table 83. Europe CO2 Enhanced Oil Recovery Market Forecast, 2021-2031 (USD Mn, AGR (%), CAGR (%))
Table 84. Europe CO2 Enhanced Oil Recovery Market Forecast, 2021-2031 (USD Mn, AGR (%), CAGR (%))( V-Shaped Recovery)
Table 85. Europe CO2 Enhanced Oil Recovery Market Forecast, 2021-2031 (USD Mn, AGR (%), CAGR (%))( W-Shaped Recovery)
Table 86. Europe CO2 Enhanced Oil Recovery Market Forecast, 2021-2031 (USD Mn, AGR (%), CAGR (%))( U-Shaped Recovery)
Table 87. Europe CO2 Enhanced Oil Recovery Market Forecast, 2021-2031 (USD Mn, AGR (%), CAGR (%))( L-Shaped Recovery)
Table 88. Europe CO2 Enhanced Oil Recovery Market Forecast, 2021-2031 (USD Mn, AGR (%), CAGR (%))
Table 89. Europe CO2 Enhanced Oil Recovery Market Forecast, 2021-2031 (USD Mn, AGR (%), CAGR (%))( V-Shaped Recovery)
Table 90. Europe CO2 Enhanced Oil Recovery Market Forecast, 2021-2031 (USD Mn, AGR (%), CAGR (%))( W-Shaped Recovery)
Table 91. Europe CO2 Enhanced Oil Recovery Market Forecast, 2021-2031 (USD Mn, AGR (%), CAGR (%))( U-Shaped Recovery)
Table 92. Europe CO2 Enhanced Oil Recovery Market Forecast, 2021-2031 (USD Mn, AGR (%), CAGR (%))( L-Shaped Recovery)
Table 93. Europe CO2 Enhanced Oil Recovery Market Forecast by Production, 2021-2031 (MBPD, AGR (%), CAGR (%))
Table 94. Europe CO2 Enhanced Oil Recovery Market Forecast by Production, 2021-2031 (MBPD, AGR (%), CAGR (%))( V-Shaped Recovery)
Table 95. Europe CO2 Enhanced Oil Recovery Market Forecast by Production, 2021-2031 (MBPD, AGR (%), CAGR (%))( W-Shaped Recovery)
Table 96. Europe CO2 Enhanced Oil Recovery Market Forecast by Production, 2021-2031 (MBPD, AGR (%), CAGR (%))( U-Shaped Recovery)
Table 97. Europe CO2 Enhanced Oil Recovery Market Forecast by Production, 2021-2031 (MBPD, AGR (%), CAGR (%))( L-Shaped Recovery)
Table 98. Europe CO2 Enhanced Oil Recovery Market Forecast by Type, 2021-2031 (MBPD, AGR (%), CAGR (%))
Table 99. Europe CO2 Enhanced Oil Recovery Market Forecast by Type, 2021-2031 (MBPD, AGR (%), CAGR (%))( V-Shaped Recovery)
Table 100. Europe CO2 Enhanced Oil Recovery Market Forecast by Type, 2021-2031 (MBPD, AGR (%), CAGR (%))( W-Shaped Recovery)
Table 101. Europe CO2 Enhanced Oil Recovery Market Forecast by Type, 2021-2031 (MBPD, AGR (%), CAGR (%))( U-Shaped Recovery)
Table 102. Europe CO2 Enhanced Oil Recovery Market Forecast by Type, 2021-2031 (MBPD, AGR (%), CAGR (%))( L-Shaped Recovery)
Table 103. Europe CO2 Enhanced Oil Recovery Market by CO2 Source, 2021-2031 (USD Million, AGR (%), CAGR (%))
Table 104. Europe CO2 Enhanced Oil Recovery Market by CO2 Source, 2021-2031 (USD Million, AGR (%), CAGR (%))( V-Shaped Recovery)
Table 105. Europe CO2 Enhanced Oil Recovery Market by CO2 Source, 2021-2031 (USD Million, AGR (%), CAGR (%))( W-Shaped Recovery)
Table 106. Europe CO2 Enhanced Oil Recovery Market by CO2 Source, 2021-2031 (USD Million, AGR (%), CAGR (%))( U-Shaped Recovery)
Table 107. Europe CO2 Enhanced Oil Recovery Market by CO2 Source, 2021-2031 (USD Million, AGR (%), CAGR (%))( L-Shaped Recovery)
Table 108. Europe CO2 Enhanced Oil Recovery Market by Equipment, 2021-2031 (USD Million, AGR (%), CAGR (%))
Table 109. Europe CO2 Enhanced Oil Recovery Market by Equipment, 2021-2031 (USD Million, AGR (%), CAGR (%))( V-Shaped Recovery)
Table 110. Europe CO2 Enhanced Oil Recovery Market by Equipment, 2021-2031 (USD Million, AGR (%), CAGR (%))( W-Shaped Recovery)
Table 111. Europe CO2 Enhanced Oil Recovery Market by Equipment, 2021-2031 (USD Million, AGR (%), CAGR (%))( U-Shaped Recovery)
Table 112. Europe CO2 Enhanced Oil Recovery Market by Equipment, 2021-2031 (USD Million, AGR (%), CAGR (%))( L-Shaped Recovery)
Table 113. Europe CO2 Enhanced Oil Recovery Market by Country, 2021-2031 (USD Mn, AGR (%), CAGR (%))
Table 114. Europe CO2 Enhanced Oil Recovery Market by Country, 2021-2031 (USD Mn, AGR (%), CAGR (%))( V-Shaped Recovery)
Table 115. Europe CO2 Enhanced Oil Recovery Market by Country, 2021-2031 (USD Mn, AGR (%), CAGR (%))( W-Shaped Recovery)
Table 116. Europe CO2 Enhanced Oil Recovery Market by Country, 2021-2031 (USD Mn, AGR (%), CAGR (%))( U-Shaped Recovery)
Table 117. Europe CO2 Enhanced Oil Recovery Market by Country, 2021-2031 (USD Mn, AGR (%), CAGR (%))( L-Shaped Recovery)
Table 118. Europe CO2 Enhanced Oil Recovery Market by Country, 2021-2031 (MBPD, AGR (%), CAGR (%))
Table 119. Europe CO2 Enhanced Oil Recovery Market by Country, 2021-2031 (MBPD, AGR (%), CAGR (%))( V-Shaped Recovery)
Table 120. Europe CO2 Enhanced Oil Recovery Market by Country, 2021-2031 (MBPD, AGR (%), CAGR (%))( W-Shaped Recovery)
Table 121. Europe CO2 Enhanced Oil Recovery Market by Country, 2021-2031 (MBPD, AGR (%), CAGR (%))( U-Shaped Recovery)
Table 122. Europe CO2 Enhanced Oil Recovery Market by Country, 2021-2031 (MBPD, AGR (%), CAGR (%))( L-Shaped Recovery)
Table 123. Asia-Pacific CO2 Enhanced Oil Recovery Market Forecast, 2021-2031 (USD Mn, AGR (%), CAGR (%))
Table 124. Asia-Pacific CO2 Enhanced Oil Recovery Market Forecast, 2021-2031 (USD Mn, AGR (%), CAGR (%))(V-Shaped Recovery)
Table 125. Asia-Pacific CO2 Enhanced Oil Recovery Market Forecast, 2021-2031 (USD Mn, AGR (%), CAGR (%))(W-Shaped Recovery)
Table 126. Asia-Pacific CO2 Enhanced Oil Recovery Market Forecast, 2021-2031 (USD Mn, AGR (%), CAGR (%))(U-Shaped Recovery)
Table 127. Asia-Pacific CO2 Enhanced Oil Recovery Market Forecast, 2021-2031 (USD Mn, AGR (%), CAGR (%))(L-Shaped Recovery)
Table 128. Asia-Pacific CO2 Enhanced Oil Recovery Market Forecast, 2021-2031 (USD Mn, AGR (%), CAGR (%))
Table 129. Asia-Pacific CO2 Enhanced Oil Recovery Market Forecast, 2021-2031 (USD Mn, AGR (%), CAGR (%))(V-Shaped Recovery)
Table 130. Asia-Pacific CO2 Enhanced Oil Recovery Market Forecast, 2021-2031 (USD Mn, AGR (%), CAGR (%))(W-Shaped Recovery)
Table 131. Asia-Pacific CO2 Enhanced Oil Recovery Market Forecast, 2021-2031 (USD Mn, AGR (%), CAGR (%))(U-Shaped Recovery)
Table 132. Asia-Pacific CO2 Enhanced Oil Recovery Market Forecast, 2021-2031 (USD Mn, AGR (%), CAGR (%))(L-Shaped Recovery)
Table 133. Asia-Pacific CO2 Enhanced Oil Recovery Market Forecast by Production, 2021-2031 (MBPD, AGR (%), CAGR (%))
Table 134. Asia-Pacific CO2 Enhanced Oil Recovery Market Forecast by Production, 2021-2031 (MBPD, AGR (%), CAGR (%))(V-Shaped Recovery)
Table 135. Asia-Pacific CO2 Enhanced Oil Recovery Market Forecast by Production, 2021-2031 (MBPD, AGR (%), CAGR (%))(W-Shaped Recovery)
Table 136. Asia-Pacific CO2 Enhanced Oil Recovery Market Forecast by Production, 2021-2031 (MBPD, AGR (%), CAGR (%))(U-Shaped Recovery)
Table 137. Asia-Pacific CO2 Enhanced Oil Recovery Market Forecast by Production, 2021-2031 (MBPD, AGR (%), CAGR (%))(L-Shaped Recovery)
Table 138. Asia-Pacific CO2 Enhanced Oil Recovery Market Forecast by Type, 2021-2031 (MBPD, AGR (%), CAGR (%))
Table 139. Asia-Pacific CO2 Enhanced Oil Recovery Market Forecast by Type, 2021-2031 (MBPD, AGR (%), CAGR (%))(V-Shaped Recovery)
Table 140. Asia-Pacific CO2 Enhanced Oil Recovery Market Forecast by Type, 2021-2031 (MBPD, AGR (%), CAGR (%))(W-Shaped Recovery)
Table 141. Asia-Pacific CO2 Enhanced Oil Recovery Market Forecast by Type, 2021-2031 (MBPD, AGR (%), CAGR (%))(U-Shaped Recovery)
Table 142. Asia-Pacific CO2 Enhanced Oil Recovery Market Forecast by Type, 2021-2031 (MBPD, AGR (%), CAGR (%))(L-Shaped Recovery)
Table 143. Asia-Pacific CO2 Enhanced Oil Recovery Market by CO2 Source, 2021-2031 (USD Million, AGR (%), CAGR (%))
Table 144. Asia-Pacific CO2 Enhanced Oil Recovery Market by CO2 Source, 2021-2031 (USD Million, AGR (%), CAGR (%))(V-Shaped Recovery)
Table 145. Asia-Pacific CO2 Enhanced Oil Recovery Market by CO2 Source, 2021-2031 (USD Million, AGR (%), CAGR (%))(W-Shaped Recovery)
Table 146. Asia-Pacific CO2 Enhanced Oil Recovery Market by CO2 Source, 2021-2031 (USD Million, AGR (%), CAGR (%))(U-Shaped Recovery)
Table 147. Asia-Pacific CO2 Enhanced Oil Recovery Market by CO2 Source, 2021-2031 (USD Million, AGR (%), CAGR (%))(L-Shaped Recovery)
Table 148. Asia-Pacific CO2 Enhanced Oil Recovery Market by Equipment, 2021-2031 (USD Million, AGR (%), CAGR (%))
Table 149. Asia-Pacific CO2 Enhanced Oil Recovery Market by Equipment, 2021-2031 (USD Million, AGR (%), CAGR (%))(V-Shaped Recovery)
Table 150. Asia-Pacific CO2 Enhanced Oil Recovery Market by Equipment, 2021-2031 (USD Million, AGR (%), CAGR (%))(W-Shaped Recovery)
Table 151. Asia-Pacific CO2 Enhanced Oil Recovery Market by Equipment, 2021-2031 (USD Million, AGR (%), CAGR (%))(U-Shaped Recovery)
Table 152. Asia-Pacific CO2 Enhanced Oil Recovery Market by Equipment, 2021-2031 (USD Million, AGR (%), CAGR (%))(L-Shaped Recovery)
Table 153. Asia-Pacific CO2 Enhanced Oil Recovery Market by Country, 2021-2031 (USD Mn, AGR (%), CAGR (%))
Table 154. Asia-Pacific CO2 Enhanced Oil Recovery Market by Country, 2021-2031 (USD Mn, AGR (%), CAGR (%))(V-Shaped Recovery)
Table 155. Asia-Pacific CO2 Enhanced Oil Recovery Market by Country, 2021-2031 (USD Mn, AGR (%), CAGR (%))(W-Shaped Recovery)
Table 156. Asia-Pacific CO2 Enhanced Oil Recovery Market by Country, 2021-2031 (USD Mn, AGR (%), CAGR (%))(U-Shaped Recovery)
Table 157. Asia-Pacific CO2 Enhanced Oil Recovery Market by Country, 2021-2031 (USD Mn, AGR (%), CAGR (%))(L-Shaped Recovery)
Table 158. Asia-Pacific CO2 Enhanced Oil Recovery Market by Country, 2021-2031 (MBPD, AGR (%), CAGR (%))
Table 159. Asia-Pacific CO2 Enhanced Oil Recovery Market by Country, 2021-2031 (MBPD, AGR (%), CAGR (%))(V-Shaped Recovery)
Table 160. Asia-Pacific CO2 Enhanced Oil Recovery Market by Country, 2021-2031 (MBPD, AGR (%), CAGR (%))(W-Shaped Recovery)
Table 161. Asia-Pacific CO2 Enhanced Oil Recovery Market by Country, 2021-2031 (MBPD, AGR (%), CAGR (%))(U-Shaped Recovery)
Table 162. Asia-Pacific CO2 Enhanced Oil Recovery Market by Country, 2021-2031 (MBPD, AGR (%), CAGR (%))(L-Shaped Recovery)
Table 163. Latin America CO2 Enhanced Oil Recovery Market Forecast, 2021-2031 (USD Mn, AGR (%), CAGR (%))
Table 164. Latin America CO2 Enhanced Oil Recovery Market Forecast, 2021-2031 (USD Mn, AGR (%), CAGR (%))(V-Shaped Recovery)
Table 165. Latin America CO2 Enhanced Oil Recovery Market Forecast, 2021-2031 (USD Mn, AGR (%), CAGR (%))(W-Shaped Recovery)
Table 166. Latin America CO2 Enhanced Oil Recovery Market Forecast, 2021-2031 (USD Mn, AGR (%), CAGR (%))(U-Shaped Recovery)
Table 167. Latin America CO2 Enhanced Oil Recovery Market Forecast, 2021-2031 (USD Mn, AGR (%), CAGR (%))(L-Shaped Recovery)
Table 168. Latin America CO2 Enhanced Oil Recovery Market Forecast, 2021-2031 (USD Mn, AGR (%), CAGR (%))
Table 169. Latin America CO2 Enhanced Oil Recovery Market Forecast, 2021-2031 (USD Mn, AGR (%), CAGR (%))(V-Shaped Recovery)
Table 170. Latin America CO2 Enhanced Oil Recovery Market Forecast, 2021-2031 (USD Mn, AGR (%), CAGR (%))(W-Shaped Recovery)
Table 171. Latin America CO2 Enhanced Oil Recovery Market Forecast, 2021-2031 (USD Mn, AGR (%), CAGR (%))(U-Shaped Recovery)
Table 172. Latin America CO2 Enhanced Oil Recovery Market Forecast, 2021-2031 (USD Mn, AGR (%), CAGR (%))(L-Shaped Recovery)
Table 173. Latin America CO2 Enhanced Oil Recovery Market Forecast by Production, 2021-2031 (MBPD, AGR (%), CAGR (%))
Table 174. Latin America CO2 Enhanced Oil Recovery Market Forecast by Production, 2021-2031 (MBPD, AGR (%), CAGR (%))(V-Shaped Recovery)
Table 175. Latin America CO2 Enhanced Oil Recovery Market Forecast by Production, 2021-2031 (MBPD, AGR (%), CAGR (%))(W-Shaped Recovery)
Table 176. Latin America CO2 Enhanced Oil Recovery Market Forecast by Production, 2021-2031 (MBPD, AGR (%), CAGR (%))(U-Shaped Recovery)
Table 177. Latin America CO2 Enhanced Oil Recovery Market Forecast by Production, 2021-2031 (MBPD, AGR (%), CAGR (%))(L-Shaped Recovery)
Table 178. Latin America CO2 Enhanced Oil Recovery Market Forecast by Type, 2021-2031 (MBPD, AGR (%), CAGR (%))
Table 179. Latin America CO2 Enhanced Oil Recovery Market Forecast by Type, 2021-2031 (MBPD, AGR (%), CAGR (%))(V-Shaped Recovery)
Table 180. Latin America CO2 Enhanced Oil Recovery Market Forecast by Type, 2021-2031 (MBPD, AGR (%), CAGR (%))(W-Shaped Recovery)
Table 181. Latin America CO2 Enhanced Oil Recovery Market Forecast by Type, 2021-2031 (MBPD, AGR (%), CAGR (%))(U-Shaped Recovery)
Table 182. Latin America CO2 Enhanced Oil Recovery Market Forecast by Type, 2021-2031 (MBPD, AGR (%), CAGR (%))(L-Shaped Recovery)
Table 183. Latin America CO2 Enhanced Oil Recovery Market by CO2 Source, 2021-2031 (USD Million, AGR (%), CAGR (%))
Table 184. Latin America CO2 Enhanced Oil Recovery Market by CO2 Source, 2021-2031 (USD Million, AGR (%), CAGR (%))(V-Shaped Recovery)
Table 185. Latin America CO2 Enhanced Oil Recovery Market by CO2 Source, 2021-2031 (USD Million, AGR (%), CAGR (%))(W-Shaped Recovery)
Table 186. Latin America CO2 Enhanced Oil Recovery Market by CO2 Source, 2021-2031 (USD Million, AGR (%), CAGR (%))(U-Shaped Recovery)
Table 187. Latin America CO2 Enhanced Oil Recovery Market by CO2 Source, 2021-2031 (USD Million, AGR (%), CAGR (%))(L-Shaped Recovery)
Table 188. Latin America CO2 Enhanced Oil Recovery Market by Equipment, 2021-2031 (USD Million, AGR (%), CAGR (%))
Table 189. Latin America CO2 Enhanced Oil Recovery Market by Equipment, 2021-2031 (USD Million, AGR (%), CAGR (%))(V-Shaped Recovery)
Table 190. Latin America CO2 Enhanced Oil Recovery Market by Equipment, 2021-2031 (USD Million, AGR (%), CAGR (%))(W-Shaped Recovery)
Table 191. Latin America CO2 Enhanced Oil Recovery Market by Equipment, 2021-2031 (USD Million, AGR (%), CAGR (%))(U-Shaped Recovery)
Table 192. Latin America CO2 Enhanced Oil Recovery Market by Equipment, 2021-2031 (USD Million, AGR (%), CAGR (%))(L-Shaped Recovery)
Table 193. Latin America CO2 Enhanced Oil Recovery Market by Country, 2021-2031 (USD Mn, AGR (%), CAGR (%))
Table 194. Latin America CO2 Enhanced Oil Recovery Market by Country, 2021-2031 (USD Mn, AGR (%), CAGR (%))(V-Shaped Recovery)
Table 195. Latin America CO2 Enhanced Oil Recovery Market by Country, 2021-2031 (USD Mn, AGR (%), CAGR (%))(W-Shaped Recovery)
Table 196. Latin America CO2 Enhanced Oil Recovery Market by Country, 2021-2031 (USD Mn, AGR (%), CAGR (%))(U-Shaped Recovery)
Table 197. Latin America CO2 Enhanced Oil Recovery Market by Country, 2021-2031 (USD Mn, AGR (%), CAGR (%))(L-Shaped Recovery)
Table 198. Latin America CO2 Enhanced Oil Recovery Market by Country, 2021-2031 (MBPD, AGR (%), CAGR (%))
Table 199. Latin America CO2 Enhanced Oil Recovery Market by Country, 2021-2031 (MBPD, AGR (%), CAGR (%))(V-Shaped Recovery)
Table 200. Latin America CO2 Enhanced Oil Recovery Market by Country, 2021-2031 (MBPD, AGR (%), CAGR (%))(W-Shaped Recovery)
Table 201. Latin America CO2 Enhanced Oil Recovery Market by Country, 2021-2031 (MBPD, AGR (%), CAGR (%))(U-Shaped Recovery)
Table 202. Latin America CO2 Enhanced Oil Recovery Market by Country, 2021-2031 (MBPD, AGR (%), CAGR (%))(L-Shaped Recovery)
Table 203. Middle East & Africa CO2 Enhanced Oil Recovery Market Forecast, 2021-2031 (USD Mn, AGR (%), CAGR (%))
Table 204. Middle East & Africa CO2 Enhanced Oil Recovery Market Forecast, 2021-2031 (USD Mn, AGR (%), CAGR (%))(V-Shaped Recovery)
Table 205. Middle East & Africa CO2 Enhanced Oil Recovery Market Forecast, 2021-2031 (USD Mn, AGR (%), CAGR (%))(W-Shaped Recovery)
Table 206. Middle East & Africa CO2 Enhanced Oil Recovery Market Forecast, 2021-2031 (USD Mn, AGR (%), CAGR (%))(U-Shaped Recovery)
Table 207. Middle East & Africa CO2 Enhanced Oil Recovery Market Forecast, 2021-2031 (USD Mn, AGR (%), CAGR (%))(L-Shaped Recovery)
Table 208. Middle East & Africa CO2 Enhanced Oil Recovery Market Forecast, 2021-2031 (USD Mn, AGR (%), CAGR (%))
Table 209. Middle East & Africa CO2 Enhanced Oil Recovery Market Forecast, 2021-2031 (USD Mn, AGR (%), CAGR (%))(V-Shaped Recovery)
Table 210. Middle East & Africa CO2 Enhanced Oil Recovery Market Forecast, 2021-2031 (USD Mn, AGR (%), CAGR (%))(W-Shaped Recovery)
Table 211. Middle East & Africa CO2 Enhanced Oil Recovery Market Forecast, 2021-2031 (USD Mn, AGR (%), CAGR (%))(U-Shaped Recovery)
Table 212. Middle East & Africa CO2 Enhanced Oil Recovery Market Forecast, 2021-2031 (USD Mn, AGR (%), CAGR (%))(L-Shaped Recovery)
Table 213. Middle East & Africa CO2 Enhanced Oil Recovery Market Forecast by Production, 2021-2031 (MBPD, AGR (%), CAGR (%))
Table 214. Middle East & Africa CO2 Enhanced Oil Recovery Market Forecast by Production, 2021-2031 (MBPD, AGR (%), CAGR (%))(V-Shaped Recovery)
Table 215. Middle East & Africa CO2 Enhanced Oil Recovery Market Forecast by Production, 2021-2031 (MBPD, AGR (%), CAGR (%))(W-Shaped Recovery)
Table 216. Middle East & Africa CO2 Enhanced Oil Recovery Market Forecast by Production, 2021-2031 (MBPD, AGR (%), CAGR (%))(U-Shaped Recovery)
Table 217. Middle East & Africa CO2 Enhanced Oil Recovery Market Forecast by Production, 2021-2031 (MBPD, AGR (%), CAGR (%))(L-Shaped Recovery)
Table 218. Middle East & Africa CO2 Enhanced Oil Recovery Market Forecast by Type, 2021-2031 (MBPD, AGR (%), CAGR (%))
Table 219. Middle East & Africa CO2 Enhanced Oil Recovery Market Forecast by Type, 2021-2031 (MBPD, AGR (%), CAGR (%))(V-Shaped Recovery)
Table 220. Middle East & Africa CO2 Enhanced Oil Recovery Market Forecast by Type, 2021-2031 (MBPD, AGR (%), CAGR (%))(W-Shaped Recovery)
Table 221. Middle East & Africa CO2 Enhanced Oil Recovery Market Forecast by Type, 2021-2031 (MBPD, AGR (%), CAGR (%))(U-Shaped Recovery)
Table 222. Middle East & Africa CO2 Enhanced Oil Recovery Market Forecast by Type, 2021-2031 (MBPD, AGR (%), CAGR (%))(L-Shaped Recovery)
Table 223. Middle East & Africa CO2 Enhanced Oil Recovery Market by CO2 Source, 2021-2031 (USD Million, AGR (%), CAGR (%))
Table 224. Middle East & Africa CO2 Enhanced Oil Recovery Market by CO2 Source, 2021-2031 (USD Million, AGR (%), CAGR (%))(V-Shaped Recovery)
Table 225. Middle East & Africa CO2 Enhanced Oil Recovery Market by CO2 Source, 2021-2031 (USD Million, AGR (%), CAGR (%))(W-Shaped Recovery)
Table 226. Middle East & Africa CO2 Enhanced Oil Recovery Market by CO2 Source, 2021-2031 (USD Million, AGR (%), CAGR (%))(U-Shaped Recovery)
Table 227. Middle East & Africa CO2 Enhanced Oil Recovery Market by CO2 Source, 2021-2031 (USD Million, AGR (%), CAGR (%))(L-Shaped Recovery)
Table 228. Middle East & Africa CO2 Enhanced Oil Recovery Market by Equipment, 2021-2031 (USD Million, AGR (%), CAGR (%))
Table 229. Middle East & Africa CO2 Enhanced Oil Recovery Market by Equipment, 2021-2031 (USD Million, AGR (%), CAGR (%))(V-Shaped Recovery)
Table 230. Middle East & Africa CO2 Enhanced Oil Recovery Market by Equipment, 2021-2031 (USD Million, AGR (%), CAGR (%))(W-Shaped Recovery)
Table 231. Middle East & Africa CO2 Enhanced Oil Recovery Market by Equipment, 2021-2031 (USD Million, AGR (%), CAGR (%))(U-Shaped Recovery)
Table 232. Middle East & Africa CO2 Enhanced Oil Recovery Market by Equipment, 2021-2031 (USD Million, AGR (%), CAGR (%))(L-Shaped Recovery)
Table 233. Middle East & Africa CO2 Enhanced Oil Recovery Market by Country, 2021-2031 (USD Mn, AGR (%), CAGR (%))
Table 234. Middle East & Africa CO2 Enhanced Oil Recovery Market by Country, 2021-2031 (USD Mn, AGR (%), CAGR (%))(V-Shaped Recovery)
Table 235. Middle East & Africa CO2 Enhanced Oil Recovery Market by Country, 2021-2031 (USD Mn, AGR (%), CAGR (%))(W-Shaped Recovery)
Table 236. Middle East & Africa CO2 Enhanced Oil Recovery Market by Country, 2021-2031 (USD Mn, AGR (%), CAGR (%))(U-Shaped Recovery)
Table 237. Middle East & Africa CO2 Enhanced Oil Recovery Market by Country, 2021-2031 (USD Mn, AGR (%), CAGR (%))(L-Shaped Recovery)
Table 238. Middle East & Africa CO2 Enhanced Oil Recovery Market by Country, 2021-2031 (MBPD, AGR (%), CAGR (%))
Table 239. Middle East & Africa CO2 Enhanced Oil Recovery Market by Country, 2021-2031 (MBPD, AGR (%), CAGR (%))(V-Shaped Recovery)
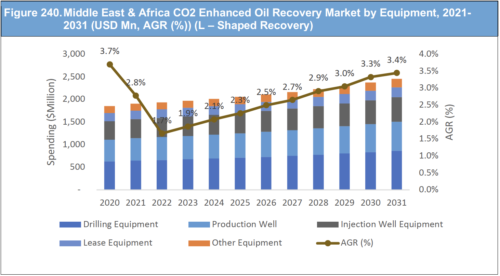
Table 240. Middle East & Africa CO2 Enhanced Oil Recovery Market by Country, 2021-2031 (MBPD, AGR (%), CAGR (%))(W-Shaped Recovery)
Table 241. Middle East & Africa CO2 Enhanced Oil Recovery Market by Country, 2021-2031 (MBPD, AGR (%), CAGR (%))(U-Shaped Recovery)
Table 242. Middle East & Africa CO2 Enhanced Oil Recovery Market by Country, 2021-2031 (MBPD, AGR (%), CAGR (%))(L-Shaped Recovery)
Table 243. Exxon Mobil Corporation.: Company Information
Table 244. Exxon Mobil Corporation.: Company Revenue 2016-2020(US$ Mn, AGR %)
Table 245. Exxon Mobil Corporation.: Company Product and Service Benchmarking
Table 246. Exxon Mobil Corporation.: Company Recent Developments till Feb,2021
Table 247. BP Plc.: Company Information
Table 248. BP Plc.: Company Revenue 2016-2020(US$ Mn, AGR %)
Table 249. BP Plc.: Company Recent Developments till Feb 2021
Table 250. Total SE.: Company Information
Table 251. Total SE.: Company Revenue 2016-2020 (US$ Mn, AGR %)
Table 252. Total SE.: Company Product and Service Benchmarking
Table 253. Total SE.: Company Recent Developments till Feb 2021
Table 254. China Petroleum & Chemical Corporation.: Company Information
Table 255. China Petroleum & Chemical Corporation Company Revenue 2016-2020(US$ Mn, AGR %)
Table 256. China Petroleum & Chemical Corporation Company Product and Service
Table 257. China Petroleum & Chemical Corporation Company Recent Developments till Feb 2021
Table 258. Royal Dutch Shell: Company Information
Table 259. Royal Dutch Shell: Company Revenue 2016-2020(US$ Mn, AGR %)
Table 260. Royal Dutch Shell: Company Product and Service
Table 261. Royal Dutch Shell.: Company Recent Developments till Feb 2021
Table 262. Chevron Corporation.: Company Information
Table 263. Chevron Corporation.: Company Revenue 2016-2020(US$ Mn, AGR %)
Table 264. Chevron Corporation.: Company Product and Service Benchmarking
Table 265. Chevron Corporation.: Company Recent Developments till Mar 2021
Table 266. Petroleo Brasileiro S.A.: Company Information
Table 267. Petroleo Brasileiro S.A.: Company Revenue 2016-2020(US$ Mn, AGR %)
Table 268. Petroleo Brasileiro S.A.: Company Product and Service
Table 269. Petroleo Brasileiro S.A Company Recent Developments till Feb 2021
Table 270. LUKOIL: Company Information
Table 271. LUKOIL: Company Revenue 2016-2020 (US$Mn, AGR %)
Table 272. LUKOIL: Company Product and Service Benchmarking
Table 273. LUKOIL: Company Recent Developments till Apr 2020
Table 274. Cenovus Energy Inc.: Company Information
Table 275. Cenovus Energy Inc.: Company Revenue 2016-2020 (US$ Mn, AGR %)
Table 276. Cenovus Energy Inc .: Company Operation
Table 277. Cenovus Energy Inc .: Company Recent Developments till Feb 2021
Table 278. Equinor ASA.: Company Information
Table 279. Equinor ASA.: Company Revenue 2016-2020 (US$ Mn, AGR %)
Table 280. Equinor ASA.: Company Product and Service
Table 281. Equinor ASA Company Recent Developments till Feb 2021
Table 282. Abu Dhabi National Oil Company: Company Information
Table 283. Abu Dhabi National Oil Company: Company Revenue 2016-2020 (US$Mn, AGR %)
Table 284. Abu Dhabi National Oil Company: Company Product and Service Benchmarking
Table 285. Abu Dhabi National Oil Company: Company Recent Developments till Feb 2020
Table 286. Air Product & Chemicals Inc.: Company Information
Table 287. Air Product & Chemicals Inc.: Company Revenue 2016-2020 (US$Mn, AGR %)
Table 288. Air Product & Chemicals Inc.: Company Product and Service Benchmarking
Table 289. Air Product & Chemicals Inc.: Company Recent Developments till Feb 2021
Table 290. Occidental Petroleum Corporation.: Company Information
Table 291. Occidental Petroleum Corporation.: Company Revenue 2016-2020 (US$ Mn, AGR %)
Table 292. Occidental Petroleum Corporation.: Company Product and Service
Table 293. Occidental Petroleum Corporation.: Company Recent Developments till Feb 2021
Table 294. Chesapeake Energy: Company Information
Table 295. Chesapeake Energy: Company Revenue 2016-2020 (US$Mn, AGR %)
Table 296. Chesapeake Energy: Company Product and Service Benchmarking
Table 297. Chesapeake Energy: Company Recent Developments till Apr 2020
Table 298. China National Offshore Oil Corporation (CNOOC).: Company Information
Table 299. China National Offshore Oil Corporation (CNOOC).: Company Revenue 2016-202(US$ Mn, AGR %)
Table 300. China National Offshore Oil Corporation (CNOOC).: Company Product and Service
Table 301. China National Offshore Oil Corporation (CNOOC): Company Recent Developments till April 2021
Table 302. ConocoPhillips.: Company Information
Table 303. ConocoPhillips.: Company Revenue 2016-2020 (US$ Mn, AGR %)
Table 304. ConocoPhillips.: Company Recent Developments till Feb 2021
Table 305. Halliburton Company .: Company Information
Table 306. Kinder Morgan, Inc.: Company Revenue 2016-2020 (US$ Mn, AGR %)
Table 307. Halliburton Company.: Company Product and Service
Table 308. Halliburton Company Company Recent Developments till Feb 2021
Table 309. Equinor ASA.: Company Information
Table 310. Equinor ASA.: Company Revenue 2016-2020 (US$ Mn, AGR %)
Table 311. Equinor ASA.: Company Product and Service
Table 312. Equinor ASA Company Recent Developments till Feb 2021
Table 313. Schlumderger N.V: Company Information
Table 314. Schlumderger N.V: Company Revenue 2016-2020 (US$ Mn, AGR %)
Table 315. Schlumderger N.V: Company Product and Service Benchmarking
Table 316. Schlumderger N.V: Company Recent Developments till Feb 2021
Table 317. Kinder Morgan, Inc.: Company Information
Table 318. Kinder Morgan, Inc.: Company Revenue 2016-2020 (US$ Mn, AGR %)
Table 319. Kinder Morgan, Inc.: Company Product and Service
Table 320. Kinder Morgan, Inc Company Recent Developments till Mar 2021
Table 321. Glossary Terms
List of Figures
Figure 1. EOR CO2 Production
Figure 2. Global CO2 Enhanced Oil Recovery Market Forecast, 2021-2031 (USD Mn, AGR (%))
Figure 3. Global CO2 Enhanced Oil Recovery Market Segmentation
Figure 4. Current Trends in the Global Market
Figure 5. PESTAL Analysis in the Global CO2 EOR Market
Figure 6. Global CO2 Enhanced Oil Recovery Market Forecast, 2021-2031 (USD Mn, AGR (%))
Figure 7. Global CO2 Enhanced Oil Recovery Market Forecast, 2021-2031 (USD Mn, AGR (%)(V-Shaped Recovery)
Figure 8. Global CO2 Enhanced Oil Recovery Market Forecast, 2021-2031 (USD Mn, AGR (%)) (W-Shaped Recovery)
Figure 9. Global CO2 Enhanced Oil Recovery Market Forecast, 2021-2031 (USD Mn, AGR (%)) (U-Shaped Recovery)
Figure 10. Global CO2 Enhanced Oil Recovery Market Forecast, 2021-2031 (USD Mn, AGR (%)) (L-Shaped Recovery)
Figure 11. Global CO2 Enhanced Oil Recovery Market by Market Forcast, 2021-2031 (USD Mn, AGR (%))
Figure 12. Global CO2 Enhanced Oil Recovery Market by Forecast, 2021-2031 (USD Mn, AGR (%), CAGR (%)) (V-Shaped Recovery)
Figure 13. Global CO2 Enhanced Oil Recovery Market by Forecast, 2021-2031 (USD Mn, AGR (%), CAGR (%)) (W-Shaped Recovery)
Figure 14. Global CO2 Enhanced Oil Recovery Market by Forecast, 2021-2031 (USD Mn, AGR (%), CAGR (%)) (U-Shaped Recovery)
Figure 15. Global CO2 Enhanced Oil Recovery Market by Forecast, 2021-2031 (USD Mn, AGR (%), CAGR (%)) (L-Shaped Recovery)
Figure 16. Global CO2 Enhanced Oil Recovery Market by Production, 2021-2031 (MBPD, AGR (%))
Figure 17. Global CO2 Enhanced Oil Recovery Market by Production, 2021-2031 (MBPD, AGR (%)) (V-Shaped Recovery)
Figure 18. Global CO2 Enhanced Oil Recovery Market by Production, 2021-2031 (MBPD, AGR (%)) (W-Shaped Recovery)
Figure 19. Global CO2 Enhanced Oil Recovery Market by Production, 2021-2031 (MBPD, AGR (%)) (U-Shaped Recovery)
Figure 20. Global CO2 Enhanced Oil Recovery Market by Production, 2021-2031 (MBPD, AGR (%)) (L-Shaped Recovery)
Figure 21. Global CO2 Enhanced Oil Recovery Market By Type, 2021-2031 (USD Mn, AGR (%))
Figure 22. Global CO2 EOR Market by EOR Type, 2021, 2026, 2031 (%)
Figure 23. Global CO2 Enhanced Oil Recovery Market By Type, 2021-2031 (MBPD, AGR (%)) (V-Shaped Recovery)
Figure 24. Global CO2 Enhanced Oil Recovery Market By Type, 2021-2031 (MBPD, AGR (%)) (W-Shaped Recovery)
Figure 25. Global CO2 Enhanced Oil Recovery Market By Type, 2021-2031 (MBPD, AGR (%)) (U-Shaped Recovery)
Figure 26. Global CO2 Enhanced Oil Recovery Market By Type, 2021-2031 (MBPD, AGR (%)) (L-Shaped Recovery)
Figure 27. Global CO2 Enhanced Oil Recovery Market by CO2 Source, 2021-2031 (USD Mn, AGR (%))
Figure 28. Global CO2 EOR Market by CO2 Source, 2021, 2026, 2031 (%)
Figure 29. Global CO2 Enhanced Oil Recovery Market by CO2 Source, 2021-2031 (USD Mn, AGR (%)) (V-Shaped Recovery)
Figure 30. Global CO2 Enhanced Oil Recovery Market by CO2 Source, 2021-2031 (USD Mn, AGR (%)) (W-Shaped Recovery)
Figure 31. Global CO2 Enhanced Oil Recovery Market by CO2 Source, 2021-2031 (USD Mn, AGR (%)) (U-Shaped Recovery)
Figure 32. Global CO2 Enhanced Oil Recovery Market by CO2 Source, 2021-2031 (USD Mn, AGR (%)) (L-Shaped Recovery)
Figure 33. Global CO2 Enhanced Oil Recovery Market by Equipment, 2021-2031 (USD Mn, AGR (%))
Figure 34. Global CO2 EOR Market by Equipment, 2021, 2026, 2031 (%)
Figure 35. Global CO2 Enhanced Oil Recovery Market by Equipment, 2021-2031 (USD Mn, AGR (%)) (V-Shaped Recovery)
Figure 36. Global CO2 Enhanced Oil Recovery Market by Equipment, 2021-2031 (USD Mn, AGR (%)) (W-Shaped Recovery)
Figure 37. Global CO2 Enhanced Oil Recovery Market by Equipment, 2021-2031 (USD Mn, AGR (%)) (U-Shaped Recovery)
Figure 38. Global CO2 Enhanced Oil Recovery Market by Equipment, 2021-2031 (USD Mn, AGR (%)) (L-Shaped Recovery)
Figure 39. Global CO2 Enhanced Oil Recovery Market By Region, 2021-2031 (USD Mn, AGR (%))
Figure 40. Global CO2 EOR Market by Country Spending, 2021, 2026, 2031 (%)
Figure 41. Global CO2 Enhanced Oil Recovery Market by Region, 2021-2031 (USD Mn, AGR (%)) (V-Shaped Recovery)
Figure 42. Global CO2 Enhanced Oil Recovery Market by Region, 2021-2031 (USD Mn, AGR (%)) (W-Shaped Recovery)
Figure 43. Global CO2 Enhanced Oil Recovery Market by Region, 2021-2031 (USD Mn, AGR (%)) (U-Shaped Recovery)
Figure 44. Global CO2 Enhanced Oil Recovery Market by Region, 2021-2031 (USD Mn, AGR (%)) (L-Shaped Recovery)
Figure 45. Global CO2 Enhanced Oil Recovery Market by Region, 2021-2031 (MBPD, AGR (%))
Figure 46. Global CO2 EOR Market by Country Production, 2021, 2026, 2031 (%)
Figure 47. Global CO2 Enhanced Oil Recovery Market by Region, 2021-2031 (MBPD, AGR (%)) (V-Shaped Recovery)
Figure 48. Global CO2 Enhanced Oil Recovery Market by Region, 2021-2031 (MBPD, AGR (%)) (W-Shaped Recovery)
Figure 49. Global CO2 Enhanced Oil Recovery Market by Region, 2021-2031 (MBPD, AGR (%)) (U-Shaped Recovery)
Figure 50. Global CO2 Enhanced Oil Recovery Market by Region, 2021-2031 (MBPD, AGR (%)) (L-Shaped Recovery)
Figure 51. North America CO2 Enhanced Oil Recovery Market Forecast, 2021-2031 (USD Mn, AGR (%))
Figure 52. North America CO2 Enhanced Oil Recovery Market Forecast, 2021-2031 (USD Mn, AGR (%)) (V-Shaped Recovery)
Figure 53. North America CO2 Enhanced Oil Recovery Market Forecast, 2021-2031 (USD Mn, AGR (%)) (W-Shaped Recovery)
Figure 54. North America CO2 Enhanced Oil Recovery Market Forecast, 2021-2031 (USD Mn, AGR (%)) (U-Shaped Recovery)
Figure 55. North America CO2 Enhanced Oil Recovery Market Forecast, 2021-2031 (USD Mn, AGR (%)) (L-Shaped Recovery)
Figure 56. North America CO2 Enhanced Oil Recovery Market by Market Forecast, 2021-2031 (USD Mn, AGR (%))
Figure 57. North America CO2 Enhanced Oil Recovery Market by Forecast, 2021-2031 (USD Mn, AGR (%), CAGR (%)) (V-Shaped Recovery)
Figure 58. North America CO2 Enhanced Oil Recovery Market by Forecast, 2021-2031 (USD Mn, AGR (%), CAGR (%)) (W-Shaped Recovery)
Figure 59. North America CO2 Enhanced Oil Recovery Market by Forecast, 2021-2031 (USD Mn, AGR (%), CAGR (%)) (U-Shaped Recovery)
Figure 60. North America CO2 Enhanced Oil Recovery Market by Forecast, 2021-2031 (USD Mn, AGR (%), CAGR (%)) (L-Shaped Recovery)
Figure 61. North America CO2 Enhanced Oil Recovery Market by Production, 2021-2031 (MBPD, AGR (%))
Figure 62. North America CO2 Enhanced Oil Recovery Market by Production, 2021-2031 (MBPD, AGR (%)) (V-Shaped Recovery)
Figure 63. North America CO2 Enhanced Oil Recovery Market by Production, 2021-2031 (MBPD, AGR (%)) (W-Shaped Recovery)
Figure 64. North America CO2 Enhanced Oil Recovery Market by Production, 2021-2031 (MBPD, AGR (%)) (U-Shaped Recovery)
Figure 65. North America CO2 Enhanced Oil Recovery Market by Production, 2021-2031 (MBPD, AGR (%)) (L-Shaped Recovery)
Figure 66. North America CO2 Enhanced Oil Recovery Market By Type, 2021-2031 (USD Mn, AGR (%))
Figure 67. North America CO2 Enhanced Oil Recovery Market By Type, 2021-2031 (MBPD, AGR (%)) (V-Shaped Recovery)
Figure 68. North America CO2 Enhanced Oil Recovery Market By Type, 2021-2031 (MBPD, AGR (%)) (W-Shaped Recovery)
Figure 69. North America CO2 Enhanced Oil Recovery Market By Type, 2021-2031 (MBPD, AGR (%)) (U-Shaped Recovery)
Figure 70. North America CO2 Enhanced Oil Recovery Market By Type, 2021-2031 (MBPD, AGR (%)) (L-Shaped Recovery)
Figure 71. North America CO2 Enhanced Oil Recovery Market by CO2 Source, 2021-2031 (USD Mn, AGR (%))
Figure 72. North America CO2 Enhanced Oil Recovery Market by CO2 Source, 2021-2031 (USD Mn, AGR (%)) (V-Shaped Recovery)
Figure 73. North America CO2 Enhanced Oil Recovery Market by CO2 Source, 2021-2031 (USD Mn, AGR (%)) (W-Shaped Recovery)
Figure 74. North America CO2 Enhanced Oil Recovery Market by CO2 Source, 2021-2031 (USD Mn, AGR (%)) (U-Shaped Recovery)
Figure 75. North America CO2 Enhanced Oil Recovery Market by CO2 Source, 2021-2031 (USD Mn, AGR (%)) (L-Shaped Recovery)
Figure 76. North America CO2 Enhanced Oil Recovery Market by Equipment, 2021-2031 (USD Mn, AGR (%))
Figure 77. North America CO2 Enhanced Oil Recovery Market by Equipment, 2021-2031 (USD Mn, AGR (%)) (V-Shaped Recovery)
Figure 78. North America CO2 Enhanced Oil Recovery Market by Equipment, 2021-2031 (USD Mn, AGR (%)) (W-Shaped Recovery)
Figure 79. North America CO2 Enhanced Oil Recovery Market by Equipment, 2021-2031 (USD Mn, AGR (%)) (U-Shaped Recovery)
Figure 80. North America CO2 Enhanced Oil Recovery Market by Equipment, 2021-2031 (USD Mn, AGR (%)) (L-Shaped Recovery)
Figure 81. North America CO2 Enhanced Oil Recovery Market By Country, 2021-2031 (USD Mn, AGR (%))
Figure 82. North America CO2 Enhanced Oil Recovery Market by Country, 2021-2031 (USD Mn, AGR (%)) (V-Shaped Recovery)
Figure 83. North America CO2 Enhanced Oil Recovery Market by Country, 2021-2031 (USD Mn, AGR (%)) (W-Shaped Recovery)
Figure 84. North America CO2 Enhanced Oil Recovery Market by Country, 2021-2031 (USD Mn, AGR (%)) (U-Shaped Recovery)
Figure 85. North America CO2 Enhanced Oil Recovery Market by Country, 2021-2031 (USD Mn, AGR (%)) (L-Shaped Recovery)
Figure 86. North America CO2 Enhanced Oil Recovery Market by Country, 2021-2031 (MBPD, AGR (%))
Figure 87. North America CO2 Enhanced Oil Recovery Market by Country, 2021-2031 (MBPD, AGR (%)) (V-Shaped Recovery)
Figure 88. North America CO2 Enhanced Oil Recovery Market by Country, 2021-2031 (MBPD, AGR (%)) (W-Shaped Recovery)
Figure 89. North America CO2 Enhanced Oil Recovery Market by Country, 2021-2031 (MBPD, AGR (%)) (U-Shaped Recovery)
Figure 90. North America CO2 Enhanced Oil Recovery Market by Country, 2021-2031 (MBPD, AGR (%)) (L-Shaped Recovery)
Figure 91. Europe CO2 Enhanced Oil Recovery Market Forecast, 2021-2031 (USD Mn, AGR (%))
Figure 92. Europe CO2 Enhanced Oil Recovery Market Forecast, 2021-2031 (USD Mn, AGR (%)) (V-Shaped Recovery)
Figure 93. Europe CO2 Enhanced Oil Recovery Market Forecast, 2021-2031 (USD Mn, AGR (%)) (W-Shaped Recovery)
Figure 94. Europe CO2 Enhanced Oil Recovery Market Forecast, 2021-2031 (USD Mn, AGR (%)) (U-Shaped Recovery)
Figure 95. Europe CO2 Enhanced Oil Recovery Market Forecast, 2021-2031 (USD Mn, AGR (%)) (L-Shaped Recovery)
Figure 96. Europe CO2 Enhanced Oil Recovery Market by Market Forecast, 2021-2031 (USD Mn, AGR (%))
Figure 97. Europe CO2 Enhanced Oil Recovery Market by Forecast, 2021-2031 (USD Mn, AGR (%), CAGR (%)) (V-Shaped Recovery)
Figure 98. Europe CO2 Enhanced Oil Recovery Market by Forecast, 2021-2031 (USD Mn, AGR (%), CAGR (%)) (W-Shaped Recovery)
Figure 99. Europe CO2 Enhanced Oil Recovery Market by Forecast, 2021-2031 (USD Mn, AGR (%), CAGR (%)) (U-Shaped Recovery)
Figure 100. Europe CO2 Enhanced Oil Recovery Market by Forecast, 2021-2031 (USD Mn, AGR (%), CAGR (%)) (L-Shaped Recovery)
Figure 101. Europe CO2 Enhanced Oil Recovery Market by Production, 2021-2031 (MBPD, AGR (%))
Figure 102. Europe CO2 Enhanced Oil Recovery Market by Production, 2021-2031 (MBPD, AGR (%)) (V-Shaped Recovery)
Figure 103. Europe CO2 Enhanced Oil Recovery Market by Production, 2021-2031 (MBPD, AGR (%)) (W-Shaped Recovery)
Figure 104. Europe CO2 Enhanced Oil Recovery Market by Production, 2021-2031 (MBPD, AGR (%)) (U-Shaped Recovery)
Figure 105. Europe CO2 Enhanced Oil Recovery Market by Production, 2021-2031 (MBPD, AGR (%)) (L-Shaped Recovery)
Figure 106. Europe CO2 Enhanced Oil Recovery Market By Type, 2021-2031 (USD Mn, AGR (%))
Figure 107. Europe CO2 Enhanced Oil Recovery Market By Type, 2021-2031 (MBPD, AGR (%)) (V-Shaped Recovery)
Figure 108. Europe CO2 Enhanced Oil Recovery Market By Type, 2021-2031 (MBPD, AGR (%)) (W-Shaped Recovery)
Figure 109. Europe CO2 Enhanced Oil Recovery Market By Type, 2021-2031 (MBPD, AGR (%)) (U-Shaped Recovery)
Figure 110. Europe CO2 Enhanced Oil Recovery Market By Type, 2021-2031 (MBPD, AGR (%)) (L-Shaped Recovery)
Figure 111. Europe CO2 Enhanced Oil Recovery Market by CO2 Source, 2021-2031 (USD Mn, AGR (%))
Figure 112. Europe CO2 Enhanced Oil Recovery Market by CO2 Source, 2021-2031 (USD Mn, AGR (%)) (V-Shaped Recovery)
Figure 113. Europe CO2 Enhanced Oil Recovery Market by CO2 Source, 2021-2031 (USD Mn, AGR (%)) (W-Shaped Recovery)
Figure 114. Europe CO2 Enhanced Oil Recovery Market by CO2 Source, 2021-2031 (USD Mn, AGR (%)) (U-Shaped Recovery)
Figure 115. Europe CO2 Enhanced Oil Recovery Market by CO2 Source, 2021-2031 (USD Mn, AGR (%)) (L-Shaped Recovery)
Figure 116. Europe CO2 Enhanced Oil Recovery Market by Equipment, 2021-2031 (USD Mn, AGR (%))
Figure 117. Europe CO2 Enhanced Oil Recovery Market by Equipment, 2021-2031 (USD Mn, AGR (%)) (V-Shaped Recovery)
Figure 118. Europe CO2 Enhanced Oil Recovery Market by Equipment, 2021-2031 (USD Mn, AGR (%)) (W-Shaped Recovery)
Figure 119. Europe CO2 Enhanced Oil Recovery Market by Equipment, 2021-2031 (USD Mn, AGR (%)) (U-Shaped Recovery)
Figure 120. Europe CO2 Enhanced Oil Recovery Market by Equipment, 2021-2031 (USD Mn, AGR (%)) (L-Shaped Recovery)
Figure 121. Europe CO2 Enhanced Oil Recovery Market By Country, 2021-2031 (USD Mn, AGR (%))
Figure 122. Europe CO2 Enhanced Oil Recovery Market by Country, 2021-2031 (USD Mn, AGR (%)) (V-Shaped Recovery)
Figure 123. Europe CO2 Enhanced Oil Recovery Market by Country, 2021-2031 (USD Mn, AGR (%)) (W-Shaped Recovery)
Figure 124. Europe CO2 Enhanced Oil Recovery Market by Country, 2021-2031 (USD Mn, AGR (%)) (U-Shaped Recovery)
Figure 125. Europe CO2 Enhanced Oil Recovery Market by Country, 2021-2031 (USD Mn, AGR (%)) (L-Shaped Recovery)
Figure 126. Europe CO2 Enhanced Oil Recovery Market by Country, 2021-2031 (MBPD, AGR (%))
Figure 127. Europe CO2 Enhanced Oil Recovery Market by Country, 2021-2031 (MBPD, AGR (%)) (V-Shaped Recovery)
Figure 128. Europe CO2 Enhanced Oil Recovery Market by Country, 2021-2031 (MBPD, AGR (%)) (W-Shaped Recovery)
Figure 129. Europe CO2 Enhanced Oil Recovery Market by Country, 2021-2031 (MBPD, AGR (%)) (U-Shaped Recovery)
Figure 130. Europe CO2 Enhanced Oil Recovery Market by Country, 2021-2031 (MBPD, AGR (%)) (L-Shaped Recovery)
Figure 131. Asia-Pacific CO2 Enhanced Oil Recovery Market Forecast, 2021-2031 (USD Mn, AGR (%))
Figure 132. Asia-Pacific CO2 Enhanced Oil Recovery Market Forecast, 2021-2031 (USD Mn, AGR (%)) (V-Shaped Recovery)
Figure 133. Asia-Pacific CO2 Enhanced Oil Recovery Market Forecast, 2021-2031 (USD Mn, AGR (%)) (W-Shaped Recovery)
Figure 134. Asia-Pacific CO2 Enhanced Oil Recovery Market Forecast, 2021-2031 (USD Mn, AGR (%)) (U-Shaped Recovery)
Figure 135. Asia-Pacific CO2 Enhanced Oil Recovery Market Forecast, 2021-2031 (USD Mn, AGR (%)) (L-Shaped Recovery)
Figure 136. Asia-Pacific CO2 Enhanced Oil Recovery Market by Market Forcast, 2021-2031 (USD Mn, AGR (%))
Figure 137. Asia-Pacific CO2 Enhanced Oil Recovery Market by Forecast, 2021-2031 (USD Mn, AGR (%), CAGR (%)) (V-Shaped Recovery)
Figure 138. Asia-Pacific CO2 Enhanced Oil Recovery Market by Forecast, 2021-2031 (USD Mn, AGR (%), CAGR (%)) (W-Shaped Recovery)
Figure 139. Asia-Pacific CO2 Enhanced Oil Recovery Market by Forecast, 2021-2031 (USD Mn, AGR (%), CAGR (%)) (U-Shaped Recovery)
Figure 140. Asia-Pacific CO2 Enhanced Oil Recovery Market by Forecast, 2021-2031 (USD Mn, AGR (%), CAGR (%)) (L-Shaped Recovery)
Figure 141. Asia-Pacific CO2 Enhanced Oil Recovery Market by Production, 2021-2031 (MBPD, AGR (%))
Figure 142. Asia-Pacific CO2 Enhanced Oil Recovery Market by Production, 2021-2031 (MBPD, AGR (%)) (V-Shaped Recovery)
Figure 143. Asia-Pacific CO2 Enhanced Oil Recovery Market by Production, 2021-2031 (MBPD, AGR (%)) (W-Shaped Recovery)
Figure 144. Asia-Pacific CO2 Enhanced Oil Recovery Market by Production, 2021-2031 (MBPD, AGR (%)) (U-Shaped Recovery)
Figure 145. Asia-Pacific CO2 Enhanced Oil Recovery Market by Production, 2021-2031 (MBPD, AGR (%)) (L-Shaped Recovery)
Figure 146. Asia-Pacific CO2 Enhanced Oil Recovery Market By Type, 2021-2031 (USD Mn, AGR (%))
Figure 147. Asia-Pacific CO2 Enhanced Oil Recovery Market By Type, 2021-2031 (MBPD, AGR (%)) (V-Shaped Recovery)
Figure 148. Asia-Pacific CO2 Enhanced Oil Recovery Market By Type, 2021-2031 (MBPD, AGR (%)) (W-Shaped Recovery)
Figure 149. Asia-Pacific CO2 Enhanced Oil Recovery Market By Type, 2021-2031 (MBPD, AGR (%)) (U-Shaped Recovery)
Figure 150. Asia-Pacific CO2 Enhanced Oil Recovery Market By Type, 2021-2031 (MBPD, AGR (%)) (L-Shaped Recovery)
Figure 151. Asia-Pacific CO2 Enhanced Oil Recovery Market by CO2 Source, 2021-2031 (USD Mn, AGR (%))
Figure 152. Asia-Pacific CO2 Enhanced Oil Recovery Market by CO2 Source, 2021-2031 (USD Mn, AGR (%)) (V-Shaped Recovery)
Figure 153. Asia-Pacific CO2 Enhanced Oil Recovery Market by CO2 Source, 2021-2031 (USD Mn, AGR (%)) (W-Shaped Recovery)
Figure 154. Asia-Pacific CO2 Enhanced Oil Recovery Market by CO2 Source, 2021-2031 (USD Mn, AGR (%)) (U-Shaped Recovery)
Figure 155. Asia-Pacific CO2 Enhanced Oil Recovery Market by CO2 Source, 2021-2031 (USD Mn, AGR (%)) (L-Shaped Recovery)
Figure 156. Asia-Pacific CO2 Enhanced Oil Recovery Market by Equipment, 2021-2031 (USD Mn, AGR (%))
Figure 157. Asia-Pacific CO2 Enhanced Oil Recovery Market by Equipment, 2021-2031 (USD Mn, AGR (%)) (V-Shaped Recovery)
Figure 158. Asia-Pacific CO2 Enhanced Oil Recovery Market by Equipment, 2021-2031 (USD Mn, AGR (%)) (W-Shaped Recovery)
Figure 159. Asia-Pacific CO2 Enhanced Oil Recovery Market by Equipment, 2021-2031 (USD Mn, AGR (%)) (U-Shaped Recovery)
Figure 160. Asia-Pacific CO2 Enhanced Oil Recovery Market by Equipment, 2021-2031 (USD Mn, AGR (%)) (L-Shaped Recovery)
Figure 161. Asia-Pacific CO2 Enhanced Oil Recovery Market By Country, 2021-2031 (USD Mn, AGR (%))
Figure 162. Asia-Pacific CO2 Enhanced Oil Recovery Market by Country, 2021-2031 (USD Mn, AGR (%)) (V-Shaped Recovery)
Figure 163. Asia-Pacific CO2 Enhanced Oil Recovery Market by Country, 2021-2031 (USD Mn, AGR (%)) (W-Shaped Recovery)
Figure 164. Asia-Pacific CO2 Enhanced Oil Recovery Market by Country, 2021-2031 (USD Mn, AGR (%)) (U-Shaped Recovery)
Figure 165. Asia-Pacific CO2 Enhanced Oil Recovery Market by Country, 2021-2031 (USD Mn, AGR (%)) (L-Shaped Recovery)
Figure 166. Asia-Pacific CO2 Enhanced Oil Recovery Market by Country, 2021-2031 (MBPD, AGR (%))
Figure 167. Asia-Pacific CO2 Enhanced Oil Recovery Market by Country, 2021-2031 (MBPD, AGR (%)) (V-Shaped Recovery)
Figure 168. Asia-Pacific CO2 Enhanced Oil Recovery Market by Country, 2021-2031 (MBPD, AGR (%)) (W-Shaped Recovery)
Figure 169. Asia-Pacific CO2 Enhanced Oil Recovery Market by Country, 2021-2031 (MBPD, AGR (%)) (U-Shaped Recovery)
Figure 170. Asia-Pacific CO2 Enhanced Oil Recovery Market by Country, 2021-2031 (MBPD, AGR (%)) (L-Shaped Recovery)
Figure 171. Latin America CO2 Enhanced Oil Recovery Market Forecast, 2021-2031 (USD Mn, AGR (%))
Figure 172. Latin America CO2 Enhanced Oil Recovery Market Forecast, 2021-2031 (USD Mn, AGR (%)) (V-Shaped Recovery)
Figure 173. Latin America CO2 Enhanced Oil Recovery Market Forecast, 2021-2031 (USD Mn, AGR (%)) (W-Shaped Recovery)
Figure 174. Latin America CO2 Enhanced Oil Recovery Market Forecast, 2021-2031 (USD Mn, AGR (%)) (U-Shaped Recovery)
Figure 175. Latin America CO2 Enhanced Oil Recovery Market Forecast, 2021-2031 (USD Mn, AGR (%)) (L-Shaped Recovery)
Figure 176. Latin America CO2 Enhanced Oil Recovery Market by Market Forecast, 2021-2031 (USD Mn, AGR (%))
Figure 177. Latin America CO2 Enhanced Oil Recovery Market by Forecast, 2021-2031 (USD Mn, AGR (%), CAGR (%)) (V-Shaped Recovery)
Figure 178. Latin America CO2 Enhanced Oil Recovery Market by Forecast, 2021-2031 (USD Mn, AGR (%), CAGR (%)) (W-Shaped Recovery)
Figure 179. Latin America CO2 Enhanced Oil Recovery Market by Forecast, 2021-2031 (USD Mn, AGR (%), CAGR (%)) (U-Shaped Recovery)
Figure 180. Latin America CO2 Enhanced Oil Recovery Market by Forecast, 2021-2031 (USD Mn, AGR (%), CAGR (%)) (L-Shaped Recovery)
Figure 181. Latin America CO2 Enhanced Oil Recovery Market by Production, 2021-2031 (MBPD, AGR (%))
Figure 182. Latin America CO2 Enhanced Oil Recovery Market by Production, 2021-2031 (MBPD, AGR (%)) (V-Shaped Recovery)
Figure 183. Latin America CO2 Enhanced Oil Recovery Market by Production, 2021-2031 (MBPD, AGR (%)) (W-Shaped Recovery)
Figure 184. Latin America CO2 Enhanced Oil Recovery Market by Production, 2021-2031 (MBPD, AGR (%)) (U-Shaped Recovery)
Figure 185. Latin America CO2 Enhanced Oil Recovery Market by Production, 2021-2031 (MBPD, AGR (%)) (L-Shaped Recovery)
Figure 186. Latin America CO2 Enhanced Oil Recovery Market By Type, 2021-2031 (USD Mn, AGR (%))
Figure 187. Latin America CO2 Enhanced Oil Recovery Market By Type, 2021-2031 (MBPD, AGR (%)) (V-Shaped Recovery)
Figure 188. Latin America CO2 Enhanced Oil Recovery Market By Type, 2021-2031 (MBPD, AGR (%)) (W-Shaped Recovery)
Figure 189. Latin America CO2 Enhanced Oil Recovery Market By Type, 2021-2031 (MBPD, AGR (%)) (U-Shaped Recovery)
Figure 190. Latin America CO2 Enhanced Oil Recovery Market By Type, 2021-2031 (MBPD, AGR (%)) (L-Shaped Recovery)
Figure 191. Latin America CO2 Enhanced Oil Recovery Market by CO2 Source, 2021-2031 (USD Mn, AGR (%))
Figure 192. Latin America CO2 Enhanced Oil Recovery Market by CO2 Source, 2021-2031 (USD Mn, AGR (%)) (V-Shaped Recovery)
Figure 193. Latin America CO2 Enhanced Oil Recovery Market by CO2 Source, 2021-2031 (USD Mn, AGR (%)) (W-Shaped Recovery)
Figure 194. Latin America CO2 Enhanced Oil Recovery Market by CO2 Source, 2021-2031 (USD Mn, AGR (%)) (U-Shaped Recovery)
Figure 195. Latin America CO2 Enhanced Oil Recovery Market by CO2 Source, 2021-2031 (USD Mn, AGR (%)) (L-Shaped Recovery)
Figure 196. Latin America CO2 Enhanced Oil Recovery Market by Equipment, 2021-2031 (USD Mn, AGR (%))
Figure 197. Latin America CO2 Enhanced Oil Recovery Market by Equipment, 2021-2031 (USD Mn, AGR (%)) (V-Shaped Recovery)
Figure 198. Latin America CO2 Enhanced Oil Recovery Market by Equipment, 2021-2031 (USD Mn, AGR (%)) (W-Shaped Recovery)
Figure 199. Latin America CO2 Enhanced Oil Recovery Market by Equipment, 2021-2031 (USD Mn, AGR (%)) (U-Shaped Recovery)
Figure 200. Latin America CO2 Enhanced Oil Recovery Market by Equipment, 2021-2031 (USD Mn, AGR (%)) (L-Shaped Recovery)
Figure 201. Latin America CO2 Enhanced Oil Recovery Market By Country, 2021-2031 (USD Mn, AGR (%))
Figure 202. Latin America CO2 Enhanced Oil Recovery Market by Country, 2021-2031 (USD Mn, AGR (%)) (V-Shaped Recovery)
Figure 203. Latin America CO2 Enhanced Oil Recovery Market by Country, 2021-2031 (USD Mn, AGR (%)) (W-Shaped Recovery)
Figure 204. Latin America CO2 Enhanced Oil Recovery Market by Country, 2021-2031 (USD Mn, AGR (%)) (U-Shaped Recovery)
Figure 205. Latin America CO2 Enhanced Oil Recovery Market by Country, 2021-2031 (USD Mn, AGR (%)) (L-Shaped Recovery)
Figure 206. Latin America CO2 Enhanced Oil Recovery Market by Country, 2021-2031 (MBPD, AGR (%))
Figure 207. Latin America CO2 Enhanced Oil Recovery Market by Country, 2021-2031 (MBPD, AGR (%)) (V-Shaped Recovery)
Figure 208. Latin America CO2 Enhanced Oil Recovery Market by Country, 2021-2031 (MBPD, AGR (%)) (W-Shaped Recovery)
Figure 209. Latin America CO2 Enhanced Oil Recovery Market by Country, 2021-2031 (MBPD, AGR (%)) (U-Shaped Recovery)
Figure 210. Latin America CO2 Enhanced Oil Recovery Market by Country, 2021-2031 (MBPD, AGR (%)) (L-Shaped Recovery)
Figure 211. Middle East & Africa CO2 Enhanced Oil Recovery Market Forecast, 2021-2031 (USD Mn, AGR (%))
Figure 212. Middle East & Africa CO2 Enhanced Oil Recovery Market Forecast, 2021-2031 (USD Mn, AGR (%)) (V-Shaped Recovery)
Figure 213. Middle East & Africa CO2 Enhanced Oil Recovery Market Forecast, 2021-2031 (USD Mn, AGR (%)) (W-Shaped Recovery)
Figure 214. Middle East & Africa CO2 Enhanced Oil Recovery Market Forecast, 2021-2031 (USD Mn, AGR (%)) (U-Shaped Recovery)
Figure 215. Middle East & Africa CO2 Enhanced Oil Recovery Market Forecast, 2021-2031 (USD Mn, AGR (%)) (L-Shaped Recovery)
Figure 216. Middle East & Africa CO2 Enhanced Oil Recovery Market by Market Forcast, 2021-2031 (USD Mn, AGR (%))
Figure 217. Middle East & Africa CO2 Enhanced Oil Recovery Market by Forecast, 2021-2031 (USD Mn, AGR (%), CAGR (%)) (V-Shaped Recovery)
Figure 218. Middle East & Africa CO2 Enhanced Oil Recovery Market by Forecast, 2021-2031 (USD Mn, AGR (%), CAGR (%)) (W-Shaped Recovery)
Figure 219. Middle East & Africa CO2 Enhanced Oil Recovery Market by Forecast, 2021-2031 (USD Mn, AGR (%), CAGR (%)) (U-Shaped Recovery)
Figure 220. Middle East & Africa CO2 Enhanced Oil Recovery Market by Forecast, 2021-2031 (USD Mn, AGR (%), CAGR (%)) (L-Shaped Recovery)
Figure 221. Middle East & Africa CO2 Enhanced Oil Recovery Market by Production, 2021-2031 (MBPD, AGR (%))
Figure 222. Middle East & Africa CO2 Enhanced Oil Recovery Market by Production, 2021-2031 (MBPD, AGR (%)) (V-Shaped Recovery)
Figure 223. Middle East & Africa CO2 Enhanced Oil Recovery Market by Production, 2021-2031 (MBPD, AGR (%)) (W-Shaped Recovery)
Figure 224. Middle East & Africa CO2 Enhanced Oil Recovery Market by Production, 2021-2031 (MBPD, AGR (%)) (U-Shaped Recovery)
Figure 225. Middle East & Africa CO2 Enhanced Oil Recovery Market by Production, 2021-2031 (MBPD, AGR (%)) (L-Shaped Recovery)
Figure 226. Middle East & Africa CO2 Enhanced Oil Recovery Market By Type, 2021-2031 (USD Mn, AGR (%))
Figure 227. Middle East & Africa CO2 Enhanced Oil Recovery Market By Type, 2021-2031 (MBPD, AGR (%)) (V-Shaped Recovery)
Figure 228. Middle East & Africa CO2 Enhanced Oil Recovery Market By Type, 2021-2031 (MBPD, AGR (%)) (W-Shaped Recovery)
Figure 229. Middle East & Africa CO2 Enhanced Oil Recovery Market By Type, 2021-2031 (MBPD, AGR (%)) (U-Shaped Recovery)
Figure 230. Middle East & Africa CO2 Enhanced Oil Recovery Market By Type, 2021-2031 (MBPD, AGR (%)) (L-Shaped Recovery)
Figure 231. Middle East & Africa CO2 Enhanced Oil Recovery Market by CO2 Source, 2021-2031 (USD Mn, AGR (%))
Figure 232. Middle East & Africa CO2 Enhanced Oil Recovery Market by CO2 Source, 2021-2031 (USD Mn, AGR (%)) (V-Shaped Recovery)
Figure 233. Middle East & Africa CO2 Enhanced Oil Recovery Market by CO2 Source, 2021-2031 (USD Mn, AGR (%)) (W-Shaped Recovery)
Figure 234. Middle East & Africa CO2 Enhanced Oil Recovery Market by CO2 Source, 2021-2031 (USD Mn, AGR (%)) (U-Shaped Recovery)
Figure 235. Middle East & Africa CO2 Enhanced Oil Recovery Market by CO2 Source, 2021-2031 (USD Mn, AGR (%)) (L-Shaped Recovery)
Figure 236. Middle East & Africa CO2 Enhanced Oil Recovery Market by Equipment, 2021-2031 (USD Mn, AGR (%))
Figure 237. Middle East & Africa CO2 Enhanced Oil Recovery Market by Equipment, 2021-2031 (USD Mn, AGR (%)) (V-Shaped Recovery)
Figure 238. Middle East & Africa CO2 Enhanced Oil Recovery Market by Equipment, 2021-2031 (USD Mn, AGR (%)) (W-Shaped Recovery)
Figure 239. Middle East & Africa CO2 Enhanced Oil Recovery Market by Equipment, 2021-2031 (USD Mn, AGR (%)) (U-Shaped Recovery)
Figure 240. Middle East & Africa CO2 Enhanced Oil Recovery Market by Equipment, 2021-2031 (USD Mn, AGR (%)) (L-Shaped Recovery)
Figure 241. Middle East & Africa CO2 Enhanced Oil Recovery Market By Country, 2021-2031 (USD Mn, AGR (%))
Figure 242. Middle East & Africa CO2 Enhanced Oil Recovery Market by Country, 2021-2031 (USD Mn, AGR (%)) (V-Shaped Recovery)
Figure 243. Middle East & Africa CO2 Enhanced Oil Recovery Market by Country, 2021-2031 (USD Mn, AGR (%)) (W-Shaped Recovery)
Figure 244. Middle East & Africa CO2 Enhanced Oil Recovery Market by Country, 2021-2031 (USD Mn, AGR (%)) (U-Shaped Recovery)
Figure 245. Middle East & Africa CO2 Enhanced Oil Recovery Market by Country, 2021-2031 (USD Mn, AGR (%)) (L-Shaped Recovery)
Figure 246. Middle East & Africa CO2 Enhanced Oil Recovery Market by Country, 2021-2031 (MBPD, AGR (%))
Figure 247. Middle East & Africa CO2 Enhanced Oil Recovery Market by Country, 2021-2031 (MBPD, AGR (%)) (V-Shaped Recovery)
Figure 248. Middle East & Africa CO2 Enhanced Oil Recovery Market by Country, 2021-2031 (MBPD, AGR (%)) (W-Shaped Recovery)
Figure 249. Middle East & Africa CO2 Enhanced Oil Recovery Market by Country, 2021-2031 (MBPD, AGR (%)) (U-Shaped Recovery)
Figure 250. Middle East & Africa CO2 Enhanced Oil Recovery Market by Country, 2021-2031 (MBPD, AGR (%)) (L-Shaped Recovery)
Figure 251. Exxon Mobil Corporation.: Company Revenue 2016-2020(US$ Mn, AGR %)
Figure 252. Exxon Mobil Corporation.: Company Operating Income 2016-2020(US$ Mn, AGR %)
Figure 253. Exxon Mobil Corporation.: Company Net Income 2016-2020(US$ Mn, AGR %)
Figure 254. Exxon Mobil Corporation.: Company EBITDA 2016-2020(US$ Mn, AGR %)
Figure 255. BP Plc.: Company Revenue 2016-2020(US$ Mn, AGR %)
Figure 256. BP Plc.: Company Operating Income 2016-2020(US$ Mn, AGR %)
Figure 257. BP Plc.: Company Net Income 2016-2020(US$ Mn, AGR %)
Figure 258. BP Plc.: Company EBITDA 2016-2020(US$ Mn, AGR %)
Figure 259. Total SE.: Company Revenue 2016-2020 (US$ Mn, AGR %)
Figure 260. Total SE.: Company Operating Income 2016-2020 (US$ Mn, AGR %)
Figure 261. Total SE.: Company Net Income 2016-2020 (US$ Mn, AGR %)
Figure 262. Total SE.: Company EBITDA 2016-2020 (US$ Mn, AGR %)
Figure 263. China Petroleum & Chemical Corporation Company Revenue 2016-2020(US$ Mn, AGR %)
Figure 264. China Petroleum & Chemical Corporation Company Operating Income 2016-2020(US$ Mn, AGR %)
Figure 265. China Petroleum & Chemical Corporation Company Net Income 2016-2020(US$ Mn, AGR %)
Figure 266. China Petroleum & Chemical Corporation Company EBITDA 2016-2020(US$ Mn, AGR %)
Figure 267. Royal Dutch Shell: Company Revenue 2016-2020(US$ Mn, AGR %)
Figure 268. Royal Dutch Shell: Company Operating Income 2016-2020(US$ Mn, AGR %)
Figure 269. Royal Dutch Shell: Company Net Income 2016-2020(US$ Mn, AGR %)
Figure 270. Royal Dutch Shell: Company EBITDA 2016-2020(US$ Mn, AGR %)
Figure 271. Chevron Corporation.: Company Revenue 2016-2020(US$ Mn, AGR %)
Figure 272. Chevron Corporation.: Company Operating Income 2016-2020(US$ Mn, AGR %)
Figure 273. Chevron Corporation.: Company Net Income 2016-2020(US$ Mn, AGR %)
Figure 274. Chevron Corporation: Company EBITDA 2016-2020(US$ Mn, AGR %)
Figure 275. Petroleo Brasileiro S.A.: Company Revenue 2016-2020(US$ Mn, AGR %)
Figure 276. Petroleo Brasileiro S.A.: Company Operating Income 2016-2020(US$ Mn, AGR %)
Figure 277. Petroleo Brasileiro S.A.: Company Net Income 2016-2020(US$ Mn, AGR %)
Figure 278. Petroleo Brasileiro S.A.: Company EBITDA 2016-2020(US$ Mn, AGR %)
Figure 279. LUKOIL: Company Revenue 2016-2020 (US$Mn, AGR %)
Figure 280. LUKOIL: Company Operating Income 2016-2020 (US$Mn, AGR %)
Figure 281. LUKOIL: Company Net Income 2016-2020 (US$Mn, AGR %)
Figure 282. LUKOIL: Company EBITDA 2016-2020 (US$Mn, AGR %)
Figure 291. Abu Dhabi National Oil Company: Company Revenue 2016-2020 (US$Mn, AGR %)
Figure 292. Abu Dhabi National Oil Company: Company Operating Income 2016-2020 (US$Mn, AGR %)
Figure 293. Abu Dhabi National Oil Company: Company Net Income 2016-2020 (US$Mn, AGR %)
Figure 294. Abu Dhabi National Oil Company: Company EBITDA 2016-2020 (US$Mn, AGR %)
Figure 296. Air Product & Chemicals Inc.: Company Operating Income 2016-2020 (US$Mn, AGR %)
Figure 297. Air Product & Chemicals Inc.: Company Net Income 2016-2020 (US$Mn, AGR %)
Figure 298. Air Product & Chemicals Inc.: Company EBITDA 2016-2020 (US$Mn, AGR %)
Figure 299. Occidental Petroleum Corporation.: Company Revenue 2016-2020 (US$ Mn, AGR %)
Figure 300. Occidental Petroleum Corporation.: Company Operating Income 2016-2020 (US$ Mn, AGR %)
Figure 301. Occidental Petroleum Corporation.: Company Net Income 2016-2020 (US$ Mn, AGR %)
Figure 302. Occidental Petroleum Corporation.: Company EBITA 2016-2020 (US$ Mn, AGR %)
Figure 303. Chesapeake Energy: Company Revenue 2016-2020 (US$Mn, AGR %)
Figure 304. Chesapeake Energy: Company Operating Income 2016-2020 (US$Mn, AGR %)
Figure 305. Chesapeake Energy: Company Net Income 2016-2020 (US$Mn, AGR %)
Figure 306. Chesapeake Energy: Company EBITDA 2016-2020 (US$Mn, AGR %)
Figure 307. China National Offshore Oil Corporation (CNOOC).: Company Revenue 2016-2020 (US$ Mn, AGR %)
Figure 308. China National Offshore Oil Corporation (CNOOC).: Company Operating Income 2016-2020 (US$ Mn, AGR %)
Figure 309. China National Offshore Oil Corporation (CNOOC).: Company Net Income 2016-2020 (US$ Mn, AGR %)
Figure 310. China National Offshore Oil Corporation (CNOOC).: Company EBITDA 2016-2020 (US$ Mn, AGR %)
Figure 311. ConocoPhillips.: Company Revenue 2016-2020 (US$ Mn, AGR %)
Figure 312. ConocoPhillips.: Company Operating Income 2016-2020 (US$ Mn, AGR %)
Figure 313. ConocoPhillips.: Company Net Income 2016-2020 (US$ Mn, AGR %)
Figure 314. ConocoPhillips.: Company EBITDA 2016-2020 (US$ Mn, AGR %)
Figure 315. Kinder Morgan, Inc.: Company Revenue 2016-2020 (US$ Mn, AGR %)
Figure 316. Kinder Morgan, Inc.: Company Operating Income 2016-2020 (US$ Mn, AGR %)
Figure 317. Kinder Morgan, Inc.: Company Net Income 2016-2020 (US$ Mn, AGR %)
Figure 318. Kinder Morgan, Inc.: Company EBITDA 2016-2020 (US$ Mn, AGR %)
Figure 319. Equinor ASA.: Company Revenue 2016-2020 (US$ Mn, AGR %)
Figure 320. Equinor ASA.: Company Operating Income 2016-2020 (US$ Mn, AGR %)
Figure 321. Equinor ASA.: Company Net Income 2016-2020 (US$ Mn, AGR %)
Figure 322. Equinor ASA.: Company EBITDA 2016-2020 (US$ Mn, AGR %)
Figure 323. Schlumderger N.V: Company Revenue 2016-2020 (US$ Mn, AGR %)
Figure 324. Schlumderger N.V: Company Operating Income 2016-2020 (US$ Mn, AGR %)
Figure 325. Schlumderger N.V: Company Net Income 2016-2020 (US$ Mn, AGR %)
Figure 326. Schlumderger N.V: Company EBITDA 2016-2020 (US$ Mn, AGR %)
Figure 327. Kinder Morgan, Inc.: Company Revenue 2016-2020 (US$ Mn, AGR %)
Figure 328. Kinder Morgan, Inc.: Company Operating Income 2016-2020 (US$ Mn, AGR %)
Figure 329. Kinder Morgan, Inc.: Company Net Income 2016-2020 (US$ Mn, AGR %)
Figure 330. Kinder Morgan, Inc.: Company EBITDA 2016-2020 (US$ Mn, AGR %)
List of Companies Profiled in the report
Abu Dhabi National Oil Company
Air Products & Chemicals Inc.
BP plc
Cenovus Energy Inc
Chesapeake Energy
Chevron Corporation (Chevron)
China National Offshore Oil Corporation (CNOOC)
China Petroleum & Chemical Corporation
ConocoPhillips
Equinor ASA (formerly Statoil ASA)
Exxon Mobil Corporation
Halliburton Company
Kinder Morgan, Inc.
NK Lukoil PAO
Occidental Petroleum Corp.
Petroleo Brasileiro S.A.-Petrobras
Royal Dutch Shell
Schlumberger N.V.
Total SE
List of Other Companies Mentioned in the report
Abu Dhabi National Oil Company (ADNOC)
Agrium
Air Products & Chemicals Inc
Alstom
Anadarko petroleum
Apache Corporation
Bank of America (Merrill Lynch)
Basin Electric Power Cooperative
BP
Breitburn Energy Partners
Cenovus
Chaparral Energy
Chesapeake Energy
Chevron
China Datang Corporation
China Resources Power
CNOOC
CNPC
CNRL
Co2 Deepstore
Coffeyville Resources
ConocoPhillips
Core Energy
Denbury Resources
Devon Energy
Dodsal Group
Dongguan Taiyangzhou Power Corporation
Emirates Aluminium
Emirates Steel Industries
Enhance Energy
EOG Corporation
ExxonMobil
Fleur de Lis Energy
Glencoe Resources
GreenGen Tiajin IGCC Co. Ltd.
Halliburton
Hess Corporation
Hilcorp Energy
Husky Energy
Japan Vietnam Petroleum Co, (JVPC)
JX Nippon Oil & Gas Exploration Corp.
KBR
Kemper County
Kinder Morgan
Koch Nitrogen Company
Marathon Oil
Masdar
Merit Energy
NRG Energy
Occidental Petroleum
OPEC
PCOR
Pengrowth Energy
Penn West Exploration
Petra Nova
Petrobras
Petroleo Brasiliero S.A. (Petrobras)
Petrovietnam
Pioneer Natural Resources
Royal Dutch Shell (Shell)
Sandridge Energy
SaskPower
Schlumberger
Shaanxi Yanchang Petroleum Group
Shenhua Ningxia
Sinopec
Southern Company
Southwest Partnership
Summit Power
Summit Power Group
Taweelah Asia Power Company (TAPCO)
TransAlta
White Petroleum
Organisations Mentioned
Alberta Department of Energy (ADOE)
Clean Fossil Fuel Development Institute (CFEDI)
Department of Energy (DOE)
Energy Information Administration (EIA)
Environmental Protection Agency (EPA)
Global Carbon Capture and Storage Institute (GCCSI)
Guandong Low-Carbon Technology and Industry research Centre (GDLRC)
IEA
Japan Oil, Gas and Metals National Corporation (JOGMEC)
Japanese Ministry of Economy, Trade and Industry (METI)
National Academy of Sciences
National Enhanced Oil Recovery Initiative (NEORI)
National Grid
Scottish Carbon Capture and Storage (SCCS)
UK Carbon Capture and Storage Research Centre (UKCCSRC)
 Enhanced Oil Recovery (EOR) Market Report 2021-2031")