This latest report by business intelligence provider Visiongain assesses that Microbial Enhanced Oil Recovery Market spending will reach US$ 730 million in 2020 and is forecast to reach US$ 1830 million by 2030, at a CAGR of 10.8% over the forecast period. Microbial Enhanced Oil Recovery (MEOR) is a biological technology that consists of controlling feature or composition, or both, of microbial settings in oil reservoirs. MEOR’s ultimate goal is to improve oil recovery in porous media while at the same time increasing economic profits. MEOR is a tertiary oil extraction technology that enables the complete regeneration of two-thirds of the frequently residual oil and thus increases the lives of productive oil reservoirs.
The most outstanding advantages of MEOR over other EOR technologies
The bacteria and nutrient injected in the field are inexpensive and easy to get and handle. MEOR procedures are economically appealing for oil fields that are marginally produced and are appropriate options before small pools are abandoned. To generate MEOR officers, microbial cell plants need little energy entry. Less modification of the existing field characteristics is required compared to other EOR technologies in order to implement the recovery process through MEOR technologies, which are more cost-effective to install and easier to use. Since the fluids injected are not petrochemicals, their costs do not depend on the global price of crude oil. MEOR processes are especially suitable for carbonate oil reservoirs where certain EOR technologies can not be efficiently applied. The impacts of bacterial behavior within the reservoir are enhanced over moment by their development, while the impacts of the additives appear to decline well in EOR techniques with moment and range from the injection.
It is therefore critical that you have your timescales correct and your forecasting plans ready. This report will ensure that you do. Visiongain’s report will ensure that you keep informed and ahead of your competitors. Gain that competitive advantage.
MEOR problems
MEOR techniques face some common problems that are outlined in this report
Lost injectivity due to microbial wellbore plugging to avoid wellbore plugging, some actions need to be taken such as pre-injection filtration, prevention of production of biopolymers, and minimizing microbial adsorption to rock surface using dormant cell forms, spores, or ultra-micro-bacteria. Dispersion or shipping to the destination area of all required parts. Optimizing the required metabolic activity in-situ owing to the impact of factors such as pH, temperature, salinity, and stress on any MEOR procedure in-situ. Isolation of microbial strains, adaptable to the extreme reservoir conditions of pH, temperatures, pressure and salinity. Low in-situ concentration of bacterial metabolites; the solution to this problem might be the application of genetic engineering techniques.
MEOR’s prominent benefits are significantly reduced expenses and more environmentally friendly relative to other EOR techniques.
The demand for crude oil is also rising with increasing demand for energy fuels. Very big amounts of precious oil remain stuck in the reservoir even after the main and secondary oil extraction method has been implemented. Improved oil recovery processes seek benefits from dire to increase oil production from reservoirs to meet worldwide crude oil demand. Enhanced oil recovery processes provide maximum cost-effectiveness and reservoir oil production optimization to enhance upstream processes ‘ overall efficiency. The tertiary processes, also known as enhanced oil recovery, can extract more than 50 percent of the oil that is trapped in the rocks.
Compared to heat manufacturing, gas flooding and other improved methods of oil regeneration, MEOR’s prominent benefits are significantly reduced expenses and more environmentally friendly relative to other EOR techniques. Field tests show that the input-output ratio of microbial flood recovery is as high as 1:6, with a significantly lower overall cost than all other EOR techniques such as polymer flooding, gas flooding and thermal production.
Read on to discover how you can exploit the future business opportunities emerging in this sector. Visiongain’s new study tells you and tells you NOW. The 201-pages report provides clear, detailed insight into the global Microbial Enhanced Oil Recovery market. Discover the key drivers and challenges affecting the market.
By ordering and reading our brand-new report today, you stay better informed and ready to act.
Report Scope
The report delivers considerable added value by revealing:
74 tables, charts and graphs are analyzing and revealing the growth prospects and outlook for the Microbial Enhanced Oil Recovery market.
Global Microbial Enhanced Oil Recovery market forecasts and analysis from 2020-2030.
Microbial Enhanced Oil Recovery market provides revenue estimates, forecasts and analysis from 2020-2030 for Microbial
Enhanced Oil Recovery submarkets:
Forecasts and analysis of Microbial Enhanced Oil Recovery market by Type between 2020-2030
Ground Method Market, 2020-2030
Reservoir Method Market, 2020-2030
Other Type Market, 2020-2030
Forecasts and analysis of Microbial Enhanced Oil Recovery market by Well Type between 2020-2030
Onshore Oilfield Market, 2020-2030
Offshore Oilfield Market, 2020-2030
Other Well Type Market, 2020-2030
Forecasts and analysis of Microbial Enhanced Oil Recovery market by Injection Type between 2020-2030
Cyclic Injection Market, 2020-2030
Microbial Flooding Market, 2020-2030
Feeding Existing Bacteria Market, 2020-2030
Other Injection Type Market, 2020-2030
Forecasts and analysis of Microbial Enhanced Oil Recovery market by Application between 2020-2030
Interfacial Tension Reduction Market, 2020-2030
Selective Plugging Market, 2020-2030
Gas Production Market, 2020-2030
Bio Degradation Market, 2020-2030
Wettability Alteration Market, 2020-2030
Emulsification And De Emulsification Market, 2020-2030
Regional Microbial Enhanced Oil Recovery market forecasts from 2020-2030 with drivers and restraints for the countries including:
Geographic Breakdown
Focused regional forecasts and analysis explore the future opportunities:
North America Market, 2020-2030
US Market, 2020-2030
Canada Market, 2020-2030
Europe Market, 2020-2030
The UK Market, 2020-2030
Germany Market, 2020-2030
France Market, 2020-2030
Italy Market, 2020-2030
Spain Market, 2020-2030
Rest of Europe Market, 2020-2030
Asia-Pacific Market, 2020-2030
China Market, 2020-2030
India Market, 2020-2030
Japan Market, 2020-2030
Australia & New Zealand Market, 2020-2030
Rest of Asia-Pacific Market, 2020-2030
LAMEA Market, 2020-2030
Latin America Market, 2020-2030
Middle East Market, 2020-2030
Africa Market, 2020-2030

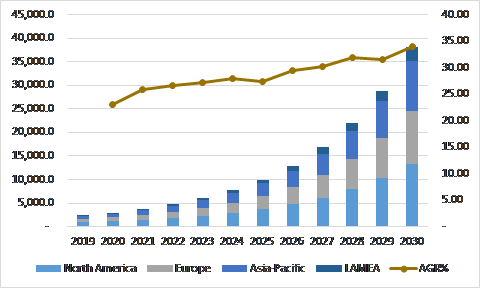
Figure:- Microbial Enhanced Oil Recovery Market Size and Forecast by Region, 2020-2030
There is a worldwide demand for oil. Countries such as the US, China, India, and Saudi Arabia provide an ideal business environment, however. Low set-up expenses and minimum regulatory requirements have resulted in several oilfields across these nations. Innovation in technology is also boosting the oilfields in the US.
North American microbial oil restoration industry has bagged the biggest proportion of the worldwide industry thanks to its development. In order to enhance earnings, the industry remains to see developments in growing microbe and nutrient interaction. Europe is closely second in the worldwide industry for microbial oil regeneration. Asia Pacific is forecast to experience the highest increasing proportion owing to the national authorities ‘ numerous oil-focused projects. India, for instance, lately entered a partnership agreement with Titan Oil Recovery Inc. The alternative would provide the Indian oil manufacturing sector with sophisticated methods for organic oil regeneration (OOR).
In China, the MEOR implementation is quite distinct. MEOR in China can be split into microbial flood restoration (MFR), microbial process restoration (CMR), targeted microbial plug restoration (MSPR), and microbial wax extraction (MWR). According to our study of past MEOR plant trials and applications in China, if assessed by the implementation of well statistics, the complete amount of MEOR plants in China is more than 4600, whereas there are more than 3000 tanks (manufacturers and injectors) for MWR, which is around 65%. This chart is a overview of different field trials in China and is the first figure to define MEOR kinds according to well-number field trials. Up to present, about 500 wells have been involved in MFR in China. These processes often involve more than one mechanism; thus, this classification is general. Since some MEOR data is not public or fully public, our survey involves most but not all MEOR field tests in China.
Company profiles for the leading Microbial Enhanced Oil Recovery companies
Company Profiles of Leading Players
Genome Prairie
Chemiphase Ltd,
CNPC
Gulf Energy
Glori Energy Inc.
StatOil
Titan Oil Recovery
Royal Dutch Shell
BP
ConocoPhillips
E. I. Du Pont De Nemours And Company
Other Key Players in the market
National Energy Services Reunited Corp
Micro-Bac International Inc.,
RAM Biochemical, Inc.
Synthetic Genomics
MICROBIAL ENERGY INC.
KTP Microbial enhanced Oil Recovery (MEOR)
Conclusions and recommendations which will aid decision-making
How will you benefit from this report?
Keep your knowledge base up to speed. Don’t get left behind
Reinforce your strategic decision-making with definitive and reliable market data
Learn how to exploit new technological trends
Realise your company’s full potential within the market
Understand the competitive landscape and identify potential new business opportunities & partnerships
Who should read this report?
Anyone with involvement in the Microbial Enhanced Oil Recovery
Energy operators
Engineering contractors
Investment managers
Arbitrage companies and divisions
Energy price reporting companies
Energy company managers
Energy consultants
Energy company executives and analysts
Heads of strategic development
Business development managers
Marketing managers
Market analysts,
Technologists
Suppliers
Investors
Banks
Government agencies
Visiongain’s study is intended for anyone requiring commercial analyses for the Microbial Enhanced Oil Recovery market and leading companies. You find data, trends and predictions.
Buy our report today the Microbial Enhanced Oil Recovery Market Forecast 2020-2030. Avoid missing out by staying informed – get our report now.
Visiongain is a trading partner with the US Federal Government
CCR Ref number: KD4R6
Do you have any custom requirements we can help you with? Any need for specific country, geo region, market segment or specific company information? Contact us today, we can discuss your needs and see how we can help sara.peerun@visiongain.com
Report Overview
1.1 Global Microbial Enhanced Oil Recovery Market
1.2 Global Microbial Enhanced Oil Recovery Market Overview
1.3 Global Microbial Enhanced Oil Recovery Market Segmentation
1.4 The Emergence of Microbial Enhanced Oil Recovery in the Industry
1.5 Why You Should Read This Report
1.6 How This Report Delivers
1.7 Key Questions Answered by This Analytical Report
1.8 Methodology
1.8.1 Secondary Research
1.8.2 Market Evaluation & Forecasting Methodology
1.9 Frequently Asked Questions (FAQ)
1.10 Associated Visiongain Reports
1.11 About Visiongain
2. Introduction to Microbial Enhanced Oil Recovery Market
2.1 Market Definition
2.2 Industry Outlook
2.3 Value Chain Analysis
2.4 Industry Structure
2.5 Current Status & Trends
2.6 Demand & Supply Analysis
2.7 Trade Analysis
2.8 Price Trend Analysis
3. Global Microbial Enhanced Oil Recovery Market Analysis
3.1 PEST Analysis of the Microbial Enhanced Oil Recovery Market
3.2 Expert Opinion
3.2.1 Primary Correspondents
3.3 Market Outlook
3.4 Drivers & Restraints
3.5 Dominant Region/Country
3.6 Market Scenario
3.7 Overall Growth Rate, Globally
3.8 SWOT Analysis of the Microbial Enhanced Oil Recovery Market
3.8.1 Strengths
3.8.2 Weaknesses
3.8.3 Opportunities
3.8.4 Threats
3.9 Porter’s Five Forces Analysis
3.9.1 Competitive Rivalry
3.9.2 Supplier Power
3.9.3 Buyer Power
3.9.4 Threat of Substitute
3..9.5 Threat of New Entrant
4. Microbial Enhanced Oil Recovery: Global Market Analysis by Segments
4.1 Global Microbial Enhanced Oil Recovery Market Forecast, by Application 2020-2030
4.1.1 Application Overview
4.1.2 Interfacial Tension Reduction Market, 2020-2030
4.1.3 Selective Plugging Market, 2020-2030
4.1.4 Gas Production Market, 2020-2030
4.1.5 Bio Degradation Market, 2020-2030
4.1.6 Wettability Alteration Market, 2020-2030
4.1.7 Emulsification And De Emulsification Market, 2020-2030
4.2 Global Microbial Enhanced Oil Recovery Market Forecast, by Type 2020-2030
4.2.1 Type Overview
4.2.2 Ground Method Market, 2020-2030
4.2.3 Reservoir Method Market, 2020-2030
4.2.4 Other Type Market, 2020-2030
4.3 Global Microbial Enhanced Oil Recovery Market Forecast, by Well Type 2020-2030
4.3.1 Well Type Overview
4.3.2 Onshore Oilfield Market, 2020-2030
4.3.3 Offshore Oilfield Market, 2020-2030
4.3.4 Other Well Type Market, 2020-2030
4.4 Global Microbial Enhanced Oil Recovery Market Forecast, by Injection Type 2020-2030
4.4.1 Injection Type Overview
4.4.2 Cyclic Injection Market, 2020-2030
4.4.3 Microbial Flooding Market, 2020-2030
4.4.4 Feeding Existing Bacteria Market, 2020-2030
4.4.5 Other Injection Type Market, 2020-2030
5. Leading Regions in Microbial Enhanced Oil Recovery Market 2020-2030
5.1 Regional Overview
5.1.1 North America
5.1.2 Europe
5.1.3 Asia Pacific
5.1.4 LAMEA
5.1.5 Leading Countries/ Regions
5.2 U.S. Microbial Enhanced Oil Recovery Market Forecast, 2020-2030
5.2.1 U.S. Microbial Enhanced Oil Recovery Submarket, By Application Forecast 2020-2030
5.2.2 U.S. Microbial Enhanced Oil Recovery Submarket, By Type Forecast 2020-2030
5.2.3 U.S. Microbial Enhanced Oil Recovery Submarket, By Well Type Forecast 2020-2030
5.2.4 U.S. Microbial Enhanced Oil Recovery Submarket, By Injection Type Forecast 2020-2030
5.3 Canada Microbial Enhanced Oil Recovery Market Forecast, 2020-2030
5.3.1 Canada Microbial Enhanced Oil Recovery Submarket, By Application Forecast 2020-2030
5.3.2 Canada Microbial Enhanced Oil Recovery Submarket, By Type Forecast 2020-2030
5.3.3 Canada Microbial Enhanced Oil Recovery Submarket, By Well Type Forecast 2020-2030
5.3.4 Canada Microbial Enhanced Oil Recovery Submarket, By Injection Type Forecast 2020-2030
5.4 The UK Microbial Enhanced Oil Recovery Market Forecast, 2020-2030
5.4.1 The UK Microbial Enhanced Oil Recovery Submarket, By Application Forecast 2020-2030
5.4.2 The UK Microbial Enhanced Oil Recovery Submarket, By Type Forecast 2020-2030
5.4.3 The UK Microbial Enhanced Oil Recovery Submarket, By Well Type Forecast 2020-2030
5.4.4 The UK Microbial Enhanced Oil Recovery Submarket, By Injection Type Forecast 2020-2030
5.5 Germany Microbial Enhanced Oil Recovery Market Forecast, 2020-2030
5.5.1 Germany Microbial Enhanced Oil Recovery Submarket, By Application Forecast 2020-2030
5.5.2 Germany Microbial Enhanced Oil Recovery Submarket, By Type Forecast 2020-2030
5.5.3 Germany Microbial Enhanced Oil Recovery Submarket, By Well Type Forecast 2020-2030
5.5.4 Germany Microbial Enhanced Oil Recovery Submarket, By Injection Type Forecast 2020-2030
5.6 France Microbial Enhanced Oil Recovery Market Forecast, 2020-2030
5.6.1 France Microbial Enhanced Oil Recovery Submarket, By Application Forecast 2020-2030
5.6.2 France Microbial Enhanced Oil Recovery Submarket, By Type Forecast 2020-2030
5.6.3 France Microbial Enhanced Oil Recovery Submarket, By Well Type Forecast 2020-2030
5.6.4 France Microbial Enhanced Oil Recovery Submarket, By Injection Type Forecast 2020-2030
5.7 Italy Microbial Enhanced Oil Recovery Market Forecast, 2020-2030
5.7.1 Italy Microbial Enhanced Oil Recovery Submarket, By Application Forecast 2020-2030
5.7.2 Italy Microbial Enhanced Oil Recovery Submarket, By Type Forecast 2020-2030
5.7.3 Italy Microbial Enhanced Oil Recovery Submarket, By Well Type Forecast 2020-2030
5.7.4 Italy Microbial Enhanced Oil Recovery Submarket, By Injection Type Forecast 2020-2030
5.8 Spain Microbial Enhanced Oil Recovery Market Forecast, 2020-2030
5.8.1 Spain Microbial Enhanced Oil Recovery Submarket, By Application Forecast 2020-2030
5.8.2 Spain Microbial Enhanced Oil Recovery Submarket, By Type Forecast 2020-2030
5.8.3 Spain Microbial Enhanced Oil Recovery Submarket, By Well Type Forecast 2020-2030
5.8.4 Spain Microbial Enhanced Oil Recovery Submarket, By Injection Type Forecast 2020-2030
5.9 Rest of Europe Microbial Enhanced Oil Recovery Market Forecast, 2020-2030
5.9.1 Rest of Europe Microbial Enhanced Oil Recovery Submarket, By Application Forecast 2020-2030
5.9.2 Rest of Europe Microbial Enhanced Oil Recovery Submarket, By Type Forecast 2020-2030
5.9.3 Rest of Europe Microbial Enhanced Oil Recovery Submarket, By Well Type Forecast 2020-2030
5.9.4 Rest of Europe Microbial Enhanced Oil Recovery Submarket, By Injection Type Forecast 2020-2030
5.10 China Microbial Enhanced Oil Recovery Market Forecast, 2020-2030
5.10.1 China Microbial Enhanced Oil Recovery Submarket, By Application Forecast 2020-2030
5.10.2 China Microbial Enhanced Oil Recovery Submarket, By Type Forecast 2020-2030
5.10.3 China Microbial Enhanced Oil Recovery Submarket, By Well Type Forecast 2020-2030
5.10.4 China Microbial Enhanced Oil Recovery Submarket, By Injection Type Forecast 2020-2030
5.11 India Microbial Enhanced Oil Recovery Market Forecast, 2020-2030
5.11.1 India Microbial Enhanced Oil Recovery Submarket, By Application Forecast 2020-2030
5.11.2 India Microbial Enhanced Oil Recovery Submarket, By Type Forecast 2020-2030
5.11.3 India Microbial Enhanced Oil Recovery Submarket, By Well Type Forecast 2020-2030
5.11.4 India Microbial Enhanced Oil Recovery Submarket, By Injection Type Forecast 2020-2030
5.12 Japan Microbial Enhanced Oil Recovery Market Forecast, 2020-2030
5.12.1 Japan Microbial Enhanced Oil Recovery Submarket, By Application Forecast 2020-2030
5.12.2 Japan Microbial Enhanced Oil Recovery Submarket, By Type Forecast 2020-2030
5.12.3 Japan Microbial Enhanced Oil Recovery Submarket, By Well Type Forecast 2020-2030
5.12.4 Japan Microbial Enhanced Oil Recovery Submarket, By Injection Type Forecast 2020-2030
5.13 Australia & New Zealand Microbial Enhanced Oil Recovery Market Forecast, 2020-2030
5.13.1 Australia & New Zealand Microbial Enhanced Oil Recovery Submarket, By Application Forecast 2020-2030
5.13.2 Australia & New Zealand Microbial Enhanced Oil Recovery Submarket, By Type Forecast 2020-2030
5.13.3 Australia & New Zealand Microbial Enhanced Oil Recovery Submarket, By Well Type Forecast 2020-2030
5.13.4 Australia & New Zealand Microbial Enhanced Oil Recovery Submarket, By Injection Type Forecast 2020-2030
5.14 Rest of Asia-Pacific Microbial Enhanced Oil Recovery Market Forecast, 2020-2030
5.14.1 Rest of Asia-Pacific Microbial Enhanced Oil Recovery Submarket, By Application Forecast 2020-2030
5.14.2 Rest of Asia-Pacific Microbial Enhanced Oil Recovery Submarket, By Type Forecast 2020-2030
5.14.3 Rest of Asia-Pacific Microbial Enhanced Oil Recovery Submarket, By Well Type Forecast 2020-2030
5.14.4 Rest of Asia-Pacific Microbial Enhanced Oil Recovery Submarket, By Injection Type Forecast 2020-2030
5.15 Latin America Microbial Enhanced Oil Recovery Market Forecast, 2020-2030
5.15.1 Latin America Microbial Enhanced Oil Recovery Submarket, By Application Forecast 2020-2030
5.15.2 Latin America Microbial Enhanced Oil Recovery Submarket, By Type Forecast 2020-2030
5.15.3 Latin America Microbial Enhanced Oil Recovery Submarket, By Well Type Forecast 2020-2030
5.15.4 Latin America Microbial Enhanced Oil Recovery Submarket, By Injection Type Forecast 2020-2030
5.16 Middle East Microbial Enhanced Oil Recovery Market Forecast, 2020-2030
5.16.1 Middle East Microbial Enhanced Oil Recovery Submarket, By Application Forecast 2020-2030
5.16.2 Middle East Microbial Enhanced Oil Recovery Submarket, By Type Forecast 2020-2030
5.16.3 Middle East Microbial Enhanced Oil Recovery Submarket, By Well Type Forecast 2020-2030
5.16.4 Middle East Microbial Enhanced Oil Recovery Submarket, By Injection Type Forecast 2020-2030
5.17 Africa Microbial Enhanced Oil Recovery Market Forecast, 2020-2030
5.17.1 Africa Microbial Enhanced Oil Recovery Submarket, By Application Forecast 2020-2030
5.17.2 Africa Microbial Enhanced Oil Recovery Submarket, By Type Forecast 2020-2030
5.17.3 Africa Microbial Enhanced Oil Recovery Submarket, By Well Type Forecast 2020-2030
5.17.4 Africa Microbial Enhanced Oil Recovery Submarket, By Injection Type Forecast 2020-2030
7. Leading Companies in The Microbial Enhanced Oil Recovery Market
7.1 Genome Prairie
7.1.1 Genome Prairie Products and Services
7.1.2 Analysis of Genome Prairie within the Microbial Enhanced Oil Recovery Market
7.1.3 Genome Prairie M&A Activity
7.1.4 Future Outlook for Genome Prairie
7.1.5 Genome Prairie Projects
7.2 Chemiphase Ltd.
7.2.1 Chemiphase Ltd. Products and Services
7.2.2 Analysis of Chemiphase Ltd. within the Microbial Enhanced Oil Recovery Market
7.2.3 Chemiphase Ltd. M&A Activity
7.2.4 Future Outlook for Chemiphase Ltd.
7.2.5 Chemiphase Ltd. Projects
7.3 CNPC
7.3.1 CNPC Products and Services
7.3.2 Analysis of CNPC within the Microbial Enhanced Oil Recovery Market
7.3.3 CNPC M&A Activity
7.3.4 Future Outlook for CNPC
7.3.5 CNPC Projects
7.4 Gulf Energy
7.4.1 Gulf Energy Products and Services
7.4.2 Analysis of Gulf Energy within the Microbial Enhanced Oil Recovery Market
7.4.3 Gulf Energy M&A Activity
7.4.4 Future Outlook for Gulf Energy
7.4.5 Gulf Energy Projects
7.5 Glori Energy Inc.
7.5.1 Glori Energy Inc. Products and Services
7.5.2 Analysis of Glori Energy Inc. within the Microbial Enhanced Oil Recovery Market
7.5.3 Glori Energy Inc. M&A Activity
7.5.4 Future Outlook for Glori Energy Inc.
7.5.5 Glori Energy Inc. Projects
7.6 StatOil
7.6.1 StatOil Products and Services
7.6.2 Analysis of StatOil within the Microbial Enhanced Oil Recovery Market
7.6.3 StatOil M&A Activity
7.6.4 Future Outlook for StatOil
7.6.5 StatOil Projects
7.7 Titan Oil Recovery
7.7.1 Titan Oil Recovery Products and Services
7.7.2 Analysis of Titan Oil Recovery within the Microbial Enhanced Oil Recovery Market
7.7.3 Titan Oil Recovery M&A Activity
7.7.4 Future Outlook for Titan Oil Recovery
7.7.5 Titan Oil Recovery Projects
7.8 Royal Dutch Shell
7.8.1 Royal Dutch Shell Products and Services
7.8.2 Analysis of Royal Dutch Shell within the Microbial Enhanced Oil Recovery Market
7.8.3 Royal Dutch Shell M&A Activity
7.8.4 Future Outlook for Royal Dutch Shell
7.8.5 Royal Dutch Shell Projects
7.9 BP
7.9.1 BP Products and Services
7.9.2 Analysis of BP within the Microbial Enhanced Oil Recovery Market
7.9.3 BP M&A Activity
7.9.4 Future Outlook for BP
7.9.5 BP Projects
7.10 ConocoPhillips
7.10.1 ConocoPhillips Products and Services
7.10.2 Analysis of ConocoPhillips within the Microbial Enhanced Oil Recovery Market
7.10.3 ConocoPhillips M&A Activity
7.10.4 Future Outlook for ConocoPhillips
7.10.5 ConocoPhillips Projects
7.11 E. I. Du Pont De Nemours And Company
7.11.1 E. I. Du Pont De Nemours And Company Products and Services
7.11.2 Analysis of E. I. Du Pont De Nemours And Company within the Microbial Enhanced Oil Recovery Market
7.11.3 E. I. Du Pont De Nemours And Company M&A Activity
7.11.4 Future Outlook for E. I. Du Pont De Nemours And Company
7.11.5 E. I. Du Pont De Nemours And Company Projects
8. Conclusions and Recommendations
8.1 Global Microbial Enhanced Oil Recovery Market Outlook
8.2 Recommendations
9. Glossary
Associated Visiongain Reports
Visiongain Report Sales Order Form
Appendix A
About Visiongain
Appendix B
Visiongain Report Evaluation Form
List of Tables
Table 1.0 Key Highlights
Table 3.1 PEST Analysis, Microbial Enhanced Oil Recovery Market
Table 3.2 SWOT Analysis
Table 4.1 Global Microbial Enhanced Oil Recovery Market Forecast 2020-2030 ($Bn, AGR %, CAGR %, Cumulative)
Table 4.2 Global Microbial Enhanced Oil Recovery Submarket, By Application Forecast 2020-2030 ($billion, AGR %, Cumulative)
Table 4.3 Global Microbial Enhanced Oil Recovery Submarket, By Well Type Forecast 2020-2030 ($billion, AGR %, Cumulative)
Table 4.4 Global Microbial Enhanced Oil Recovery Submarket, By Injection Type Forecast 2020-2030 ($billion, AGR %, Cumulative)
Table 5.1 Global Microbial Enhanced Oil Recovery Market, by Country/Region Forecast 2020-2030 ($billion, AGR %, Cumulative)
Table 5.2 Global Microbial Enhanced Oil Recovery Market, by Country/Region Forecast 2020-2030 ($billion, AGR %, Cumulative)
Table 5.3 Canada Microbial Enhanced Oil Recovery Market Forecast 2020-2030 ($billion, , AGR %, CAGR %, Cumulative)
Table 5.4 Canada Microbial Enhanced Oil Recovery Submarket, By Application Forecast 2020-2030 ($billion, AGR %, Cumulative)
Table 5.5 Canada Microbial Enhanced Oil Recovery Submarket, By Type Forecast 2020-2030 ($billion, AGR %, Cumulative)
Table 5.6 US Microbial Enhanced Oil Recovery Market Submarket, By Well Type Forecast 2020-2030 ($billion, , AGR %, CAGR %, Cumulative)
Table 5.7 US Microbial Enhanced Oil Recovery Submarket, By Application Forecast 2020-2030 ($billion, AGR %, Cumulative)
Table 5.8 US Microbial Enhanced Oil Recovery Submarket, By Type Forecast 2020-2030 ($billion, AGR %, Cumulative)
Table 5.9 Latin America Microbial Enhanced Oil Recovery Market Forecast 2020-2030 ($billion, , AGR %, CAGR %, Cumulative)
Table 5.10 Latin America Microbial Enhanced Oil Recovery Submarket, By Application Forecast 2020-2030 ($billion, AGR %, Cumulative)
Table 5.11 Latin America Microbial Enhanced Oil Recovery Submarket, By Type Forecast 2020-2030 ($billion, AGR %, Cumulative)
Table 5.12 Germany Microbial Enhanced Oil Recovery Market Submarket, By Well Type Forecast 2020-2030 ($billion, , AGR %, CAGR %, Cumulative)
Table 5.13 Germany Microbial Enhanced Oil Recovery Submarket, By Application Forecast 2020-2030 ($billion, AGR %, Cumulative)
Table 5.14 Germany Microbial Enhanced Oil Recovery Submarket, By Type Forecast 2020-2030 ($billion, AGR %, Cumulative)
Table 5.15 UK Microbial Enhanced Oil Recovery Market Submarket, By Well Type Forecast 2020-2030 ($billion, , AGR %, CAGR %, Cumulative)
Table 5.16 UK Microbial Enhanced Oil Recovery Submarket, By Application Forecast 2020-2030 ($billion, AGR %, Cumulative)
Table 5.17 UK Microbial Enhanced Oil Recovery Submarket, By Type Forecast 2020-2030 ($billion, AGR %, Cumulative)
Table 5.18 Spain Microbial Enhanced Oil Recovery Market Submarket, By Well Type Forecast 2020-2030 ($billion, , AGR %, CAGR %, Cumulative)
Table 5.19 Spain Microbial Enhanced Oil Recovery Submarket, By Application Forecast 2020-2030 ($billion, AGR %, Cumulative)
Table 5.20 Spain Microbial Enhanced Oil Recovery Submarket, By Type Forecast 2020-2030 ($billion, AGR %, Cumulative)
Table 5.21 UK Microbial Enhanced Oil Recovery Submarket, By Well Type Forecast 2020-2030 ($billion, , AGR %, CAGR %, Cumulative)
Table 5.22 UK Microbial Enhanced Oil Recovery Submarket, By Application Forecast 2020-2030 ($billion, AGR %, Cumulative)
Table 5.23 UK Microbial Enhanced Oil Recovery Submarket, By Type Forecast 2020-2030 ($billion, AGR %, Cumulative)
Table 5.24 China Microbial Enhanced Oil Recovery Submarket, By Well Type Forecast 2020-2030 ($billion, , AGR %, CAGR %, Cumulative)
Table 5.25 China Microbial Enhanced Oil Recovery Submarket, By Application Forecast 2020-2030 ($billion, AGR %, Cumulative)
Table 5.26 China Microbial Enhanced Oil Recovery Submarket, By Type Forecast 2020-2030 ($billion, AGR %, Cumulative)
Table 5.27 Australia Microbial Enhanced Oil Recovery Submarket, By Well Type Forecast 2020-2030 ($billion, , AGR %, CAGR %, Cumulative)
Table 5.28 Australia Microbial Enhanced Oil Recovery Submarket, By Application Forecast 2020-2030 ($billion, AGR %, Cumulative)
Table 5.29 Australia Microbial Enhanced Oil Recovery Submarket, By Type Forecast 2020-2030 ($billion, AGR %, Cumulative)
Table 5.30 South Korea Microbial Enhanced Oil Recovery Submarket, By Well Type Forecast 2020-2030 ($billion, , AGR %, CAGR %, Cumulative)
Table 5.31 South Korea Microbial Enhanced Oil Recovery Submarket, By Application Forecast 2020-2030 ($billion, AGR %, Cumulative)
Table 5.32 South Korea Microbial Enhanced Oil Recovery Submarket, By Type Forecast 2020-2030 ($billion, AGR %, Cumulative)
Table 5.33 Japan Microbial Enhanced Oil Recovery Submarket, By Well Type Forecast 2020-2030 ($billion, , AGR %, CAGR %, Cumulative)
Table 5.34 Japan Microbial Enhanced Oil Recovery Submarket, By Application Forecast 2020-2030 ($billion, AGR %, Cumulative)
Table 5.35 Japan Microbial Enhanced Oil Recovery Submarket, By Type Forecast 2020-2030 ($billion, AGR %, Cumulative)
Table 5.36 India Microbial Enhanced Oil Recovery Submarket, By Well Type Forecast 2020-2030 ($billion, , AGR %, CAGR %, Cumulative)
Table 5.37 India Microbial Enhanced Oil Recovery Submarket, By Application Forecast 2020-2030 ($billion, AGR %, Cumulative)
Table 5.38 India Microbial Enhanced Oil Recovery Submarket, By Type Forecast 2020-2030 ($billion, AGR %, Cumulative)
Table 5.39 Middle East Microbial Enhanced Oil Recovery Submarket, By Well Type Forecast 2020-2030 ($billion, , AGR %, CAGR %, Cumulative)
Table 5.40 Middle East Microbial Enhanced Oil Recovery Submarket, By Application Forecast 2020-2030 ($billion, AGR %, Cumulative)
Table 5.41 Middle East Microbial Enhanced Oil Recovery Submarket, By Type Forecast 2020-2030 ($billion, AGR %, Cumulative)
Table 5.42 Rest of Asia-Pacific Microbial Enhanced Oil Recovery Submarket, By Well Type Forecast 2020-2030 ($billion , , AGR %, CAGR %, Cumulative)
Table 5.43 Rest of Asia-Pacific Microbial Enhanced Oil Recovery Submarket, By Application Forecast 2020-2030 ($billion , AGR %, Cumulative)
Table 5.44 Rest of Asia-Pacific Microbial Enhanced Oil Recovery Submarket, By Type Forecast 2020-2030 ($billion , AGR %, Cumulative)
Table 5.45 Rest of Europe Microbial Enhanced Oil Recovery Submarket, By Well Type Forecast 2020-2030 ($billion, , AGR %, CAGR %, Cumulative)
Table 5.46 Rest of Europe Microbial Enhanced Oil Recovery Submarket, By Application Forecast 2020-2030 ($billion, AGR %, Cumulative)
Table 5.47 Rest of Europe Microbial Enhanced Oil Recovery Submarket, By Type Forecast 2020-2030 ($billion, AGR %, Cumulative)
Table 5.48 Africa Microbial Enhanced Oil Recovery Submarket, By Well Type Forecast 2020-2030 ($billion, , AGR %, CAGR %, Cumulative)
Table 5.49 Africa Microbial Enhanced Oil Recovery Submarket, By Application Forecast 2020-2030 ($billion, AGR %, Cumulative)
Table 5.50 Africa Microbial Enhanced Oil Recovery Submarket, By Type Forecast 2020-2030 ($billion, AGR %, Cumulative)
Table 5.51 Spain Microbial Enhanced Oil Recovery Submarket, By Well Type Forecast 2020-2030 ($billion , , AGR %, CAGR %, Cumulative)
Table 5.52 Spain Microbial Enhanced Oil Recovery Submarket, By Application Forecast 2020-2030 ($billion , AGR %, Cumulative)
Table 5.53 Spain Microbial Enhanced Oil Recovery Submarket, By Type Forecast 2020-2030 ($billion , AGR %, Cumulative)
Table 7.1 Genome Prairie Profile 2019 (Market Entry, Public/Private, Headquarters, Geography, Key Market, Listed on, Products/Services
Table 7.2 Genome Prairie Profile 2019 (Market Entry, Public/Private, Headquarter, Total Company Revenue $billion, Change in Revenue, Geography, Key Market, Listed on, Products/Services)
Table 7.3 Genome Prairie Products and Services (Product/Service, Notes)
Table 7.4 Genome Prairie Total Company Sales 2015-2019 (US$billion, AGR %)
Table 7.5 Genome Prairie Total Company Recent Development 2015-2019
Table 7.6 Chemiphase Ltd. Profile 2019 (Market Entry, Public/Private, Headquarter, Total Company Revenue $billion, Change in Revenue, Geography, Key Market, Listed on, Products/Services)
Table 7.7 Chemiphase Ltd. Products and Services (Product/Service, Notes)
Table 7.8 Chemiphase Ltd. Total Company Sales 2015-2019 (US$billion, AGR %)
Table 7.9 Chemiphase Ltd. Total Company Recent Development 2015-2019
Table 7.10 CNPC Profile 2019 (Market Entry, Public/Private, Headquarter, Total Company Revenue $billion, Change in Revenue, Geography, Key Market, Listed on, Products/Services)
Table 7.11 CNPC Products and Services (Product/Service, Notes)
Table 7.12 CNPC Total Company Sales 2015-2019 (US$billion, AGR %)
Table 7.13 CNPC Total Company Recent Development 2015-2019
Table 7.14 Gulf Energy Profile 2019 (Market Entry, Public/Private, Headquarter, Total Company Revenue $billion, Change in Revenue, Geography, Key Market, Listed on, Products/Services)
Table 7.15 Gulf Energy Products and Services (Product/Service, Notes)
Table 7.16 Gulf Energy Total Company Sales 2015-2019 (US$billion, AGR %)
Table 7.17 Gulf Energy Total Company Recent Development 2015-2019
Table 7.18 Glori Energy Inc. Profile 2019 (Market Entry, Public/Private, Headquarter, Total Company Revenue $billion, Change in Revenue, Geography, Key Market, Listed on, Products/Services)
Table 7.19 Glori Energy Inc. Products and Services (Product/Service, Notes)
Table 7.20 Glori Energy Inc. Total Company Sales 2015-2019 (US$billion, AGR %)
Table 7.21 Glori Energy Inc. Total Company Recent Development 2015-2019
Table 7.22 StatOil Profile 2019 (Market Entry, Public/Private, Headquarter, Total Company Revenue $billion, Change in Revenue, Geography, Key Market, Listed on, Products/Services)
Table 7.23 StatOil Products and Services (Product/Service, Notes)
Table 7.24 StatOil Total Company Sales 2015-2019 (US$billion, AGR %)
Table 7.25 StatOil Total Company Recent Development 2015-2019
Table 7.26 Titan Oil Recovery Profile 2019 (Market Entry, Public/Private, Headquarter, Total Company Revenue $billion, Change in Revenue, Geography, Key Market, Listed on, Products/Services)
Table 7.27 Titan Oil Recovery Products and Services (Product/Service, Notes)
Table 7.28 Titan Oil Recovery Total Company Sales 2015-2019 (US$billion, AGR %)
Table 7.29 Titan Oil Recovery Total Company Recent Development 2015-2019
Table 7.30 Royal Dutch Shell Profile 2019 (Market Entry, Public/Private, Headquarter, Total Company Revenue $billion, Change in Revenue, Geography, Key Market, Listed on, Products/Services)
Table 7.31 Royal Dutch Shell Products and Services (Product/Service, Notes)
Table 7.32 Royal Dutch Shell Total Company Sales 2015-2019 (US$billion, AGR %)
Table 7.33 Royal Dutch Shell Total Company Recent Development 2015-2019
Table 7.34 BP Profile 2019 (Market Entry, Public/Private, Headquarter, Total Company Revenue $billion, Change in Revenue, Geography, Key Market, Listed on, Products/Services)
Table 7.35 BP Products and Services (Product/Service, Notes)
Table 7.36 BP Total Company Sales 2015-2019 (US$billion, AGR %)
Table 7.37 BP Total Company Recent Development 2015-2019
Table 7.38 ConocoPhillips Profile 2019 (Market Entry, Public/Private, Headquarter, Total Company Revenue $billion, Change in Revenue, Geography, Key Market, Listed on, Products/Services)
Table 7.39 ConocoPhillips Products and Services (Product/Service, Notes)
Table 7.40 ConocoPhillips Total Company Sales 2015-2019 (US$billion, AGR %)
Table 7.41 ConocoPhillips Total Company Recent Development 2015-2019
Table 7.42 E. I. Du Pont De Nemours And Company Profile 2019 (Market Entry, Public/Private, Headquarter, Total Company Revenue $billion, Change in Revenue, Geography, Key Market, Listed on, Products/Services)
Table 7.43 E. I. Du Pont De Nemours And Company Products and Services (Product/Service, Notes)
Table 7.44 E. I. Du Pont De Nemours And Company Total Company Sales 2015-2019 (US$billion, AGR %)
Table 7.45 E. I. Du Pont De Nemours And Company Total Company Recent Development 2015-2019
List of Figures
Figure 1.1 Global Microbial Enhanced Oil Recovery Market Segmentation
Figure 2.1 Microbial Enhanced Oil Recovery Value Chain Analysis
Figure 3.1 Microbial Enhanced Oil Recovery Supply-Demand Analysis
Figure 4.1 Global Microbial Enhanced Oil Recovery Forecast 2020-2030 ($billion, AGR %)
Figure 4.2 Global Microbial Enhanced Oil Recovery Market Forecast 2020-2030
Figure 4.3 Global Microbial Enhanced Oil Recovery Submarket Forecast by 2020-2030 ($ billion)
Figure 4.4 Global Microbial Enhanced Oil Recovery Market By Application Share Forecast 2020, 2025, 2030 (% Share)
Figure 4.19 Global Microbial Enhanced Oil Recovery by Submarket By Application Forecast 2020-2030 ($ million)
Figure 4.20 Global Microbial Enhanced Oil Recovery Market, by Share Forecast 2020, 2025, 2030 (% Share)
Figure 4.21 Microbial Enhanced Oil Recovery Market, By Application Forecast 2020-2030 ($billion, AGR%)
Figure 4.23 Microbial Enhanced Oil Recovery Market, By Application Forecast 2020-2030 ($billion, AGR%)
Figure 4.25 Microbial Enhanced Oil Recovery Market, By Application Forecast 2020-2030 ($billion, AGR%)
Figure 4.27 Microbial Enhanced Oil Recovery Market, By Application Forecast 2020-2030 ($billion, AGR%)
Figure 5.1 Regional/Country Microbial Enhanced Oil Recovery Market, by 2020-2030
Figure 5.3 Leading Country/Regional Microbial Enhanced Oil Recovery Market Share, by 2020
Figure 5.4 Leading Country/Regional Microbial Enhanced Oil Recovery Market Share, by 2025
Figure 5.5 Leading Country/Regional Microbial Enhanced Oil Recovery Market Share, by 2030
Figure 5.6 Canada Microbial Enhanced Oil Recovery Market Forecast 2020-2030 ($billion, AGR%)
Figure 5.7 Canada Microbial Enhanced Oil Recovery Market, by Forecast 2020-2030
Figure 5.8 Canada Microbial Enhanced Oil Recovery Submarket, By Application Forecast 2020-2030
Figure 5.9 Canada Microbial Enhanced Oil Recovery Submarket , By Type Forecast 2020-2030
Figure 5.10 Canada Microbial Enhanced Oil Recovery Submarket , By Well Type 2020-2030 ($billion, AGR%)
Figure 5.10 U.S. Microbial Enhanced Oil Recovery Market Forecast 2020-2030 ($billion, AGR%)
Figure 5.11 U.S. Microbial Enhanced Oil Recovery Market, by Forecast 2020-2030
Figure 5.12 U.S. Microbial Enhanced Oil Recovery Submarket, By Application Forecast 2020-2030
Figure 5.13 U.S. Microbial Enhanced Oil Recovery Submarket , By Type Forecast 2020-2030
Figure 5.13 U.S. Microbial Enhanced Oil Recovery Submarket , By Well Type Forecast 2020-2030
Figure 5.14 Latin America Microbial Enhanced Oil Recovery Market Forecast 2020-2030 ($billion , AGR%)
Figure 5.15 Latin America Microbial Enhanced Oil Recovery Market, by Forecast 2020-2030
Figure 5.16 Latin America Microbial Enhanced Oil Recovery Submarket, By Application Forecast 2020-2030
Figure 5.17 Latin America Microbial Enhanced Oil Recovery Submarket , By Type Forecast 2020-2030
Figure 5.17 Latin America Microbial Enhanced Oil Recovery Submarket , By Well Type Forecast 2020-2030
Figure 5.18 Germany Microbial Enhanced Oil Recovery Market Forecast 2020-2030 ($billion, AGR%)
Figure 5.19 Germany Microbial Enhanced Oil Recovery Market, by Forecast 2020-2030
Figure 5.20 Germany Microbial Enhanced Oil Recovery Submarket, By Application Forecast 2020-2030
Figure 5.21 Germany Microbial Enhanced Oil Recovery Submarket , By Type Forecast 2020-2030
Figure 5.21 Germany Microbial Enhanced Oil Recovery Submarket , By Well Type Forecast 2020-2030
Figure 5.22 U.K. Microbial Enhanced Oil Recovery Market Forecast 2020-2030 ($billion, AGR%)
Figure 5.23 U.K. Microbial Enhanced Oil Recovery Market, by Forecast 2020-2030
Figure 5.24 U.K. Microbial Enhanced Oil Recovery Submarket, By Application Forecast 2020-2030
Figure 5.25 U.K. Microbial Enhanced Oil Recovery Submarket , By Type Forecast 2020-2030
Figure 5.25 U.K. Microbial Enhanced Oil Recovery Submarket , By Well Type Forecast 2020-2030
Figure 5.26 Spain Microbial Enhanced Oil Recovery Market Forecast 2020-2030 ($billion, AGR%)
Figure 5.27 Spain Microbial Enhanced Oil Recovery Market, by Forecast 2020-2030
Figure 5.28 Spain Microbial Enhanced Oil Recovery Submarket, By Application Forecast 2020-2030
Figure 5.29 Spain Microbial Enhanced Oil Recovery Submarket , By Type Forecast 2020-2030
Figure 5.30 UK Microbial Enhanced Oil Recovery Market Forecast 2020-2030 ($billion, AGR%)
Figure 5.31 UK Microbial Enhanced Oil Recovery Market, by Forecast 2020-2030
Figure 5.32 UK Microbial Enhanced Oil Recovery Submarket, By Application Forecast 2020-2030
Figure 5.33 UK Microbial Enhanced Oil Recovery Submarket , By Type Forecast 2020-2030
Figure 5.34 China Microbial Enhanced Oil Recovery Market Forecast 2020-2030 ($billion, AGR%)
Figure 5.35 China Microbial Enhanced Oil Recovery Submarket , By Well Type, by Forecast 2020-2030
Figure 5.36 China Microbial Enhanced Oil Recovery Submarket, By Application Forecast 2020-2030
Figure 5.37 China Microbial Enhanced Oil Recovery Submarket , By Type Forecast 2020-2030
Figure 5.38 Australia Microbial Enhanced Oil Recovery Market Forecast 2020-2030 ($billion, AGR%)
Figure 5.39 Australia Microbial Enhanced Oil Recovery Submarket , By Well Type, by Forecast 2020-2030
Figure 5.40 Australia Microbial Enhanced Oil Recovery Submarket, By Application Forecast 2020-2030
Figure 5.41 Australia Microbial Enhanced Oil Recovery Submarket , By Type Forecast 2020-2030
Figure 5.42 South Korea Microbial Enhanced Oil Recovery Market Forecast 2020-2030 ($billion, AGR%)
Figure 5.43 South Korea Microbial Enhanced Oil Recovery Submarket , By Well Type, by Forecast 2020-2030
Figure 5.44 South Korea Microbial Enhanced Oil Recovery Submarket, By Application Forecast 2020-2030
Figure 5.45 South Korea Microbial Enhanced Oil Recovery Submarket , By Type Forecast 2020-2030
Figure 5.46 Japan Microbial Enhanced Oil Recovery Market Forecast 2020-2030 ($billion, AGR%)
Figure 5.47 Japan Microbial Enhanced Oil Recovery Submarket , By Well Type, by Forecast 2020-2030
Figure 5.48 Japan Microbial Enhanced Oil Recovery Submarket, By Application Forecast 2020-2030
Figure 5.49 Japan Microbial Enhanced Oil Recovery Submarket , By Type Forecast 2020-2030
Figure 5.50 India Microbial Enhanced Oil Recovery Market Forecast 2020-2030 ($billion, AGR%)
Figure 5.51 India Microbial Enhanced Oil Recovery Submarket , By Well Type, by Forecast 2020-2030
Figure 5.52 India Microbial Enhanced Oil Recovery Submarket, By Application Forecast 2020-2030
Figure 5.53 India Microbial Enhanced Oil Recovery Submarket , By Type Forecast 2020-2030
Figure 5.54 Middle East Microbial Enhanced Oil Recovery Market Forecast 2020-2030 ($billion, AGR%)
Figure 5.55 Middle East Microbial Enhanced Oil Recovery Submarket , By Well Type, by Forecast 2020-2030
Figure 5.56 Middle East Microbial Enhanced Oil Recovery Submarket, By Application Forecast 2020-2030
Figure 5.57 Middle East Microbial Enhanced Oil Recovery Submarket , By Type Forecast 2020-2030
Figure 5.70 Rest of the World Microbial Enhanced Oil Recovery Market Forecast 2020-2030 ($billion , AGR%)
Figure 5.71 Rest of the World Microbial Enhanced Oil Recovery Submarket , By Well Type, by Forecast 2020-2030
Figure 5.72 Rest of the World Microbial Enhanced Oil Recovery Submarket, By Application Forecast 2020-2030
Figure 5.73 Rest of the World Microbial Enhanced Oil Recovery Submarket , By Type Forecast 2020-2030
Figure 7.1 Genome Prairie Total Company Sales 2013-2019 (US$ million, AGR %)
Figure 7.2 Chemiphase Ltd. Total Company Sales 2013-2019 (US$ million, AGR %)
Figure 7.3 CNPC Total Company Sales 2013-2019 (US$ Bn, AGR %)
Figure 7.6 Gulf Energy Company Sales 2013-2019 (US$ bn, AGR %)
Figure 7.7 Gulf Energy Revenue % Share, by Well Type Segment, 2019
Figure 7.8 Gulf Energy Revenue % Share, by Geographical Trade, 2019
Figure 7.9 Gulf Energy Revenue % Share, by Business Segment, 2019
Figure 7.10 Glori Energy Inc. Revenue % Share, by Geographic Segment, 2019
Figure 7.11 StatOil Company Total Company Sales 2013-2019 (US$ million, AGR %)
Figure 7.12 Titan Oil Recovery Total Company Sales 2013-2019 (US$ million, AGR %)
Figure 7.13 Titan Oil Recovery Revenue % Share, by Regional Segment, 2019
Figure 7.14 Royal Dutch Shell Total Company Sales 2013-2019 (US$ million, AGR %)
Figure 7.15 Royal Dutch Shell Revenue % Share, by Regional Segment, 2019
Figure 7.16 Royal Dutch Shell Revenue % Share, by Business Segment, 2019
Figure 7.17 BP Total Company Sales 2013-2019 (US$ bn, AGR %)
Figure 7.18 ConocoPhillips Total Company Revenue 2013-2019 (US$ bn, AGR %)
Figure 7.19 ConocoPhillips Company Sales 2014-2019 (US$ bn, AGR %)
Figure 7.20 ConocoPhillips Revenue % Share, by Business Segment, 2019