The Smart Manufacturing Market Report 2023-2033: This report will prove invaluable to leading firms striving for new revenue pockets if they wish to better understand the industry and its underlying dynamics. It will be useful for companies that would like to expand into different industries or to expand their existing operations in a new region.
Smart Factory Initiatives Will Have a Significant Impact on Manufacturing Productivity
The promise of increased labour productivity is certainly appealing to the manufacturing industry, which is currently experiencing a labour shortage that is threatening to stifle productivity. As companies combine technologies, they can achieve new levels of productivity throughout the factory such as vision systems, harmonic sensors, and robots with cognitive computing, machine learning, and autonomous capabilities. This curve has been observed during each industrial revolution. Significant labour productivity gains appear near the end of the cycle, reflecting the cumulative impact of reaching a critical mass of technology adoption. Whether manufacturers are just getting started with smart factories or have already invested in them, there is no doubt that smart factory initiatives will have a significant impact on manufacturing productivity.
The modern Internet and Internet technologies have undoubtedly made significant advances in all aspects of human activity. It is unavoidable that integration in production systems will increase the complexity of existing production systems as well as new systems coming to us, such as cyber physical production systems. The development of production systems in the spirit of cyber-physical production systems, the use of digitization, and the imperative of E business is to aspire to smart factories of the future.
What Questions Should You Ask before Buying a Market Research Report?
• How is the smart manufacturing market evolving?
• What is driving and restraining the smart manufacturing market?
• How will each smart manufacturing submarket segment grow over the forecast period and how much revenue will these submarkets account for in 2033?
• How will the market shares for each smart manufacturing submarket develop from 2023 to 2033?
• What will be the main driver for the overall market from 2023 to 2033?
• Will leading smart manufacturing markets broadly follow the macroeconomic dynamics, or will individual national markets outperform others?
• How will the market shares of the national markets change by 2033 and which geographical region will lead the market in 2033?
• Who are the leading players and what are their prospects over the forecast period?
• What are the smart manufacturing projects for these leading companies?
• How will the industry evolve during the period between 2023 and 2033? What are the implications of smart manufacturing projects taking place now and over the next 10 years?
• Is there a greater need for product commercialisation to further scale the smart manufacturing market?
• Where is the smart manufacturing market heading and how can you ensure you are at the forefront of the market?
• What are the best investment options for new product and service lines?
• What are the key prospects for moving companies into a new growth path and C-suite?
You need to discover how this will impact the smart manufacturing market today, and over the next 10 years:
• Our 344-page report provides 187 tables and 197 charts/graphs exclusively to you.
• The report highlights key lucrative areas in the industry so you can target them – NOW.
• It contains in-depth analysis of global, regional and national sales and growth.
• It highlights for you the key successful trends, changes and revenue projections made by your competitors.
This report tells you TODAY how the smart manufacturing market will develop in the next 10 years, and in line with the variations in COVID-19 economic recession and bounce. This market is more critical now than at any point over the last 10 years.
Forecasts to 2033 and other analyses reveal commercial prospects
• In addition to revenue forecasting to 2033, our new study provides you with recent results, growth rates, and market shares.
• You will find original analyses, with business outlooks and developments.
• Discover qualitative analyses (including market dynamics, drivers, opportunities, restraints and challenges), cost structure, impact of rising smart manufacturing prices and recent developments.
This report includes data analysis and invaluable insight into how COVID-19 will affect the industry and your company. Four COVID-19 recovery patterns and their impact, namely, “V”, “L”, “W” and “U” are discussed in this report.
Segments Covered in the Report
Market Segment by Component
• Hardware
• Software
Market Segment by Industry Type
• Process Industry
• Discrete Industry
• Other Industry
Market Segment by Process Industry
• Oil & Gas Industry
• Food & Beverages Industry
• Pharmaceutical Industry
• Other Process Industry
Market Segment by Discrete Industry
• Automotive Industry
• Aerospace & Defense Industry
• Semiconductor & Electronics Industry
• Original Equipment Manufacturing Industry
• Other Discrete Industry
Market Segment by Technology
• Industrial 3D Printing
• AI in Manufacturing
• Digital Twins
• Industrial Machine Vision
• Industrial Sensors
• Other Technology

In addition to the revenue predictions for the overall world market and segments, you will also find revenue forecasts for four regional and 20 leading national markets:
North America
• U.S.
• Canada
Europe
• Germany
• Spain
• United Kingdom
• France
• Italy
• Rest of Europe
Asia Pacific
• China
• Japan
• India
• Australia
• South Korea
• Rest of Asia Pacific
Latin America
• Brazil
• Mexico
• Rest of Latin America
Middle East & Africa
• GCC
• South Africa
• Rest of Middle East & Africa
Need industry data? Please contact us today.
The report also includes profiles and for some of the leading companies in the Smart Manufacturing Market, 2023 to 2033, with a focus on this segment of these companies’ operations.
Leading companies and the potential for market growth
• 3D Systems
• ABB Ltd.
• Cisco Systems, Inc.
• Emerson Electric Co.
• General Electric Company
• IBM Corporation
• Intel Corporation
• Mitsubishi Electric Corporation
• Rockwell Automation, Inc.
• Siemens AG
Overall world revenue for Smart Manufacturing Market, 2023 to 2033 in terms of value the market will surpass US$106.81 billion in 2023, our work calculates. We predict strong revenue growth through to 2033. Our work identifies which organizations hold the greatest potential. Discover their capabilities, progress, and commercial prospects, helping you stay ahead.
How will the Smart Manufacturing Market, 2023 to 2033 report help you?
In summary, our 340+ page report provides you with the following knowledge:
• Revenue forecasts to 2033 for Smart Manufacturing Market, 2023 to 2033 Market, with forecasts for component, industry type, process industry, discrete industry, technology and company size, each forecast at a global and regional level – discover the industry’s prospects, finding the most lucrative places for investments and revenues.
• Revenue forecasts to 2033 for four regional and 20 key national markets – See forecasts for the Smart Manufacturing Market, 2023 to 2033 market in North America, Europe, Asia-Pacific and LAMEA. Also forecasted is the market in the US, Canada, Mexico, Brazil, Germany, France, UK, Italy, China, India, Japan, and Australia among other prominent economies.
• Prospects for established firms and those seeking to enter the market – including company profiles for 10 of the major companies involved in the Smart Manufacturing Market, 2023 to 2033.
Find quantitative and qualitative analyses with independent predictions. Receive information that only our report contains, staying informed with invaluable business intelligence.
Information found nowhere else
With our new report, you are less likely to fall behind in knowledge or miss out on opportunities. See how our work could benefit your research, analyses, and decisions. Visiongain’s study is for everybody needing commercial analyses for the Smart Manufacturing Market, 2023 to 2033, market-leading companies. You will find data, trends and predictions.
To access the data contained in this document please email contactus@visiongain.com
Buy our report today Smart Manufacturing Market Report 2023-2033: Forecasts by Component (Hardware, Software), by Industry Type (Process Industry, Discrete Industry, Other), by Process Industry (Oil & Gas Industry, Food & Beverages Industry, Pharmaceutical Industry, Other), by Discrete Industry (Automotive Industry, Aerospace & Defence Industry, Semiconductor & Electronics Industry, Original Equipment Manufacturing Industry, Other), by Technology (Industrial 3D Printing, AI in Manufacturing, Digital Twins, Industrial Machine Vision, Industrial Sensors, Other) AND Regional and Leading National Market Analysis PLUS Analysis of Leading Companies AND COVID-19 Impact and Recovery Pattern Analysis. Avoid missing out by staying informed – order our report now.
Visiongain is a trading partner with the US Federal Government
CCR Ref number: KD4R6
Do you have any custom requirements we can help you with? Any need for a specific country, geo region, market segment or specific company information? Contact us today, we can discuss your needs and see how we can help: contactus@visiongain.com
1. Report Overview
1.1 Objectives of the Study
1.2 Introduction to Smart Manufacturing Market
1.3 What This Report Delivers
1.4 Why You Should Read This Report
1.5 Key Questions Answered by this Analytical Report Include:
1.6 Who is This Report For?
1.7 Research Methodology
1.8 Market Definitions
1.8.1 Market Evaluation & Forecasting Methodology
1.8.2 Data Validation
1.9 Frequently Asked Questions (FAQs)
1.10 Associated Visiongain Reports
1.11 About Visiongain
2 Executive Summary
3 Premium Insights
3.1 Global Smart Manufacturing Market by Region
3.2 Component Segment: Market Attractiveness Index
3.3 Industry Type Segment: Market Attractiveness Index
3.4 Process Industry Segment: Market Attractiveness Index
3.5 Discrete Industry Segment: Market Attractiveness Index
3.6 Technology Segment: Market Attractiveness Index
4 Market Overview
4.1 Key Findings
4.2 Recent Trends/ Developments
4.2.1 IIoT Provides Return on Investment
4.2.2 Networks Designed for Business Development
4.2.3 Transformation to Digital
4.2.4 Artificial Intelligence (AI) and Machine Learning (ML) Technologies Improve the Capabilities of Robots and Cobots
4.3 Market Dynamics
4.3.1 Market Driving Factors
4.3.2 Market Restraining Factors
4.3.3 Market Opportunities
4.3.4 Market Challenges
4.4 Porter’s Five Forces Analysis
4.4.1 Bargaining Power of Buyers
4.4.2 Bargaining Power of Suppliers
4.4.3 Threat of New Entrants
4.4.4 Threat of Product Substitute
4.4.5 Competitive Rivalry
4.5 PESTLE Analysis
4.5.1 Political Factors
4.5.2 Economic Factors
4.5.3 Social Factors
4.5.4 Technology Factors
4.5.5 Environmental Factors
5 Global Smart Manufacturing Market Analysis by Component
5.1 Key Findings
5.2 Global Smart Manufacturing Market Attractiveness Index by Component
5.2.1 Global Smart Manufacturing Market Attractiveness Index by Component
5.2.2 Global Smart Manufacturing Market Size Estimation and Forecast by Component
5.2.3 Hardware
5.2.4 Global Hardware Market Size Estimation Forecast, 2023-2033 (US$ Bn)
5.2.5 Global Hardware Market Size Estimation Forecast by Region, 2023-2033 (US$ Bn)
5.2.6 Software
5.2.7 Global Software Market Size Estimation Forecast, 2023-2033 (US$ Bn)
5.2.8 Global Software Market Forecast by Region, 2023-2033 (US$ Bn)
6 Global Smart Manufacturing Market Analysis by Industry Type
6.1 Key Findings
6.2 Global Smart Manufacturing Market Attractiveness Index by Industry Type
6.2.1 Global Smart Manufacturing Market Attractiveness Index by Industry Type
6.2.2 Global Smart Manufacturing Market Size Estimation and Forecast by Industry Type
6.3 Process Industry
6.3.1 Global Process Industry Market Size Estimation Forecast, 2023-2033 (US$ Bn)
6.3.2 Global Process Industry Market Size Estimation Forecast by Region, 2023-2033 (US$ Bn)
6.4 Discrete Industry
6.4.1 Global Discrete Industry Market Size Estimation Forecast, 2023-2033 (US$ Bn)
6.4.2 Global Discrete Industry Market Forecast by Region, 2023-2033 (US$ Bn)
6.5 Other Industry
6.5.1 Global Other Industry Market Size Estimation Forecast, 2023-2033 (US$ Bn)
6.6 Global Other Industry Market Forecast by Region, 2023-2033 (US$ Bn)
7 Global Smart Manufacturing Market Analysis by Process Industry
7.1 Key Findings
7.2 Global Smart Manufacturing Market Attractiveness Index by Process Industry
7.2.1 Global Of Smart Manufacturing Market Attractiveness Index by Process Industry
7.2.2 Global Smart Manufacturing Market Size Estimation and Forecast by Process Industry
7.3 Oil & Gas Industry
7.3.1 Global Oil & Gas Industry Market Size Estimation Forecast, 2023-2033 (US$ Bn)
7.3.2 Global Oil & Gas Industry Market Size Estimation Forecast by Region, 2023-2033 (US$ Bn)
7.4 Food & Beverages Industry
7.4.1 Global Food & Beverages Industry Market Size Estimation Forecast, 2023-2033 (US$ Bn)
7.4.2 Global Food & Beverages Industry Market Forecast by Region, 2023-2033 (US$ Bn)
7.5 Pharmaceutical Industry
7.5.1 Global Pharmaceutical Industry Market Size Estimation Forecast, 2023-2033 (US$ Bn)
7.6 Global Pharmaceutical Industry Market Forecast by Region, 2023-2033 (US$ Bn)
7.7 Other Process Industry
7.7.1 Global Other Process Industry Market Size Estimation Forecast, 2023-2033 (US$ Bn)
7.7.2 Global Other Process Industry Market Forecast by Region, 2023-2033 (US$ Bn)
8 Global Smart Manufacturing Market Analysis by Discrete Industry
8.1.1 Key Findings
8.2 Global Smart Manufacturing Market Attractiveness Index by Discrete Industry
8.2.1 Global Smart Manufacturing Market Attractiveness Index by Discrete Industry
8.2.2 Global Smart Manufacturing Market Size Estimation and Forecast by Discrete Industry
8.3 Automotive Industry
8.3.1 Global Automotive Industry Market Size Estimation Forecast, 2023-2033 (US$ Bn)
8.3.2 Global Automotive Industry Market Size Estimation Forecast by Region, 2023-2033 (US$ Bn)
8.4 Aerospace & Defence Industry
8.4.1 Global Aerospace & Defence Industry Market Size Estimation Forecast, 2023-2033 (US$ Bn)
8.4.2 Global Aerospace & Defence Industry Market Forecast by Region, 2023-2033 (US$ Bn)
8.5 Semiconductor & Electronics Industry
8.5.1 Global Semiconductor & Electronics Industry Market Size Estimation Forecast, 2023-2033 (US$ Bn)
8.6 Global Semiconductor & Electronics Industry Market Forecast by Region, 2023-2033 (US$ Bn)
8.7 Original Equipment Manufacturing Industry
8.7.1 Global Original Equipment Manufacturing Industry Market Size Estimation Forecast, 2023-2033 (US$ Bn)
8.7.2 Global Original Equipment Manufacturing Industry Market Forecast by Region, 2023-2033 (US$ Bn)
8.8 Other Discrete Industry
8.8.1 Global Other Discrete Industry Market Size Estimation Forecast, 2023-2033 (US$ Bn)
8.8.2 Global Other Discrete Industry Market Forecast by Region, 2023-2033 (US$ Bn)
9 Global Smart Manufacturing Market Analysis by Technology
9.1 Key Findings
9.2 Global Smart Manufacturing Market Attractiveness Index by Technology
9.2.1 Global Smart Manufacturing Market Attractiveness Index by Technology
9.2.2 Global Smart Manufacturing Market Size Estimation and Forecast by Technology
9.3 Industrial 3D Printing
9.3.1 Global Industrial 3D Printing Market Size Estimation Forecast, 2023-2033 (US$ Bn)
9.3.2 Global Industrial 3D Printing Market Size Estimation Forecast by Region, 2023-2033 (US$ Bn)
9.4 AI in Manufacturing
9.4.1 Global AI in Manufacturing Market Size Estimation Forecast, 2023-2033 (US$ Bn)
9.4.2 Global AI in Manufacturing Market Forecast by Region, 2023-2033 (US$ Bn)
9.5 Digital Twins
9.5.1 Global Digital Twins Market Size Estimation Forecast, 2023-2033 (US$ Bn)
9.6 Global Digital Twins Market Forecast by Region, 2023-2033 (US$ Bn)
9.7 Industrial Machine Vision
9.7.1 Global Industrial Machine Vision Market Size Estimation Forecast, 2023-2033 (US$ Bn)
9.7.2 Global Industrial Machine Vision Industry Market Forecast by Region, 2023-2033 (US$ Bn)
9.8 Industrial Sensors
9.8.1 Global Industrial Sensors Market Size Estimation Forecast, 2023-2033 (US$ Bn)
9.8.2 Global Industrial Sensors Forecast by Region, 2023-2033 (US$ Bn)
9.9 Other Technology
9.9.1 Global Other Technology Market Size Estimation Forecast, 2023-2033 (US$ Bn)
9.9.2 Global Other Technology Forecast by Region, 2023-2033 (US$ Bn)
10 Global Smart Manufacturing Market Analysis by Region
10.1 Key Findings
10.2 Regional Market Size Estimation and Forecast
10.3 COVID-19 Impact Analysis: Recovery Scenarios (V, U, W, L)
11 North America Smart Manufacturing Market Analysis
11.1 Key Findings
11.1.1 North America Smart Manufacturing Market Attractiveness Index
11.1.2 North America Smart Manufacturing Market Share by Region, 2023 & 2033
11.2 North America Smart Manufacturing Market Size Estimation and Forecast by Country
11.3 North America Smart Manufacturing Market Size Estimation and Forecast by Component
11.4 North America Smart Manufacturing Market Size Estimation and Forecast by Industry Type
10.5 North America Smart Manufacturing Market Size Estimation and Forecast by Process Industry
10.6 North America Smart Manufacturing Market Size Estimation and Forecast by Discrete Industry
10.7 North America Smart Manufacturing Market Size Estimation and Forecast by Technology
11.5 U.S. Market Analysis
11.6 Canada Market Analysis
12 Europe Smart Manufacturing Market Analysis
12.1 Key Findings
12.2 Europe Smart Manufacturing Market Attractiveness Index
12.2.1 Europe Smart Manufacturing Market Share by Region, 2023 & 2033
12.3 Europe Smart Manufacturing Market Size Estimation and Forecast by Country
12.4 Europe Smart Manufacturing Market Size Estimation and Forecast by Component
12.5 Europe Smart Manufacturing Market Size Estimation and Forecast by Industry Type
10.5 Europe Smart Manufacturing Market Size Estimation and Forecast by Process Industry
10.6 Europe Smart Manufacturing Market Size Estimation and Forecast by Discrete Industry
10.7 Europe Smart Manufacturing Market Size Estimation and Forecast by Technology
12.6 Germany Market Analysis
12.7 UK Market Analysis
12.8 France Market Analysis
12.9 Italy Market Analysis
12.10 Spain Market Analysis
12.11 Rest of Europe Market Analysis
13 Asia-Pacific Smart Manufacturing Market Analysis
13.1 Key Findings
13.1.1 Asia-Pacific Smart Manufacturing Market Attractiveness Index
13.1.2 Asia-Pacific Smart Manufacturing Market Share by Region, 2023 & 2033
13.2 Asia-Pacific Smart Manufacturing Market Size Estimation and Forecast by Country
13.3 Asia-Pacific Smart Manufacturing Market Size Estimation and Forecast by Component
13.4 Asia-Pacific Smart Manufacturing Market Size Estimation and Forecast by Industry Type
13.5 Asia-Pacific Smart Manufacturing Market Size Estimation and Forecast by Process Industry
13.6 Asia-Pacific Smart Manufacturing Market Size Estimation and Forecast by Discrete Industry
13.7 Asia-Pacific Smart Manufacturing Market Size Estimation and Forecast by Technology
13.8 China Market Analysis
13.9 India Market Analysis
13.10 Japan Market Analysis
13.11 South Korea Market Analysis
13.12 Australia Market Analysis
13.13 Rest of Asia-Pacific Market Analysis
14 Middle East & Africa Smart Manufacturing Market Analysis
14.1 Key Findings
14.1.1 Middle East & Africa Smart Manufacturing Market Attractiveness Index
14.1.2 Middle East & Africa Smart Manufacturing Market Share by Region, 2023 & 2033
14.2 Middle East & Africa Smart Manufacturing Market Size Estimation and Forecast by Country
14.3 Middle East & Africa Smart Manufacturing Market Size Estimation and Forecast by Component
14.4 Middle East & Africa Smart Manufacturing Market Size Estimation and Forecast by Industry Type
14.5 Middle East & Africa Smart Manufacturing Market Size Estimation and Forecast by Process Industry
14.6 Middle East & Africa Smart Manufacturing Market Size Estimation and Forecast by Discrete Industry
14.7 Middle East & Africa Smart Manufacturing Market Size Estimation and Forecast by Technology
14.8 GCC Market Analysis
14.9 South Africa Market Analysis
14.10 Rest of Middle East & Africa Market Analysis
15 Latin America Smart Manufacturing Market Analysis
15.1 Key Findings
15.1.1 Latin America Smart Manufacturing Market Attractiveness Index
15.1.2 Latin America Smart Manufacturing Market Share by Region, 2023 & 2033
15.2 Latin America Smart Manufacturing Market Size Estimation and Forecast by Country
15.3 Latin America Smart Manufacturing Market Size Estimation and Forecast by Component
15.4 Latin America Smart Manufacturing Market Size Estimation and Forecast by Industry Type
14.5 Latin America Smart Manufacturing Market Size Estimation and Forecast by Process Industry
14.6 Latin America Smart Manufacturing Market Size Estimation and Forecast by Discrete Industry
14.7 Latin America Smart Manufacturing Market Size Estimation and Forecast by Technology
15.5 Brazil Market Analysis
15.6 Mexico Market Analysis
15.7 Rest of Latin America Market Analysis
16 Competitive Landscape
16.1 Company Share Analysis
16.2 Key Business Strategy Analysis by Acquisition
16.3 Key Business Strategy Analysis by Agreement
16.4 Key Business Strategy Analysis by Collaboration
16.5 Key Business Strategy Analysis by Expansion
16.6 Key Business Strategy Analysis by Investment
16.7 Key Business Strategy Analysis by Joint venture
16.8 Key Business Strategy Analysis by New Product Launch
16.9 Key Business Strategy Analysis by Partnership
17 Company Profiles
17.1 ABB Ltd
17.1.1 Company Snapshot
17.1.2 Company Overview
17.1.3 Financial Analysis
17.1.4 Product Benchmarking
17.1.5 Strategic Outlook
17.2 3D Systems
17.2.1 Company Snapshot
17.2.2 Company Overview
17.2.3 Financial Analysis
17.2.4 Product Benchmarking
17.2.5 Strategic Outlook
17.3 Cisco Systems, Inc.
17.3.1 Company Snapshot
17.3.2 Company Overview
17.3.3 Financial Analysis
17.3.4 Product Benchmarking
17.3.5 Strategic Outlook
17.4 General Electric Company
17.4.1 Company Snapshot
17.4.2 Company Overview
17.4.3 Financial Analysis
17.4.4 Product Benchmarking
17.4.5 Strategic Outlook
17.5 Rockwell Automation, Inc.
17.5.1 Company Snapshot
17.5.2 Company Overview
17.5.3 Financial Analysis
17.5.4 Product Benchmarking
17.5.5 Strategic Outlook
17.6 Siemens AG
17.6.1 Company Snapshot
17.6.2 Company Overview
17.6.3 Financial Analysis
17.6.4 Product Benchmarking
17.6.5 Strategic Outlook
17.7 Emerson Electric Co.
17.7.1 Company Snapshot
17.7.2 Company Overview
17.7.3 Financial Analysis
17.7.4 Product Benchmarking
17.7.5 Strategic Outlook
17.8 IBM Corporation
17.8.1 Company Snapshot
17.8.2 Company Overview
17.8.3 Financial Analysis
17.8.4 Product Benchmarking
17.8.5 Strategic Outlook
17.9 Intel Corporation
17.9.1 Company Snapshot
17.9.2 Company Overview
17.9.3 Financial Analysis
17.9.4 Product Benchmarking
17.9.5 Strategic Outlook
17.10 Mitsubishi Electric Corporation
17.10.1 Company Snapshot
17.10.2 Company Overview
17.10.3 Financial Analysis
17.10.4 Product Benchmarking
17.10.5 Strategic Outlook
18 Conclusion and Recommendations
18.1 Concluding Remarks from Visiongain
18.2 Recommendations for Market Players
List of Tables
Table 1 Global Smart Manufacturing Market Snapshot, 2023 & 2033 (US$ billion, CAGR %)
Table 2 Global Smart Manufacturing Market by Component, 2023-2033 (US$ Bn, AGR (%), CAGR (%))
Table 3 Global Hardware Market Forecast, 2023-2033 (US$ Bn, AGR (%), CAGR (%))
Table 4 Global Hardware Market by Region, 2023-2033 (US$ Bn, AGR (%), CAGR (%))
Table 5 Global Software Market Forecast, 2023-2033 (US$ Bn, AGR (%), CAGR (%))
Table 6 Global Software Market by Region, 2023-2033 (US$ Bn, AGR (%), CAGR (%))
Table 7 Global Smart Manufacturing Market by Industry Type, 2023-2033 (US$ Bn, AGR (%), CAGR (%))
Table 8 Global Process Industry Market Forecast, 2023-2033 (US$ Bn, AGR (%), CAGR (%))
Table 9 Global Process Industry Market by Region, 2023-2033 (US$ Bn, AGR (%), CAGR (%))
Table 10 Global Discrete Industry Market Forecast, 2023-2033 (US$ Bn, AGR (%), CAGR (%))
Table 11 Global Discrete Industry Market by Region, 2023-2033 (US$ Bn, AGR (%), CAGR (%))
Table 12 Global Other Industry Market Forecast, 2023-2033 (US$ Bn, AGR (%), CAGR (%))
Table 13 Global Other Industry Market by Region, 2023-2033 (US$ Bn, AGR (%), CAGR (%))
Table 14 Global Smart Manufacturing Market by Process Industry, 2023-2033 (US$ Bn, AGR (%), CAGR (%))
Table 15 Global Oil & Gas Industry Market Forecast, 2023-2033 (US$ Bn, AGR (%), CAGR (%))
Table 16 Global Oil & Gas Industry Market by Region, 2023-2033 (US$ Bn, AGR (%), CAGR (%))
Table 17 Global Food & Beverages Industry Market Forecast, 2023-2033 (US$ Bn, AGR (%), CAGR (%))
Table 18 Global Food & Beverages Industry Market by Region, 2023-2033 (US$ Bn, AGR (%), CAGR (%))
Table 19 Global Pharmaceutical Industry Market Forecast, 2023-2033 (US$ Bn, AGR (%), CAGR (%))
Table 20 Global Pharmaceutical Industry Market by Region, 2023-2033 (US$ Bn, AGR (%), CAGR (%))
Table 21 Global Other Process Industry Market Forecast, 2023-2033 (US$ Bn, AGR (%), CAGR (%))
Table 22 Global Other Process Industry Market by Region, 2023-2033 (US$ Bn, AGR (%), CAGR (%))
Table 23 Global Smart Manufacturing Market by Discrete Industry, 2023-2033 (US$ Bn, AGR (%), CAGR (%))
Table 24 Global Automotive Industry Market Forecast, 2023-2033 (US$ Bn, AGR (%), CAGR (%))
Table 25 Global Automotive Industry Market by Region, 2023-2033 (US$ Bn, AGR (%), CAGR (%))
Table 26 Global Aerospace & Defence Industry Market Forecast, 2023-2033 (US$ Bn, AGR (%), CAGR (%))
Table 27 Global Aerospace & Defence Industry Market by Region, 2023-2033 (US$ Bn, AGR (%), CAGR (%))
Table 28 Global Semiconductor & Electronics Industry Market Forecast, 2023-2033 (US$ Bn, AGR (%), CAGR (%))
Table 29 Global Semiconductor & Electronics Industry Market by Region, 2023-2033 (US$ Bn, AGR (%), CAGR (%))
Table 30 Global Original Equipment Manufacturing Industry Market Forecast, 2023-2033 (US$ Bn, AGR (%), CAGR (%))
Table 31 Global Original Equipment Manufacturing Industry Market by Region, 2023-2033 (US$ Bn, AGR (%), CAGR (%))
Table 32 Global Other Discrete Industry Market Forecast, 2023-2033 (US$ Bn, AGR (%), CAGR (%))
Table 33 Global Other Discrete Industry Market by Region, 2023-2033 (US$ Bn, AGR (%), CAGR (%))
Table 34 Global Smart Manufacturing Market by Technology, 2023-2033 (US$ Bn, AGR (%), CAGR (%))
Table 35 Global Industrial 3D Printing Market Forecast, 2023-2033 (US$ Bn, AGR (%), CAGR (%))
Table 36 Global Industrial 3D Printing Market by Region, 2023-2033 (US$ Bn, AGR (%), CAGR (%))
Table 37 Global AI in Manufacturing Market Forecast, 2023-2033 (US$ Bn, AGR (%), CAGR (%))
Table 38 Global AI in Manufacturing Market by Region, 2023-2033 (US$ Bn, AGR (%), CAGR (%))
Table 39 Global Digital Twins Market Forecast, 2023-2033 (US$ Bn, AGR (%), CAGR (%))
Table 40 Global Digital Twins Market by Region, 2023-2033 (US$ Bn, AGR (%), CAGR (%))
Table 41 Global Industrial Machine Vision Market Forecast, 2023-2033 (US$ Bn, AGR (%), CAGR (%))
Table 42 Global Industrial Machine Vision Market by Region, 2023-2033 (US$ Bn, AGR (%), CAGR (%))
Table 43 Global Industrial Sensors Market Forecast, 2023-2033 (US$ Bn, AGR (%), CAGR (%))
Table 44 Global Industrial Sensors Market by Region, 2023-2033 (US$ Bn, AGR (%), CAGR (%))
Table 45 Global Other Technology Market Forecast, 2023-2033 (US$ Bn, AGR (%), CAGR (%))
Table 46 Global Other Technology Market by Region, 2023-2033 (US$ Bn, AGR (%), CAGR (%))
Table 47 Global Smart Manufacturing Market by Region, 2023-2033 (US$ Bn, AGR (%), CAGR (%))
Table 48 Global Smart Manufacturing Market by Region, 2023-2033 (US$ Bn, AGR (%), CAGR (%)) (V-Shaped Recovery Scenario)
Table 49 Global Smart Manufacturing Market by Region, 2023-2033 (US$ Bn, AGR (%), CAGR (%)) (U-Shaped Recovery Scenario)
Table 50 Global Smart Manufacturing Market by Region, 2023-2033 (US$ Bn, AGR (%), CAGR (%)) (W-Shaped Recovery Scenario)
Table 51 Global Smart Manufacturing Market by Region, 2023-2033 (US$ Bn, AGR (%), CAGR (%)) (L-Shaped Recovery Scenario)
Table 52 North America Smart Manufacturing Market by Country, 2023-2033 (US$ Bn, AGR (%), CAGR (%))
Table 53 North America Smart Manufacturing Market by Component, 2023-2033 (US$ Bn, AGR (%), CAGR (%))
Table 54 North America Smart Manufacturing Market by Industry Type, 2023-2033 (US$ Bn, AGR (%), CAGR (%))
Table 55 North America Smart Manufacturing Market by Process Industry, 2023-2033 (US$ Bn, AGR (%), CAGR (%))
Table 56 North America Smart Manufacturing Market by Discrete Industry, 2023-2033 (US$ Bn, AGR (%), CAGR (%))
Table 57 North America Smart Manufacturing Market by Technology, 2023-2033 (US$ Bn, AGR (%), CAGR (%))
Table 58 US Smart Manufacturing Market by Value, 2023-2033 (US$ Bn, AGR (%), CAGR (%))
Table 59 Canada Smart Manufacturing Market by Value, 2023-2033 (US$ Bn, AGR (%), CAGR (%))
Table 60 Europe Smart Manufacturing Market by Country, 2023-2033 (US$ Bn, AGR (%), CAGR (%))
Table 61 Europe Smart Manufacturing Market by Component, 2023-2033 (US$ Bn, AGR (%), CAGR (%))
Table 62 Europe Smart Manufacturing Market by Industry Type, 2023-2033 (US$ Bn, AGR (%), CAGR (%))
Table 63 Europe Smart Manufacturing Market by Process Industry, 2023-2033 (US$ Bn, AGR (%), CAGR (%))
Table 64 Europe Smart Manufacturing Market by Discrete Industry, 2023-2033 (US$ Bn, AGR (%), CAGR (%))
Table 65 Europe Smart Manufacturing Market by Technology, 2023-2033 (US$ Bn, AGR (%), CAGR (%))
Table 66 Germany Smart Manufacturing Market by Value, 2023-2033 (US$ Bn, AGR (%), CAGR (%))
Table 67 UK Smart Manufacturing Market by Value, 2023-2033 (US$ Bn, AGR (%), CAGR (%))
Table 68 France Smart Manufacturing Market by Value, 2023-2033 (US$ Bn, AGR (%), CAGR (%))
Table 69 Italy Smart Manufacturing Market by Value, 2023-2033 (US$ Bn, AGR (%), CAGR (%))
Table 70 Spain Smart Manufacturing Market by Value, 2023-2033 (US$ Bn, AGR (%), CAGR (%))
Table 71 Rest of Europe Smart Manufacturing Market by Value, 2023-2033 (US$ Bn, AGR (%), CAGR (%))
Table 72 Asia-Pacific Smart Manufacturing Market by Country, 2023-2033 (US$ Bn, AGR (%), CAGR (%))
Table 73 Asia-Pacific Smart Manufacturing Market by Component, 2023-2033 (US$ Bn, AGR (%), CAGR (%))
Table 74 Asia-Pacific Smart Manufacturing Market by Industry Type, 2023-2033 (US$ Bn, AGR (%), CAGR (%))
Table 75 Asia-Pacific Smart Manufacturing Market by Process Industry, 2023-2033 (US$ Bn, AGR (%), CAGR (%))
Table 76 Asia-Pacific Smart Manufacturing Market by Discrete Industry, 2023-2033 (US$ Bn, AGR (%), CAGR (%))
Table 77 Asia-Pacific Smart Manufacturing Market by Technology, 2023-2033 (US$ Bn, AGR (%), CAGR (%))
Table 78 China Smart Manufacturing Market by Value, 2023-2033 (US$ Bn, AGR (%), CAGR (%))
Table 79 India Smart Manufacturing Market by Value, 2023-2033 (US$ Bn, AGR (%), CAGR (%))
Table 80 Japan Smart Manufacturing Market by Value, 2023-2033 (US$ Bn, AGR (%), CAGR (%))
Table 81 South Korea Smart Manufacturing Market by Value, 2023-2033 (US$ Bn, AGR (%), CAGR (%))
Table 82 Australia Smart Manufacturing Market by Value, 2023-2033 (US$ Bn, AGR (%), CAGR (%))
Table 83 Rest of Asia-Pacific Smart Manufacturing Market by Value, 2023-2033 (US$ Bn, AGR (%), CAGR (%))
Table 84 Middle East & Africa Smart Manufacturing Market by Country, 2023-2033 (US$ Bn, AGR (%), CAGR (%))
Table 85 Middle East & Africa Smart Manufacturing Market by Component, 2023-2033 (US$ Bn, AGR (%), CAGR (%))
Table 86 Middle East & Africa Smart Manufacturing Market by Industry Type, 2023-2033 (US$ Bn, AGR (%), CAGR (%))
Table 87 Middle East & Africa Smart Manufacturing Market by Process Industry, 2023-2033 (US$ Bn, AGR (%), CAGR (%))
Table 88 Middle East & Africa Smart Manufacturing Market by Discrete Industry, 2023-2033 (US$ Bn, AGR (%), CAGR (%))
Table 89 Middle East & Africa Smart Manufacturing Market by Technology, 2023-2033 (US$ Bn, AGR (%), CAGR (%))
Table 90 GCC Smart Manufacturing Market by Value, 2023-2033 (US$ Bn, AGR (%), CAGR (%))
Table 91 South Africa Smart Manufacturing Market by Value, 2023-2033 (US$ Bn, AGR (%), CAGR (%))
Table 92 Rest of Middle East & Africa Smart Manufacturing Market by Value, 2023-2033 (US$ Bn, AGR (%), CAGR (%))
Table 93 Latin America Smart Manufacturing Market by Country, 2023-2033 (US$ Bn, AGR (%), CAGR (%))
Table 94 Latin America Smart Manufacturing Market by Component, 2023-2033 (US$ Bn, AGR (%), CAGR (%))
Table 95 Latin America Smart Manufacturing Market by Industry Type, 2023-2033 (US$ Bn, AGR (%), CAGR (%))
Table 96 Latin America Smart Manufacturing Market by Process Industry, 2023-2033 (US$ Bn, AGR (%), CAGR (%))
Table 97 Latin America Smart Manufacturing Market by Discrete Industry, 2023-2033 (US$ Bn, AGR (%), CAGR (%))
Table 98 Latin America Smart Manufacturing Market by Technology, 2023-2033 (US$ Bn, AGR (%), CAGR (%))
Table 99 Brazil Smart Manufacturing Market by Value, 2023-2033 (US$ Bn, AGR (%), CAGR (%))
Table 100 Mexico Smart Manufacturing Market by Value, 2023-2033 (US$ Bn, AGR (%), CAGR (%))
Table 101 Rest of Latin America Smart Manufacturing Market by Value, 2023-2033 (US$ Bn, AGR (%), CAGR (%))
Table 102 ABB Ltd: Key Details, (CEO, HQ, Revenue, Founded, No. of Employees, Company Type, Website, Business Segment)
Table 103 ABB Ltd: Product Benchmarking
Table 104 ABB Ltd: Strategic Outlook
Table 105 3D Systems: Key Details, (CEO, HQ, Revenue, Founded, No. of Employees, Company Type, Website, Business Segment)
Table 106 3D Systems: Product Benchmarking
Table 107 3D Systems: Strategic Outlook
Table 108 Cisco Systems, Inc: Key Details, (CEO, HQ, Revenue, Founded, No. of Employees, Company Type, Website, Business Segment)
Table 109 Cisco Systems, Inc: Product Benchmarking
Table 110 Cisco Systems, Inc: Strategic Outlook
Table 111 General Electric Company : Key Details, (CEO, HQ, Revenue, Founded, No. of Employees, Company Type, Website, Business Segment)
Table 112 General Electric Company: Product Benchmarking
Table 113 General Electric Company: Strategic Outlook
Table 114 Rockwell Automation, Inc.: Key Details, (CEO, HQ, Revenue, Founded, No. of Employees, Company Type, Website, Business Segment)
Table 115 Rockwell Automation, Inc.: Product Benchmarking
Table 116 Rockwell Automation, Inc.: Strategic Outlook
Table 117 Siemens AG: Key Details, (CEO, HQ, Revenue, Founded, No. of Employees, Company Type, Website, Business Segment)
Table 118 Siemens AG: Product Benchmarking
Table 119 Siemens AG: Strategic Outlook
Table 120 Emerson Electric Co.: Key Details, (CEO, HQ, Revenue, Founded, No. of Employees, Company Type, Website, Business Segment)
Table 121 Emerson Electric Co.: Product Benchmarking
Table 122 Emerson Electric Co.: Strategic Outlook
Table 123 IBM Corporation: Key Details, (CEO, HQ, Revenue, Founded, No. of Employees, Company Type, Website, Business Segment)
Table 124 IBM Corporation: Product Benchmarking
Table 125 IBM Corporation: Strategic Outlook
Table 126 Intel Corporation: Key Details, (CEO, HQ, Revenue, Founded, No. of Employees, Company Type, Website, Business Segment)
Table 127 Intel Corporation: Product Benchmarking
Table 128 Intel Corporation: Strategic Outlook
Table 129 Mitsubishi Electric Corporation: Key Details, (CEO, HQ, Revenue, Founded, No. of Employees, Company Type, Website, Business Segment)
Table 130 Mitsubishi Electric Corporation: Product Benchmarking
Table 131 Mitsubishi Electric Corporation: Strategic Outlook
List of Figures
Figure 1 Global Smart Manufacturing Market Segmentation
Figure 2 Breakdown of Primary Interviews: By Company Type, Designation, & Region
Figure 3 Global Smart Manufacturing Market Forecast by Region: Market Attractiveness Index
Figure 4 Global Smart Manufacturing Market by Component: Market Attractiveness Index
Figure 5 Global Smart Manufacturing Market by Industry Type: Market Attractiveness Index
Figure 6 Global Smart Manufacturing Market by Process Industry: Market Attractiveness Index
Figure 7 Global Smart Manufacturing Market by Discrete Industry: Market Attractiveness Index
Figure 8 Global Smart Manufacturing Market by Technology: Market Attractiveness Index
Figure 9 Global Smart Manufacturing Market: Market Dynamics
Figure 10 Global Smart Manufacturing Market: Porter’s Five Forces Analysis
Figure 11 Global Smart manufacturing Market: PESTLE Analysis
Figure 12 Global Smart Manufacturing Market Forecast by Component 2023, 2033 (Market Share, CAGR%)
Figure 13 Global Smart Manufacturing Market Forecast by Component,2023, 2033 (Market Share, CAGR%)
Figure 14 Global Smart Manufacturing Market by Component, 2023-2033 (US$ Bn, AGR (%))
Figure 15 Global Hardware Market Forecast, 2023-2033 (US$ Bn, AGR (%))
Figure 16 Global Hardware Market by Region, 2023-2033 (US$ Bn, AGR (%))
Figure 17 Global Software Market Forecast, 2023-2033 (US$ Bn, AGR (%))
Figure 18 Global Software Market by Region, 2023-2033 (US$ Bn, AGR (%))
Figure 19 Global Smart Manufacturing Market Forecast by Industry Type 2023, 2033 (Market Share, CAGR%)
Figure 20 Global Smart Manufacturing Market Forecast by Industry Type,2023, 2033 (Market Share, CAGR%)
Figure 21 Global Smart Manufacturing Market by Industry Type, 2023-2033 (US$ Bn, AGR (%))
Figure 22 Global Process Industry Market Forecast, 2023-2033 (US$ Bn, AGR (%))
Figure 23 Global Process Industry Market by Region, 2023-2033 (US$ Bn, AGR (%))
Figure 24 Global Discrete Industry Market Forecast, 2023-2033 (US$ Bn, AGR (%))
Figure 25 Global Discrete Industry Market by Region, 2023-2033 (US$ Bn, AGR (%))
Figure 26 Global Other Industry Market Forecast, 2023-2033 (US$ Bn, AGR (%))
Figure 27 Global Other Industry Market by Region, 2023-2033 (US$ Bn, AGR (%))
Figure 28 Global Smart Manufacturing Market Forecast by Process Industry, 2023, 2033 (Market Share, CAGR%)
Figure 29 Global Smart Manufacturing Market Forecast by Process Industry,2023, 2033 (Market Share, CAGR%)
Figure 30 Global Smart Manufacturing Market by Process Industry, 2023-2033 (US$ Bn, AGR (%))
Figure 31 Global Oil & Gas Industry Market Forecast, 2023-2033 (US$ Bn, AGR (%))
Figure 32 Global Oil & Gas Industry Market by Region, 2023-2033 (US$ Bn, AGR (%))
Figure 33 Global Food & Beverages Industry Market Forecast, 2023-2033 (US$ Bn, AGR (%))
Figure 34 Global Food & Beverages Industry Market by Region, 2023-2033 (US$ Bn, AGR (%))
Figure 35 Global Pharmaceutical Industry Market Forecast, 2023-2033 (US$ Bn, AGR (%))
Figure 36 Global Pharmaceutical Industry Market by Region, 2023-2033 (US$ Bn, AGR (%))
Figure 37 Global Other Process Industry Market Forecast, 2023-2033 (US$ Bn, AGR (%))
Figure 38 Global Other Process Industry Market by Region, 2023-2033 (US$ Bn, AGR (%))
Figure 39 Global Smart Manufacturing Market Forecast by Discrete Industry 2023, 2033 (Market Share, CAGR%)
Figure 40 Global Smart Manufacturing Market Forecast by Discrete Industry,2023, 2033 (Market Share, CAGR%)
Figure 41 Global Smart Manufacturing Market by Discrete Industry, 2023-2033 (US$ Bn, AGR (%))
Figure 42 Global Automotive Industry Market Forecast, 2023-2033 (US$ Bn, AGR (%))
Figure 43 Global Automotive Industry Market by Region, 2023-2033 (US$ Bn, AGR (%))
Figure 44 Global Aerospace & Defence Industry Market Forecast, 2023-2033 (US$ Bn, AGR (%))
Figure 45 Global Aerospace & Defence Industry Market by Region, 2023-2033 (US$ Bn, AGR (%))
Figure 46 Global Semiconductor & Electronics Industry Market Forecast, 2023-2033 (US$ Bn, AGR (%))
Figure 47 Global Semiconductor & Electronics Industry Market by Region, 2023-2033 (US$ Bn, AGR (%))
Figure 48 Global Original Equipment Manufacturing Industry Market Forecast, 2023-2033 (US$ Bn, AGR (%))
Figure 49 Global Original Equipment Manufacturing Industry Market by Region, 2023-2033 (US$ Bn, AGR (%))
Figure 50 Global Other Discrete Industry Market Forecast, 2023-2033 (US$ Bn, AGR (%))
Figure 51 Global Other Discrete Industry Market by Region, 2023-2033 (US$ Bn, AGR (%))
Figure 52 Global Smart Manufacturing Market Forecast by Technology 2023, 2033 (Market Share, CAGR%)
Figure 53 Global Smart Manufacturing Market Forecast by Technology,2023, 2033 (Market Share, CAGR%)
Figure 54 Global Smart Manufacturing Market by Technology, 2023-2033 (US$ Bn, AGR (%))
Figure 55 Global Industrial 3D Printing Market Forecast, 2023-2033 (US$ Bn, AGR (%))
Figure 56 Global Industrial 3D Printing Market by Region, 2023-2033 (US$ Bn, AGR (%))
Figure 57 Global AI in Manufacturing Market Forecast, 2023-2033 (US$ Bn, AGR (%))
Figure 58 Global AI in Manufacturing Market by Region, 2023-2033 (US$ Bn, AGR (%))
Figure 59 Global Digital Twins Market Forecast, 2023-2033 (US$ Bn, AGR (%))
Figure 60 Global Digital Twins Market by Region, 2023-2033 (US$ Bn, AGR (%))
Figure 61 Global Industrial Machine Vision Market Forecast, 2023-2033 (US$ Bn, AGR (%))
Figure 62 Global Industrial Machine Vision Market by Region, 2023-2033 (US$ Bn, AGR (%))
Figure 63 Global Industrial Sensors Market Forecast, 2023-2033 (US$ Bn, AGR (%))
Figure 64 Global Industrial Sensors Market by Region, 2023-2033 (US$ Bn, AGR (%))
Figure 65 Global Other Technology Market Forecast, 2023-2033 (US$ Bn, AGR (%))
Figure 66 Global Other Technology Market by Region, 2023-2033 (US$ Bn, AGR (%))
Figure 67 Global Smart Manufacturing Market by Region, 2023-2033 (US$ Bn, AGR (%))
Figure 68 Global Smart Manufacturing Market by Region, 2023-2033 (US$ Bn, AGR (%)) (V-Shaped Recovery Scenario)
Figure 69 Global Smart Manufacturing Market by Region, 2023-2033 (US$ Bn, AGR (%)) (U-Shaped Recovery Scenario)
Figure 70 Global Smart Manufacturing Market by Region, 2023-2033 (US$ Bn, AGR (%)) (W-Shaped Recovery Scenario)
Figure 71 Global Smart Manufacturing Market by Region, 2023-2033 (US$ Bn, AGR (%)) (L-Shaped Recovery Scenario)
Figure 72 North America Smart Manufacturing Market Attractiveness Index
Figure 73 North America Smart Manufacturing Market Share Forecast 2023, 2033 (%)
Figure 74 North America Smart Manufacturing Market by Country, 2023-2033 (US$ Bn, AGR (%))
Figure 75 North America Smart Manufacturing Market by Component, 2023-2033 (US$ Bn, AGR (%))
Figure 76 North America Smart Manufacturing Market Share Forecast by Component, 2023 & 2033 (%)
Figure 77 North America Smart Manufacturing Market by Industry Type, 2023-2033 (US$ Bn, AGR (%))
Figure 78 North America Smart Manufacturing Market Share Forecast by Industry Type, 2023 & 2033 (%)
Figure 79 North America Smart Manufacturing Market by Process Industry, 2023-2033 (US$ Bn, AGR (%))
Figure 80 North America Smart Manufacturing Market Share Forecast Process Industry, 2023 & 2033 (%)
Figure 81 North America Smart Manufacturing Market by Discrete Industry, 2023-2033 (US$ Bn, AGR (%))
Figure 82 North America Smart Manufacturing Market Share Forecast Discrete Industry, 2023 & 2033 (%)
Figure 83 North America Smart Manufacturing Market by Technology, 2023-2033 (US$ Bn, AGR (%))
Figure 84 North America Smart Manufacturing Market Share Forecast Technology, 2023 & 2033 (%)
Figure 85 US Smart Manufacturing Market by Value, 2023-2033 (US$ Bn, AGR (%))
Figure 86 Canada Smart Manufacturing Market by Value, 2023-2033 (US$ Bn, AGR (%))
Figure 87 Europe Smart Manufacturing Market Attractiveness Index
Figure 88 Europe Smart Manufacturing Market Share Forecast 2023, 2033 (%)
Figure 89 Europe Smart Manufacturing Market by Country, 2023-2033 (US$ Bn, AGR (%))
Figure 90 Europe Smart Manufacturing Market by Component, 2023-2033 (US$ Bn, AGR (%))
Figure 91 Europe Smart Manufacturing Market Share Forecast by Component, 2023 & 2033 (%)
Figure 92 Europe Smart Manufacturing Market by Industry Type, 2023-2033 (US$ Bn, AGR (%))
Figure 93 Europe Smart Manufacturing Market Share Forecast by Industry Type, 2023 & 2033 (%)
Figure 94 Europe Smart Manufacturing Market by Process Industry, 2023-2033 (US$ Bn, AGR (%))
Figure 95 Europe Smart Manufacturing Market Share Forecast Process Industry, 2023 & 2033 (%)
Figure 96 Europe Smart Manufacturing Market by Discrete Industry, 2023-2033 (US$ Bn, AGR (%))
Figure 97 Europe Smart Manufacturing Market Share Forecast Discrete Industry, 2023 & 2033 (%)
Figure 98 Europe Smart Manufacturing Market by Technology, 2023-2033 (US$ Bn, AGR (%))
Figure 99 Europe Smart Manufacturing Market Share Forecast Technology, 2023 & 2033 (%)
Figure 100 Germany Smart Manufacturing Market by Value, 2023-2033 (US$ Bn, AGR (%))
Figure 101 UK Smart Manufacturing Market by Value, 2023-2033 (US$ Bn, AGR (%))
Figure 102 France Smart Manufacturing Market by Value, 2023-2033 (US$ Bn, AGR (%))
Figure 103 Italy Smart Manufacturing Market by Value, 2023-2033 (US$ Bn, AGR (%))
Figure 104 Spain Smart Manufacturing Market by Value, 2023-2033 (US$ Bn, AGR (%))
Figure 105 Rest of Europe Smart Manufacturing Market by Value, 2023-2033 (US$ Bn, AGR (%))
Figure 106 Asia-Pacific Smart Manufacturing Market Attractiveness Index
Figure 107 Asia-Pacific Smart Manufacturing Market Share Forecast 2023, 2033 (%)
Figure 108 Asia-Pacific Smart Manufacturing Market by Country, 2023-2033 (US$ Bn, AGR (%))
Figure 109 Asia-Pacific Smart Manufacturing Market by Component, 2023-2033 (US$ Bn, AGR (%))
Figure 110 Asia-Pacific Smart Manufacturing Market Share Forecast by Component, 2023 & 2033 (%)
Figure 111 Asia-Pacific Smart Manufacturing Market by Industry Type, 2023-2033 (US$ Bn, AGR (%))
Figure 112 Asia-Pacific Smart Manufacturing Market Share Forecast by Industry Type, 2023 & 2033 (%)
Figure 113 Asia-Pacific Smart Manufacturing Market by Process Industry, 2023-2033 (US$ Bn, AGR (%))
Figure 114 Asia-Pacific Smart Manufacturing Market Share Forecast Process Industry, 2023 & 2033 (%)
Figure 115 Asia-Pacific Smart Manufacturing Market by Discrete Industry, 2023-2033 (US$ Bn, AGR (%))
Figure 116 Asia-Pacific Smart Manufacturing Market Share Forecast Discrete Industry, 2023 & 2033 (%)
Figure 117 Asia-Pacific Smart Manufacturing Market by Technology, 2023-2033 (US$ Bn, AGR (%))
Figure 118 Asia-Pacific Smart Manufacturing Market Share Forecast Technology, 2023 & 2033 (%)
Figure 119 China Smart Manufacturing Market by Value, 2023-2033 (US$ Bn, AGR (%))
Figure 120 India Smart Manufacturing Market by Value, 2023-2033 (US$ Bn, AGR (%))
Figure 121 Japan Smart Manufacturing Market by Value, 2023-2033 (US$ Bn, AGR (%))
Figure 122 South Korea Smart Manufacturing Market by Value, 2023-2033 (US$ Bn, AGR (%))
Figure 123 Australia Smart Manufacturing Market by Value, 2023-2033 (US$ Bn, AGR (%))
Figure 124 Rest of Asia-Pacific Smart Manufacturing Market by Value, 2023-2033 (US$ Bn, AGR (%))
Figure 125 Middle East & Africa Smart Manufacturing Market Attractiveness Index
Figure 126 Middle East & Africa Smart Manufacturing Market Share Forecast 2023, 2033 (%)
Figure 127 Middle East & Africa Smart Manufacturing Market by Country, 2023-2033 (US$ Bn, AGR (%))
Figure 128 Middle East & Africa Smart Manufacturing Market by Component, 2023-2033 (US$ Bn, AGR (%))
Figure 129 Middle East & Africa Smart Manufacturing Market Share Forecast by Component, 2023 & 2033 (%)
Figure 130 Middle East & Africa Smart Manufacturing Market by Industry Type, 2023-2033 (US$ Bn, AGR (%))
Figure 131 Middle East & Africa Smart Manufacturing Market Share Forecast by Industry Type, 2023 & 2033 (%)
Figure 132 Middle East & Africa Smart Manufacturing Market by Process Industry, 2023-2033 (US$ Bn, AGR (%))
Figure 133 Middle East & Africa Smart Manufacturing Market Share Forecast Process Industry, 2023 & 2033 (%)
Figure 134 Middle East & Africa Smart Manufacturing Market by Discrete Industry, 2023-2033 (US$ Bn, AGR (%))
Figure 135 Middle East & Africa Smart Manufacturing Market Share Forecast Discrete Industry, 2023 & 2033 (%)
Figure 136 Middle East & Africa Smart Manufacturing Market by Technology, 2023-2033 (US$ Bn, AGR (%))
Figure 137 Middle East & Africa Smart Manufacturing Market Share Forecast Technology, 2023 & 2033 (%)
Figure 138 GCC Smart Manufacturing Market by Value, 2023-2033 (US$ Bn, AGR (%))
Figure 139 South Africa Smart Manufacturing Market by Value, 2023-2033 (US$ Bn, AGR (%))
Figure 140 Rest of Middle East & Africa Smart Manufacturing Market by Value, 2023-2033 (US$ Bn, AGR (%))
Figure 141 Latin America Smart Manufacturing Market Attractiveness Index
Figure 142 Latin America Smart Manufacturing Market Share Forecast 2023, 2033 (%)
Figure 143 Latin America Smart Manufacturing Market by Country, 2023-2033 (US$ Bn, AGR (%))
Figure 144 Latin America Smart Manufacturing Market by Component, 2023-2033 (US$ Bn, AGR (%))
Figure 145 Latin America Smart Manufacturing Market Share Forecast by Component, 2023 & 2033 (%)
Figure 146 Latin America Smart Manufacturing Market by Industry Type, 2023-2033 (US$ Bn, AGR (%))
Figure 147 Latin America Smart Manufacturing Market Share Forecast by Industry Type, 2023 & 2033 (%)
Figure 148 Latin America Smart Manufacturing Market by Process Industry, 2023-2033 (US$ Bn, AGR (%))
Figure 149 Latin America Smart Manufacturing Market Share Forecast Process Industry, 2023 & 2033 (%)
Figure 150 Latin America Smart Manufacturing Market by Discrete Industry, 2023-2033 (US$ Bn, AGR (%))
Figure 151 Latin America Smart Manufacturing Market Share Forecast Discrete Industry, 2023 & 2033 (%)
Figure 152 Latin America Smart Manufacturing Market by Technology, 2023-2033 (US$ Bn, AGR (%))
Figure 153 Latin America Smart Manufacturing Market Share Forecast Technology, 2023 & 2033 (%)
Figure 154 Brazil Smart Manufacturing Market by Value, 2023-2033 (US$ Bn, AGR (%))
Figure 155 Mexico Smart Manufacturing Market by Value, 2023-2033 (US$ Bn, AGR (%))
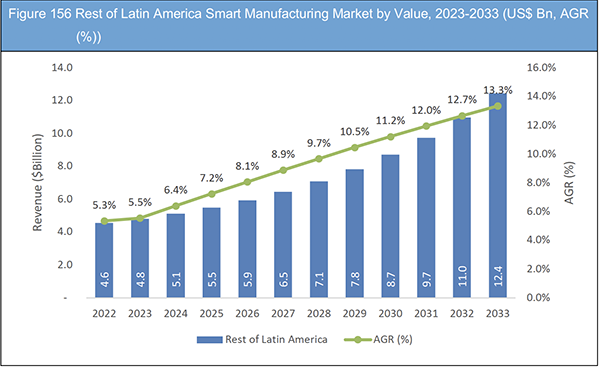
Figure 156 Rest of Latin America Smart Manufacturing Market by Value, 2023-2033 (US$ Bn, AGR (%))
Figure 157 Global Smart Manufacturing Market: Company Share Analysis, 2022
Figure 158 ABB Ltd: Net Revenue, 2017-2021 (US$ million, AGR%)
Figure 159 ABB Ltd: Gross Profit, 2017-2021 (US$ million, AGR%)
Figure 160 ABB Ltd: Operational Income, 2017-2021 (US$ million, AGR%)
Figure 161 ABB Ltd: EBITDA, 2017-2021 (US$ million, AGR%)
Figure 162 3D Systems: Net Revenue, 2017-2021 (US$ million, AGR%)
Figure 163 3D Systems: Gross Profit, 2017-2021 (US$ million, AGR%)
Figure 164 3D Systems: Operational Income, 2017-2021 (US$ million, AGR%)
Figure 165 3D Systems: EBITDA, 2017-2021 (US$ million, AGR%)
Figure 166 Cisco Systems, Inc: Net Revenue, 2017-2021 (US$ million, AGR%)
Figure 167 Cisco Systems, Inc: Gross Profit, 2017-2021 (US$ million, AGR%)
Figure 168 Cisco Systems, Inc: Operational Income, 2017-2021 (US$ million, AGR%)
Figure 169 Cisco Systems, Inc: EBITDA, 2017-2021 (US$ million, AGR%)
Figure 170 General Electric Company: Net Revenue, 2017-2021 (US$ million, AGR%)
Figure 171 General Electric Company: Gross Profit, 2017-2021 (US$ million, AGR%)
Figure 172 General Electric Company: Operational Income, 2017-2021 (US$ million, AGR%)
Figure 173 General Electric Company: EBITDA, 2017-2021 (US$ million, AGR%)
Figure 174 Rockwell Automation, Inc.: Net Revenue, 2017-2021 (US$ million, AGR%)
Figure 175 Rockwell Automation, Inc.: Gross Profit, 2017-2021 (US$ million, AGR%)
Figure 176 Rockwell Automation, Inc.: Operational Income, 2017-2021 (US$ million, AGR%)
Figure 177 Rockwell Automation, Inc.: EBITDA, 2017-2021 (US$ million, AGR%)
Figure 178 Siemens AG: Net Revenue, 2017-2021 (US$ million, AGR%)
Figure 179 Siemens AG: Gross Profit, 2017-2021 (US$ million, AGR%)
Figure 180 Siemens AG: Operational Income, 2017-2021 (US$ million, AGR%)
Figure 181 Siemens AG: EBITDA, 2017-2021 (US$ million, AGR%)
Figure 182 Emerson Electric Co.: Net Revenue, 2017-2021 (US$ million, AGR%)
Figure 183 Emerson Electric Co.: Gross Profit, 2017-2021 (US$ million, AGR%)
Figure 184 Emerson Electric Co.: Operational Income, 2017-2021 (US$ million, AGR%)
Figure 185 Emerson Electric Co.: EBITDA, 2017-2021 (US$ million, AGR%)
Figure 186 IBM Corporation: Net Revenue, 2017-2021 (US$ million, AGR%)
Figure 187 IBM Corporation: Gross Profit, 2017-2021 (US$ million, AGR%)
Figure 188 IBM Corporation: Operational Income, 2017-2021 (US$ million, AGR%)
Figure 189 IBM Corporation: EBITDA, 2017-2021 (US$ million, AGR%)
Figure 190 Intel Corporation: Net Revenue, 2017-2021 (US$ million, AGR%)
Figure 191 Intel Corporation: Gross Profit, 2017-2021 (US$ million, AGR%)
Figure 192 Intel Corporation: Operational Income, 2017-2021 (US$ million, AGR%)
Figure 193 Intel Corporation: EBITDA, 2017-2021 (US$ million, AGR%)
Figure 194 Mitsubishi Electric Corporation: Net Revenue, 2017-2021 (US$ million, AGR%)
Figure 195 Mitsubishi Electric Corporation: Gross Profit, 2017-2021 (US$ million, AGR%)
Figure 196 Mitsubishi Electric Corporation: Operational Income, 2017-2021 (US$ million, AGR%)
Figure 197 Mitsubishi Electric Corporation: EBITDA, 2017-2021 (US$ million, AGR%)
List of Companies Profiled in the report
3D Systems
ABB Ltd.
Cisco Systems, Inc.
Emerson Electric Co.
General Electric Company
IBM Corporation
Intel Corporation
Mitsubishi Electric Corporation
Rockwell Automation, Inc.
Siemens AG
List of Other Companies Mentioned in the report
Benchmark Electronics
Celestica Inc.
Consort Medical PLC
Cregenna Medical
Denso Wave Incorporated
Dürr AG
Eaton
Emerson
Endress+Hauser
Epson Amerika, USA
EPSON Robots (Japan),
Equipois
Fanuc Corporation
Fanuc Ltd
Fanuc Robotics America Inc.
Festo
Fiat SpA
Flextronics International
Flowserve
FMC
Ford Motor Company
Forefront Medical Technology
Foxconn Technology Group,
Fraunhofer
Friendly Robotics Limited
Fullwood Limited
General Electric
Gerresheimer
GMC
Great Wall Motors (GWM)
Hanool Robotics Corporation
Hitachi Limited
Hon Hai Precision Industry Company Limited
Honda Motor Company Limited
Honeywell
Hyundai Heavy Industries Company Limited
IMI
InMoTx
Integer Holdings Corporation
Intelitek
InTouch Technologies Incorporated
Intuitive Surgical Incorporated
invesys
iRobot Corporation
Jabil Inc.
JARA, Japan
Johari Digital Healthcare
Kawasaki Heavy Industries
Kawasaki Robotics
Komatsu Limited
KUKA AG
KUKA Roboter GmbH
KUKA Robotics, USA
KUKA Systems GmbH
Lely Holding Sarl
LG Electronics Incorporated
MacDonald Humfrey (Automation) Ltd.
MAREL
Maruti Suzuki
Mazda Motor Corporation
Mettler-Toledo
Mitsubishi Electric
Mitsubishi Group
Mitsubishi Heavy Industries Limited
Nachi Robotic Systems Inc.
Nachi-Fujikoshi Corporation
National Instruments
Nipro Corporation
Nissan Motor Corporation
Nordson Corporation
Nortech Systems Incorporated
Olympus Technologies
Omni-ID
Omron
Panasonic Corporation
Panasonic Welding Solutions Ltd
Panasonic Welding Systems Co.
Phillips-Medisize
Phoenix Contact
Pilz
Plexus Corp.
PSA Peugeot Citroën
Quasar
Reis Group Holding GmbH & Company KG
Renault S.A
Robert Bosch GmbH
RoboGroup TEK Limited
Rockwell Automation Inc.
Samsung Electronics Company Limited
Sanmina Corporation
SANYO Homes Corporation
Sauber F1 Team
Schneider Electric
SCHUNK GmbH & Company KG
Schunk, Germany
SEGA SAMMY Holdings Incorporated
Seiko Epson Corporation
Sepro Robotique
Shenzhen
Siemens AG
SMC Ltd.
Spectris
ST Robotics
Staubli
STAUBLI Corporation
Stäubli International AG
Stäubli Robotics (Germany)
Suzuki Motor Corporation
System Devices UK
Technip SA
Tecomet
Teleflex Incorporated
Telpak Automation
Tetra Laval International SA
Thales SA
TM Robotics (Europe)
Toshiba Machine (Japan),
Toyota Motor Corporation
TRW Automotive
Universal Robots
Volkswagen AG
WEG Industries
West Pharmaceutical Services
Yamaha Motor Company Limited
Yamaha Robotics
Yaskawa
Yaskawa Electric Corporation
Yaskawa Eshed Technology
Yokogawa Electric
Zucchetti Group
List of Associations Mentioned in the Report
Asian Robotics Society Union (ARSU)
British Automation & Robot Association (BARA)
China Robot Industry Alliance (CRIA)
China Robot Industry Association
EUnited Robotics -The European Robotics Association
euRobotics AISBL (Association Internationale Sans But Lucratif)
International Federation of Robotics (IFR)
International Monetary Fund (IMF)
International Organization for Standardization (ISO)
Japan Automobile Manufacturers Association (JAMA)
Korea Robotics Society
Organisation Internationale des Constructeurs d'Automobiles (OICA)
Robotics Industry Association (RIA)
Robotics Society of China
Robotics Society of Japan
Robotics Society of Singapore (RSS)
Robotics Society of Taiwan
Robotics Society of Thailand
SelectUSA
Verband der Automobilindustrie (VDA)