The Printed Electronics Market Report 2023-2033: This report will prove invaluable to leading firms striving for new revenue pockets if they wish to better understand the industry and its underlying dynamics. It will be useful for companies that would like to expand into different industries or to expand their existing operations in a new region.
The Printed Electronics Market Is Poised for Significant Growth and Development in the Coming Years
The printed electronics market is a rapidly evolving and promising industry with a wide range of potential applications. As a result of its ability to produce flexible, lightweight, and cost-effective electronic solutions, the market is expected to grow significantly in the coming years. While the market is still relatively new and undergoing significant innovation, there have been notable developments and advancements in recent years. The development of new materials and printing techniques, as well as the increasing integration of printed electronics in various industries, are expected to continue to drive growth and adoption.
The market is seeing increasing investment and partnerships, both domestically and internationally, which is contributing to the expansion of the industry. Governments around the world are also supporting the development of printed electronics through funding and research initiatives. There are still challenges to be overcome, including the need for standardization and greater reliability in printed electronics, as well as the need to address issues such as scalability and regulatory compliance.
Overall, the printed electronics market is poised for significant growth and development in the coming years, with a wide range of potential applications and opportunities for innovation. As companies continue to invest in research and development, and as demand for flexible, lightweight, and cost-effective electronic solutions grows, the future looks bright for the printed electronics industry.
What Questions Should You Ask before Buying a Market Research Report?
• How is the printed electronics market evolving?
• What is driving and restraining the printed electronics market?
• How will each printed electronics submarket segment grow over the forecast period and how much revenue will these submarkets account for in 2033?
• How will the market shares for each printed electronics submarket develop from 2023 to 2033?
• What will be the main driver for the overall market from 2023 to 2033?
• Will leading printed electronics markets broadly follow the macroeconomic dynamics, or will individual national markets outperform others?
• How will the market shares of the national markets change by 2033 and which geographical region will lead the market in 2033?
• Who are the leading players and what are their prospects over the forecast period?
• What are the printed electronics projects for these leading companies?
• How will the industry evolve during the period between 2023 and 2033? What are the implications of printed electronics projects taking place now and over the next 10 years?
• Is there a greater need for product commercialisation to further scale the printed electronics market?
• Where is the printed electronics market heading and how can you ensure you are at the forefront of the market?
• What are the best investment options for new product and service lines?
• What are the key prospects for moving companies into a new growth path and C-suite?
You need to discover how this will impact the printed electronics market today, and over the next 10 years:
• Our 284-page report provides 103 tables and 147 charts/graphs exclusively to you.
• The report highlights key lucrative areas in the industry so you can target them – NOW.
• It contains in-depth analysis of global, regional and national sales and growth.
• It highlights for you the key successful trends, changes and revenue projections made by your competitors.
This report tells you TODAY how the printed electronics market will develop in the next 10 years, and in line with the variations in COVID-19 economic recession and bounce. This market is more critical now than at any point over the last 10 years.
Forecasts to 2033 and other analyses reveal commercial prospects
• In addition to revenue forecasting to 2033, our new study provides you with recent results, growth rates, and market shares.
• You will find original analyses, with business outlooks and developments.
• Discover qualitative analyses (including market dynamics, drivers, opportunities, restraints and challenges), cost structure, impact of rising printed electronics prices and recent developments.
This report includes data analysis and invaluable insight into how COVID-19 will affect the industry and your company. Four COVID-19 recovery patterns and their impact, namely, “V”, “L”, “W” and “U” are discussed in this report.
Segments Covered in the Report
Market Segment by Printing Technology
• Screen Printing
• Inkjet Printing
• Flexographic Printing
• Other Printing Technologies
Market Segment by End-Use Industry
• Automotive & Transportation
• Consumer Electronics
• Aerospace & Defense
• Retail & Packaging
• Other End-use Industries
Market Segment by Devices
• Flexible Displays
• RFID Tags
• Smart Packaging
• Wearable Devices
• Organic Light-Emitting Diodes (OLEDs)
• Other Devices

In addition to the revenue predictions for the overall world market and segments, you will also find revenue forecasts for four regional and 20 leading national markets:
North America
• U.S.
• Canada
Europe
• Germany
• Spain
• United Kingdom
• France
• Italy
• Rest of Europe
Asia Pacific
• China
• Japan
• India
• Taiwan
• South Korea
• Rest of Asia Pacific
Latin America
• Brazil
• Mexico
• Rest of Latin America
Middle East & Africa
• GCC
• South Africa
• Rest of Middle East & Africa
Need industry data? Please contact us today.
The report also includes profiles and for some of the leading companies in the Printed Electronics Market, 2023 to 2033, with a focus on this segment of these companies’ operations.
Leading companies and the potential for market growth
• Agfa-Gevaert N.V
• Applied Ink Solutions
• BASF SE
• Cambridge Display Technology
• DuPont de Nemours, Inc.
• E Ink Holdings Inc.
• Jabil Inc.
• LG Display Co., Ltd.
• Molex LLC
• Nissha Co., Ltd.
• NovaCentrix
• Optomec Inc.
• Palo Alto Research Center Incorporated (PARC)
• Samsung Electronics Co., Ltd.
• Ynvisible Interactive Inc.
Overall world revenue for Printed Electronics Market, 2023 to 2033 in terms of value the market will surpass US$10.88 billion in 2023, our work calculates. We predict strong revenue growth through to 2033. Our work identifies which organizations hold the greatest potential. Discover their capabilities, progress, and commercial prospects, helping you stay ahead.
How will the Printed Electronics Market, 2023 to 2033 report help you?
In summary, our 280+ page report provides you with the following knowledge:
• Revenue forecasts to 2033 for Printed Electronics Market, 2023 to 2033 Market, with forecasts for printed technology, end-user industry, devices and company size, each forecast at a global and regional level – discover the industry’s prospects, finding the most lucrative places for investments and revenues.
• Revenue forecasts to 2033 for four regional and 20 key national markets – See forecasts for the Printed Electronics Market, 2023 to 2033 market in North America, Europe, Asia-Pacific, Latin America and Middle East & Africa. Also forecasted is the market in the US, Canada, Brazil, Germany, France, UK, Italy, China, India, Japan, and Australia among other prominent economies.
• Prospects for established firms and those seeking to enter the market – including company profiles for 15 of the major companies involved in the Printed Electronics Market, 2023 to 2033.
Find quantitative and qualitative analyses with independent predictions. Receive information that only our report contains, staying informed with invaluable business intelligence.
Information found nowhere else
With our new report, you are less likely to fall behind in knowledge or miss out on opportunities. See how our work could benefit your research, analyses, and decisions. Visiongain’s study is for everybody needing commercial analyses for the Printed Electronics Market, 2023 to 2033, market-leading companies. You will find data, trends and predictions.
To access the data contained in this document please email contactus@visiongain.com
Buy our report today Printed Electronics Market Report 2023-2033: Forecasts by Printing Technology (Screen Printing, Inkjet Printing, Flexographic Printing, Other), by End-use Industry (Automotive & Transportation, Consumer Electronics, Aerospace & Defence, Retail & Packaging, Other), by Devices (Flexible Displays, RFID Tags, Smart Packaging, Wearable Devices, Organic Light-Emitting Diodes (OLEDs), Other) AND Regional and Leading National Market Analysis PLUS Analysis of Leading Companies AND COVID-19 Impact and Recovery Pattern Analysis. Avoid missing out by staying informed – order our report now.
Visiongain is a trading partner with the US Federal Government
CCR Ref number: KD4R6
Do you have any custom requirements we can help you with? Any need for a specific country, geo region, market segment or specific company information? Contact us today, we can discuss your needs and see how we can help: contactus@visiongain.com
1 Report Overview
1.1 Objectives of the Study
1.2 Introduction to Printed Electronics Market
1.3 What This Report Delivers
1.4 Why You Should Read This Report
1.5 Key Questions Answered by This Analytical Report
1.6 Who is This Report for?
1.7 Research Methodology
1.7.1 Market Definitions
1.7.2 Market Evaluation & Forecasting Methodology
1.7.3 Data Validation
1.7.3.1 Primary Research
1.7.3.2 Secondary Research
1.8 Frequently Asked Questions (FAQs)
1.9 Associated Visiongain Reports
1.10 About Visiongain
2 Executive Summary
2.1 Segment Analysis
2.1.1 Printing Technology Segment: Market Attractiveness Index
2.1.2 End-Use Industry Segment: Market Attractiveness Index
2.1.3 Devices Segment: Market Attractiveness Index
2.2 Regional analysis
3 Market Overview
3.1 Key Findings
3.2 Market Dynamics
3.2.1 Market Driving Factors
3.2.1.1 Rapid Prototyping Is an Essential Tool for Printed Electronics Designers
3.2.1.2 Mass Production of Printed Electronics
3.2.1.3 The Cost of Producing Printed Electronics
3.2.2 Market Restraining Factors
3.2.2.1 The Limited Functionality of Printed Electronics
3.2.2.2 The Environmental Impact of Printed Electronics
3.2.3 Market Opportunities
3.2.3.1 The Healthcare Industry Presents Numerous Opportunities for Printed Electronics
3.2.3.2 Printed Electronics Is Increasingly Being Used to Develop Energy Harvesting Devices
3.2.3.3 Printed Electronics Presents a Range Of Opportunities in The Automotive Industry
3.3 COVID-19 Impact Analysis
3.4 Porter’s Five Forces Analysis
3.4.1 Bargaining Power of Suppliers
3.4.2 Bargaining Power of Buyers
3.4.3 Competitive Rivalry
3.4.4 Threat from Substitutes
3.4.5 Threat of New Entrants
3.5 PEST Analysis
3.5.1 Political Factors:
3.5.2 Economic Factors:
3.5.3 Social Factors:
3.5.4 Technological Factors:
4 Printed Electronics Market Analysis by Printing Technology
4.1 Key Findings
4.2 Printing Technology Segment: Market Attractiveness Index
4.3 Printed Electronics Market Size Estimation and Forecast by Printing Technology
4.4 Screen Printing
4.4.1 Market Size by Region, 2023-2033 (US$ bn)
4.4.2 Market Share by Region, 2023 & 2033 (%)
4.5 Inkjet Printing
4.5.1 Market Size by Region, 2023-2033 (US$ bn)
4.5.2 Market Share by Region, 2023 & 2033 (%)
4.6 Flexographic Printing
4.6.1 Market Size by Region, 2023-2033 (US$ bn)
4.6.2 Market Share by Region, 2023 & 2033 (%)
4.7 Other Printing Technologies
4.7.1 Market Size by Region, 2023-2033 (US$ bn)
4.7.2 Market Share by Region, 2023 & 2033 (%)
5 Printed Electronics Market Analysis by End-Use Industry
5.1 Key Findings
5.2 End-Use Industry Segment: Market Attractiveness Index
5.3 Printed Electronics Market Size Estimation and Forecast by End-Use Industry
5.4 Automotive & Transportation
5.4.1 Market Size by Region, 2023-2033 (US$ bn)
5.4.2 Market Share by Region, 2023 & 2033 (%)
5.5 Consumer Electronics
5.5.1 Market Size by Region, 2023-2033 (US$ bn)
5.5.2 Market Share by Region, 2023 & 2033 (%)
5.6 Aerospace & Defense
5.6.1 Market Size by Region, 2023-2033 (US$ bn)
5.6.2 Market Share by Region, 2023 & 2033 (%)
5.7 Retail & Packaging
5.7.1 Market Size by Region, 2023-2033 (US$ bn)
5.7.2 Market Share by Region, 2023 & 2033 (%)
5.8 Other End-use Industries
5.8.1 Market Size by Region, 2023-2033 (US$ bn)
5.8.2 Market Share by Region, 2023 & 2033 (%)
6 Printed Electronics Market Analysis by Devices
6.1 Key Findings
6.2 Devices Segment: Market Attractiveness Index
6.3 Printed Electronics Market Size Estimation and Forecast by Devices
6.4 Flexible Displays
6.4.1 Market Size by Region, 2023-2033 (US$ bn)
6.4.2 Market Share by Region, 2023 & 2033 (%)
6.5 RFID Tags
6.5.1 Market Size by Region, 2023-2033 (US$ bn)
6.5.2 Market Share by Region, 2023 & 2033 (%)
6.6 Smart Packaging
6.6.1 Market Size by Region, 2023-2033 (US$ bn)
6.6.2 Market Share by Region, 2023 & 2033 (%)
6.7 Wearable Devices
6.7.1 Market Size by Region, 2023-2033 (US$ bn)
6.7.2 Market Share by Region, 2023 & 2033 (%)
6.8 Organic Light-Emitting Diodes (OLEDs)
6.8.1 Market Size by Region, 2023-2033 (US$ bn)
6.8.2 Market Share by Region, 2023 & 2033 (%)
6.9 Other Devices
6.9.1 Market Size by Region, 2023-2033 (US$ bn)
6.9.2 Market Share by Region, 2023 & 2033 (%)
7 Printed Electronics Market Analysis by Region
7.1 Key Findings
7.2 Regional Market Size Estimation and Forecast
8 North America Printed Electronics Market Analysis
8.1 Key Findings
8.2 North America Printed Electronics Market Attractiveness Index
8.3 North America Printed Electronics Market Size Estimation and Forecast by Country
8.4 North America Printed Electronics Market Size Estimation and Forecast by Printing Technology
8.5 North America Printed Electronics Market Size Estimation and Forecast by End-Use Industry
8.6 North America Printed Electronics Market Size Estimation and Forecast by Devices
8.7 U.S. Printed Electronics Market Analysis
8.8 Canada Printed Electronics Market Analysis
9 Europe Printed Electronics Market Analysis
9.1 Key Findings
9.2 Europe Printed Electronics Market Attractiveness Index
9.3 Europe Printed Electronics Market Size Estimation and Forecast by Country
9.4 Europe Printed Electronics Market Size Estimation and Forecast by Printing Technology
9.5 Europe Printed Electronics Market Size Estimation and Forecast by End-Use Industry
9.6 Europe Printed Electronics Market Size Estimation and Forecast by Devices
9.7 Germany Printed Electronics Market Analysis
9.8 UK Printed Electronics Market Analysis
9.9 France Printed Electronics Market Analysis
9.10 Italy Printed Electronics Market Analysis
9.11 Spain Printed Electronics Market Analysis
9.12 Rest of Europe Printed Electronics Market Analysis
10 Asia-Pacific Printed Electronics Market Analysis
10.1 Key Findings
10.2 Asia-Pacific Printed Electronics Market Attractiveness Index
10.3 Asia-Pacific Printed Electronics Market Size Estimation and Forecast by Country
10.4 Asia-Pacific Printed Electronics Market Size Estimation and Forecast by Printing Technology
10.5 Asia-Pacific Printed Electronics Market Size Estimation and Forecast by End-Use Industry
10.6 Asia-Pacific Printed Electronics Market Size Estimation and Forecast by Devices
10.7 China Printed Electronics Market Analysis
10.8 India Printed Electronics Market Analysis
10.9 Japan Printed Electronics Market Analysis
10.10 South Korea Printed Electronics Market Analysis
10.11 Taiwan Printed Electronics Market Analysis
10.12 Rest of Asia-Pacific Printed Electronics Market Analysis
11 Middle East & Africa Printed Electronics Market Analysis
11.1 Key Findings
11.2 Middle East & Africa Printed Electronics Market Attractiveness Index
11.3 Middle East & Africa Printed Electronics Market Size Estimation and Forecast by Country
11.4 Middle East & Africa Printed Electronics Market Size Estimation and Forecast by Printing Technology
11.5 Middle East & Africa Printed Electronics Market Size Estimation and Forecast by End-Use Industry
11.6 Middle East & Africa Printed Electronics Market Size Estimation and Forecast by Devices
11.7 GCC Printed Electronics Market Analysis
11.8 South Africa Printed Electronics Market Analysis
11.9 Rest of Middle East & Africa Printed Electronics Market Analysis
12 Latin America Printed Electronics Market Analysis
12.1 Key Findings
12.2 Latin America Printed Electronics Market Attractiveness Index
12.3 Latin America Printed Electronics Market Size Estimation and Forecast by Country
12.4 Latin America Printed Electronics Market Size Estimation and Forecast by Printing Technology
12.5 Latin America Printed Electronics Market Size Estimation and Forecast by End-Use Industry
12.6 Latin America Printed Electronics Market Size Estimation and Forecast by Devices
12.7 Brazil Printed Electronics Market Analysis
12.8 Mexico Printed Electronics Market Analysis
12.9 Rest of Latin America Printed Electronics Market Analysis
13 Company Profiles
13.1 Competitive Landscape, 2021
13.2 Strategic Outlook
13.2.1 Agreement as Key Business Strategy
13.2.2 Partnership as Key Business Strategy
13.2.3 New Product Launch as Key Business Strategy
13.3 Samsung Electronics Co., Ltd.
13.3.1 Company Snapshot
13.3.2 Company Overview
13.3.3 Financial Analysis
13.3.3.1 Net Revenue, 2018-2022
13.3.3.2 R&D, 2018-2022
13.3.3.3 Regional Market Shares, 2022
13.3.3.4 Business Segment Market Shares, 2022
13.3.4 Product Benchmarking
13.4 LG Display Co., Ltd.
13.4.1 Company Snapshot
13.4.2 Company Overview
13.4.3 Financial Analysis
13.4.3.1 Net Revenue, 2017-2021
13.4.3.2 R&D, 2017-2021
13.4.3.3 Regional Market Shares, 2022
13.4.3.4 Business Segment Market Shares, 2022
13.4.4 Product Benchmarking
13.4.5 Strategic Outlook
13.5 Molex LLC
13.5.1 Company Snapshot
13.5.2 Company Overview
13.5.3 Product Benchmarking
13.5.4 Strategic Outlook
13.6 Agfa-Gevaert N.V
13.6.1 Company Snapshot
13.6.2 Company Overview
13.6.3 Financial Analysis
13.6.3.1 Net Revenue, 2018-2022
13.6.3.2 R&D, 2018-2022
13.6.3.3 Regional Market Shares, 2022
13.6.3.4 Business Segment Market Shares, 2022
13.6.4 Product Benchmarking
13.6.5 Strategic Outlook
13.7 Palo Alto Research Center Incorporated (PARC)
13.7.1 Company Snapshot
13.7.2 Company Overview
13.7.3 Product Benchmarking
13.8 DuPont de Nemours, Inc.
13.8.1 Company Snapshot
13.8.2 Company Overview
13.8.3 Financial Analysis
13.8.3.1 Net Revenue, 2018-2022
13.8.3.2 R&D, 2018-2022
13.8.3.3 Regional Market Shares, 2022
13.8.3.4 Business Segment Market Shares, 2022
13.8.4 Product Benchmarking
13.8.5 Strategic Outlook
13.9 Nissha Co., Ltd.
13.9.1 Company Snapshot
13.9.2 Company Overview
13.9.3 Product Benchmarking
13.10 BASF SE
13.10.1 Company Snapshot
13.10.2 Company Overview
13.10.3 Financial Analysis
13.10.3.1 Net Revenue, 2018-2022
13.10.3.2 R&D, 2018-2022
13.10.3.3 Regional Market Shares, 2022
13.10.3.4 Business Segment Market Shares, 2022
13.10.4 Product Benchmarking
13.11 NovaCentrix
13.11.1 Company Snapshot
13.11.2 Company Overview
13.11.3 Product Benchmarking
13.11.4 Strategic Outlook
13.12 E Ink Holdings Inc.
13.12.1 Company Snapshot
13.12.2 Company Overview
13.12.3 Financial Analysis
13.12.3.1 Net Revenue, 2017-2021
13.12.3.2 R&D, 2018-2022
13.12.3.3 Regional Market Shares, 2021
13.12.3.4 Business Segment Market Shares, 2021
13.12.4 Product Benchmarking
13.12.5 Strategic Outlook
13.13 Ynvisible Interactive Inc
13.13.1 Company Snapshot
13.13.2 Company Overview
13.13.3 Product Benchmarking
13.13.4 Strategic Outlook
13.14 Jabil Inc.
13.14.1 Company Snapshot
13.14.2 Company Overview
13.14.3 Financial Analysis
13.14.3.1 Net Revenue, 2018-2022
13.14.3.2 R&D, 2018-2022
13.14.3.3 Regional Market Shares, 2021
13.14.3.4 Business Segment Market Shares, 2021
13.14.4 Product Benchmarking
13.14.5 Strategic Outlook
13.15 Optomec Inc
13.15.1 Company Snapshot
13.15.2 Company Overview
13.15.3 Product Benchmarking
13.16 Cambridge Display Technology
13.16.1 Company Snapshot
13.16.2 Company Overview
13.16.3 Product Benchmarking
13.17 Applied Ink Solutions
13.17.1 Company Snapshot
13.17.2 Company Overview
13.17.3 Product Benchmarking
14 Conclusion and Recommendations
14.1 Concluding Remarks from Visiongain
14.2 Recommendations for Market Players
List of Tables
Table 1 Printed Electronics Market Snapshot, 2023 & 2033 (US$ billion, CAGR %)
Table 2 Global Printed Electronics Market by Region, 2023-2033 (US$ Bn, AGR (%), CAGR (%)) (V-Shaped Recovery Scenario)
Table 3 Global Printed Electronics Market by Region, 2023-2033 (US$ Bn, AGR (%), CAGR (%)) (W-Shaped Recovery Scenario)
Table 4 Global Printed Electronics Market by Region, 2023-2033 (US$ Bn, AGR (%), CAGR (%)) (L-Shaped Recovery Scenario)
Table 5 Global Printed Electronics Market by Region, 2023-2033 (US$ Bn, AGR (%), CAGR (%)) (U-Shaped Recovery Scenario)
Table 6 Global Printed Electronics Market by Printing Technology, 2023-2033 (US$ Bn, AGR (%), CAGR (%))
Table 7 Screen Printing Market by Region, 2023-2033 (US$ Bn, AGR (%), CAGR (%))
Table 8 Inkjet Printing Market by Region, 2023-2033 (US$ Bn, AGR (%), CAGR (%))
Table 9 Flexographic Printing Market by Region, 2023-2033 (US$ Bn, AGR (%), CAGR (%))
Table 10 Other Printing Technologies Market by Region, 2023-2033 (US$ Bn, AGR (%), CAGR (%))
Table 11 Global Printed Electronics Market by End-Use Industry, 2023-2033 (US$ Bn, AGR (%), CAGR (%))
Table 12 Automotive & Transportation Market by Region, 2023-2033 (US$ Bn, AGR (%), CAGR (%))
Table 13 Consumer Electronics Market by Region, 2023-2033 (US$ Bn, AGR (%), CAGR (%))
Table 14 Aerospace & Defense Market by Region, 2023-2033 (US$ Bn, AGR (%), CAGR (%))
Table 15 Retail & Packaging Market by Region, 2023-2033 (US$ Bn, AGR (%), CAGR (%))
Table 16 Other End-use Industries Market by Region, 2023-2033 (US$ Bn, AGR (%), CAGR (%))
Table 17 Global Printed Electronics Market by Devices, 2023-2033 (US$ Bn, AGR (%), CAGR (%))
Table 18 Flexible Displays Market by Region, 2023-2033 (US$ Bn, AGR (%), CAGR (%))
Table 19 RFID Tags Market by Region, 2023-2033 (US$ Bn, AGR (%), CAGR (%))
Table 20 Smart Packaging Market by Region, 2023-2033 (US$ Bn, AGR (%), CAGR (%))
Table 21 Wearable Devices Market by Region, 2023-2033 (US$ Bn, AGR (%), CAGR (%))
Table 22 Organic Light-Emitting Diodes (OLEDs) Market by Region, 2023-2033 (US$ Bn, AGR (%), CAGR (%))
Table 23 Other Devices Market by Region, 2023-2033 (US$ Bn, AGR (%), CAGR (%))
Table 24 Global Printed Electronics Market by Region, 2023-2033 (US$ Bn, AGR (%), CAGR (%))
Table 25 North America Printed Electronics Market by Country, 2023-2033 (US$ Bn, AGR (%), CAGR (%))
Table 26 North America Printed Electronics Market by Printing Technology, 2023-2033 (US$ Bn, AGR (%), CAGR (%))
Table 27 North America Printed Electronics Market by End-Use Industry, 2023-2033 (US$ Bn, AGR (%), CAGR (%))
Table 28 North America Printed Electronics Market by Devices, 2023-2033 (US$ Bn, AGR (%), CAGR (%))
Table 29 US Printed Electronics Market by Value, 2023-2033 (US$ Bn, AGR (%), CAGR (%))
Table 30 Canada Printed Electronics Market by Value, 2023-2033 (US$ Bn, AGR (%), CAGR (%))
Table 31 Europe Printed Electronics Market by Country, 2023-2033 (US$ Bn, AGR (%), CAGR (%))
Table 32 Europe Printed Electronics Market by Printing Technology, 2023-2033 (US$ Bn, AGR (%), CAGR (%))
Table 33 Europe Printed Electronics Market by End-Use Industry, 2023-2033 (US$ Bn, AGR (%), CAGR (%))
Table 34 Europe Printed Electronics Market by Devices, 2023-2033 (US$ Bn, AGR (%), CAGR (%))
Table 35 Germany Printed Electronics Market by Value, 2023-2033 (US$ Bn, AGR (%), CAGR (%))
Table 36 UK Printed Electronics Market by Value, 2023-2033 (US$ Bn, AGR (%), CAGR (%))
Table 37 France Printed Electronics Market by Value, 2023-2033 (US$ Bn, AGR (%), CAGR (%))
Table 38 Italy Printed Electronics Market by Value, 2023-2033 (US$ Bn, AGR (%), CAGR (%))
Table 39 Spain Printed Electronics Market by Value, 2023-2033 (US$ Bn, AGR (%), CAGR (%))
Table 40 Rest of Europe Printed Electronics Market by Value, 2023-2033 (US$ Bn, AGR (%), CAGR (%))
Table 41 Asia-Pacific Printed Electronics Market by Country, 2023-2033 (US$ Bn, AGR (%), CAGR (%))
Table 42 Asia-Pacific Printed Electronics Market by Printing Technology, 2023-2033 (US$ Bn, AGR (%), CAGR (%))
Table 43 Asia-Pacific Printed Electronics Market by End-Use Industry, 2023-2033 (US$ Bn, AGR (%), CAGR (%))
Table 44 Asia-Pacific Printed Electronics Market by Devices, 2023-2033 (US$ Bn, AGR (%), CAGR (%))
Table 45 China Printed Electronics Market by Value, 2023-2033 (US$ Bn, AGR (%), CAGR (%))
Table 46 India Printed Electronics Market by Value, 2023-2033 (US$ Bn, AGR (%), CAGR (%))
Table 47 Japan Printed Electronics Market by Value, 2023-2033 (US$ Bn, AGR (%), CAGR (%))
Table 48 South Korea Printed Electronics Market by Value, 2023-2033 (US$ Bn, AGR (%), CAGR (%))
Table 49 Taiwan Printed Electronics Market by Value, 2023-2033 (US$ Bn, AGR (%), CAGR (%))
Table 50 Rest of Asia-Pacific Printed Electronics Market by Value, 2023-2033 (US$ Bn, AGR (%), CAGR (%))
Table 51 Middle East & Africa Printed Electronics Market by Country, 2023-2033 (US$ Bn, AGR (%), CAGR (%))
Table 52 Middle East & Africa Printed Electronics Market by Printing Technology, 2023-2033 (US$ Bn, AGR (%), CAGR (%))
Table 53 Middle East & Africa Printed Electronics Market by End-Use Industry, 2023-2033 (US$ Bn, AGR (%), CAGR (%))
Table 54 Middle East & Africa Printed Electronics Market by Devices, 2023-2033 (US$ Bn, AGR (%), CAGR (%))
Table 55 GCC Printed Electronics Market by Value, 2023-2033 (US$ Bn, AGR (%), CAGR (%))
Table 56 South Africa Printed Electronics Market by Value, 2023-2033 (US$ Bn, AGR (%), CAGR (%))
Table 57 Rest of Middle East & Africa Printed Electronics Market by Value, 2023-2033 (US$ Bn, AGR (%), CAGR (%))
Table 58 Latin America Printed Electronics Market by Country, 2023-2033 (US$ Bn, AGR (%), CAGR (%))
Table 59 Latin America Printed Electronics Market by Printing Technology, 2023-2033 (US$ Bn, AGR (%), CAGR (%))
Table 60 Latin America Printed Electronics Market by End-Use Industry, 2023-2033 (US$ Bn, AGR (%), CAGR (%))
Table 61 Latin America Printed Electronics Market Share Forecast by End-Use Industry,2023 & 2033 (%)
Table 62 Latin America Printed Electronics Market by Devices, 2023-2033 (US$ Bn, AGR (%), CAGR (%))
Table 63 Brazil Printed Electronics Market by Value, 2023-2033 (US$ Bn, AGR (%), CAGR (%))
Table 64 Mexico Printed Electronics Market by Value, 2023-2033 (US$ Bn, AGR (%), CAGR (%))
Table 65 Rest of Latin America Printed Electronics Market by Value, 2023-2033 (US$ Bn, AGR (%), CAGR (%))
Table 66 Samsung Electronics Co., Ltd.: Key Details, (CEO, HQ, Revenue, Founded, No. of Employees, Company Type, Website, Business Segment)
Table 67 Samsung Electronics Co., Ltd: Product Benchmarking
Table 68 LG Display Co., Ltd.: Key Details, (CEO, HQ, Revenue, Founded, No. of Employees, Company Type, Website, Business Segment)
Table 69 LG Display Co., Ltd.: Product Benchmarking
Table 70 LG Display Co., Ltd.: Strategic Outlook
Table 71 Molex LLC: Key Details, (CEO, HQ, Revenue, Founded, No. of Employees, Company Type, Website, Business Segment)
Table 72 Molex LLC: Product Benchmarking
Table 73 Molex LLC: Strategic Outlook
Table 74 Agfa-Gevaert N.V: Key Details, (CEO, HQ, Revenue, Founded, No. of Employees, Company Type, Website, Business Segment)
Table 75 Agfa-Gevaert N.V: Product Benchmarking
Table 76 Agfa-Gevaert N.V: Strategic Outlook
Table 77 Palo Alto Research Center Incorporated (PARC): Key Details, (CEO, HQ, Revenue, Founded, No. of Employees, Company Type, Website, Business Segment)
Table 78 Palo Alto Research Center Incorporated (PARC): Product Benchmarking
Table 79 DuPont de Nemours, Inc.: Key Details, (CEO, HQ, Revenue, Founded, No. of Employees, Company Type, Website, Business Segment)
Table 80 DuPont de Nemours, Inc.: Product Benchmarking
Table 81 DuPont de Nemours, Inc.: Strategic Outlook
Table 82 Nissha Co., Ltd.: Key Details, (CEO, HQ, Revenue, Founded, No. of Employees, Company Type, Website, Business Segment)
Table 83 Nissha Co., Ltd.: Product Benchmarking
Table 84 BASF SE: Key Details, (CEO, HQ, Revenue, Founded, No. of Employees, Company Type, Website, Business Segment)
Table 85 BASF SE: Product Benchmarking
Table 86 NovaCentrix: Key Details, (CEO, HQ, Revenue, Founded, No. of Employees, Company Type, Website, Business Segment)
Table 87 NovaCentrix: Product Benchmarking
Table 88 NovaCentrix: Strategic Outlook
Table 89 E Ink Holdings Inc.: Key Details, (CEO, HQ, Revenue, Founded, No. of Employees, Company Type, Website, Business Segment)
Table 90 E Ink Holdings Inc.: Product Benchmarking
Table 91 E Ink Holdings Inc.: Strategic Outlook
Table 92 Ynvisible Interactive Inc: Key Details, (CEO, HQ, Revenue, Founded, No. of Employees, Company Type, Website, Business Segment)
Table 93 Ynvisible Interactive Inc: Product Benchmarking
Table 94 Ynvisible Interactive Inc: Strategic Outlook
Table 95 Jabil Inc.: Key Details, (CEO, HQ, Revenue, Founded, No. of Employees, Company Type, Website, Business Segment)
Table 96 Jabil Inc: Product Benchmarking
Table 97 Jabil Inc.: Strategic Outlook
Table 98 Optomec Inc: Key Details, (CEO, HQ, Revenue, Founded, No. of Employees, Company Type, Website, Business Segment)
Table 99 Optomec Inc: Product Benchmarking
Table 100 Cambridge Display Technology: Key Details, (CEO, HQ, Revenue, Founded, No. of Employees, Company Type, Website, Business Segment)
Table 101 Cambridge Display Technology: Product Benchmarking
Table 102 Applied Ink Solutions: Key Details, (CEO, HQ, Revenue, Founded, No. of Employees, Company Type, Website, Business Segment)
Table 103 Applied Ink Solutions: Product Benchmarking
List of Figures
Figure 1 Printed Electronics Market Segmentation
Figure 2 Printed Electronics Market by Printing Technology: Market Attractiveness Index
Figure 3 Printed Electronics Market by End-Use Industry: Market Attractiveness Index
Figure 4 Printed Electronics Market by Devices: Market Attractiveness Index
Figure 5 Printed Electronics Market Attractiveness Index by Region
Figure 6 Printed Electronics Market: Market Dynamics
Figure 7 COVID Impact Analysis: Printed Electronics Market Recovery Scenarios
Figure 8 Global Printed Electronics Market by Region, 2023-2033 (US$ Bn, AGR (%)) (V-Shaped Recovery Scenario)
Figure 9 Global Printed Electronics Market by Region, 2023-2033 (US$ Bn, AGR (%)) (W-Shaped Recovery Scenario)
Figure 10 Global Printed Electronics Market by Region, 2023-2033 (US$ Bn, AGR (%)) (L-Shaped Recovery Scenario)
Figure 11 Global Printed Electronics Market by Region, 2023-2033 (US$ Bn, AGR (%)) (U-Shaped Recovery Scenario)
Figure 12 Printed Electronics Market: Porter’s Five Forces Analysis
Figure 13 Printed Electronics Market: PEST Analysis
Figure 14 Printed Electronics Market by Printing Technology: Market Attractiveness Index
Figure 15 Global Printed Electronics Market by Printing Technology, 2023-2033 (US$ Bn, AGR (%))
Figure 16 Global Printed Electronics Market Share Forecast by Printing Technology, 2023-2033 (%)
Figure 17 Screen Printing Market by Region, 2023-2033 (US$ Bn, AGR (%))
Figure 18 Screen Printing Market Share Forecast by Region, 2023 & 2033 (%)
Figure 19 Inkjet Printing Market by Region, 2023-2033 (US$ Bn, AGR (%))
Figure 20 Inkjet Printing Market Share Forecast by Region, 2023 & 2033 (%)
Figure 21 Flexographic Printing Market by Region, 2023-2033 (US$ Bn, AGR (%))
Figure 22 Flexographic Printing Market Share Forecast by Region, 2023 & 2033 (%)
Figure 23 Other Printing Technologies Market by Region, 2023-2033 (US$ Bn, AGR (%))
Figure 24 Other Printing Technologies Market Share Forecast by Region, 2023 & 2033 (%)
Figure 25 Printed Electronics Market by End-Use Industry: Market Attractiveness Index
Figure 26 Global Printed Electronics Market by End-Use Industry, 2023-2033 (US$ Bn, AGR (%))
Figure 27 Global Printed Electronics Market Share Forecast by End-Use Industry, 2023-2033 (%)
Figure 28 Automotive & Transportation Market by Region, 2023-2033 (US$ Bn, AGR (%))
Figure 29 Automotive & Transportation Market Share Forecast by Region, 2023 & 2033 (%)
Figure 30 Consumer Electronics Market by Region, 2023-2033 (US$ Bn, AGR (%))
Figure 31 Consumer Electronics Market Share Forecast by Region, 2023 & 2033 (%)
Figure 32 Aerospace & Defense Market by Region, 2023-2033 (US$ Bn, AGR (%))
Figure 33 Aerospace & Defense Market Share Forecast by Region, 2023 & 2033 (%)
Figure 34 Retail & Packaging Market by Region, 2023-2033 (US$ Bn, AGR (%))
Figure 35 Retail & Packaging Market Share Forecast by Region, 2023 & 2033 (%)
Figure 36 Other End-use Industries Market by Region, 2023-2033 (US$ Bn, AGR (%))
Figure 37 Other End-use Industries Market Share Forecast by Region, 2023 & 2033 (%)
Figure 38 Printed Electronics Market by Devices: Market Attractiveness Index
Figure 39 Global Printed Electronics Market by Devices, 2023-2033 (US$ Bn, AGR (%))
Figure 40 Global Printed Electronics Market Share Forecast by Devices, 2023-2033 (%)
Figure 41 Flexible Displays Market by Region, 2023-2033 (US$ Bn, AGR (%))
Figure 42 Flexible Displays Market Share Forecast by Region, 2023 & 2033 (%)
Figure 43 RFID Tags Market by Region, 2023-2033 (US$ Bn, AGR (%))
Figure 44 RFID Tags Market Share Forecast by Region, 2023 & 2033 (%)
Figure 45 Smart Packaging Market by Region, 2023-2033 (US$ Bn, AGR (%))
Figure 46 Smart Packaging Market Share Forecast by Region, 2023 & 2033 (%)
Figure 47 Wearable Devices Market by Region, 2023-2033 (US$ Bn, AGR (%))
Figure 48 Wearable Devices Market Share Forecast by Region, 2023 & 2033 (%)
Figure 49 Organic Light-Emitting Diodes (OLEDs) Market by Region, 2023-2033 (US$ Bn, AGR (%))
Figure 50 Organic Light-Emitting Diodes (OLEDs) Market Share Forecast by Region, 2023 & 2033 (%)
Figure 51 Other Devices Market by Region, 2023-2033 (US$ Bn, AGR (%))
Figure 52 Other Devices Market Share Forecast by Region, 2023 & 2033 (%)
Figure 53 printed electronics Market Forecast by Region 2023, 2033 (Revenue, CAGR%)
Figure 54 Global Printed Electronics Market by Region, 2023-2033 (US$ Bn, AGR (%))
Figure 55 Global Printed Electronics Market by North America: Market Attractiveness Index
Figure 56 North America Printed Electronics Market by Country, 2023-2033 (US$ Bn, AGR (%))
Figure 57 North America Printed Electronics Market Share Forecast by Country, 2023 & 2033 (%)
Figure 58 North America Printed Electronics Market by Printing Technology, 2023-2033 (US$ Bn, AGR (%))
Figure 59 North America Printed Electronics Market Share Forecast by Printing Technology ,2023 & 2033 (%)
Figure 60 North America Printed Electronics Market by End-Use Industry, 2023-2033 (US$ Bn, AGR (%))
Figure 61 North America Printed Electronics Market Share Forecast by End-Use Industry,2023 & 2033 (%)
Figure 62 North America Printed Electronics Market by Devices, 2023-2033 (US$ Bn, AGR (%))
Figure 63 North America Printed Electronics Market Share Forecast by Devices,2023 & 2033 (%)
Figure 64 US Printed Electronics Market by Value, 2023-2033 (US$ Bn, AGR (%))
Figure 65 Canada Printed Electronics Market by Value, 2023-2033 (US$ Bn, AGR (%))
Figure 66 Global Printed Electronics Market by Europe: Market Attractiveness Index
Figure 67 Europe Printed Electronics Market by Country, 2023-2033 (US$ Bn, AGR (%))
Figure 68 Europe Printed Electronics Market Share Forecast by Country, 2023 & 2033 (%)
Figure 69 Europe Printed Electronics Market by Printing Technology, 2023-2033 (US$ Bn, AGR (%))
Figure 70 Europe Printed Electronics Market Share Forecast by Printing Technology ,2023 & 2033 (%)
Figure 71 Europe Printed Electronics Market by End-Use Industry, 2023-2033 (US$ Bn, AGR (%))
Figure 72 Europe Printed Electronics Market Share Forecast by End-Use Industry,2023 & 2033 (%)
Figure 73 Europe Printed Electronics Market by End-Use Industry, 2023-2033 (US$ Bn, AGR (%))
Figure 74 Europe Printed Electronics Market Share Forecast by Devices,2023 & 2033 (%)
Figure 75 Germany Printed Electronics Market by Value, 2023-2033 (US$ Bn, AGR (%))
Figure 76 UK Printed Electronics Market by Value, 2023-2033 (US$ Bn, AGR (%))
Figure 77 France Printed Electronics Market by Value, 2023-2033 (US$ Bn, AGR (%))
Figure 78 Italy Printed Electronics Market by Value, 2023-2033 (US$ Bn, AGR (%))
Figure 79 Spain Printed Electronics Market by Value, 2023-2033 (US$ Bn, AGR (%))
Figure 80 Rest of Europe Printed Electronics Market by Value, 2023-2033 (US$ Bn, AGR (%))
Figure 81 Global Printed Electronics Market by Asia-Pacific: Market Attractiveness Index
Figure 82 Asia-Pacific Printed Electronics Market by Country, 2023-2033 (US$ Bn, AGR (%))
Figure 83 Asia-Pacific Printed Electronics Market Share Forecast by Country, 2023 & 2033 (%)
Figure 84 Asia-Pacific Printed Electronics Market by Printing Technology, 2023-2033 (US$ Bn, AGR (%))
Figure 85 Asia-Pacific Printed Electronics Market Share Forecast by Printing Technology ,2023 & 2033 (%)
Figure 86 Asia-Pacific Printed Electronics Market by End-Use Industry, 2023-2033 (US$ Bn, AGR (%))
Figure 87 Asia-Pacific Printed Electronics Market Share Forecast by End-Use Industry,2023 & 2033 (%)
Figure 88 Asia-Pacific Printed Electronics Market by Devices, 2023-2033 (US$ Bn, AGR (%))
Figure 89 Asia-Pacific Printed Electronics Market Share Forecast by Devices,2023 & 2033 (%)
Figure 90 China Printed Electronics Market by Value, 2023-2033 (US$ Bn, AGR (%))
Figure 91 India Printed Electronics Market by Value, 2023-2033 (US$ Bn, AGR (%))
Figure 92 Japan Printed Electronics Market by Value, 2023-2033 (US$ Bn, AGR (%))
Figure 93 South Korea Printed Electronics Market by Value, 2023-2033 (US$ Bn, AGR (%))
Figure 94 Taiwan Printed Electronics Market by Value, 2023-2033 (US$ Bn, AGR (%))
Figure 95 Rest of Asia-Pacific Printed Electronics Market by Value, 2023-2033 (US$ Bn, AGR (%))
Figure 96 Global Printed Electronics Market by Middle East & Africa: Market Attractiveness Index
Figure 97 Middle East & Africa Printed Electronics Market by Country, 2023-2033 (US$ Bn, AGR (%))
Figure 98 Middle East & Africa Printed Electronics Market Share Forecast by Country, 2023 & 2033 (%)
Figure 99 Middle East & Africa Printed Electronics Market by Printing Technology, 2023-2033 (US$ Bn, AGR (%))
Figure 100 Middle East & Africa Printed Electronics Market Share Forecast by Printing Technology ,2023 & 2033 (%)
Figure 101 Middle East & Africa Printed Electronics Market by End-Use Industry, 2023-2033 (US$ Bn, AGR (%))
Figure 102 Middle East & Africa Printed Electronics Market Share Forecast by End-Use Industry,2023 & 2033 (%)
Figure 103 Middle East & Africa Printed Electronics Market by Devices, 2023-2033 (US$ Bn, AGR (%))
Figure 104 Middle East & Africa Printed Electronics Market Share Forecast by Devices,2023 & 2033 (%)
Figure 105 GCC Printed Electronics Market by Value, 2023-2033 (US$ Bn, AGR (%))
Figure 106 South Africa Printed Electronics Market by Value, 2023-2033 (US$ Bn, AGR (%))
Figure 107 Rest of Middle East & Africa Printed Electronics Market by Value, 2023-2033 (US$ Bn, AGR (%))
Figure 108 Global Printed Electronics Market by Latin America: Market Attractiveness Index
Figure 109 Latin America Printed Electronics Market by Country, 2023-2033 (US$ Bn, AGR (%))
Figure 110 Latin America Printed Electronics Market Share Forecast by Country, 2023 & 2033 (%)
Figure 111 Latin America Printed Electronics Market by Printing Technology, 2023-2033 (US$ Bn, AGR (%))
Figure 112 Latin America Printed Electronics Market Share Forecast by Printing Technology ,2023 & 2033 (%)
Figure 113 Latin America Printed Electronics Market by End-Use Industry, 2023-2033 (US$ Bn, AGR (%))
Figure 114 Latin America Printed Electronics Market by Devices, 2023-2033 (US$ Bn, AGR (%))
Figure 115 Latin America Printed Electronics Market Share Forecast by Devices,2023 & 2033 (%)
Figure 116 Brazil Printed Electronics Market by Value, 2023-2033 (US$ Bn, AGR (%))
Figure 117 Mexico Printed Electronics Market by Value, 2023-2033 (US$ Bn, AGR (%))
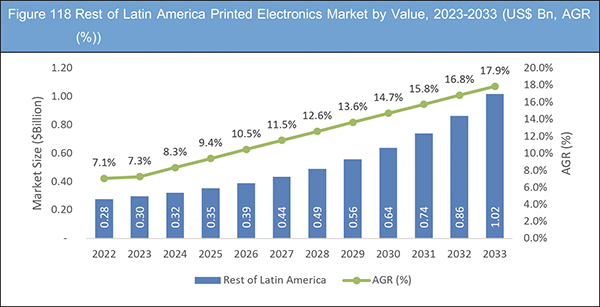
Figure 118 Rest of Latin America Printed Electronics Market by Value, 2023-2033 (US$ Bn, AGR (%))
Figure 119 Printed Electronics Market: Company Share/Ranking, 2021
Figure 120 Samsung Electronics Co., Ltd.: Net Revenue, 2018-2022 (US$ million, AGR%)
Figure 121 Samsung Electronics Co., Ltd.: R&D, 2018-2022 (US$ million, AGR%)
Figure 122 Samsung Electronics Co., Ltd.: Regional Market Shares, 2022
Figure 123 Samsung Electronics Co., Ltd.: Regional Market Shares, 2022
Figure 124 LG Display Co., Ltd.: Net Revenue, 2017-2021 (US$ million, AGR%)
Figure 125 LG Display Co., Ltd.: R&D, 2017-2021 (US$ million, AGR%)
Figure 126 LG Display Co., Ltd.: Regional Market Shares, 2022
Figure 127 LG Display Co., Ltd.: Regional Market Shares, 2022
Figure 128 Agfa-Gevaert N.V: Net Revenue, 2018-2022 (US$ million, AGR%)
Figure 129 Agfa-Gevaert N.V: R&D, 2018-2022 (US$ million, AGR%)
Figure 130 Agfa-Gevaert N.V: Regional Market Shares, 2022
Figure 131 Agfa-Gevaert N.V: Regional Market Shares, 2022
Figure 132 DuPont de Nemours, Inc.: Net Revenue, 2018-2022 (US$ million, AGR%)
Figure 133 DuPont de Nemours, Inc.: R&D, 2018-2022 (US$ million, AGR%)
Figure 134 DuPont de Nemours, Inc.: Regional Market Shares, 2022
Figure 135 DuPont de Nemours, Inc.: Regional Market Shares, 2022
Figure 136 BASF SE: Net Revenue, 2018-2022 (US$ million, AGR%)
Figure 137 BASF SE: R&D, 2018-2022 (US$ million, AGR%)
Figure 138 BASF SE: Regional Market Shares, 2022
Figure 139 BASF SE: Regional Market Shares, 2022
Figure 140 E Ink Holdings Inc.: Net Revenue, 2017-2021 (US$ million, AGR%)
Figure 141 E Ink Holdings Inc.: R&D, 2017-2021 (US$ million, AGR%)
Figure 142 E Ink Holdings Inc.: Regional Market Shares, 2021
Figure 143 E Ink Holdings Inc.: Regional Market Shares, 2021
Figure 144 Jabil Inc.: Net Revenue, 2018-2022 (US$ million, AGR%)
Figure 145 Jabil Inc.: R&D, 2018-2022 (US$ million, AGR%)
Figure 146 Jabil Inc.: Regional Market Shares, 2021
Figure 147 Jabil Inc.: Regional Market Shares, 2021
List of Companies Profiled in the report
Agfa-Gevaert N.V
Applied Ink Solutions
BASF SE
Cambridge Display Technology
DuPont de Nemours, Inc.
E Ink Holdings Inc.
Jabil Inc.
LG Display Co., Ltd.
Molex LLC
Nissha Co., Ltd.
NovaCentrix
Optomec Inc.
Palo Alto Research Center Incorporated (PARC)
Samsung Electronics Co., Ltd.
Ynvisible Interactive Inc.
List of Other Companies Mentioned in the report
Acreo Swedish ICT AB
Agfa-Gevaert N.V.
Applied Ink Solutions
BASF SE
Brewer Science, Inc.
Cambridge Display Technology
Ceradrop MGI Group
Cima NanoTech Inc.
Coatema Coating Machinery GmbH
Coatema Coating Machinery GmbH
Colloidal Ink Co., Ltd.
Conductive Compounds Inc.
DuPont de Nemours, Inc.
Dupont Teijin Films
E Ink Holdings Inc.
Emfit Ltd.
Enfucell Oy Ltd
Enfucell Oy Ltd.
Fujikura Kasei Co., Ltd.
GSI Technologies, LLC
Henkel AG & Co. KGaA
Henkel AG & Co. KGaA.
Intrinsiq Materials, Inc.
ISORG
Jabil Inc.
Kateeva, Inc.
Konarka Technologies, Inc.
LG Display Co., Ltd.
Metamaterial Technologies Inc.
Molex LLC
Nanosolar Inc.
Nanosys, Inc.
Nissha Co., Ltd.
NovaCentrix
Optomec Inc.
Palo Alto Research Center Incorporated (PARC)
Polyera Corporation
PolyIC GmbH & Co. KG
Power Paper Ltd.
PragmatIC Printing Ltd.
Samsung Electronics Co., Ltd.
Soligie, Inc.
Thinfilm Electronics ASA
T-Ink, Inc.
T-Ink, Inc.
Toppan Forms Co., Ltd.
VTT Technical Research Centre of Finland Ltd.
Xerox Corporation
Xolve, Inc.
Ynvisible Interactive Inc.
List of Associations Mentioned in the Report
AIMCAL (Association of International Metallizers, Coaters and Laminators)
APEX (Association for Printed Electronics Industry)
ASTM International (American Society for Testing and Materials)
BICSI (Building Industry Consulting Service International)
CABA (Continental Automated Buildings Association)
FLEXI (Flexible Hybrid Electronics Manufacturing Institute)
FlexTech Alliance
IDTechEx
IEC (International Electrotechnical Commission)
IEEE (Institute of Electrical and Electronics Engineers)
IEEE CPMT (Components, Packaging and Manufacturing Technology Society)
IMI Europe
IPC (Association Connecting Electronics Industries)
IS&T (The Society for Imaging Science and Technology)
NFC Forum (Near Field Communication Forum)
OE-A (Organic and Printed Electronics Association)
Printed Electronics Now
SEMI (Semiconductor Equipment and Materials International)
SPIE (International Society for Optics and Photonics)
TAPPI (Technical Association of the Pulp and Paper Industry)