The Microelectronics Semiconductor Packaging (MIPAC) Market Report 2022-2032: This report will prove invaluable to leading firms striving for new revenue pockets if they wish to better understand the industry and its underlying dynamics. It will be useful for companies that would like to expand into different industries or to expand their existing operations in a new region.
Multi-Chip Packaging (MCP) Connects Several Integrated Circuits (ICs) in A Single Package Structure to Integrate an Electronic System
Multi-chip packaging (MCP), a recent advancement in electronic packaging, connects several integrated circuits (ICs) in a single package structure to integrate an electronic system. Both planar multi-chip modules (MCMs) and the 3D stacked chip packing known as system-in-package (SiP), which includes ICs stacked vertically, are used in MCP technology. To stack chips, one of two methods stacking single-chip packages, stacking many chips in a single package, or combining both methods can be used.
Wafer-level packaging (WLP), which includes making the package while the chips are still in wafer form and then slicing them to separate them, has lately gained popularity. By creating vias through the material used to physically separate the wafers, wafer-level packaging of stacked wafers connects the stacked chips. In light of this, system packaging at the wafer level is feasible and will enable the blending of many technologies in a single package.
High Capital Expenditures For Upscale Packaging Options
High capital expenditures are needed by high-end semiconductor packaging and testing enterprises to produce pricey equipment made by a few number of suppliers. Adoption of innovative packaging techniques has become necessary due to rising miniaturisation demands and low thermal ratings. Only a small number of firms are able to offer these solutions because to the high capital requirements, which restrains the market’s expansion. Semiconductor technology advances in terms of both performance and economics. The cost per gate and wafer reduction is similar to the earlier trend of the 22nm Si node. To address the increasing demand for greater functionality, miniaturisation, cost reduction, and enhanced performance, semiconductor manufacturers are gradually implementing advanced packaging technologies such as 3D/2.5D integration with TSVs and interposers and fan-out wafer level packaging (FOWLP).
What Questions Should You Ask before Buying a Market Research Report?
• How is the microelectronics semiconductor packaging (MIPAC) market evolving?
• What is driving and restraining the microelectronics semiconductor packaging (MIPAC) market?
• How will each microelectronics semiconductor packaging (MIPAC) submarket segment grow over the forecast period and how much revenue will these submarkets account for in 2032?
• How will the market shares for each microelectronics semiconductor packaging (MIPAC) submarket develop from 2022 to 2032?
• What will be the main driver for the overall market from 2022 to 2032?
• Will leading microelectronics semiconductor packaging (MIPAC) markets broadly follow the macroeconomic dynamics, or will individual national markets outperform others?
• How will the market shares of the national markets change by 2032 and which geographical region will lead the market in 2032?
• Who are the leading players and what are their prospects over the forecast period?
• What are the microelectronics semiconductor packaging (MIPAC) projects for these leading companies?
• How will the industry evolve during the period between 2020 and 2032? What are the implications of microelectronics semiconductor packaging (MIPAC) projects taking place now and over the next 10 years?
• Is there a greater need for product commercialisation to further scale the microelectronics semiconductor packaging (MIPAC) market?
• Where is the microelectronics semiconductor packaging (MIPAC) market heading and how can you ensure you are at the forefront of the market?
• What are the best investment options for new product and service lines?
• What are the key prospects for moving companies into a new growth path and C-suite?
You need to discover how this will impact the microelectronics semiconductor packaging (MIPAC) market today, and over the next 10 years:
• Our 316-page report provides 182 tables and 164 charts/graphs exclusively to you.
• The report highlights key lucrative areas in the industry so you can target them – NOW.
• It contains in-depth analysis of global, regional and national sales and growth.
• It highlights for you the key successful trends, changes and revenue projections made by your competitors.
This report tells you TODAY how the microelectronics semiconductor packaging (MIPAC) market will develop in the next 10 years, and in line with the variations in COVID-19 economic recession and bounce. This market is more critical now than at any point over the last 10 years.
The report delivers exclusive COVID-19 variations and economic data specific to your market.
To access the data contained in this document please email contactus@visiongain.com
Forecasts to 2032 and other analyses reveal commercial prospects
• In addition to revenue forecasting to 2032, our new study provides you with recent results, growth rates, and market shares.
• You will find original analyses, with business outlooks and developments.
• Discover qualitative analyses (including market dynamics, drivers, opportunities, restraints and challenges), cost structure, impact of rising microelectronics semiconductor packaging (MIPAC) prices and recent developments.
This report includes data analysis and invaluable insight into how COVID-19 will affect the industry and your company. Four COVID-19 recovery patterns and their impact, namely, “V”, “L”, “W” and “U” are discussed in this report.
Segments Covered in the Report
Market Segment by Material
• Simple Semiconductor Material
• Compound Semiconductor Material
• Other Semiconductor Material
Market Segment by Type
• Flip Chip
• Embedded DIE
• Fan-in WLP
• Fan-out WLP
Market Segment by End-User
• Consumer Electronics
• IT & Telecommunications
• Automotive
• Industrial
• Other End-Users
Market Segment by Technology
• Grid Array
• Small Outline Package
• Dual-flat no-leads (DFN)
• Quad-flat no-leads (QFN)
• Plastic Dual Inline Package (PDIP)
• Ceramic Dual Inline Package (CDIP)

In addition to the revenue predictions for the overall world market and segments, you will also find revenue forecasts for four regional and 20 leading national markets:
North America
• U.S.
• Canada
Europe
• Germany
• Spain
• United Kingdom
• France
• Italy
• Rest of Europe
Asia Pacific
• China
• Japan
• Singapore
• Taiwan
• South Korea
• Rest of Asia Pacific
Middle East & Africa
• Turkey
• Saudi Arabia
• South Africa
• Rest of Middle East & Africa
South America
• Brazil
• Mexico
• Rest of South America
Need industry data? Please contact us today.
The report also includes profiles and for some of the leading companies in the Microelectronics Semiconductor Packaging (MIPAC) Market, 2022 to 2032, with a focus on this segment of these companies’ operations.
Leading companies and the potential for market growth
• Amkor Technology, Inc.
• ASE Group
• Chipbond Technology Corporation
• Chipmos Technologies, Inc.
• Fujitsu Ltd
• Intel Corporation
• Interconnect Systems, Inc. (ISI)
• Jcet/Stats Chippac Ltd
• Murata Electronics
• Powertech Technology, Inc.
• Samsung Electronics Co. Ltd
• Siliconware Precision Industries Co. Ltd (Spil)
• Tianshui Huatian Technology Co. Ltd
• Unisem (M) Berhad
• UTAC Group
Overall world revenue for Microelectronics Semiconductor Packaging (MIPAC) Market, 2022 to 2032 in terms of value the market will surpass US$46,043 million in 2022, our work calculates. We predict strong revenue growth through to 2032. Our work identifies which organizations hold the greatest potential. Discover their capabilities, progress, and commercial prospects, helping you stay ahead.
How will the Microelectronics Semiconductor Packaging (MIPAC) Market, 2022 to 2032 report help you?
In summary, our 310+ page report provides you with the following knowledge:
• Revenue forecasts to 2032 for Microelectronics Semiconductor Packaging (MIPAC) Market, 2022 to 2032 Market, with forecasts for technology, material, end-user, type and company size, each forecast at a global and regional level – discover the industry’s prospects, finding the most lucrative places for investments and revenues.
• Revenue forecasts to 2032 for four regional and 20 key national markets – See forecasts for the Microelectronics Semiconductor Packaging (MIPAC) Market, 2022 to 2032 market in North America, Europe, Asia-Pacific and LAMEA. Also forecasted is the market in the US, Canada, Taiwan, Brazil, Germany, France, UK, Italy, China, Singapore, Japan, and Australia among other prominent economies.
• Prospects for established firms and those seeking to enter the market – including company profiles for 15 of the major companies involved in the Microelectronics Semiconductor Packaging (MIPAC) Market, 2022 to 2032.
Find quantitative and qualitative analyses with independent predictions. Receive information that only our report contains, staying informed with invaluable business intelligence.
Information found nowhere else
With our new report, you are less likely to fall behind in knowledge or miss out on opportunities. See how our work could benefit your research, analyses, and decisions. Visiongain’s study is for everybody needing commercial analyses for the Microelectronics Semiconductor Packaging (MIPAC) Market, 2022 to 2032, market-leading companies. You will find data, trends and predictions.
To access the data contained in this document please email contactus@visiongain.com
Buy our report today Microelectronics Semiconductor Packaging (MIPAC) Market Report 2022-2032: Forecasts by Material (Simple Semiconductor Material, Compound Semiconductor Material, Other), by Type (Flip Chip, Embedded DIE, Fan-in WLP, Fan-out WLP), by End-user (Consumer Electronics, IT & Telecommunications, Automotive, Industrial, Other), by Technology (Grid Array, Small Outline Package, Dual-flat No-leads (DFN), Quad-flat No-leads (QFN), Plastic Dual Inline Package (PDIP), Ceramic Dual Inline Package (CDIP)) AND Regional and Leading National Market Analysis PLUS Analysis of Leading Companies AND COVID-19 Impact and Recovery Pattern Analysis. Avoid missing out by staying informed – order our report now.
Visiongain is a trading partner with the US Federal Government
CCR Ref number: KD4R6
Do you have any custom requirements we can help you with? Any need for a specific country, geo region, market segment or specific company information? Contact us today, we can discuss your needs and see how we can help: contactus@visiongain.com
1. Report Overview
1.1 Objectives of the Study
1.2 Introduction to Microelectronics Semiconductor Packaging (MIPAC) Market
1.3 What This Report Delivers
1.4 Why You Should Read This Report
1.5 Key Questions Answered By This Analytical Report Include:
1.6 Who is This Report For?
1.7 Methodology
1.7.1 Market Definitions
1.7.2 Market Evaluation & Forecasting Methodology
1.7.3 Data Validation
1.8 Frequently Asked Questions (FAQs)
1.9 Associated Visiongain Reports
1.10 About Visiongain
2 Executive Summary
3 Premium Insights
3.1 Region Segment: Global Microelectronics Semiconductor Packaging (MIPAC) Market
3.2 Materials Segment: Global Microelectronics Semiconductor Packaging (MIPAC) Market Attractiveness Index
3.3 End-users Segment: Global Microelectronics Semiconductor Packaging (MIPAC) Market Attractiveness Index
3.4 Technology Segment: Global Microelectronics Semiconductor Packaging (MIPAC) Market Attractiveness Index
3.5 North America Microelectronics Semiconductor Packaging (MIPAC) Market Attractiveness Index
3.6 Europe Microelectronics Semiconductor Packaging (MIPAC) Attractiveness Index
3.7 Asia-Pacific Microelectronics Semiconductor Packaging (MIPAC) Attractiveness Index
3.8 Middle East Africa Microelectronics Semiconductor Packaging (MIPAC) Attractiveness Index
3.9 South America Microelectronics Semiconductor Packaging (MIPAC) Attractiveness Index
4 Market Overview
4.1 Key Findings
4.2 Market Dynamics
4.2.1 Market Driving Factors
4.2.2 Market Restraining Factors
4.2.3 Market Opportunities
4.3 COVID-19 Impact Analysis
4.4 Porter’s Five Forces Analysis
4.4.1 Supplier Power
4.4.2 Buyer Power
4.4.3 Competitive Rivalry
4.4.4 Threat from Substitutes
4.4.5 Threat of New Entrants
4.5 PESTLE Analysis
4.5.1 Political Factors
4.5.2 Economic Factors
4.5.3 Social Factors
4.5.4 Technology Factors
4.5.5 Environmental Factors
5 Global Microelectronics Semiconductor Packaging (MIPAC) Market Analysis by Material
5.1 Key Findings
5.2 Materials Segment Growth Prospects
5.3 Global Microelectronics Semiconductor Packaging (MIPAC) Market Share by Materials, 2022 & 2032
5.4 Simple Semiconductor
5.5 Global Simple Semiconductor Market Size Estimation and Forecast, 2022-2032 (US$Mn)
5.6 Global Simple Semiconductor Market Size Estimation and Forecast by Region, 2022-2032 (%)
5.7 Compound Semiconductor
5.8 Global Compound Semiconductor Market Size Estimation and Forecast, 2022-2032 (US$Mn)
5.9 Global Compound Semiconductor Market Size Estimation and Forecast by Region, 2022-2032 (%)
5.10 Global Microelectronics Semiconductor Packaging (MIPAC) Market Size Estimation and Forecast by Materials
6 Global Microelectronics Semiconductor Packaging (MIPAC) Market Analysis by Type
6.1 Key Findings
6.2 Type Segment Growth Prospects
6.3 Global Microelectronics Semiconductor Packaging (MIPAC) Market Share by Therapeutics, 2022 & 2032
6.4 Flip-Chip Packages
6.5 Global Flip-Chip Packages Market Size Estimation and Forecast, 2022-2032 (US$Mn)
6.6 Global Flip-Chip Packages Market Size Estimation and Forecast by Region, 2022-2032 (%)
6.7 Embedded Die
6.8 Global Embedded Die Market Size Estimation and Forecast, 2022-2032 (US$Mn)
6.9 Global Embedded Die Market Size Estimation and Forecast by Region, 2022-2032 (%)
6.10 Fan-in WLP
6.11 Global Fan-in WLP Market Size Estimation and Forecast, 2022-2032 (US$Mn)
6.12 Global Fan-in WLP Market Size Estimation and Forecast Region, 2022-2032 (%)
6.13 Fan-out WLP
6.14 Global Fan-Out WLP Market Size Estimation and Forecast, 2022-2032 (US$Mn)
6.15 Global Fan-Out WLP Market Size Estimation and Forecast, by Region, 2022-2032 (%)
6.16 Global Microelectronics Semiconductor Packaging (MIPAC) Market Size Estimation and Forecast by Type
7 Global Microelectronics Semiconductor Packaging (MIPAC) Market by Technology
7.1 Key Findings
7.2 Technology Segment Growth Prospects
7.3 Global Microelectronics Semiconductor Packaging (MIPAC) Market Share by Therapeutics, 2022 & 2032
7.4 Grid Array
7.4.1 Global Grid Array Market Size Estimation and Forecast, 2022-2032 (US$Mn)
7.5 Global Grid Array Market Size Estimation and Forecast by Region, 2022-2032 (%)
7.6 Quad-Flat No-Leads (QFN)
7.7 Global Quad-Flat No-Leads (QFN) Market Size Estimation and Forecast
7.8 Global Quad-Flat No-Leads (QFN) Market Size Estimation and Forecast by Region
7.9 Dual-Flat No-Leads (DFN)
7.10 Global Dual-Flat No-Leads (QFN) Market Size Estimation and Forecast
7.11 Global Dual-Flat No-Leads (QFN) Market Size Estimation and Forecast by Region
7.12 Plastic Dual Inline Package (PDIP)
7.13 Global Plastic Dual Inline Package (PDIP) Market Size Estimation and Forecast
7.14 Global Plastic Dual Inline Package (PDIP) Market Size Estimation and Forecast by Region
7.15 Small Outline Package
7.16 Global Small Outline Package Market Size Estimation and Forecast
7.17 Global Small Outline Package Market Size Estimation and Forecast by Region
7.18 Ceramic Dual Inline Package (CDIP)
7.19 Global Ceramic Dual Inline Package (CDIP)Market Size Estimation and Forecast
7.20 Global Ceramic Dual Inline Package (CDIP) Market Size Estimation and Forecast by Region
7.21 Global Microelectronics Semiconductor Packaging (MIPAC) Market Size Estimation and Forecast by Technology
8 Global Microelectronics Semiconductor Packaging (MIPAC) Market Analysis by End User
8.1 Key Findings
8.2 End User Segment Growth Prospects
8.3 Global Microelectronics Semiconductor Packaging (MIPAC) Market Share by End User, 2022 & 2032
8.4 Automotive
8.5 Global Automotive Market Size and Estimation Forecast
8.6 Global Automotive Market Size and Estimation Forecast by Region
8.7 Consumer Electronics
8.8 Global Consumer Electronics Market Size and Estimation Forecast
8.9 Global Consumer Electronics Market Size and Estimation Forecast by Region
8.10 Industrial
8.11 Global Industrial Market Size and Estimation Forecast
8.12 Global Industrial Market Size and Estimation by Region
8.13 IT & Telecommunications
8.14 Global IT & Telecommunication Market Size and Estimation Forecast
8.15 Global IT & Telecommunication Market Size and Estimation Forecast by Region
8.16 Global Microelectronics Semiconductor Packaging (MIPAC) Market Size Estimation and Forecast by End User
9 Global Microelectronics Semiconductor Packaging (MIPAC) Market Analysis by Region
9.1 Key Findings
9.2 North America
9.3 Europe
9.4 Asia-Pacific
9.5 Middle East and Africa
9.6 South America
9.7 Regional Market Size Estimation and Forecast
10 North America Microelectronics Semiconductor Packaging (MIPAC) Market Analysis
10.1 Key Findings
10.2 North American Semiconductor Manufacturing Equipment Demand
10.3 North America Microelectronics Semiconductor Packaging (MIPAC) Market Attractiveness Index
10.4 North America Microelectronics Semiconductor Packaging (MIPAC) Market Size Estimation and Forecast by Country
10.5 North America Microelectronics Semiconductor Packaging (MIPAC) Market Size Estimation and Forecast by Materials
10.6 North America Microelectronics Semiconductor Packaging (MIPAC) Market Size Estimation and Forecast by Type
10.7 North America Microelectronics Semiconductor Packaging (MIPAC) Market Size Estimation and Forecast by End-users
10.8 North America Microelectronics Semiconductor Packaging (MIPAC) Market Size Estimation and Forecast by Technology
10.9 U.S.
10.10 Canada
11 Europe Market Microelectronics Semiconductor Packaging (MIPAC) Market Analysis
11.1 Key Findings
11.2 Europe Market Microelectronics Semiconductor Packaging (MIPAC) Market Attractiveness Index
11.3 Europe Market Microelectronics Semiconductor Packaging (MIPAC) Market Size Estimation and Forecast by Country
11.4 Europe Market Microelectronics Semiconductor Packaging (MIPAC) Market Size Estimation and Forecast by Materials
11.5 Europe Market Microelectronics Semiconductor Packaging (MIPAC) Market Size Estimation and Forecast by Type
11.6 Europe Market Microelectronics Semiconductor Packaging (MIPAC) Market Size Estimation and Forecast by End-users
11.7 Europe Market Microelectronics Semiconductor Packaging (MIPAC) Market Size Estimation and Forecast by Technology
11.8 Germany Market
11.9 France Market
11.10 UK Market
11.11 Italy Market
11.12 Spain Market
11.13 Rest of Europe
12 Asia-Pacific Market Microelectronics Semiconductor Packaging (MIPAC) Market Analysis
12.1 Key Findings
12.2 Asia-Pacific Market Microelectronics Semiconductor Packaging (MIPAC) Market Attractiveness Index
12.3 Asia-Pacific Market Microelectronics Semiconductor Packaging (MIPAC) Market Size Estimation and Forecast by Country
12.4 Asia-Pacific Market Microelectronics Semiconductor Packaging (MIPAC) Market Size Estimation and Forecast by Materials
12.5 Asia-Pacific Market Microelectronics Semiconductor Packaging (MIPAC) Market Size Estimation and Forecast by Type
12.6 Asia-Pacific Market Microelectronics Semiconductor Packaging (MIPAC) Market Size Estimation and Forecast by End-users
12.7 Asia-Pacific Market Microelectronics Semiconductor Packaging (MIPAC) Market Size Estimation and Forecast by Technology
12.8 China Market
12.9 Taiwan Market
12.10 Japan Market
12.11 South Korea Market
12.12 Singapore Market
12.13 Rest of Asia-Pacific
13 South America Microelectronics Semiconductor Packaging (MIPAC) Market Analysis
13.1 Key Findings
13.2 South America Microelectronics Semiconductor Packaging (MIPAC) Market Attractiveness Index
13.3 South America Microelectronics Semiconductor Packaging (MIPAC) Market Size Estimation and Forecast by Country
13.4 South America Microelectronics Semiconductor Packaging (MIPAC) Market Size Estimation and Forecast by Materials
13.5 South America Microelectronics Semiconductor Packaging (MIPAC) Market Size Estimation and Forecast by Type
13.6 South America Microelectronics Semiconductor Packaging (MIPAC) Market Size Estimation and Forecast by End-users
13.7 Brazil Market
13.8 Mexico Market
13.9 Rest of South America
14 Middle East & Africa Microelectronics Semiconductor Packaging (MIPAC) Market Analysis
14.1 Key Findings
14.2 Middle East & Africa Microelectronics Semiconductor Packaging (MIPAC) Market Attractiveness Index
14.3 Middle East & Africa Microelectronics Semiconductor Packaging (MIPAC) Market Size Estimation and Forecast by Country
14.4 Middle East & Africa Microelectronics Semiconductor Packaging (MIPAC) Market Size Estimation and Forecast by Materials
14.5 Middle East & Africa Microelectronics Semiconductor Packaging (MIPAC) Market Size Estimation and Forecast by Type
14.6 Middle East & Africa Microelectronics Semiconductor Packaging (MIPAC) Market Size Estimation and Forecast by End-users
14.7 Middle East & Africa Microelectronics Semiconductor Packaging (MIPAC) Market Size Estimation and Forecast by Technology
14.8 Saudi Arabia Market
14.9 Turkey Market
14.10 South Africa Market
14.11 Rest of Middle East & Africa
15 Competitive Landscape
15.1 Company Share Analysis
15.2 Key Business Strategy Analysis – Collaboration
15.3 Key Business Strategy Analysis – Acquisition
15.4 Key Business Strategy Analysis – Expansion
15.5 Key Business Strategy Analysis –Investment
15.6 Key Business Strategy Analysis – New Product Launch
15.6 Key Business Strategy Analysis – Partnership
15.8 Key Business Strategy Analysis – Agreement
16 Company Profiles
16.1 ASE Group
16.1.1 Company Snapshot
16.1.2 Company Overview
16.1.3 Financial Analysis
16.1.4 Product Benchmarking
16.1.5 Strategic Outlook
16.2 Amkor Technology
16.2.1 Company Snapshot
16.2.2 Company Overview
16.2.3 Financial Analysis
16.2.4 Product Benchmarking
16.2.5 Strategic Outlook
16.3 Jcet/Stats Chippac Ltd
16.3.1 Company Snapshot
16.3.2 Company Overview
16.3.3 Product Benchmarking
16.3.4 Strategic Outlook
16.4 Siliconware Precision Industries Co. Ltd (Spil)
16.4.1 Company Snapshot
16.4.2 Company Overview
16.4.3 Product Benchmarking
16.5 Powertech Technology, Inc.
16.5.1 Company Snapshot
16.5.2 Company Overview
16.6 Tianshui Huatian Technology Co. Ltd
16.6.1 Company Snapshot
16.6.2 Company Overview
16.6.3 Strategic Outlook
16.7 Fujitsu Ltd
16.7.1 Company Snapshot
16.7.2 Company Overview
16.7.3 Financial Analysis
16.7.4 Product Benchmarking
16.7.5 Strategic Outlook
16.8 UTAC Group
16.8.1 Company Snapshot
16.8.2 Company Overview
16.8.3 Product Benchmarking
16.8.4 Strategic Outlook
16.9 Chipmos Technologies, Inc.
16.9.1 Company Snapshot
16.9.2 Company Overview
16.9.3 Financial Analysis
16.9.4 Product Benchmarking
16.10 Chipbond Technology Corporation
16.10.1 Company Snapshot
16.10.2 Company Overview
16.10.3 Strategic Outlook
16.11 Intel Corporation
16.11.1 Company Snapshot
16.11.2 Company Overview
16.11.3 Financial Analysis
16.11.4 Product Benchmarking
16.11.5 Strategic Outlook
16.12 Samsung Electronics Co. Ltd
16.12.1 Company Snapshot
16.12.2 Company Overview
16.12.3 Product Benchmarking
16.12.4 Strategic Outlook
16.13 Unisem (M) Berhad
16.13.1 Company Snapshot
16.13.2 Company Overview
16.13.3 Product Benchmarking
16.14 Interconnect Systems, Inc. (ISI)
16.14.1 Company Snapshot
16.14.2 Company Overview
16.14.3 Product Benchmarking
16.15 Murata Electronics
16.15.1 Company Snapshot
16.15.2 Company Overview
16.15.3 Strategic Outlook
17 Conclusion and Recommendations
17.1 Concluding Remarks from Visiongain
17.2 Recommendations for Market Players
17.2.1 Ensure that Export Controls Support Semiconductor Manufacturing and Advanced Packaging Supply Chain:
17.2.2 Incentivize increased domestic advanced packaging capacity by leveraging Chips Act funds.
17.2.3 Encourage the formation of a joint venture in the United States with a leading supplier of IC substrates used in advanced packaging.
List of Tables
Table 1 Global Microelectronics Semiconductor Packaging (MIPAC) Market Snapshot, 2022 & 2032 (US$ million, CAGR %)
Table 2 Global Microelectronics Semiconductor Packaging (MIPAC) Market by Region, 2022-2032 (USD Mn, AGR (%), ) (V-Shaped Recovery Scenario)
Table 3 Global Microelectronics Semiconductor Packaging (MIPAC) Market by Region, 2022-2032 (USD Mn, AGR (%), ) (U-Shaped Recovery Scenario)
Table 4 Global Microelectronics Semiconductor Packaging (MIPAC) Market by Region, 2022-2032 (USD Mn, AGR (%),) (W-Shaped Recovery Scenario)
Table 5 Global Microelectronics Semiconductor Packaging (MIPAC) Market by Region, 2022-2032 (USD Mn, AGR (%),) (L-Shaped Recovery Scenario)
Table 6 Global Simple Semiconductor Material Market Forecast, 2022-2032 (USD Mn, AGR (%), CAGR(%))
Table 7 Global Simple Semiconductor Material Market by Region, 2022-2032 (USD Mn, AGR (%), CAGR(%))
Table 8 Global Compound Semiconductor Material Market Forecast, 2022-2032 (USD Mn, AGR (%), CAGR(%))
Table 9 Global Compound Semiconductor Material Market by Region, 2022-2032 (USD Mn, AGR (%), CAGR(%))
Table 10 Global Microelectronics Semiconductor Packaging (MIPAC) Market by Material, 2022-2032 (USD Mn, AGR (%), CAGR(%))
Table 11 Global Flip Chip Market Forecast, 2022-2032 (USD Mn, AGR (%), CAGR(%))
Table 12 Global Flip Chip Market by Region, 2022-2032 (USD Mn, AGR (%), CAGR(%))
Table 13 Global Embedded DIE Market Forecast, 2022-2032 (USD Mn, AGR (%), CAGR(%))
Table 14 Global Embedded DIE Market by Region, 2022-2032 (USD Mn, AGR (%), CAGR(%))
Table 15 Global Fan-in WLP Market Forecast, 2022-2032 (USD Mn, AGR (%), CAGR(%))
Table 16 Global Fan-in WLP Market by Region, 2022-2032 (USD Mn, AGR (%), CAGR(%))
Table 17 Global Fan-out WLP Market Forecast, 2022-2032 (USD Mn, AGR (%), CAGR(%))
Table 18 Global Fan-out WLP Market by Region, 2022-2032 (USD Mn, AGR (%), CAGR(%))
Table 19 Global Microelectronics Semiconductor Packaging (MIPAC) Market by Type, 2022-2032 (USD Mn, AGR (%), CAGR(%))
Table 20 Global Grid Array Market Forecast, 2022-2032 (USD Mn, AGR (%), CAGR(%))
Table 21 Global Grid Array Market by Region, 2022-2032 (USD Mn, AGR (%), CAGR(%))
Table 22 Global Quad-flat no-leads (QFN) Market Forecast, 2022-2032 (USD Mn, AGR (%), CAGR(%))
Table 23 Global Quad-flat no-leads (QFN) Market by Region, 2022-2032 (USD Mn, AGR (%), CAGR(%))
Table 24 Global Dual-flat no-leads (DFN) Market Forecast, 2022-2032 (USD Mn, AGR (%), CAGR(%))
Table 25 Global Dual-flat no-leads (DFN) Market by Region, 2022-2032 (USD Mn, AGR (%), CAGR(%))
Table 26 Global Plastic Dual Inline Package (PDIP) Market Forecast, 2022-2032 (USD Mn, AGR (%), CAGR(%))
Table 27 Global Plastic Dual Inline Package (PDIP) Market by Region, 2022-2032 (USD Mn, AGR (%), CAGR(%))
Table 28 Global Small Outline Package Market Forecast, 2022-2032 (USD Mn, AGR (%), CAGR(%))
Table 29 Global Small Outline Package Market by Region, 2022-2032 (USD Mn, AGR (%), CAGR(%))
Table 30 Global Ceramic Dual Inline Package (CDIP) Market Forecast, 2022-2032 (USD Mn, AGR (%), CAGR(%))
Table 31 Global Ceramic Dual Inline Package (CDIP) Market by Region, 2022-2032 (USD Mn, AGR (%), CAGR(%))
Table 32 Global Microelectronics Semiconductor Packaging (MIPAC) Market by Technology, 2022-2032 (USD Mn, AGR (%), CAGR(%))
Table 33 Global Automotive Market Forecast, 2022-2032 (USD Mn, AGR (%),CAGR(%))
Table 34 Global Automotive Market by Region, 2022-2032 (USD Mn, AGR (%),CAGR(%))
Table 35 Global Consumer Electronics Market Forecast, 2022-2032 (USD Mn, AGR (%),CAGR(%))
Table 36 Global Consumer Electronics Market by Region, 2022-2032 (USD Mn, AGR (%),CAGR(%))
Table 37 Global Industrial Market Forecast, 2022-2032 (USD Mn, AGR (%),CAGR(%))
Table 38 Global Industrial Market by Region, 2022-2032 (USD Mn, AGR (%),CAGR(%))
Table 39 Global IT & Telecommunications Market Forecast, 2022-2032 (USD Mn, AGR (%),CAGR(%))
Table 40 Global IT & Telecommunications Market by Region, 2022-2032 (USD Mn, AGR (%), CAGR(%))
Table 41 Global Microelectronics Semiconductor Packaging (MIPAC) Market by End-User, 2022-2032 (USD Mn, AGR (%),CAGR(%))
Table 42 Global Microelectronics Semiconductor Packaging (MIPAC) Market by Region, 2022-2032 (USD Mn, AGR (%)
Table 43 North America Microelectronics Semiconductor Packaging (MIPAC) Market by Country, 2022-2032 (USD Mn, AGR (%)
Table 44 North America Microelectronics Semiconductor Packaging (MIPAC) Market by Material, 2022-2032 (USD Mn, AGR (%)
Table 45 North America Microelectronics Semiconductor Packaging (MIPAC) Market by Type, 2022-2032 (USD Mn, AGR (%),CAGR(%))
Table 46 North America Microelectronics Semiconductor Packaging (MIPAC) Market by End-User, 2022-2032 (USD Mn, AGR (%),CAGR(%))
Table 47 North America Microelectronics Semiconductor Packaging (MIPAC) Market by Technology, 2022-2032 (USD Mn, AGR (%),CAGR(%))
Table 48 US Microelectronics Semiconductor Packaging (MIPAC) Market by Value, 2022-2032 (USD Mn, AGR (%),CAGR(%))
Table 49 Canada Microelectronics Semiconductor Packaging (MIPAC) Market by Value, 2022-2032 (USD Mn, AGR (%),CAGR(%))
Table 50 Europe Microelectronics Semiconductor Packaging (MIPAC) Market by Country, 2022-2032 (USD Mn, AGR (%),CAGR(%))
Table 51 Europe Microelectronics Semiconductor Packaging (MIPAC) Market by Material, 2022-2032 (USD Mn, AGR (%),CAGR(%))
Table 52 Europe Microelectronics Semiconductor Packaging (MIPAC) Market by Type, 2022-2032 (USD Mn, AGR (%),CAGR(%))
Table 53 Europe Microelectronics Semiconductor Packaging (MIPAC) Market by End-User, 2022-2032 (USD Mn, AGR (%),CAGR(%))
Table 54 Europe Microelectronics Semiconductor Packaging (MIPAC) Market by Technology, 2022-2032 (USD Mn, AGR (%),CAGR(%))
Table 55 Germany Microelectronics Semiconductor Packaging (MIPAC) Market by Value, 2022-2032 (USD Mn, AGR (%),CAGR(%))
Table 56 France Microelectronics Semiconductor Packaging (MIPAC) Market by Value, 2022-2032 (USD Mn, AGR (%),CAGR(%))
Table 57 UK Microelectronics Semiconductor Packaging (MIPAC) Market by Value, 2022-2032 (USD Mn, AGR (%),CAGR(%))
Table 58 Italy Microelectronics Semiconductor Packaging (MIPAC) Market by Value, 2022-2032 (USD Mn, AGR (%),CAGR(%))
Table 59 Spain Microelectronics Semiconductor Packaging (MIPAC) Market by Value, 2022-2032 (USD Mn, AGR (%),CAGR(%))
Table 60 Rest of Europe Microelectronics Semiconductor Packaging (MIPAC) Market by Value, 2022-2032 (USD Mn, AGR (%), CAGR(%))
Table 61 Asia-Pacific Microelectronics Semiconductor Packaging (MIPAC) Market by Country, 2022-2032 (USD Mn, AGR (%),CAGR(%))
Table 62 Asia-Pacific Microelectronics Semiconductor Packaging (MIPAC) Market by Material, 2022-2032 (USD Mn, AGR (%),CAGR(%))
Table 63 Asia-Pacific Microelectronics Semiconductor Packaging (MIPAC) Market by Type, 2022-2032 (USD Mn, AGR (%),CAGR(%))
Table 64 Asia-Pacific Microelectronics Semiconductor Packaging (MIPAC) Market by End-User, 2022-2032 (USD Mn, AGR (%),CAGR(%))
Table 65 Asia-Pacific Microelectronics Semiconductor Packaging (MIPAC) Market by Technology, 2022-2032 (USD Mn, AGR (%),CAGR(%))
Table 66 China Microelectronics Semiconductor Packaging (MIPAC) Market by Value, 2022-2032 (USD Mn, AGR (%),CAGR(%))
Table 67 Taiwan Microelectronics Semiconductor Packaging (MIPAC) Market by Value, 2022-2032 (USD Mn, AGR (%),CAGR(%))
Table 68 Japan Microelectronics Semiconductor Packaging (MIPAC) Market by Value, 2022-2032 (USD Mn, AGR (%),CAGR(%))
Table 69 South Korea Microelectronics Semiconductor Packaging (MIPAC) Market by Value, 2022-2032 (USD Mn, AGR (%),CAGR(%))
Table 70 Singapore Microelectronics Semiconductor Packaging (MIPAC) Market by Value, 2022-2032 (USD Mn, AGR (%),CAGR(%))
Table 71 Rest of Asia-Pacific Microelectronics Semiconductor Packaging (MIPAC) Market by Value, 2022-2032 (USD Mn, AGR (%), CAGR(%))
Table 72 South America Microelectronics Semiconductor Packaging (MIPAC) Market by Country, 2022-2032 (USD Mn, AGR (%),CAGR(%))
Table 73 South America Microelectronics Semiconductor Packaging (MIPAC) Market by Material, 2022-2032 (USD Mn, AGR (%),CAGR(%))
Table 74 South America Microelectronics Semiconductor Packaging (MIPAC) Market by Type, 2022-2032 (USD Mn, AGR (%),CAGR(%))
Table 75 South America Microelectronics Semiconductor Packaging (MIPAC) Market by End-User, 2022-2032 (USD Mn, AGR (%),CAGR(%))
Table 76 Brazil Microelectronics Semiconductor Packaging (MIPAC) Market by Value, 2022-2032 (USD Mn, AGR (%),CAGR(%))
Table 77 Mexico Microelectronics Semiconductor Packaging (MIPAC) Market by Value, 2022-2032 (USD Mn, AGR (%),CAGR(%))
Table 78 Rest of South America Microelectronics Semiconductor Packaging (MIPAC) Market by Value, 2022-2032 (USD Mn, AGR (%), CAGR(%))
Table 79 Middle East & Africa Microelectronics Semiconductor Packaging (MIPAC) Market by Country, 2022-2032 (USD Mn, AGR (%),CAGR(%))
Table 80 Middle East & Africa Microelectronics Semiconductor Packaging (MIPAC) Market by Material, 2022-2032 (USD Mn, AGR (%),CAGR(%))
Table 81 Middle East & Africa Microelectronics Semiconductor Packaging (MIPAC) Market by Type, 2022-2032 (USD Mn, AGR (%),CAGR(%))
Table 82 Middle East & Africa Microelectronics Semiconductor Packaging (MIPAC) Market by End-User, 2022-2032 (USD Mn, AGR (%),CAGR(%))
Table 83 Middle East & Africa Microelectronics Semiconductor Packaging (MIPAC) Market by Technology, 2022-2032 (USD Mn, AGR (%),CAGR(%))
Table 84 Saudi Arabia Microelectronics Semiconductor Packaging (MIPAC) Market by Value, 2022-2032 (USD Mn, AGR (%),CAGR(%))
Table 85 Turkey Microelectronics Semiconductor Packaging (MIPAC) Market by Value, 2022-2032 (USD Mn, AGR (%),CAGR(%))
Table 86 South Africa Microelectronics Semiconductor Packaging (MIPAC) Market by Value, 2022-2032 (USD Mn, AGR (%), CAGR(%))
Table 87 Rest of Middle East & Africa Microelectronics Semiconductor Packaging (MIPAC) Market by Value, 2022-2032 (USD Mn, AGR (%), CAGR(%))
Table 88 ASE Group: Key Details, (CEO, HQ, Revenue, Founded, No. of Employees, Company Type, Website, Business Segment)
Table 89 ASE Group: Product Benchmarking
Table 90 ASE Group: Strategic Outlook
Table 91 Amkor Technology: Key Details, (CEO, HQ, Revenue, Founded, No. of Employees, Company Type, Website, Business Segment)
Table 92 Amkor Technology: Product Benchmarking
Table 93 Amkor Technology: Strategic Outlook
Table 94 Jcet/Stats Chippac Ltd: Key Details, (CEO, HQ, Revenue, Founded, No. of Employees, Company Type, Website, Business Segment)
Table 95 Jcet/Stats Chippac Ltd: Product Benchmarking
Table 96 Jcet/Stats Chippac Ltd: Strategic Outlook
Table 97 Siliconware Precision Industries Co. Ltd (Spil): Key Details, (CEO, HQ, Revenue, Founded, No. of Employees, Company Type, Website, Business Segment)
Table 98 Siliconware Precision Industries Co. Ltd (Spil): Product Benchmarking
Table 99 Powertech Technology, Inc.: Key Details, (CEO, HQ, Revenue, Founded, No. of Employees, Company Type, Website, Business Segment)
Table 100 Tianshui Huatian Technology Co. Ltd: Key Details, (CEO, HQ, Revenue, Founded, No. of Employees, Company Type, Website, Business Segment)
Table 101 Tianshui Huatian Technology Co. Ltd: Strategic Outlook
Table 102 Fujitsu Ltd: Key Details, (CEO, HQ, Revenue, Founded, No. of Employees, Company Type, Website, Business Segment)
Table 103 Fujitsu Ltd: Product Benchmarking
Table 104 Fujitsu Ltd: Strategic Outlook
Table 105 UTAC Group: Key Details, (CEO, HQ, Revenue, Founded, No. of Employees, Company Type, Website, Business Segment)
Table 106 UTAC Group: Product Benchmarking
Table 107 UTAC Group: Strategic Outlook
Table 108 Chipmos Technologies, Inc.: Key Details, (CEO, HQ, Revenue, Founded, No. of Employees, Company Type, Website, Business Segment)
Table 109 Chipmos Technologies, Inc: Product Benchmarking
Table 110 Chipbond Technology Corporation: Key Details, (CEO, HQ, Revenue, Founded, No. of Employees, Company Type, Website, Business Segment)
Table 111 Chipbond Technology Corporation: Strategic Outlook
Table 112 Intel Corporation: Key Details, (CEO, HQ, Revenue, Founded, No. of Employees, Company Type, Website, Business Segment)
Table 113 Intel Corporation: Product Benchmarking
Table 114 Intel Corporation: Strategic Outlook
Table 115 Samsung Electronics Co. Ltd: Key Details, (CEO, HQ, Revenue, Founded, No. of Employees, Company Type, Website, Business Segment)
Table 116 Samsung Electronics Co. Ltd: Product Benchmarking
Table 117 Samsung Electronics Co. Ltd: Strategic Outlook
Table 118 Unisem (M) Berhad: Key Details, (CEO, HQ, Revenue, Founded, No. of Employees, Company Type, Website, Business Segment)
Table 119 Unisem (M) Berhad: Product Benchmarking
Table 120 Interconnect Systems, Inc. (ISI): Key Details, (CEO, HQ, Revenue, Founded, No. of Employees, Company Type, Website, Business Segment)
Table 121 Interconnect Systems, Inc. (ISI): Product Benchmarking
Table 122 Murata Electronics: Key Details, (CEO, HQ, Revenue, Founded, No. of Employees, Company Type, Website, Business Segment)
Table 123 Murata Electronics: Strategic Outlook
List of Figures
Figure 1 Global Microelectronics Semiconductor Packaging (MIPAC) Market Segmentation
Figure 2 Breakdown of Primary Interviews: By Company Type, Designation, & Region
Figure 3 Global Microelectronics Semiconductor Packaging (MIPAC) Market Forecast by Region: Market Attractiveness Index
Figure 4 Global Microelectronics Semiconductor Packaging (MIPAC) Market by Materials: Market Attractiveness Index
Figure 5 Global Microelectronics Semiconductor Packaging (MIPAC) Market by Type: Market Attractiveness Index
Figure 6 Global Microelectronics Semiconductor Packaging (MIPAC) Market by End-users: Market Attractiveness Index
Figure 7 Global Microelectronics Semiconductor Packaging (MIPAC) Market by Technology: Market Attractiveness Index
Figure 8 North America Microelectronics Semiconductor Packaging (MIPAC) Market by Technology: Market Attractiveness Index
Figure 9 Europe Microelectronics Semiconductor Packaging (MIPAC) Market by Technology: Market Attractiveness Index
Figure 10 Asia PacificMicroelectronics Semiconductor Packaging (MIPAC) Market by Technology: Market Attractiveness Index
Figure 11 Middle East and Africa Microelectronics Semiconductor Packaging (MIPAC) Market by Technology: Market Attractiveness Index
Figure 12 South America Microelectronics Semiconductor Packaging (MIPAC) Market by Technology: Market Attractiveness Index
Figure 13 Global Microelectronics Semiconductor Packaging (MIPAC) Market: Market Dynamics
Figure 14 Global COVID Impact Analysis: Microelectronics Semiconductor Packaging (MIPAC) Market Recovery Scenarios
Figure 15 Global Microelectronics Semiconductor Packaging (MIPAC) Market by Region, 2022-2032 (USD Mn, AGR (%), CAGR (%)): “V” Shaped Recovery
Figure 16 Global Microelectronics Semiconductor Packaging (MIPAC) Market by Region, 2022-2032 (USD Mn, AGR (%), CAGR (%)): “U” Shaped Recovery
Figure 17 Global Microelectronics Semiconductor Packaging (MIPAC) Market by Region, 2022-2032 (USD Mn, AGR (%), CAGR (%)): “W” Shaped Recovery
Figure 18 Global Microelectronics Semiconductor Packaging (MIPAC) Market by Region, 2022-2032 (USD Mn, AGR (%), CAGR (%)): “L” Shaped Recovery
Figure 19 Global Microelectronics Semiconductor Packaging (MIPAC) Market: Porter’s Five Forces Analysis
Figure 20 Global Microelectronics Semiconductor Packaging (MIPAC) Market: PESTLE Analysis
Figure 21 Global Microelectronics Semiconductor Packaging (MIPAC) Market Forecast by Materials 2022, 2027, 2032 (Revenue, CAGR%)
Figure 22 Global Microelectronics Semiconductor Packaging (MIPAC) Market Share Forecast by Materials, 2022, 2032 (%)
Figure 23 Global Simple Semiconductor Material Market Forecast, 2022-2032 (USD Mn, AGR (%))
Figure 24 Global Simple Semiconductor Material Market by Region, 2022-2032 (USD Mn, AGR (%))
Figure 25 Global Compound Semiconductor Material Market Forecast, 2022-2032 (USD Mn, AGR (%))
Figure 26 Global Compound Semiconductor Material Market by Region, 2022-2032 (USD Mn, AGR (%))
Figure 27 Global Microelectronics Semiconductor Packaging (MIPAC) Market Forecast by Therapeutics 2022, 2027, 2032 (Revenue, CAGR%)
Figure 28 Global Microelectronics Semiconductor Packaging (MIPAC) Market Share Forecast by Therapeutics, 2022, 2032 (%)
Figure 29 Global Flip Chip Market Forecast, 2022-2032 (USD Mn, AGR (%))
Figure 30 Global Flip Chip Market by Region, 2022-2032 (USD Mn, AGR (%))
Figure 31 Global Embedded DIE Market Forecast, 2022-2032 (USD Mn, AGR (%))
Figure 32 Global Embedded DIE Market by Region, 2022-2032 (USD Mn, AGR (%))
Figure 33 Global Fan-in WLP Market Forecast, 2022-2032 (USD Mn, AGR (%))
Figure 34 Global Fan-out WLP Market Forecast, 2022-2032 (USD Mn, AGR (%))
Figure 35 Global Fan-out WLP Market by Region, 2022-2032 (USD Mn, AGR (%))
Figure 36 Global Microelectronics Semiconductor Packaging (MIPAC) Market by Type, 2022-2032 (USD Mn, AGR (%))
Figure 37 Global Microelectronics Semiconductor Packaging (MIPAC) Market Forecast by Therapeutics 2022, 2027, 2032 (Revenue, CAGR%)
Figure 38 Global Microelectronics Semiconductor Packaging (MIPAC) Market Share Forecast by Therapeutics, 2022, 2032 (%)
Figure 39 Global Grid Array Market Forecast, 2022-2032 (USD Mn, AGR (%))
Figure 40 Global Grid Array Market by Region, 2022-2032 (USD Mn, AGR (%))
Figure 41 Global Quad-flat no-leads (QFN) Market Forecast, 2022-2032 (USD Mn, AGR (%)
Figure 42 Global Quad-flat no-leads (QFN) Market by Region, 2022-2032 (USD Mn, AGR (%))
Figure 43 Global Dual-flat no-leads (DFN) Market Forecast, 2022-2032 (USD Mn, AGR (%))
Figure 44 Global Dual-flat no-leads (DFN) Market by Region, 2022-2032 (USD Mn, AGR (%))
Figure 45 Global Plastic Dual Inline Package (PDIP) Market Forecast, 2022-2032 (USD Mn, AGR (%))
Figure 46 Global Plastic Dual Inline Package (PDIP) Market by Region, 2022-2032 (USD Mn, AGR (%))
Figure 47 Global Small Outline Package Market Forecast, 2022-2032 (USD Mn, AGR (%))
Figure 48 Global Small Outline Package Market by Region, 2022-2032 (USD Mn, AGR (%))
Figure 49 Global Ceramic Dual Inline Package (CDIP) Market Forecast, 2022-2032 (USD Mn, AGR (%))
Figure 50 Global Ceramic Dual Inline Package (CDIP) Market by Region, 2022-2032 (USD Mn, AGR (%))
Figure 51 Global Microelectronics Semiconductor Packaging (MIPAC) Market by Technology, 2022-2032 (USD Mn, AGR (%))
Figure 52 Global Microelectronics Semiconductor Packaging (MIPAC) Market Forecast by Therapeutics 2022, 2027, 2032 (Revenue, CAGR%)
Figure 53 Global Microelectronics Semiconductor Packaging (MIPAC) Market Share Forecast by End User, 2022, 2032 (%)
Figure 54 Global Automotive Market Forecast, 2022-2032 (USD Mn, AGR (%))
Figure 55 Global Automotive Market by Region, 2022-2032 (USD Mn, AGR (%))
Figure 56 Global Consumer Electronics Market Forecast, 2022-2032 (USD Mn, AGR (%))
Figure 57 Global Consumer Electronics Market by Region, 2022-2032 (USD Mn, AGR (%))
Figure 58 Global Industrial Market Forecast, 2022-2032 (USD Mn, AGR (%))
Figure 59 Global Industrial Market by Region, 2022-2032 (USD Mn, AGR (%))
Figure 60 Global IT & Telecommunications Market Forecast, 2022-2032 (USD Mn, AGR (%))
Figure 61 Global IT & Telecommunications Market by Region, 2022-2032 (USD Mn, AGR (%))
Figure 62 Global Microelectronics Semiconductor Packaging (MIPAC) Market by End-User, 2022-2032 (USD Mn, AGR (%))
Figure 63 Global Microelectronics Semiconductor Packaging (MIPAC) Market by Region, 2022-2032 (USD Mn, AGR (%))
Figure 64 Global Microelectronics Semiconductor Packaging (MIPAC) Market Share Forecast by Region 2022, 2027, 2032(%)
Figure 65 Global Microelectronics Semiconductor Packaging (MIPAC) Market by Region, 2022-2032 (USD Mn, AGR (%))
Figure 66 North America Microelectronics Semiconductor Packaging (MIPAC) Market Attractiveness Index
Figure 67 North America Microelectronics Semiconductor Packaging (MIPAC) Market by Country, 2022-2032 (USD Mn, AGR (%))
Figure 68 North America Microelectronics Semiconductor Packaging (MIPAC) Market Share Forecast by Country, 2022 & 2032 (%)
Figure 69 North America Microelectronics Semiconductor Packaging (MIPAC) Market by Material, 2022-2032 (USD Mn, AGR (%))
Figure 70 North America Microelectronics Semiconductor Packaging (MIPAC) Market Share Forecast by Materials, 2022 & 2032 (%)
Figure 71 North America Microelectronics Semiconductor Packaging (MIPAC) Market by Type, 2022-2032 (USD Mn, AGR (%))
Figure 72 North America Microelectronics Semiconductor Packaging (MIPAC) Market Share Forecast by Type, 2022 & 2032 (%)
Figure 73 North America Microelectronics Semiconductor Packaging (MIPAC) Market by End-User, 2022-2032 (USD Mn, AGR (%))
Figure 74 North America Microelectronics Semiconductor Packaging (MIPAC) Market Share Forecast by End-users, 2022 & 2032 (%)
Figure 75 North America Microelectronics Semiconductor Packaging (MIPAC) Market by Technology, 2022-2032 (USD Mn, AGR (%))
Figure 76 North America Microelectronics Semiconductor Packaging (MIPAC) Market Share Forecast by Technology, 2022 & 2032 (%)
Figure 77 US Microelectronics Semiconductor Packaging (MIPAC) Market by Value, 2022-2032 (USD Mn, AGR (%))
Figure 78 Canada Microelectronics Semiconductor Packaging (MIPAC) Market by Value, 2022-2032 (USD Mn, AGR (%))
Figure 79 Europe Microelectronics Semiconductor Packaging (MIPAC) Market Attractiveness Index
Figure 80 Europe Microelectronics Semiconductor Packaging (MIPAC) Market by Country, 2022-2032 (USD Mn, AGR (%))
Figure 81 Europe Microelectronics Semiconductor Packaging (MIPAC) Market Share Forecast by Country, 2022 & 2032 (%)
Figure 82 Europe Microelectronics Semiconductor Packaging (MIPAC) Market by Material, 2022-2032 (USD Mn, AGR (%))
Figure 83 Europe Microelectronics Semiconductor Packaging (MIPAC) Market Share Forecast by Materials, 2022 & 2032 (%)
Figure 84 Europe Microelectronics Semiconductor Packaging (MIPAC) Market by Type, 2022-2032 (USD Mn, AGR (%))
Figure 85 Europe Microelectronics Semiconductor Packaging (MIPAC) Market Share Forecast by Technology, 2022 & 2032 (%)
Figure 86 Europe Microelectronics Semiconductor Packaging (MIPAC) Market by End-User, 2022-2032 (USD Mn, AGR (%))
Figure 87 Europe Microelectronics Semiconductor Packaging (MIPAC) Market Share Forecast by End-users, 2022 & 2032 (%)
Figure 88 Europe Microelectronics Semiconductor Packaging (MIPAC) Market by Technology, 2022-2032 (USD Mn, AGR (%))
Figure 89 Europe Microelectronics Semiconductor Packaging (MIPAC) Market Share Forecast by End-users, 2022 & 2032 (%)
Figure 90 Germany Microelectronics Semiconductor Packaging (MIPAC) Market by Value, 2022-2032 (USD Mn, AGR (%))
Figure 91 France Microelectronics Semiconductor Packaging (MIPAC) Market by Value, 2022-2032 (USD Mn, AGR (%))
Figure 92 UK Microelectronics Semiconductor Packaging (MIPAC) Market by Value, 2022-2032 (USD Mn, AGR (%))
Figure 93 Italy Microelectronics Semiconductor Packaging (MIPAC) Market by Value, 2022-2032 (USD Mn, AGR (%))
Figure 94 Spain Microelectronics Semiconductor Packaging (MIPAC) Market by Value, 2022-2032 (USD Mn, AGR (%))
Figure 95 Asia-Pacific Microelectronics Semiconductor Packaging (MIPAC) Market Attractiveness Index
Figure 96 Asia-Pacific Microelectronics Semiconductor Packaging (MIPAC) Market by Country, 2022-2032 (USD Mn, AGR (%))
Figure 97 Asia-Pacific Microelectronics Semiconductor Packaging (MIPAC) Market by Country, 2022-2032 (USD Mn, AGR (%))
Figure 98 Asia-Pacific Microelectronics Semiconductor Packaging (MIPAC) Market by Material, 2022-2032 (USD Mn, AGR (%))
Figure 99 Asia-Pacific Microelectronics Semiconductor Packaging (MIPAC) Market Share Forecast by Materials 2022 & 2032 (%)
Figure 100 Asia-Pacific Microelectronics Semiconductor Packaging (MIPAC) Market by Type, 2022-2032 (USD Mn, AGR (%))
Figure 101 Asia-Pacific Microelectronics Semiconductor Packaging (MIPAC) Market Share Forecast by Type, 2022 & 2032 (%)
Figure 102 Asia-Pacific Microelectronics Semiconductor Packaging (MIPAC) Market by End-User, 2022-2032 (USD Mn, AGR (%))
Figure 103 Asia-Pacific Microelectronics Semiconductor Packaging (MIPAC) Market Share Forecast by End-users, 2022 & 2032 (%)
Figure 104 Asia-Pacific Microelectronics Semiconductor Packaging (MIPAC) Market by Technology, 2022-2032 (USD Mn, AGR (%))
Figure 105 Asia-Pacific Microelectronics Semiconductor Packaging (MIPAC) Market Share Forecast by Technology, 2022 & 2032 (%)
Figure 106 China Microelectronics Semiconductor Packaging (MIPAC) Market by Value, 2022-2032 (USD Mn, AGR (%))
Figure 107 Taiwan Microelectronics Semiconductor Packaging (MIPAC) Market by Value, 2022-2032 (USD Mn, AGR (%))
Figure 108 Japan Microelectronics Semiconductor Packaging (MIPAC) Market by Value, 2022-2032 (USD Mn, AGR (%))
Figure 109 South Korea Microelectronics Semiconductor Packaging (MIPAC) Market by Value, 2022-2032 (USD Mn, AGR (%))
Figure 110 Singapore Microelectronics Semiconductor Packaging (MIPAC) Market by Value, 2022-2032 (USD Mn, AGR (%))
Figure 111 South America Microelectronics Semiconductor Packaging (MIPAC) Market Attractiveness Index
Figure 112 South America Microelectronics Semiconductor Packaging (MIPAC) Market by Country, 2022-2032 (USD Mn, AGR (%))
Figure 113 South America Microelectronics Semiconductor Packaging (MIPAC) Market Share Forecast by Country, 2022 & 2032 (%)
Figure 114 South America Microelectronics Semiconductor Packaging (MIPAC) Market by Material, 2022-2032 (USD Mn, AGR (%))
Figure 115 South America Microelectronics Semiconductor Packaging (MIPAC) Market Share Forecast by Therapeutics, 2022 & 2032 (%)
Figure 116 South America Microelectronics Semiconductor Packaging (MIPAC) Market by Type, 2022-2032 (USD Mn, AGR (%))
Figure 117 South America Microelectronics Semiconductor Packaging (MIPAC) Market Share Forecast by Technology, 2022 & 2032 (%)
Figure 118 South America Microelectronics Semiconductor Packaging (MIPAC) Market by End-User, 2022-2032 (USD Mn, AGR (%))
Figure 119 South America Microelectronics Semiconductor Packaging (MIPAC) Market Share Forecast by End-users, 2022 & 2032 (%)
Figure 120 Brazil Microelectronics Semiconductor Packaging (MIPAC) Market by Value, 2022-2032 (USD Mn, AGR (%))
Figure 121 Mexico Microelectronics Semiconductor Packaging (MIPAC) Market by Value, 2022-2032 (USD Mn, AGR (%))Figure 112
Figure 122 Middle East & Africa Microelectronics Semiconductor Packaging (MIPAC) Market Attractiveness Index
Figure 123 Middle East & Africa Microelectronics Semiconductor Packaging (MIPAC) Market Attractiveness Index
Figure 124 Middle East & Africa Microelectronics Semiconductor Packaging (MIPAC) Market by Country, 2022-2032 (USD Mn, AGR (%))
Figure 125 Middle East & Africa Microelectronics Semiconductor Packaging (MIPAC) Market Share Forecast by Country, 2022 & 2032 (%)
Figure 126 Middle East & Africa Microelectronics Semiconductor Packaging (MIPAC) Market by Material, 2022-2032 (USD Mn, AGR (%))
Figure 127 Middle East & Africa Microelectronics Semiconductor Packaging (MIPAC) Market Share Forecast by Therapeutics, 2022 & 2032 (%)
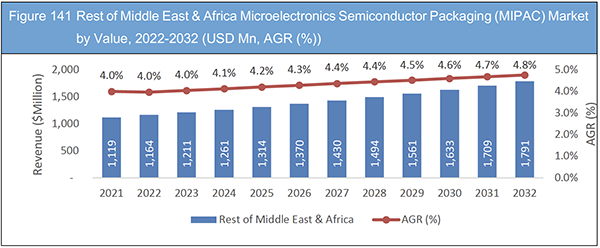
Figure 128 Middle East & Africa Microelectronics Semiconductor Packaging (MIPAC) Market Forecast by Technology, 2022-2032 (US$ million, AGR %)
Figure 129 Middle East & Africa Microelectronics Semiconductor Packaging (MIPAC) Market Share Forecast by Technology, 2022 & 2032 (%)
Figure 130 Middle East & Africa Microelectronics Semiconductor Packaging (MIPAC) Market by End-User, 2022-2032 (USD Mn, AGR (%))
Figure 131 Middle East & Africa Microelectronics Semiconductor Packaging (MIPAC) Market Share Forecast by End-users, 2022 & 2032 (%)
Figure 132 Saudi Arabia Microelectronics Semiconductor Packaging (MIPAC) Market by Value, 2022-2032 (USD Mn, AGR (%))
Figure 133 Turkey Microelectronics Semiconductor Packaging (MIPAC) Market by Value, 2022-2032 (USD Mn, AGR (%))
Figure 134 South Africa Microelectronics Semiconductor Packaging (MIPAC) Market by Value, 2022-2032 (USD Mn, AGR (%))
Figure 135 ASE Group: Net Revenue, 2017-2021 (US$million, AGR%)
Figure 136 ASE Group: Gross Profit, 2017-2021 (US$million, AGR%)
Figure 137 ASE Group: Net Profit 2017-2021 (US$million, AGR%)
Figure 138 ASE Group: EBITDA, 2017-2021 (US$million, AGR%)
Figure 139 Amkor Technology: Net Revenue, 2017-2021 (US$million, AGR%)
Figure 140 Amkor Technology: Gross Profit, 2017-2021 (US$million, AGR%)
Figure 141 Amkor Technology: Net Profit 2017-2021 (US$million, AGR%)
Figure 142 Fujitsu Ltd: Net Revenue, 2017-2021 (US$million, AGR%)
Figure 143 Fujitsu Ltd: Gross Profit, 2017-2021 (US$million, AGR%)
Figure 144 Fujitsu Ltd: Net Profit 2017-2021 (US$million, AGR%)
Figure 145 Chipmos Technologies, Inc.: Net Revenue, 2017-2021 (US$million, AGR%)
Figure 146 Chipmos Technologies, Inc.: Gross Profit, 2017-2021 (US$million, AGR%)
Figure 147 Intel Corporation: Net Revenue, 2017-2021 (US$million, AGR%)
Figure 148 Intel Corporation: Gross Profit, 2017-2021 (US$million, AGR%)
List of Companies Profiled in the report
Amkor Technology, Inc.
ASE Group
Chipbond Technology Corporation
Chipmos Technologies, Inc.
Fujitsu Ltd
Intel Corporation
Interconnect Systems, Inc. (ISI)
Jcet/Stats Chippac Ltd
Murata Electronics
Powertech Technology, Inc.
Samsung Electronics Co. Ltd
Siliconware Precision Industries Co. Ltd (Spil)
Tianshui Huatian Technology Co. Ltd
Unisem (M) Berhad
UTAC Group
List of Other Companies Mentioned in the report
A and D Precision Inc.
A2e Technologies
Amarula Electronics
AMS-JRC
Argus Systems
Arira Design
Ascenten
Asha Electronics Pvt. Ltd.
Axiom Manufacturing Services
Benchmark Electronics, Inc.
Beyonics Technology
Celestica, Inc.
Circuitsify
Compal Electronics, Inc.
Creating Technologies LP
Dexigner
East India Technologies Pvt. Ltd
Einfochips
Elcoteq
Fabrinet
Flex Ltd
Flextronics International, Ltd
Haughton Design
Hon Hai Precision Industry Co., Ltd
Inditronics
Jabil Circuit, Inc.
Kemsys
Mack Technologies
NEO Tech Inc.
New Kinpo Group
Opitmatech
Pivot International
Plexus Corporation
Pramura
Rayming
Rioshtech
Sanmina Corporation
Shenzhen Kaifa Technology
SIIX
Sparqtron Corporation
Streamline Electronics Manufacturing, Inc.
Syrma Technology
Texas Instruments
Tri-Star Design, Inc.
Universal Scientific Industrial Co Ltd.
Venture Corporation Limited
Vexos
VSE.COM
Wipro
Zollner Elektronik
List of Associations Mentioned in the Report
American Design Drafting Association
Association of Electrical and Mechanical Trades (AEMT)
Consumer Electronics Association (CEA)
Contract Packaging Association
Custom Electronic Design & Installation Association
Electrical Contractors' Association
Electronic Components Industry Association (ECIA)
Electronic Industries Association of India
Electronic Product Development Center (EPDC)
Electronic System Design & Manufacturing (ESDM)
Electronic System Design Alliance (ESD Alliance)
India Cellular and Electronics Association (ICEA)
India Electronics and Semiconductor Association (IESA)
Indian Electrical & Electronics Manufacturers' Association (IEEMA)
Institute of Design for Electrical Measuring Instruments
National Electrical Manufacturers Association
National Institute of Electronics and Information
Oregon Electronics Manufacturers Association
Software & Information Industry Association (SIIA)
Taiwan Electrical and Electronic Manufacturers' Association
 Market Report 2022-2032")