The Smart Sensors Market Report 2023-2033: This report will prove invaluable to leading firms striving for new revenue pockets if they wish to better understand the industry and its underlying dynamics. It will be useful for companies that would like to expand into different industries or to expand their existing operations in a new region.
Sensors Are an Essential Component of the Internet of Things Perception Layer
A sensor is a device that can respond to a stimulus and generate an electrical signal in response. Traditional sensors generate output signals that must be further interpreted to determine what the sensors are registering. A smart sensor is a system that combines a sensing element, a signal processor, and a microprocessor. Traditional sensors are part of an open feedback system, in which the sensor performs the predetermined action regardless of the current system. Smart sensors, on the other hand, are a component of a closed feedback system in which the sensor only performs the required action in relation to the current system. Sensors are an essential component of the Internet of Things’ perception layer, as well as the foundation and premise for its realisation. Sensors, the front-end device that is the main source of data, have shown rapid development with the construction of smart cities, the rapid development of big data, and the increasingly widespread application of the Internet of Things. The sensor network is another name for the IoT (Internet of Things).
What Questions Should You Ask before Buying a Market Research Report?
• How is the smart sensors market evolving?
• What is driving and restraining the smart sensors market?
• How will each smart sensors submarket segment grow over the forecast period and how much revenue will these submarkets account for in 2033?
• How will the market shares for each smart sensors submarket develop from 2023 to 2033?
• What will be the main driver for the overall market from 2023 to 2033?
• Will leading smart sensors markets broadly follow the macroeconomic dynamics, or will individual national markets outperform others?
• How will the market shares of the national markets change by 2033 and which geographical region will lead the market in 2033?
• Who are the leading players and what are their prospects over the forecast period?
• What are the smart sensors projects for these leading companies?
• How will the industry evolve during the period between 2023 and 2033? What are the implications of smart sensors projects taking place now and over the next 10 years?
• Is there a greater need for product commercialisation to further scale the smart sensors market?
• Where is the smart sensors market heading and how can you ensure you are at the forefront of the market?
• What are the best investment options for new product and service lines?
• What are the key prospects for moving companies into a new growth path and C-suite?
You need to discover how this will impact the smart sensors market today, and over the next 10 years:
• Our 361-page report provides 137 tables and 191 charts/graphs exclusively to you.
• The report highlights key lucrative areas in the industry so you can target them – NOW.
• It contains in-depth analysis of global, regional and national sales and growth.
• It highlights for you the key successful trends, changes and revenue projections made by your competitors.
This report tells you TODAY how the smart sensors market will develop in the next 10 years, and in line with the variations in COVID-19 economic recession and bounce. This market is more critical now than at any point over the last 10 years.
Forecasts to 2033 and other analyses reveal commercial prospects
• In addition to revenue forecasting to 2033, our new study provides you with recent results, growth rates, and market shares.
• You will find original analyses, with business outlooks and developments.
• Discover qualitative analyses (including market dynamics, drivers, opportunities, restraints and challenges), cost structure, impact of rising smart sensors prices and recent developments.
This report includes data analysis and invaluable insight into how COVID-19 will affect the industry and your company. Four COVID-19 recovery patterns and their impact, namely, “V”, “L”, “W” and “U” are discussed in this report.
Segments Covered in the Report
Market Segment by Sensor Type
• Temperature & Humidity Sensors
• Touch Sensors
• Pressure & Flow Sensors
• Motion & Occupancy Sensors
• Water Sensors
• Position Sensors
• Light Sensors
• Ultrasonic Sensors
• Oxidation-Reduction Potential (ORP) Sensors
• Other Sensors
Market Segment by Technology
• Micro Electro-Mechanical System (MEMS)
• Complementary Metal Oxide Semiconductor (CMOS)
• Microsystem Technology (MST)
• Other Technology
Market Segment by Component
• Analog-to-Digital Converters (ADC)
• Digital-to-Analog Converters (DAC)
• Transceivers & Amplifiers
• Microcontrollers
• Other Components
Market Segment by End-User Industry
• Consumer Electronics
• Industrial Automation
• Biomedical & Healthcare
• Automotive
• Aerospace & Defense
• Other End-User Industry

In addition to the revenue predictions for the overall world market and segments, you will also find revenue forecasts for four regional and 20 leading national markets:
North America
• U.S.
• Canada
Europe
• Germany
• Spain
• United Kingdom
• France
• Italy
• Rest of Europe
Asia Pacific
• China
• Japan
• India
• Australia
• South Korea
• Rest of Asia Pacific
Middle East & Africa
• GCC
• South Africa
• Rest of Middle East & Africa
Latin America
• Brazil
• Mexico
• Rest of Latin America
Need industry data? Please contact us today.
The report also includes profiles and for some of the leading companies in the Smart Sensors Market, 2023 to 2033, with a focus on this segment of these companies’ operations.
Leading companies and the potential for market growth
• ABB (ABB Ltd.)
• Analog Devices, Inc.
• Eaton Corporation plc
• Infineon Technologies AG
• Microchip Technology Inc.
• NXP Semiconductors N.V. (NXP)
• Robert Bosch GmbH
• Siemens AG
• STMicroelectronics N.V.
• TE Connectivity
Overall world revenue for Smart Sensors Market, 2023 to 2033 in terms of value the market will surpass US$442.90 billion in 2023, our work calculates. We predict strong revenue growth through to 2033. Our work identifies which organizations hold the greatest potential. Discover their capabilities, progress, and commercial prospects, helping you stay ahead.
How will the Smart Sensors Market, 2023 to 2033 report help you?
In summary, our 360+ page report provides you with the following knowledge:
• Revenue forecasts to 2033 for Smart Sensors Market, 2023 to 2033 Market, with forecasts for component, end-use industry, sensor type, technology and company size, each forecast at a global and regional level – discover the industry’s prospects, finding the most lucrative places for investments and revenues.
• Revenue forecasts to 2033 for four regional and 20 key national markets – See forecasts for the Smart Sensors Market, 2023 to 2033 market in North America, Europe, Asia-Pacific, Latin America and Middle East & Africa. Also forecasted is the market in the US, Canada, Mexico, Brazil, Germany, France, UK, Italy, China, India, Japan, and Australia among other prominent economies.
• Prospects for established firms and those seeking to enter the market – including company profiles for 10 of the major companies involved in the Smart Sensors Market, 2023 to 2033.
Find quantitative and qualitative analyses with independent predictions. Receive information that only our report contains, staying informed with invaluable business intelligence.
Information found nowhere else
With our new report, you are less likely to fall behind in knowledge or miss out on opportunities. See how our work could benefit your research, analyses, and decisions. Visiongain’s study is for everybody needing commercial analyses for the Smart Sensors Market, 2023 to 2033, market-leading companies. You will find data, trends and predictions.
To access the data contained in this document please email contactus@visiongain.com
Buy our report today Smart Sensors Market Report 2023-2033: Forecasts by Sensor Type (Temperature & Humidity Sensors, Touch Sensors, Pressure & Flow Sensors, Motion & Occupancy Sensors, Water Sensors, Position Sensors, Light Sensors, Ultrasonic Sensors, Oxidation-Reduction Potential (ORP) Sensors, Other), by Technology (Micro Electro-Mechanical System (MEMS), Complementary Metal Oxide Semiconductor (CMOS), Microsystem Technology (MST), Other), by Component (Analog-to-Digital Converters (ADC), Digital-to-Analog Converters (DAC), Transceivers & Amplifiers, Microcontrollers, Other), by End-user Industry (Consumer Electronics, Industrial Automation, Biomedical & Healthcare, Automotive, Aerospace & Defence, Other) AND Regional and Leading National Market Analysis PLUS Analysis of Leading Companies AND COVID-19 Impact and Recovery Pattern Analysis. Avoid missing out by staying informed – order our report now.
Visiongain is a trading partner with the US Federal Government
CCR Ref number: KD4R6
Do you have any custom requirements we can help you with? Any need for a specific country, geo region, market segment or specific company information? Contact us today, we can discuss your needs and see how we can help: contactus@visiongain.com
1. Report Overview
1.1 Objectives of the Study
1.2 Introduction to Smart Sensors Market
1.3 What This Report Delivers
1.4 Why You Should Read This Report
1.5 Key Questions Answered by this Analytical Report Include:
1.6 Who is This Report For?
1.7 Research Methodology
1.7.1 Market Definitions
1.7.2 Market Evaluation & Forecasting Methodology
1.7.3 Data Validation
1.8 Frequently Asked Questions (FAQs)
1.9 Associated Visiongain Reports
1.10 About Visiongain
2 Executive Summary
3 Premium Insights
3.1 Global Smart Sensors Market by Region
3.2 Sensor Type Segment: Market Attractiveness Index
3.3 Technology Segment: Market Attractiveness Index
3.4 Component Segment: Market Attractiveness Index
3.5 End-users Segment: Market Attractiveness Index
4 Market Overview
4.1 Key Findings
4.2 Market Dynamics
4.2.1 Market Driving Factors
4.2.2 Market Restraining Factors
4.2.3 Market Opportunities
4.3 Porter’s Five Forces Analysis
4.3.1 Bargaining Power of Buyers
4.3.2 Bargaining Power of Suppliers
4.3.3 Threat of New Entrants
4.3.4 Threat of Product Substitute
4.3.5 Competitive Rivalry
4.4 PESTLE Analysis
4.4.1 Political Factors
4.4.2 Economic Factors
4.4.3 Social Factors
4.4.4 Technology Factors
4.4.5 Environmental Factors
5 Global Smart Sensors Market Analysis by Sensor Type
5.1 Key Findings
5.2 Global Smart Sensors Market Attractiveness Index by Sensor Type
5.2.1 Global Smart Sensors Market Attractiveness Index by Type
5.2.2 Global Smart Sensors Market Size Estimation and Forecast by Type
5.3 Temperature & Humidity Sensors
5.3.1 Global Temperature & Humidity Sensors Persistent Market Size Estimation Forecast, 2023-2033 (US$ Bn)
Source: Visiongain Reports Ltd., 2023
5.3.2 Global Temperature & Humidity Sensors Market Size Estimation Forecast by Region, 2023-2033 (US$ Bn)
5.4 Touch Sensors
5.4.1 Global Touch Sensors Market Size Estimation Forecast, 2023-2033 (US$ Bn)
5.4.2 Global Touch Sensors Market Forecast by Region, 2023-2033 (US$ Bn)
5.5 Pressure & Flow Sensors
5.5.1 Global Pressure & Flow Sensors Market Size Estimation Forecast, 2023-2033 (US$ Bn)
5.5.2 Global Pressure & Flow Sensors Market Forecast by Region, 2023-2033 (US$ Bn)
5.6 Motion & Occupancy Sensors
5.6.1 Global Motion & Occupancy Sensors Market Size Estimation Forecast, 2023-2033 (US$ Bn)
5.6.2 Global Motion & Occupancy Sensors Market Forecast by Region, 2023-2033 (US$ Bn)
5.7 Water Sensors
5.7.1 Global Water Sensors Market Size Estimation Forecast, 2023-2033 (US$ Bn)
5.7.2 Global Water Sensors Market Forecast by Region, 2023-2033 (US$ Bn)
5.8 Position Sensors
5.8.1 Global Position Sensors Market Size Estimation Forecast, 2023-2033 (US$ Bn)
5.8.2 Global Position Sensors Market Forecast by Region, 2023-2033 (US$ Bn)
5.9 Light Sensors
5.9.1 Global Light Sensors Market Size Estimation Forecast, 2023-2033 (US$ Bn)
5.9.2 Global Light Sensors Market Forecast by Region, 2023-2033 (US$ Bn)
5.10 Ultrasonic Sensors
5.10.1 Global Ultrasonic Sensors Market Size Estimation Forecast, 2023-2033 (US$ Bn)
5.10.2 Global Ultrasonic Sensors Market Forecast by Region, 2023-2033 (US$ Bn)
5.11 Oxidation-Reduction Potential (ORP) Sensors
5.11.1 Global Oxidation-Reduction Potential (ORP) Sensors Market Size Estimation Forecast, 2023-2033 (US$ Bn)
5.11.2 Global Oxidation-Reduction Potential (ORP) Sensor Market Forecast by Region, 2023-2033 (US$ Bn)
5.12 Other Sensors
5.12.1 Global Other Sensors Market Size Estimation Forecast, 2023-2033 (US$ Bn)
5.12.2 Global Other Sensors Market Forecast by Region, 2023-2033 (US$ Bn)
6 Global Smart Sensors Market Analysis by Technology
6.1 Key Findings
6.2 Global Smart Sensors Market Attractiveness Index by Technology
6.2.1 Global Smart Sensors Market Attractiveness Index by Technology
6.2.2 Global Smart Sensors Market Size Estimation and Forecast by Technology
6.3 Micro Electro-Mechanical System (MEMS)
6.3.1 Global Micro Electro-Mechanical System (MEMS) Persistent Market Size Estimation Forecast, 2023-2033 (US$ Bn)
Source: Visiongain Reports Ltd., 2023
6.3.2 Global Micro Electro-Mechanical System (MEMS) Market Size Estimation Forecast by Region, 2023-2033 (US$ Bn)
6.4 Complementary Metal Oxide Semiconductor (CMOS)
6.4.1 Global Complementary Metal Oxide Semiconductor (CMOS)Market Size Estimation Forecast, 2023-2033 (US$ Bn)
6.4.2 Global Complementary Metal Oxide Semiconductor (CMOS) Market Forecast by Region, 2023-2033 (US$ Bn)
6.5 Microsystem Technology (MST)
6.5.1 Global Microsystem Technology (MST) Market Size Estimation Forecast, 2023-2033 (US$ Bn)
6.5.2 Global Microsystem Technology (MST) Market Forecast by Region, 2023-2033 (US$ Bn)
6.6 Other Technology
6.6.1 Global Other Technology Market Size Estimation Forecast, 2023-2033 (US$ Bn)
6.6.2 Global Other Technology Market Forecast by Region, 2023-2033 (US$ Bn)
7 Global Smart Sensors Market Analysis by Component
7.1 Key Findings
7.2 Global Smart Sensors Market Attractiveness Index by Component
7.2.1 Global Smart Sensors Market Attractiveness Index by Component
7.2.2 Global Smart Sensors Market Size Estimation and Forecast by Component
7.3 Analog-to-Digital Converters (ADC)
7.4 Global Analog-to-Digital Converters (ADC) Market Size Estimation Forecast, 2023-2033 (US$ Bn)
Source: Visiongain Reports Ltd., 2023
7.4.1 Global Analog-to-Digital Converters (ADC) Market Size Estimation Forecast by Region, 2023-2033 (US$ Bn)
7.5 Digital-to-Analog Converters (DAC)
7.5.1 Global Digital-to-Analog Converters (DAC) Market Size Estimation Forecast, 2023-2033 (US$ Bn)
7.5.2 Global Digital-to-Analog Converters (DAC) Market Forecast by Region, 2023-2033 (US$ Bn)
7.6 Transceivers & Amplifiers
7.6.1 Global Transceivers & Amplifiers Market Size Estimation Forecast, 2023-2033 (US$ Bn)
7.6.2 Global Transceivers & Amplifiers Market Forecast by Region, 2023-2033 (US$ Bn)
7.7 Microcontrollers
7.8 Global Microcontrollers Market Size Estimation Forecast, 2023-2033 (US$ Bn)
7.8.1 Global Microcontrollers Market Forecast by Region, 2023-2033 (US$ Bn)
7.9 Other Components
7.9.1 Global Other Components Market Size Estimation Forecast, 2023-2033 (US$ Bn)
7.9.2 Global Other Components Market Forecast by Region, 2023-2033 (US$ Bn)
8 Global Smart Sensors Market Analysis by End-User Industry
8.1 Key Findings
8.2 Global Smart Sensors Market Attractiveness Index by End-User Industry
8.2.1 Global Smart Sensors Market Attractiveness Index by End-User Industry
8.2.2 Global Smart Sensors Market Size Estimation and Forecast by End-User Industry
8.3 Consumer Electronics
8.4 Global Consumer Electronics Market Size Estimation Forecast, 2023-2033 (US$ Bn)
Source: Visiongain Reports Ltd., 2023
8.4.1 Global Consumer Electronics Market Size Estimation Forecast by Region, 2023-2033 (US$ Bn)
8.5 Industrial Automation
8.5.1 Global Industrial Automation Market Size Estimation Forecast, 2023-2033 (US$ Bn)
8.5.2 Global Industrial Automation Market Forecast by Region, 2023-2033 (US$ Bn)
8.6 Biomedical & Healthcare
8.6.1 Global Biomedical & Healthcare Market Size Estimation Forecast, 2023-2033 (US$ Bn)
8.6.2 Global Biomedical & Healthcare Market Forecast by Region, 2023-2033 (US$ Bn)
8.7 Automotive
8.8 Global Automotive Market Size Estimation Forecast, 2023-2033 (US$ Bn)
8.8.1 Global Automotive Market Forecast by Region, 2023-2033 (US$ Bn)
8.9 Aerospace & Defence
8.9.1 Global Aerospace & Defence Market Size Estimation Forecast, 2023-2033 (US$ Bn)
8.9.2 Global Aerospace & Defence Market Forecast by Region, 2023-2033 (US$ Bn)
8.10 Other End-User Industry
8.10.1 Global Other End-User Industry Market Size Estimation Forecast, 2023-2033 (US$ Bn)
8.10.2 Global Other End-User Industry Market Forecast by Region, 2023-2033 (US$ Bn)
9 Global Smart Sensors Market Analysis by Region
9.1 Key Findings
9.2 Regional Market Size Estimation and Forecast
9.3 COVID-19 Impact Analysis: Recovery Scenarios (V, U, W, L)
10 North America Smart Sensors Market Analysis
10.1 Key Findings
10.1.1 North America Smart Sensors Market Attractiveness Index
10.1.2 North America Smart Sensors Market Share by Region, 2023 & 2033
10.2 North America Smart Sensors Market Size Estimation and Forecast by Country
10.3 North America Smart Sensors Market Size Estimation and Forecast by Type
10.4 North America Smart Sensors Market Size Estimation and Forecast by Technology
10.5 North America Smart Sensors Market Size Estimation and Forecast by Component
10.6 North America Smart Sensors Market Size Estimation and Forecast by End-User Industry
10.7 U.S. Market Analysis
10.8 Canada Market Analysis
11 Europe Smart Sensors Market Analysis
11.1 Key Findings
11.1.1 Europe Smart Sensors Market Attractiveness Index
11.1.2 Europe Smart Sensors Market Share by Region, 2023 & 2033
11.2 Europe Smart Sensors Market Size Estimation and Forecast by Country
11.3 Europe Smart Sensors Market Size Estimation and Forecast by Type
11.4 Europe Smart Sensors Market Size Estimation and Forecast by Technology
11.5 Europe Smart Sensors Market Size Estimation and Forecast by Component
11.6 Europe Smart Sensors Market Size Estimation and Forecast by End-User Industry
11.7 Poland Market Analysis
11.8 Germany Market Analysis
11.9 Hungary Market Analysis
11.10 UK Market Analysis
11.11 Rest of Europe Market Analysis
12 Asia-Pacific Smart Sensors Market Analysis
12.1 Key Findings
12.1.1 Asia-Pacific Smart Sensors Market Attractiveness Index
12.1.2 Global Smart Sensors Market Share by Region, 2023 & 2033
12.2 Asia-Pacific Smart Sensors Market Size Estimation and Forecast by Country
12.3 Asia-Pacific Smart Sensors Market Size Estimation and Forecast by Type
12.4 Asia-Pacific Smart Sensors Market Size Estimation and Forecast by Technology
12.5 Asia-Pacific Smart Sensors Market Size Estimation and Forecast by Component
12.6 Asia-Pacific Smart Sensors Market Size Estimation and Forecast by End-User Industry
12.6 China Market Analysis
12.7 India Market Analysis
12.8 Japan Market Analysis
12.9 South Korea Market Analysis
12.10 Australia Market Analysis
12.11 Rest of Asia-Pacific Market Analysis
13 Middle East & Africa Smart Sensors Market Analysis
13.1 Key Findings
13.1.1 Middle East & Africa Smart Sensors Market Attractiveness Index
13.1.2 Middle East & Africa Smart Sensors Market Share by Country, 2023 & 2033
13.2 Middle East & Africa Smart Sensors Market Size Estimation and Forecast by Country
13.3 Middle East & Africa Smart Sensors Market Size Estimation and Forecast by Type
13.2 Middle East & Africa Smart Sensors Market Size Estimation and Forecast by Technology
13.3 Middle East & Africa Smart Sensors Market Size Estimation and Forecast by Component
13.4 Middle East & Africa Smart Sensors Market Size Estimation and Forecast by End-User Industry
13.5 GCC Market Analysis
13.6 South Africa Market Analysis
13.7 Rest of Middle East & Africa Market Analysis
14 Latin America Smart Sensors Market Analysis
14.1 Key Findings
14.1.1 Latin America Smart Sensors Market Attractiveness Index
14.1.2 Latin America Smart Sensors Market Share by Region, 2023 & 2033
14.2 Latin America Smart Sensors Market Size Estimation and Forecast by Country
14.3 Latin America Smart Sensors Market Size Estimation and Forecast by Type
14.4 Latin America Smart Sensors Market Size Estimation and Forecast by Technology
14.5 Latin America Smart Sensors Market Size Estimation and Forecast by Component
14.6 Latin America Smart Sensors Market Size Estimation and Forecast by End-User Industry
14.7 Brazil Market Analysis
14.8 Mexico Market Analysis
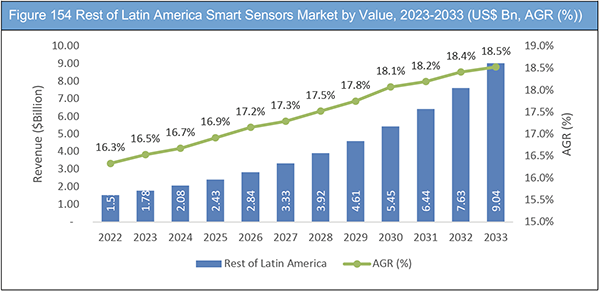
14.9 Rest of Latin America
15 Competitive Landscape
15.1 Company Share Analysis
15.2 Key Business Strategy Analysis by Acquisition
15.3 Key Business Strategy Analysis by Collaboration
15.4 Key Business Strategy Analysis by Expansion
15.5 Key Business Strategy Analysis by Investment
15.6 Key Business Strategy Analysis by Joint venture
15.7 Key Business Strategy Analysis by New Product Launch
15.8 Key Business Strategy Analysis by Partnership
16 Company Profiles
16.1 Analog Devices, Inc.
16.1.1 Company Snapshot
16.1.2 Company Overview
16.1.3 Financial Analysis
16.1.4 Product Benchmarking
16.1.5 Strategic Outlook
16.2 Infineon Technologies
16.2.1 Company Snapshot
16.2.2 Company Overview
16.2.3 Financial Analysis
16.2.4 Product Benchmarking
16.2.5 Strategic Outlook
16.3 STMicroelectronics
16.3.1 Company Snapshot
16.3.2 Company Overview
16.3.3 Financial Analysis
16.3.4 Product Benchmarking
16.3.5 Strategic Outlook
16.4 TE Connectivity
16.4.1 Company Snapshot
16.4.2 Company Overview
16.4.3 Financial Analysis
16.4.4 Product Benchmarking
16.5 Microchip Technology
16.5.1 Company Snapshot
16.5.2 Company Overview
16.5.3 Financial Analysis
16.5.4 Product Benchmarking
16.6 NXP Semiconductors
16.6.1 Company Snapshot
16.6.2 Company Overview
16.6.3 Financial Analysis
16.6.4 Product Benchmarking
16.6.5 Strategic Outlook
16.7 Robert Bosch GmbH
16.7.1 Company Snapshot
16.7.2 Company Overview
16.7.3 Product Benchmarking
16.7.4 Strategic Outlook
16.8 Siemens AG
16.8.1 Company Snapshot
16.8.2 Company Overview
16.8.3 Financial Analysis
16.8.4 Product Benchmarking
16.8.5 Strategic Outlook
16.9 ABB Ltd
16.9.1 Company Snapshot
16.9.2 Company Overview
16.9.3 Financial Analysis
16.9.4 Product Benchmarking
16.9.5 Strategic Outlook
16.10 Eaton Corporation
16.10.1 Company Snapshot
16.10.2 Company Overview
16.10.3 Financial Analysis
16.10.4 Product Benchmarking
16.10.5 Strategic Outlook
17 Conclusion and Recommendations
17.1 Concluding Remarks from Visiongain
17.2 Recommendations for Market Players
List of Tables
Table 1 Global Smart Sensors Market Snapshot, 2023 & 2033 (US$billion, CAGR %)
Table 2 Global Smart Sensors Market by Sensor Type, 2023-2033 (US$ Bn, AGR (%), CAGR (%))
Table 3 Global Temperature & Humidity Sensors Market Forecast, 2023-2033 (US$ Bn, AGR (%), CAGR (%))
Table 4 Global Temperature & Humidity Sensors Market by Region, 2023-2033 (US$ Bn, AGR (%), CAGR (%))
Table 5 Global Touch Sensors Market Forecast, 2023-2033 (US$ Bn, AGR (%), CAGR (%))
Table 6 Global Touch Sensors Market by Region, 2023-2033 (US$ Bn, AGR (%), CAGR (%))
Table 7 Global Pressure & Flow Sensors Market Forecast, 2023-2033 (US$ Bn, AGR (%), CAGR (%))
Table 8 Global Pressure & Flow Sensors Market by Region, 2023-2033 (US$ Bn, AGR (%), CAGR (%))
Table 9 Global Motion & Occupancy Sensors Market Forecast, 2023-2033 (US$ Bn, AGR (%), CAGR (%))
Table 10 Global Motion & Occupancy Sensors Market by Region, 2023-2033 (US$ Bn, AGR (%), CAGR (%))
Table 11 Global Water Sensors Market Forecast, 2023-2033 (US$ Bn, AGR (%), CAGR (%))
Table 12 Global Water Sensors Market by Region, 2023-2033 (US$ Bn, AGR (%), CAGR (%))
Table 13 Global Position Sensors Market Forecast, 2023-2033 (US$ Bn, AGR (%), CAGR (%))
Table 14 Global Position Sensors Market by Region, 2023-2033 (US$ Bn, AGR (%), CAGR (%))
Table 15 Global Light Sensors Market Forecast, 2023-2033 (US$ Bn, AGR (%), CAGR (%))
Table 16 Global Light Sensors Market by Region, 2023-2033 (US$ Bn, AGR (%), CAGR (%))
Table 17 Global Ultrasonic Sensors Market Forecast, 2023-2033 (US$ Bn, AGR (%), CAGR (%))
Table 18 Global Ultrasonic Sensors Market by Region, 2023-2033 (US$ Bn, AGR (%), CAGR (%))
Table 19 Global Oxidation-Reduction Potential (ORP) Sensors Market Forecast, 2023-2033 (US$ Bn, AGR (%), CAGR (%))
Table 20 Global Oxidation-Reduction Potential (ORP) Sensors Market by Region, 2023-2033 (US$ Bn, AGR (%), CAGR (%))
Table 21 Global Other Sensors Market Forecast, 2023-2033 (US$ Bn, AGR (%), CAGR (%))
Table 22 Global Other Sensors Market by Region, 2023-2033 (US$ Bn, AGR (%), CAGR (%))
Table 23 Global Smart Sensors Market by Technology, 2023-2033 (US$ Bn, AGR (%), CAGR (%))
Table 24 Global Micro Electro-Mechanical System (MEMS) Market Forecast, 2023-2033 (US$ Bn, AGR (%), CAGR (%))
Table 25 Global Micro Electro-Mechanical System (MEMS) Market by Region, 2023-2033 (US$ Bn, AGR (%), CAGR (%))
Table 26 Global Complementary Metal Oxide Semiconductor (CMOS) Market Forecast, 2023-2033 (US$ Bn, AGR (%), CAGR (%))
Table 27 Global Complementary Metal Oxide Semiconductor (CMOS) Market by Region, 2023-2033 (US$ Bn, AGR (%), CAGR (%))
Table 28 Global Microsystem Technology (MST) Market Forecast, 2023-2033 (US$ Bn, AGR (%), CAGR (%))
Table 29 Global Microsystem Technology (MST) Market by Region, 2023-2033 (US$ Bn, AGR (%), CAGR (%))
Table 30 Global Other Technology Market Forecast, 2023-2033 (US$ Bn, AGR (%), CAGR (%))
Table 31 Global Other Technology Market by Region, 2023-2033 (US$ Bn, AGR (%), CAGR (%))
Table 32 Global Smart Sensors Market by Component, 2023-2033 (US$ Bn, AGR (%), CAGR (%))
Table 33 Global Analog-to-Digital Converters (ADC) Market Forecast, 2023-2033 (US$ Bn, AGR (%), CAGR (%))
Table 34 Global Analog-to-Digital Converters (ADC) Market by Region, 2023-2033 (US$ Bn, AGR (%), CAGR (%))
Table 35 Global Digital-to-Analog Converters (DAC) Market Forecast, 2023-2033 (US$ Bn, AGR (%), CAGR (%))
Table 36 Global Digital-to-Analog Converters (DAC) Market by Region, 2023-2033 (US$ Bn, AGR (%), CAGR (%))
Table 37 Global Transceivers & Amplifiers Market Forecast, 2023-2033 (US$ Bn, AGR (%), CAGR (%))
Table 38 Global Transceivers & Amplifiers Market by Region, 2023-2033 (US$ Bn, AGR (%), CAGR (%))
Table 39 Global Microcontrollers Market Forecast, 2023-2033 (US$ Bn, AGR (%), CAGR (%))
Table 40 Global
Table 41 Global Microcontrollers Market by Region, 2023-2033 (US$ Bn, AGR (%), CAGR (%))
Table 42 Global Other Components Market Forecast, 2023-2033 (US$ Bn, AGR (%), CAGR (%))
Table 43 Global Other Components Market by Region, 2023-2033 (US$ Bn, AGR (%), CAGR (%))
Table 44 Global Smart Sensors Market by End-User Industry, 2023-2033 (US$ Bn, AGR (%), CAGR (%))
Table 45 Global Consumer Electronics Market Forecast, 2023-2033 (US$ Bn, AGR (%), CAGR (%))
Table 46 Global Consumer Electronics Market by Region, 2023-2033 (US$ Bn, AGR (%), CAGR (%))
Table 47 Global Industrial Automation Market Forecast, 2023-2033 (US$ Bn, AGR (%), CAGR (%))
Table 48 Global Industrial Automation Market by Region, 2023-2033 (US$ Bn, AGR (%), CAGR (%))
Table 49 Global Biomedical & Healthcare Market Forecast, 2023-2033 (US$ Bn, AGR (%), CAGR (%))
Table 50 Global Biomedical & Healthcare Market by Region, 2023-2033 (US$ Bn, AGR (%), CAGR (%))
Table 51 Global Automotive Market Forecast, 2023-2033 (US$ Bn, AGR (%), CAGR (%))
Table 52 Global Automotive Market by Region, 2023-2033 (US$ Bn, AGR (%), CAGR (%))
Table 53 Global Aerospace & Defence Market Forecast, 2023-2033 (US$ Bn, AGR (%), CAGR (%))
Table 54 Global Aerospace & Defence Market by Region, 2023-2033 (US$ Bn, AGR (%), CAGR (%))
Table 55 Global Other End-User Industry Market Forecast, 2023-2033 (US$ Bn, AGR (%), CAGR (%))
Table 56 Global Other End-User Industry Market by Region, 2023-2033 (US$ Bn, AGR (%), CAGR (%))
Table 57 Global Smart Sensors Market by Region, 2022-2033 (USD Mn, AGR (%), CAGR (%))
Table 58 Global Smart Sensors Market Forecast, 2023-2033 (US$ Bn, AGR (%), CAGR (%)) (V-Shaped Recovery Scenario)
Table 59 Global Smart Sensors Market by Region, 2023-2033 (US$ Bn, AGR (%), CAGR (%)) (V-Shaped Recovery Scenario)
Table 60 Global Smart Sensors Market Forecast, 2023-2033 (US$ Bn, AGR (%), CAGR (%)) (U-Shaped Recovery Scenario)
Table 61 Global Smart Sensors Market by Region, 2023-2033 (US$ Bn, AGR (%), CAGR (%)) (U-Shaped Recovery Scenario)
Table 62 Global Smart Sensors Market Forecast, 2023-2033 (US$ Bn, AGR (%), CAGR (%)) (W-Shaped Recovery Scenario)
Table 63 Global Smart Sensors Market by Region, 2023-2033 (US$ Bn, AGR (%), CAGR (%)) (W-Shaped Recovery Scenario)
Table 64 Global Smart Sensors Market Forecast, 2023-2033 (US$ Bn, AGR (%), CAGR (%)) (L-Shaped Recovery Scenario)
Table 65 Global Smart Sensors Market by Region, 2023-2033 (US$ Bn, AGR (%), CAGR (%)) (L-Shaped Recovery Scenario)
Table 66 North America Smart Sensors Market by Country, 2023-2033 (US$ Bn, AGR (%), CAGR (%))
Table 67 North America Smart Sensors Market by Sensor Type, 2023-2033 (US$ Bn, AGR (%), CAGR (%))
Table 68 Global Smart Sensors Market by Technology, 2023-2033 (US$ Bn, AGR (%), CAGR (%))
Table 69 North America Smart Sensors Market by Component, 2023-2033 (US$ Bn, AGR (%), CAGR (%))
Table 70 North America Smart Sensors Market by End-User Industry, 2023-2033 (US$ Bn, AGR (%), CAGR (%))
Table 71 US Smart Sensors Market by Value, 2023-2033 (US$ Bn, AGR (%), CAGR (%))
Table 72 Canada Smart Sensors Market by Value, 2023-2033 (US$ Bn, AGR (%), CAGR (%))
Table 73 Europe Smart Sensors Market by Country, 2023-2033 (US$ Bn, AGR (%), CAGR (%))
Table 74 Europe Smart Sensors Market by Sensor Type, 2023-2033 (US$ Bn, AGR (%), CAGR (%))
Table 75 Europe Smart Sensors Market by Technology, 2023-2033 (US$ Bn, AGR (%), CAGR (%))
Table 76 Europe Smart Sensors Market by Component, 2023-2033 (US$ Bn, AGR (%), CAGR (%))
Table 77 Europe Smart Sensors Market by End-User Industry, 2023-2033 (US$ Bn, AGR (%), CAGR (%))
Table 78 Poland Smart Sensors Market by Value, 2023-2033 (US$ Bn, AGR (%), CAGR (%))
Table 79 Germany Smart Sensors Market by Value, 2023-2033 (US$ Bn, AGR (%), CAGR (%))
Table 80 Hungary Smart Sensors Market by Value, 2023-2033 (US$ Bn, AGR (%), CAGR (%))
Table 81 United Kingdom Smart Sensors Market by Value, 2023-2033 (US$ Bn, AGR (%), CAGR (%))
Table 82 Rest of Europe Smart Sensors Market by Value, 2023-2033 (US$ Bn, AGR (%), CAGR (%))
Table 83 Asia-Pacific Smart Sensors Market by Country, 2023-2033 (US$ Bn, AGR (%), CAGR (%))
Table 84 Asia-Pacific Smart Sensors Market by Sensor Type, 2023-2033 (US$ Bn, AGR (%), CAGR (%))
Table 85 Asia-Pacific Smart Sensors Market by Technology, 2023-2033 (US$ Bn, AGR (%), CAGR (%))
Table 86 Asia-Pacific Smart Sensors Market by Component, 2023-2033 (US$ Bn, AGR (%), CAGR (%))
Table 87 Asia-Pacific Smart Sensors Market by End-User Industry, 2023-2033 (US$ Bn, AGR (%), CAGR (%))
Table 88 China Smart Sensors Market by Value, 2023-2033 (US$ Bn, AGR (%), CAGR (%))
Table 89 India Smart Sensors Market by Value, 2023-2033 (US$ Bn, AGR (%), CAGR (%))
Table 90 Japan Smart Sensors Market by Value, 2023-2033 (US$ Bn, AGR (%), CAGR (%))
Table 91 South Korea Smart Sensors Market by Value, 2023-2033 (US$ Bn, AGR (%), CAGR (%))
Table 92 Australia Smart Sensors Market by Value, 2023-2033 (US$ Bn, AGR (%), CAGR (%))
Table 93 Rest of Asia-Pacific Smart Sensors Market by Value, 2023-2033 (US$ Bn, AGR (%), CAGR (%))
Table 94 Middle East & Africa Smart Sensors Market by Country, 2023-2033 (US$ Bn, AGR (%), CAGR (%))
Table 95 Middle East & Africa Smart Sensors Market by Sensor Type, 2023-2033 (US$ Bn, AGR (%), CAGR (%))
Table 96 Middle East & Africa Smart Sensors Market by Technology, 2023-2033 (US$ Bn, AGR (%), CAGR (%))
Table 97 Middle East & Africa Smart Sensors Market by Component, 2023-2033 (US$ Bn, AGR (%), CAGR (%))
Table 98 Middle East & Africa Smart Sensors Market by End-User Industry, 2023-2033 (US$ Bn, AGR (%), CAGR (%))
Table 99 GCC Smart Sensors Market by Value, 2023-2033 (US$ Bn, AGR (%), CAGR (%))
Table 100 South Africa Smart Sensors Market by Value, 2023-2033 (US$ Bn, AGR (%), CAGR (%))
Table 101 Rest of Middle East & Africa Smart Sensors Market by Value, 2023-2033 (US$ Bn, AGR (%), CAGR (%))
Table 102 Latin America Smart Sensors Market by Country, 2023-2033 (US$ Bn, AGR (%), CAGR (%))
Table 103 Latin America Smart Sensors Market by Sensor Type, 2023-2033 (US$ Bn, AGR (%), CAGR (%))
Table 104 Latin America Smart Sensors Market by Technology, 2023-2033 (US$ Bn, AGR (%), CAGR (%))
Table 105 Latin America Smart Sensors Market by Component, 2023-2033 (US$ Bn, AGR (%), CAGR (%))
Table 106 Latin America Smart Sensors Market by End-User Industry, 2023-2033 (US$ Bn, AGR (%), CAGR (%))
Table 107 Brazil Smart Sensors Market by Value, 2023-2033 (US$ Bn, AGR (%), CAGR (%))
Table 108 Mexico Smart Sensors Market by Value, 2023-2033 (US$ Bn, AGR (%), CAGR (%))
Table 109 Rest of Latin America Smart Sensors Market by Value, 2023-2033 (US$ Bn, AGR (%), CAGR (%))
Table 110 Analog Devices, Inc.: Key Details, (CEO, HQ, Revenue, Founded, No. of Employees, Company Type, Website, Business Segment)
Table 111 Analog Devices, Inc.: Product Benchmarking
Table 112 Analog Devices, Inc.: Strategic Outlook
Table 113 Infineon Technologies: Key Details, (CEO, HQ, Revenue, Founded, No. of Employees, Company Type, Website, Business Segment)
Table 114 Infineon Technologies: Product Benchmarking
Table 115 Infineon Technologies: Strategic Outlook
Table 116 STMicroelectronics: Key Details, (CEO, HQ, Revenue, Founded, No. of Employees, Company Type, Website, Business Segment)
Table 117 STMicroelectronics: Product Benchmarking
Table 118 STMicroelectronics: Strategic Outlook
Table 119 TE Connectivity: Key Details, (CEO, HQ, Revenue, Founded, No. of Employees, Company Type, Website, Business Segment)
Table 120 TE Connectivity: Product Benchmarking
Table 121 Microchip Technology: Key Details, (CEO, HQ, Revenue, Founded, No. of Employees, Company Type, Website, Business Segment)
Table 122 Microchip Technology: Product Benchmarking
Table 123 NXP Semiconductors: Key Details, (CEO, HQ, Revenue, Founded, No. of Employees, Company Type, Website, Business Segment)
Table 124 NXP Semiconductors: Product Benchmarking
Table 125 NXP Semiconductors: Strategic Outlook
Table 126 Robert Bosch GmbH: Key Details, (CEO, HQ, Revenue, Founded, No. of Employees, Company Type, Website, Business Segment)
Table 127 Robert Bosch GmbH: Product Benchmarking
Table 128 Robert Bosch GmbH: Strategic Outlook
Table 129 Siemens AG: Key Details, (CEO, HQ, Revenue, Founded, No. of Employees, Company Type, Website, Business Segment)
Table 130 Siemens AG: Product Benchmarking
Table 131 Siemens AG: Strategic Outlook
Table 132 ABB Ltd: Key Details, (CEO, HQ, Revenue, Founded, No. of Employees, Company Type, Website, Business Segment)
Table 133 ABB Ltd: Product Benchmarking
Table 134 ABB Ltd: Strategic Outlook
Table 135 Eaton Corporation: Key Details, (CEO, HQ, Revenue, Founded, No. of Employees, Company Type, Website, Business Segment)
Table 136 Eaton Corporation: Product Benchmarking
Table 137 Eaton Corporation: Strategic Outlook
List of Figures
Figure 1 Global Smart Sensors Market Segmentation
Figure 2 Global Smart Sensors Market Forecast by Region: Market Attractiveness Index
Figure 3 Global Smart Sensors Market by Type: Market Attractiveness Index
Figure 4 Global Smart Sensors Market by Technology: Market Attractiveness Index
Figure 5 Global Smart Sensors Market by Component: Market Attractiveness Index
Figure 6 Global Smart Sensors Market by End-users: Market Attractiveness Index
Figure 7 Global Smart Sensors Market: Market Dynamics
Figure 8 Global Smart Sensors Market: Porter’s Five Forces Analysis
Figure 9 Global Smart Sensors Market: PESTLE Analysis
Figure 10 Global Smart Sensors Market Forecast by Type 2023, 2033 (Revenue, CAGR%)
Figure 11 Global Smart Sensors Market Forecast by Type,2023, 2033 (Revenue, CAGR%)
Figure 12 Global Smart Sensors Market by Sensor Type, 2023-2033 (US$ Bn, AGR (%))
Figure 13 Global Temperature & Humidity Sensors Market Forecast, 2023-2033 (US$ Bn, AGR (%))
Figure 14 Global Temperature & Humidity Sensors Market by Region, 2023-2033 (US$ Bn, AGR (%))
Figure 15 Global Touch Sensors Market Forecast, 2023-2033 (US$ Bn, AGR (%))
Figure 16 Global Touch Sensors Market by Region, 2023-2033 (US$ Bn, AGR (%))
Figure 17 Global Pressure & Flow Sensors Market Forecast, 2023-2033 (US$ Bn, AGR (%))
Figure 18 Global Pressure & Flow Sensors Market by Region, 2023-2033 (US$ Bn, AGR (%))
Figure 19 Global Motion & Occupancy Sensors Market Forecast, 2023-2033 (US$ Bn, AGR (%))
Figure 20 Global Motion & Occupancy Sensors Market by Region, 2023-2033 (US$ Bn, AGR (%))
Figure 21 Global Water Sensors Market Forecast, 2023-2033 (US$ Bn, AGR (%))
Figure 22 Global Water Sensors Market by Region, 2023-2033 (US$ Bn, AGR (%))
Figure 23 Global Position Sensors Market Forecast, 2023-2033 (US$ Bn, AGR (%))
Figure 24 Global Position Sensors Market by Region, 2023-2033 (US$ Bn, AGR (%))
Figure 25 Global Light Sensors Market Forecast, 2023-2033 (US$ Bn, AGR (%))
Figure 26 Global Light Sensors Market by Region, 2023-2033 (US$ Bn, AGR (%))
Figure 27 Global Ultrasonic Sensors Market Forecast, 2023-2033 (US$ Bn, AGR (%))
Figure 28 Global Ultrasonic Sensors Market by Region, 2023-2033 (US$ Bn, AGR (%))
Figure 29 Global Oxidation-Reduction Potential (ORP) Sensors Market Forecast, 2023-2033 (US$ Bn, AGR (%))
Figure 30 Global Oxidation-Reduction Potential (ORP) Sensors Market by Region, 2023-2033 (US$ Bn, AGR (%))
Figure 31 Global Other Sensors Market Forecast, 2023-2033 (US$ Bn, AGR (%))
Figure 32 Global Other Sensors Market by Region, 2023-2033 (US$ Bn, AGR (%))
Figure 33 Global Smart Sensors Market Forecast by Technology 2023, 2033 (Revenue, CAGR%)
Figure 34 Global Smart Sensors Market Forecast by Technology,2023, 2033 (Revenue, CAGR%)
Figure 35 Global Smart Sensors Market by Technology, 2023-2033 (US$ Bn, AGR (%))
Figure 36 Global Micro Electro-Mechanical System (MEMS) Market Forecast, 2023-2033 (US$ Bn, AGR (%))
Figure 37 Global Micro Electro-Mechanical System (MEMS) Market by Region, 2023-2033 (US$ Bn, AGR (%))
Figure 38 Global Complementary Metal Oxide Semiconductor (CMOS) Market Forecast, 2023-2033 (US$ Bn, AGR (%))
Figure 39 Global Complementary Metal Oxide Semiconductor (CMOS) Market by Region, 2023-2033 (US$ Bn, AGR (%))
Figure 40 Global Microsystem Technology (MST) Market Forecast, 2023-2033 (US$ Bn, AGR (%))
Figure 41 Global Microsystem Technology (MST) Market by Region, 2023-2033 (US$ Bn, AGR (%))
Figure 42 Global Other Technology Market Forecast, 2023-2033 (US$ Bn, AGR (%))
Figure 43 Global Other Technology Market by Region, 2023-2033 (US$ Bn, AGR (%))
Figure 44 Global Smart Sensors Market Forecast by Component 2023, 2033 (Revenue, CAGR%)
Figure 45 Global Smart Sensors Market Forecast by Component,2023, 2033 (Revenue, CAGR%)
Figure 46 Global Smart Sensors Market by Component, 2023-2033 (US$ Bn, AGR (%))
Figure 47 Global Analog-to-Digital Converters (ADC) Market Forecast, 2023-2033 (US$ Bn, AGR (%))
Figure 48 Global Analog-to-Digital Converters (ADC) Market by Region, 2023-2033 (US$ Bn, AGR (%))
Figure 49 Global Digital-to-Analog Converters (DAC) Market Forecast, 2023-2033 (US$ Bn, AGR (%))
Figure 50 Global Digital-to-Analog Converters (DAC) Market by Region, 2023-2033 (US$ Bn, AGR (%))
Figure 51 Global Transceivers & Amplifiers Market Forecast, 2023-2033 (US$ Bn, AGR (%))
Figure 52 Global Transceivers & Amplifiers Market by Region, 2023-2033 (US$ Bn, AGR (%))
Figure 53 Global Microcontrollers Market Forecast, 2023-2033 (US$ Bn, AGR (%))
Figure 54 Global Microcontrollers Market by Region, 2023-2033 (US$ Bn, AGR (%))
Figure 55 Global Other Components Market Forecast, 2023-2033 (US$ Bn, AGR (%))
Figure 56 Global Other Components Market by Region, 2023-2033 (US$ Bn, AGR (%))
Figure 57 Global Smart Sensors Market Forecast by End-User Industry 2023, 2033 (Revenue, CAGR%)
Figure 58 Global Smart Sensors Market Forecast by Solution,2023, 2033 (Revenue, CAGR%)
Figure 59 Global Smart Sensors Market by End-User Industry, 2023-2033 (US$ Bn, AGR (%))
Figure 60 Global Consumer Electronics Market Forecast, 2023-2033 (US$ Bn, AGR (%))
Figure 61 Global Consumer Electronics Market by Region, 2023-2033 (US$ Bn, AGR (%))
Figure 62 Global Industrial Automation Market Forecast, 2023-2033 (US$ Bn, AGR (%))
Figure 63 Global Industrial Automation Market by Region, 2023-2033 (US$ Bn, AGR (%))
Figure 64 Global Biomedical & Healthcare Market Forecast, 2023-2033 (US$ Bn, AGR (%))
Figure 65 Global Biomedical & Healthcare Market by Region, 2023-2033 (US$ Bn, AGR (%))
Figure 66 Global Automotive Market Forecast, 2023-2033 (US$ Bn, AGR (%))
Figure 67 Global Automotive Market by Region, 2023-2033 (US$ Bn, AGR (%))
Figure 68 Global Aerospace & Defence Market Forecast, 2023-2033 (US$ Bn, AGR (%))
Figure 69 Global Aerospace & Defence Market by Region, 2023-2033 (US$ Bn, AGR (%))
Figure 70 Global Other End-User Industry Market Forecast, 2023-2033 (US$ Bn, AGR (%))
Figure 71 Global Other End-User Industry Market by Region, 2023-2033 (US$ Bn, AGR (%))
Figure 72 Global Smart Sensors Market by Region, 2023-2033 (USD Mn, AGR (%), CAGR (%))
Figure 73 Global Smart Sensors Market Forecast, 2023-2033 (US$ Bn, AGR (%)) (V-Shaped Recovery Scenario)
Figure 74 Global Smart Sensors Market by Region, 2023-2033 (US$ Bn, AGR (%)) (V-Shaped Recovery Scenario)
Figure 75 Global Smart Sensors Market Forecast, 2023-2033 (US$ Bn, AGR (%)) (U-Shaped Recovery Scenario)
Figure 76 Global Smart Sensors Market by Region, 2023-2033 (US$ Bn, AGR (%)) (U-Shaped Recovery Scenario)
Figure 77 Global Smart Sensors Market Forecast, 2023-2033 (US$ Bn, AGR (%)) (W-Shaped Recovery Scenario)
Figure 78 Global Smart Sensors Market by Region, 2023-2033 (US$ Bn, AGR (%)) (W-Shaped Recovery Scenario)
Figure 79 Global Smart Sensors Market Forecast, 2023-2033 (US$ Bn, AGR (%)) (L-Shaped Recovery Scenario)
Figure 80 Global Smart Sensors Market by Region, 2023-2033 (US$ Bn, AGR (%)) (L-Shaped Recovery Scenario)
Figure 81 North America Smart Sensors Market Attractiveness Index
Figure 82 North America Smart Sensors Market Share Forecast 2023, 2033 (%)
Figure 83 North America Smart Sensors Market by Country, 2023-2033 (US$ Bn, AGR (%))
Figure 84 North America Smart Sensors Market by Sensor Type, 2023-2033 (US$ Bn, AGR (%))
Figure 85 North America Smart Sensors Market Share Forecast by Type, 2023 & 2033 (%)
Figure 86 Global Smart Sensors Market by Technology, 2023-2033 (US$ Bn, AGR (%))
Figure 87 North America Smart Sensors Market Share Forecast by Technology, 2023 & 2033 (%)
Figure 88 North America Smart Sensors Market by Component, 2023-2033 (US$ Bn, AGR (%))
Figure 89 North America Smart Sensors Market Share Forecast Component, 2023 & 2033 (%)
Figure 90 North America Smart Sensors Market by End-User Industry, 2023-2033 (US$ Bn, AGR (%))
Figure 91 North America Smart Sensors Market Share Forecast Service, 2023 & 2033 (%)
Figure 92 US Smart Sensors Market by Value, 2023-2033 (US$ Bn, AGR (%))
Figure 93 Canada Smart Sensors Market by Value, 2023-2033 (US$ Bn, AGR (%))
Figure 94 Europe Smart Sensors Market Attractiveness Index
Figure 95 Europe Smart Sensors Market Share Forecast, 2023, 2033 (%)
Figure 96 Europe Smart Sensors Market by Country, 2023-2033 (US$ Bn, AGR (%))
Figure 97 Europe Smart Sensors Market by Sensor Type, 2023-2033 (US$ Bn, AGR (%))
Figure 98 Europe Smart Sensors Market Share Forecast by Type, 2023 & 2033 (%)
Figure 99 Europe Smart Sensors Market by Technology, 2023-2033 (US$ Bn, AGR (%))
Figure 100 Europe Smart Sensors Market Share Forecast by Technology, 2023 & 2033 (%)
Figure 101 Europe Smart Sensors Market by Component, 2023-2033 (US$ Bn, AGR (%))
Figure 102 Europe Smart Sensors Market Share Forecast Component, 2023 & 2033 (%)
Figure 103 Europe Smart Sensors Market by End-User Industry, 2023-2033 (US$ Bn, AGR (%))
Figure 104 Europe Smart Sensors Market Share Forecast End-User Industry ,2023 & 2033 (%)
Figure 105 Poland Smart Sensors Market by Value, 2023-2033 (US$ Bn, AGR (%))
Figure 106 Germany Smart Sensors Market by Value, 2023-2033 (US$ Bn, AGR (%))
Figure 107 Hungary Smart Sensors Market by Value, 2023-2033 (US$ Bn, AGR (%))
Figure 108 United Kingdom Smart Sensors Market by Value, 2023-2033 (US$ Bn, AGR (%))
Figure 109 Rest of Europe Smart Sensors Market by Value, 2023-2033 (US$ Bn, AGR (%))
Figure 110 Asia-Pacific Smart Sensors Market Attractiveness Index
Figure 111 Global Smart Sensors Market Share Forecast , 2023, 2033 (%)
Figure 112 Asia-Pacific Smart Sensors Market by Country, 2023-2033 (US$ Bn, AGR (%))
Figure 113 Asia-Pacific Smart Sensors Market by Sensor Type, 2023-2033 (US$ Bn, AGR (%))
Figure 114 Asia-Pacific Smart Sensors Market Share Forecast by Type, 2023 & 2033 (%)
Figure 115 Asia-Pacific Smart Sensors Market by Technology, 2023-2033 (US$ Bn, AGR (%))
Figure 116 Asia-Pacific Smart Sensors Market Share Forecast by Technology, 2023 & 2033 (%)
Figure 117 Asia-Pacific Smart Sensors Market by Component, 2023-2033 (US$ Bn, AGR (%))
Figure 118 Asia-Pacific Smart Sensors Market Share Forecast Component ,2023 & 2033 (%)
Figure 119 Asia-Pacific Smart Sensors Market by End-User Industry, 2023-2033 (US$ Bn, AGR (%))
Figure 120 Asia-Pacific Smart Sensors Market Share Forecast End-User Industry ,2023 & 2033 (%)
Figure 121 China Smart Sensors Market by Value, 2023-2033 (US$ Bn, AGR (%))
Figure 122 India Smart Sensors Market by Value, 2023-2033 (US$ Bn, AGR (%))
Figure 123 Japan Smart Sensors Market by Value, 2023-2033 (US$ Bn, AGR (%))
Figure 124 South Korea Smart Sensors Market by Value, 2023-2033 (US$ Bn, AGR (%))
Figure 125 Australia Smart Sensors Market by Value, 2023-2033 (US$ Bn, AGR (%))
Figure 126 Rest of Asia-Pacific Smart Sensors Market by Value, 2023-2033 (US$ Bn, AGR (%))
Figure 127 Middle East & Africa Smart Sensors Market Attractiveness Index
Figure 128 Middle East & Africa Smart Sensors Market Share Forecast by Country, 2023 & 2033 (%)
Figure 129 Middle East & Africa Smart Sensors Market by Country, 2023-2033 (US$ Bn, AGR (%))
Figure 130 Middle East & Africa Smart Sensors Market by Sensor Type, 2023-2033 (US$ Bn, AGR (%))
Figure 131 Middle East & Africa Smart Sensors Market Share Forecast by Type, 2023 & 2033 (%)
Figure 132 Middle East & Africa Smart Sensors Market by Technology, 2023-2033 (US$ Bn, AGR (%))
Figure 133 Middle East & Africa Smart Sensors Market Share Forecast by Technology, 2023 & 2033 (%)
Figure 134 Middle East & Africa Smart Sensors Market by Component, 2023-2033 (US$ Bn, AGR (%))
Figure 135 Middle East & Africa Smart Sensors Market Share Forecast Component, 2023 & 2033 (%)
Figure 136 Middle East & Africa Smart Sensors Market by End-User Industry, 2023-2033 (US$ Bn, AGR (%))
Figure 137 Middle East & Africa Smart Sensors Market Share Forecast End-User Industry, 2023 & 2033 (%)
Figure 138 GCC Smart Sensors Market by Value, 2023-2033 (US$ Bn, AGR (%))
Figure 139 South Africa Smart Sensors Market by Value, 2023-2033 (US$ Bn, AGR (%))
Figure 140 Rest of Middle East & Africa Smart Sensors Market by Value, 2023-2033 (US$ Bn, AGR (%))
Figure 141 Latin America Smart Sensors Market Attractiveness Index
Figure 142 Latin America Smart Sensors Market Share Forecast by Country, 2023, 2033 (%)
Figure 143 Latin America Smart Sensors Market by Country, 2023-2033 (US$ Bn, AGR (%))
Figure 144 Latin America Smart Sensors Market by Sensor Type, 2023-2033 (US$ Bn, AGR (%))
Figure 145 Latin America Smart Sensors Market Share Forecast by Type, 2023 & 2033 (%)
Figure 146 Latin America Smart Sensors Market by Technology, 2023-2033 (US$ Bn, AGR (%))
Figure 147 Latin America Smart Sensors Market Share Forecast by Technology, 2023 & 2033 (%)
Figure 148 Latin America Smart Sensors Market by Component, 2023-2033 (US$ Bn, AGR (%))
Figure 149 Latin America Smart Sensors Market Share Forecast Component, 2023 & 2033 (%)
Figure 150 Latin America Smart Sensors Market by End-User Industry, 2023-2033 (US$ Bn, AGR (%))
Figure 151 Latin America Smart Sensors Market Share Forecast End-User Industry, 2023 & 2033 (%)
Figure 152 Brazil Smart Sensors Market by Value, 2023-2033 (US$ Bn, AGR (%))
Figure 153 Mexico Smart Sensors Market by Value, 2023-2033 (US$ Bn, AGR (%))
Figure 154 Rest of Latin America Smart Sensors Market by Value, 2023-2033 (US$ Bn, AGR (%))
Figure 155 Global Smart Sensors Market: Company Share Analysis, 2021
Figure 156 Analog Devices, Inc.: Net Revenue, 2017-2021 (US$ million, AGR%)
Figure 157 Analog Devices, Inc.: Gross Profit, 2017-2021 (US$ million, AGR%)
Figure 158 Analog Devices, Inc.: Operational Income, 2017-2021 (US$ million, AGR%)
Figure 159 Analog Devices, Inc.: EBITDA, 2017-2021 (US$ million, AGR%)
Figure 160 Infineon Technologies: Net Revenue, 2017-2021 (US$ million, AGR%)
Figure 161 Infineon Technologies: Gross Profit, 2017-2021 (US$ million, AGR%)
Figure 162 Infineon Technologies: Operational Income, 2017-2021 (US$ million, AGR%)
Figure 163 Infineon Technologies: EBITDA, 2017-2021 (US$ million, AGR%)
Figure 164 STMicroelectronics: Net Revenue, 2017-2021 (US$ million, AGR%)
Figure 165 STMicroelectronics: Gross Profit, 2017-2021 (US$ million, AGR%)
Figure 166 STMicroelectronics: Operational Income, 2017-2021 (US$ million, AGR%)
Figure 167 STMicroelectronics: EBITDA, 2017-2021 (US$ million, AGR%)
Figure 168 TE Connectivity: Net Revenue, 2018-2022 (US$ million, AGR%)
Figure 169 TE Connectivity: Gross Profit, 2018-2022 (US$ million, AGR%)
Figure 170 TE Connectivity: Operational Income 2018-2022 (US$ million, AGR%)
Figure 171 TE Connectivity: EBITDA 2018-2022 (US$ million, AGR%)
Figure 172 Microchip Technology: Net Revenue, 2018-2022 (US$ million, AGR%)
Figure 173 Microchip Technology: Gross Profit, 2018-2022 (US$ million, AGR%)
Figure 174 Microchip Technology: Operational Income, 2018-2022 (US$ million, AGR%)
Figure 175 Microchip Technology: EBITDA, 2018-2022 (US$ million, AGR%)
Figure 176 NXP Semiconductors: Net Revenue, 2017-2021 (US$ million, AGR%)
Figure 177 NXP Semiconductors: Gross Profit, 2017-2021 (US$ million, AGR%)
Figure 178 NXP Semiconductors: Operational Income, 2017-2021 (US$ million, AGR%)
Figure 179 NXP Semiconductors: EBITDA, 2017-2021 (US$ million, AGR%)
Figure 180 Siemens AG: Net Revenue, 2017-2021 (US$ million, AGR%)
Figure 181 Siemens AG: Gross Profit, 2017-2021 (US$ million, AGR%)
Figure 182 Siemens AG: Operational Income, 2017-2021 (US$ million, AGR%)
Figure 183 Siemens AG: EBITDA, 2017-2021 (US$ million, AGR%)
Figure 184 ABB Ltd: Net Revenue, 2017-2021 (US$ million, AGR%)
Figure 185 ABB Ltd: Gross Profit, 2017-2021 (US$ million, AGR%)
Figure 186 ABB Ltd: Operational Income, 2017-2021 (US$ million, AGR%)
Figure 187 ABB Ltd: EBITDA, 2017-2021 (US$ million, AGR%)
Figure 188 Eaton Corporation: Net Revenue, 2017-2021 (US$ million, AGR%)
Figure 189 Eaton Corporation: Gross Profit, 2017-2021 (US$ million, AGR%)
Figure 190 Eaton Corporation: Operational Income, 2017-2021 (US$ million, AGR%)
Figure 191 Eaton Corporation: EBITDA, 2017-2021 (US$ million, AGR%)
List of Companies Profiled in the report
ABB (ABB Ltd.)
Analog Devices, Inc.
Eaton Corporation plc
Infineon Technologies AG
Microchip Technology Inc.
NXP Semiconductors N.V. (NXP)
Robert Bosch GmbH
Siemens AG
STMicroelectronics N.V.
TE Connectivity
List of Other Companies Mentioned in the report
Aeron Systems
Althen sensors
ASC GmbH
Balluff GmbH
BDC ELECTRONIC S.r.l.
BeanAir GmbH
Camille Bauer Metrawatt AG
Curtiss-Wright
Di-Soric GmbH & Co. Kg
ELGO Electronic
Gemac
Geokon, Inc.
Geosense
HK Shan Hai Group Limited
IJINUS
inelta Sensorsysteme
ipf electronic gmbh
Kübler Group
M.A.E. S.r.l.
MEGATRON Elektronik GmbH & Co. KG
Meggitt PLC
MEMSIC Inc
Micromega
MicroStrain
Multivista Global Pvt. Ltd.
National Control Devices
Next Industries s.r.l
Omron Corporation
Parker Hannifin Corporation
Positek
RST instruments Ltd.
Sensata Technologies, Inc.
SENSOREX MEGGITT
Shanghai Zhichuan Electronic Tech Co ,Ltd.
Shenzhen Rion Technology
SignalQuest
SIMEX Sp. z o.o.
Soway Tech Limited
Sparfun Electronics
Spectron Sensors
Tamagawa Seiki Co. Ltd.
TAYLOR HOBSON
TESA
TEXYS
TSM SENSORS SRL
TURCK India Automation Pvt. Ltd.
TWK-ELEKTRONIK GmbH
US Digital
Variohm EuroSensor (UK)
Welan Technologies Pvt Ltd.
Wuxi Bewis Sensing Tecnology LLC
Wyler AG
YUTTAH (FZE)
List of Associations Mentioned in the Report
AMA Association for Sensors and Measurement
American Institute of Architects (AIA)
Australian Bureau of Statistics
China Academy of Railway Sciences
European Commission
European Union
Frequency Sensor Association (IFSA)
Gulf Cooperation Council (GCC)
IEN Europe
India Brand Equity Foundation (IBEF)
International Association of Geodesy Symposia
International Frequency Sensor Association
Italian National Institute of Statistics (ISTAT)
Measurement, Control & Automation Association
Mexican Mining Chamber
National Association of Italian Constructors (ANCE)
Satellite Industry Association (SIA)
Spanish Institute for Foreign Trade (ICEX)
Spanish Ministry of Commerce and Industry
The National Renewable Energy Laboratory (NREL)