The Aircraft Sensors Market Report 2023-2033: This report will prove invaluable to leading firms striving for new revenue pockets if they wish to better understand the industry and its underlying dynamics. It will be useful for companies that would like to expand into different industries or to expand their existing operations in a new region.
Factors Such Increasing New Orders for Commercial Aircrafts, Military Jets and UAVs Are Driving the Market Growth
The increasing number of new orders placed from across the world coupled ageing aircrafts that require refurbishment and replacement of parts is expected to boost the demand for aircrafts sensors. Airbus foresees the demand for 39,000 new passenger & freighter aircraft by 2040 on account of accelerated retirement of older air aircrafts, growing demand for air travel, development of airspaces and fleet from emerging countries. According to Boeing, Middle East airlines will require 2,980 new aircraft valued at US$765bn to serve passengers and trade. More than two-thirds of these deliveries will enable growth, while one-third will replace older aircraft with more fuel-efficient models. The Asia-Pacific region will need over 17,600 new aircraft by 2040. According to Airbus, cargo traffic in Asia-Pacific will also increase at 3.6% per annum, well above the global 3.1% average.
System Prone to Cyber Attacks
As the aviation industry is quickly transitioning from conventional aircraft systems to Aviation Cyber-Physical Systems (ACPS) based aircraft their vulnerability to cyber-attacks is growing. The wireless- and resource-constrained nature of sensors and their deployment in harsh or unattended environments increases their susceptibility to several security threats. Sensor-based platforms and applications are vulnerable to cyberattacks, exposing valuable assets to sensor network-based cyber threats. Owing to this the United States Department of Homeland Security (DHS) in July 2019 issued an alert warning small aircraft owners to be vigilant against a vulnerability that could provide attackers an opportunity to easily hack the plane’s controller area network (CAN) bus and take control of key navigation systems. Modern aircraft make use of a network of electronics to translate signals from various sensors placing the data onto a network that is displayed to the pilot after proper interpretation. The vulnerability was discovered by a cybersecurity researcher at Rapid 7, a cyber security company who demonstrated that a hacker with physical access to the wing of a small aircraft wiring could attach a device to the plane’s avionics CAN bus to communicate false data to the pilot. Further, in August 2019, the U.S. Air Force and the Defense Digital Service (DDS) contracted an ethical hacker group, which infiltrated the F-15 Eagle fighter jet’s trusted aircraft information download station (TADS).
What Questions Should You Ask before Buying a Market Research Report?
• How is the aircraft sensors market evolving?
• What is driving and restraining the aircraft sensors market?
• How will each aircraft sensors submarket segment grow over the forecast period and how much revenue will these submarkets account for in 2033?
• How will the market shares for each aircraft sensors submarket develop from 2023 to 2033?
• What will be the main driver for the overall market from 2023 to 2033?
• Will leading aircraft sensors markets broadly follow the macroeconomic dynamics, or will individual national markets outperform others?
• How will the market shares of the national markets change by 2033 and which geographical region will lead the market in 2033?
• Who are the leading players and what are their prospects over the forecast period?
• What are the aircraft sensors projects for these leading companies?
• How will the industry evolve during the period between 2023 and 2033? What are the implications of aircraft sensors projects taking place now and over the next 10 years?
• Is there a greater need for product commercialisation to further scale the aircraft sensors market?
• Where is the aircraft sensors market heading and how can you ensure you are at the forefront of the market?
• What are the best investment options for new product and service lines?
• What are the key prospects for moving companies into a new growth path and C-suite?
You need to discover how this will impact the aircraft sensors market today, and over the next 10 years:
• Our 327-page report provides 125 tables and 190 charts/graphs exclusively to you.
• The report highlights key lucrative areas in the industry so you can target them – NOW.
• It contains in-depth analysis of global, regional and national sales and growth.
• It highlights for you the key successful trends, changes and revenue projections made by your competitors.
This report tells you TODAY how the aircraft sensors market will develop in the next 10 years, and in line with the variations in COVID-19 economic recession and bounce. This market is more critical now than at any point over the last 10 years.
Forecasts to 2033 and other analyses reveal commercial prospects
• In addition to revenue forecasting to 2033, our new study provides you with recent results, growth rates, and market shares.
• You will find original analyses, with business outlooks and developments.
• Discover qualitative analyses (including market dynamics, drivers, opportunities, restraints and challenges), cost structure, impact of rising aircraft sensors prices and recent developments.
This report includes data analysis and invaluable insight into how COVID-19 will affect the industry and your company. Four COVID-19 recovery patterns and their impact, namely, “V”, “L”, “W” and “U” are discussed in this report.
Segments Covered in the Report
Sensor Type Outlook
• Pressure Sensors
• Flow sensors
• Temperature sensors
• Position sensors
• Force Sensors
• Speed Sensors
• Level Sensors
• Optical Sensors
• Motion Sensors
• Smoke Detection Sensors
• Others
Aircraft Type
• Fixed Wing
• Rotary Wing
• UAVs
Application
• Cabin, Gallery, and Cargo
• Cockpit Controls
• Flight Controls and Actuation
• Engine, Turbine, and APU
• Landing Gear and Brakes
End-use
• OEM
• Aftermarket

In addition to the revenue predictions for the overall world market and segments, you will also find revenue forecasts for five regional and 17 leading national markets:
North America
• U.S.
• Canada
Europe
• Germany
• UK
• France
• Spain
• Italy
• Russia
• Rest of Europe
Asia Pacific
• China
• Japan
• India
• Australia
• Singapore
• Rest of Asia Pacific
Latin America
• Brazil
• Mexico
• Rest of Latin America Latin America
MEA
• GCC
• South Africa
• Rest of MEA
Need industry data? Please contact us today.
The report also includes profiles and for some of the leading companies in the Aircraft sensors Market, 2023 to 2033, with a focus on this segment of these companies’ operations.
Leading companies and the potential for market growth
• Ametek Inc.
• Curtiss-Wright Corporation
• Eaton Corporation plc
• General Atomics
• General Electric Company
• Honeywell International Inc.
• Hydra-Electric Company
• L3 Harris Technologies, Inc.
• Meggitt PLC
• Safran SA
• TE Connectivity Ltd.
• Thales Group
• The Raytheon Company
• United Electric Controls (UE)
• Woodward, Inc.
Overall world revenue for Aircraft sensors Market, 2023 to 2033 in terms of value the market will surpass US$2,718.0 million in 2023, our work calculates. We predict strong revenue growth through to 2033. Our work identifies which organizations hold the greatest potential. Discover their capabilities, progress, and commercial prospects, helping you stay ahead.
How will the Aircraft sensors Market, 2023 to 2033 report help you?
In summary, our 320+ page report provides you with the following knowledge:
• Revenue forecasts to 2033 for Aircraft sensors Market, 2023 to 2033 Market, with forecasts for sensor type, application, aircraft type, end-use and company size, each forecast at a global and regional level – discover the industry’s prospects, finding the most lucrative places for investments and revenues.
• Revenue forecasts to 2033 for five regional and 17 key national markets – See forecasts for the Aircraft sensors Market, 2023 to 2033 market in North America, Europe, Asia-Pacific and LAMEA. Also forecasted is the market in the US, Canada, Mexico, Brazil, Germany, France, Spain, Russia, UK, Italy, China, India, Japan, Australia, South Africa, and GCC and among other prominent economies.
• Prospects for established firms and those seeking to enter the market – including company profiles for 15 of the major companies involved in the Aircraft sensors Market, 2023 to 2033.
Find quantitative and qualitative analyses with independent predictions. Receive information that only our report contains, staying informed with invaluable business intelligence.
Information found nowhere else
With our new report, you are less likely to fall behind in knowledge or miss out on opportunities. See how our work could benefit your research, analyses, and decisions. Visiongain’s study is for everybody needing commercial analyses for the Aircraft sensors Market, 2023 to 2033, market-leading companies. You will find data, trends and predictions.
To access the data contained in this document please email contactus@visiongain.com
Buy our report today Aircraft Sensors Market Report 2023-2033: Forecasts by Sensor Type (Pressure Sensors, Flow Sensors, Temperature Sensors, Position Sensors, Force Sensors, Speed Sensors, Level Sensors, Optical Sensors, Motion Sensors, Smoke Detection Sensors, Others), by Application (Cabin, Gallery and Cargo, Cockpit Controls, Flight Controls and Actuation, Engine, Turbine and APU, Landing Gear and Brakes), by Aircraft Type (Fixed Wing, Rotary Wing, UAVs), by End-use (OEMs, Aftermarket) AND Regional and Leading National Market Analysis PLUS Analysis of Leading Companies AND COVID-19 Impact and Recovery Pattern Analysis. Avoid missing out by staying informed – order our report now.
Visiongain is a trading partner with the US Federal Government
CCR Ref number: KD4R6
Do you have any custom requirements we can help you with? Any need for a specific country, geo region, market segment or specific company information? Contact us today, we can discuss your needs and see how we can help: contactus@visiongain.com
1. Report Overview
1.1 Objectives of the Study
1.2 Introduction to Aircraft Sensors Market
1.3 What This Report Delivers
1.4 Why You Should Read This Report
1.5 Key Questions Answered by This Analytical Report
1.6 Who is This Report for?
1.7 Methodology
1.7.1 Market Definitions
1.7.2 Market Evaluation & Forecasting Methodology
1.7.3 Data Validation
1.7.3.1 Primary Research
1.7.3.2 Secondary Research
1.8 Frequently Asked Questions (FAQs)
1.9 Associated Visiongain Reports
1.10 About Visiongain
2 Executive Summary
3 Market Overview
3.1 Key Findings
3.2 Market Dynamics
3.2.1 Market Driving Factors
3.2.1.1 Growing Tourism Industry Expected to Boost the Market for Aircraft Sensors
3.2.1.2 Increasing Defence Spending on Military Aircraft
3.2.2 Market Restraining Factors
3.2.2.1 System Prone to Cyber Attacks
3.2.2.2 Weather Conditions can Limit Optical Sensor Effectiveness
3.2.3 Market Opportunities
3.2.3.1 Advancement of Aircraft Sensors to Optimise Aircraft Performance
3.2.3.2 Growing Environmental Concerns
3.3 COVID-19 Impact Analysis
3.4 Porter’s Five Forces Analysis
3.4.1 Bargaining Power of Suppliers (Low)
3.4.2 Bargaining Power of Buyers (High)
3.4.3 Competitive Rivalry (High)
3.4.4 Threat from Substitutes (Low)
3.4.5 Threat of New Entrants (Low)
3.5 PEST Analysis
4 Aircraft Sensors Market Analysis by Sensor Type
4.1 Key Findings
4.2 Sensor Type Segment: Market Attractiveness Index
4.3 Aircraft Sensors Market Size Estimation and Forecast by Sensor Type
4.4 Pressure Sensors
4.4.1 Market Size by Region, 2023-2033 (US$ mn)
4.4.2 Market Share by Region, 2023 & 2033 (%)
4.5 Flow Sensors
4.5.1 Market Size by Region, 2023-2033 (US$ mn)
4.5.2 Market Share by Region, 2023 & 2033 (%)
4.6 Temperature Sensors
4.6.1 Market Size by Region, 2023-2033 (US$ mn)
4.6.2 Market Share by Region, 2023 & 2033 (%)
4.7 Position Sensors
4.7.1 Market Size by Region, 2023-2033 (US$ mn)
4.7.2 Market Share by Region, 2023 & 2033 (%)
4.8 Force Sensors
4.8.1 Market Size by Region, 2023-2033 (US$ mn)
4.8.2 Market Share by Region, 2023 & 2033 (%)
4.9 Speed Sensors
4.9.1 Market Size by Region, 2023-2033 (US$ mn)
4.9.2 Market Share by Region, 2023 & 2033 (%)
4.10 Level Sensors
4.10.1 Market Size by Region, 2023-2033 (US$ mn)
4.10.2 Market Share by Region, 2023 & 2033 (%)
4.11 Optical Sensors
4.11.1 Market Size by Region, 2023-2033 (US$ mn)
4.11.2 Market Share by Region, 2023 & 2033 (%)
4.12 Motion Sensors
4.12.1 Market Size by Region, 2023-2033 (US$ mn)
4.12.2 Market Share by Region, 2023 & 2033 (%)
4.13 Smoke Detection Sensors
4.13.1 Market Size by Region, 2023-2033 (US$ mn)
4.13.2 Market Share by Region, 2023 & 2033 (%)
4.14 Other Sensors
4.14.1 Market Size by Region, 2023-2033 (US$ mn)
4.14.2 Market Share by Region, 2023 & 2033 (%)
5 Aircraft Sensors Market Analysis by Application
5.1 Key Findings
5.2 Application Segment: Market Attractiveness Index
5.3 Aircraft Sensors Market Size Estimation and Forecast by Application
5.4 Cabin, Gallery, and Cargo
5.4.1 Market Size by Region, 2023-2033 (US$ mn)
5.4.2 Market Share by Region, 2023 & 2033 (%)
5.5 Cockpit Controls
5.5.1 Market Size by Region, 2023-2033 (US$ mn)
5.5.2 Market Share by Region, 2023 & 2033 (%)
5.6 Flight Controls and Actuation
5.6.1 Market Size by Region, 2023-2033 (US$ mn)
5.6.2 Market Share by Region, 2023 & 2033 (%)
5.7 Engine, Turbine, and APU
5.7.1 Market Size by Region, 2023-2033 (US$ mn)
5.7.2 Market Share by Region, 2023 & 2033 (%)
5.8 Landing Gear and Brakes
5.8.1 Market Size by Region, 2023-2033 (US$ mn)
5.8.2 Market Share by Region, 2023 & 2033 (%)
6 Aircraft Sensors Market Analysis by Aircraft Type
6.1 Key Findings
6.2 Aircraft Type Segment: Market Attractiveness Index
6.3 Aircraft Sensors Market Size Estimation and Forecast by Aircraft Type
6.4 Fixed Wing
6.4.1 Market Size by Region, 2023-2033 (US$ mn)
6.4.2 Market Share by Region, 2023 & 2033 (%)
6.5 Rotary Wings
6.5.1 Market Size by Region, 2023-2033 (US$ mn)
6.5.2 Market Share by Region, 2023 & 2033 (%)
6.6 UAVs
6.6.1 Market Size by Region, 2023-2033 (US$ mn)
6.6.2 Market Share by Region, 2023 & 2033 (%)
7 Aircraft Sensors Market Analysis by End-use
7.1 Key Findings
7.2 End-use Segment: Market Attractiveness Index
7.3 Aircraft Sensors Market Size Estimation and Forecast by End-use
7.4 OEM
7.4.1 Market Size by Region, 2023-2033 (US$ mn)
7.4.2 Market Share by Region, 2023 & 2033 (%)
7.5 Aftermarkets
7.5.1 Market Size by Region, 2023-2033 (US$ mn)
7.5.2 Market Share by Region, 2023 & 2033 (%)
8 Aircraft Sensors Market Analysis by Region
8.1 Key Findings
8.2 Regional Market Size Estimation and Forecast
9 North America Aircraft Sensors Market Analysis
9.1 Key Findings
9.2 North America Aircraft Sensors Market Attractiveness Index
9.3 North America Aircraft Sensors Market by Country, 2023, 2028 & 2033 (US$ mn)
9.4 North America Aircraft Sensors Market Size Estimation and Forecast by Country
9.5 North America Aircraft Sensors Market Size Estimation and Forecast by Sensor Type
9.6 North America Aircraft Sensors Market Size Estimation and Forecast by Application
9.7 North America Aircraft Sensors Market Size Estimation and Forecast by Aircraft Type
9.8 North America Aircraft Sensors Market Size Estimation and Forecast by End-use
9.9 U.S. Aircraft Sensors Market Analysis
9.10 Canada Aircraft Sensors Market Analysis
10 Europe Aircraft Sensors Market Analysis
10.1 Key Findings
10.2 Europe Aircraft Sensors Market Attractiveness Index
10.3 Europe Aircraft Sensors Market by Country, 2023, 2028 & 2033 (US$ mn)
10.4 Europe Aircraft Sensors Market Size Estimation and Forecast by Country
10.5 Europe Aircraft Sensors Market Size Estimation and Forecast by Sensor Type
10.6 Europe Aircraft Sensors Market Size Estimation and Forecast by Application
10.7 Europe Aircraft Sensors Market Size Estimation and Forecast by Aircraft Type
10.8 Europe Aircraft Sensors Market Size Estimation and Forecast by End-use
10.9 Germany Aircraft Sensors Market Analysis
10.10 France Aircraft Sensors Market Analysis
10.11 UK Aircraft Sensors Market Analysis
10.12 Italy Aircraft Sensors Market Analysis
10.13 Spain Aircraft Sensors Market Analysis
10.14 Russia Aircraft Sensors Market Analysis
10.15 Rest of Europe Aircraft Sensors Market Analysis
11 Asia-Pacific Aircraft Sensors Market Analysis
11.1 Key Findings
11.2 Asia-Pacific Aircraft Sensors Market Attractiveness Index
11.3 Asia-Pacific Aircraft Sensors Market by Country, 2023, 2028 & 2033 (US$ mn)
11.4 Asia-Pacific Aircraft Sensors Market Size Estimation and Forecast by Country
11.5 Asia-Pacific Aircraft Sensors Market Size Estimation and Forecast by Sensor Type
11.6 Asia-Pacific Aircraft Sensors Market Size Estimation and Forecast by Application
11.7 Asia-Pacific Aircraft Sensors Market Size Estimation and Forecast by Aircraft Type
11.8 Asia-Pacific Aircraft Sensors Market Size Estimation and Forecast by End-use
11.9 Japan Aircraft Sensors Market Analysis
11.10 China Aircraft Sensors Market Analysis
11.11 India Aircraft Sensors Market Analysis
11.12 Australia Aircraft Sensors Market Analysis
11.13 Singapore Aircraft Sensors Market Analysis
11.14 Rest of APAC Aircraft Sensors Market Analysis
12 Middle East & Africa Aircraft Sensors Market Analysis
12.1 Key Findings
12.2 Middle East & Africa Aircraft Sensors Market Attractiveness Index
12.3 Middle East & Africa Aircraft Sensors Market by Country, 2023, 2028 & 2033 (US$ mn)
12.4 Middle East & Africa Aircraft Sensors Market Size Estimation and Forecast by Country
12.5 Middle East & Africa Aircraft Sensors Market Size Estimation and Forecast by Sensor Type
12.6 Middle East & Africa Aircraft Sensors Market Size Estimation and Forecast by Application
12.7 Middle East & Africa Aircraft Sensors Market Size Estimation and Forecast by Aircraft Type
12.8 Middle East & Africa Aircraft Sensors Market Size Estimation and Forecast by End-use
12.9 GCC Aircraft Sensors Market Analysis
12.10 South Africa Aircraft Sensors Market Analysis
12.11 Rest of MEA Aircraft Sensors Market Analysis
13 Latin America Aircraft Sensors Market Analysis
13.1 Key Findings
13.2 Latin America Aircraft Sensors Market Attractiveness Index
13.3 Latin America Aircraft Sensors Market by Country, 2023, 2028 & 2033 (US$ mn)
13.4 Latin America Aircraft Sensors Market Size Estimation and Forecast by Country
13.5 Latin America Aircraft Sensors Market Size Estimation and Forecast by Sensor Type
13.6 Latin America Aircraft Sensors Market Size Estimation and Forecast by Application
13.7 Latin America Aircraft Sensors Market Size Estimation and Forecast by Aircraft Type
13.8 Latin America Aircraft Sensors Market Size Estimation and Forecast by End-use
13.9 Brazil Aircraft Sensors Market Analysis
13.10 Mexico Aircraft Sensors Market Analysis
13.11 Rest of Latin America Aircraft Sensors Market Analysis
14 Company Profiles
14.1 Competitive Landscape, 2021
14.2 Strategic Outlook
14.3 Honeywell International Inc.
14.3.1 Company Snapshot
14.3.2 Company Overview
14.3.3 Financial Analysis
14.3.3.1 Net Revenue, 2017-2021
14.3.3.2 R&D, 2017-2021
14.3.3.3 Regional Market Shares, 2021
14.3.4 Product Benchmarking
14.3.5 Strategic Outlook
14.4 TE Connectivity Ltd.
14.4.1 Company Snapshot
14.4.2 Company Overview
14.4.3 Financial Analysis
14.4.3.1 Net Revenue, 2017-2021
14.4.3.2 R&D, 2017-2021
14.4.3.3 Regional Market Shares, 2021
14.4.4 Product Benchmarking
14.4.5 Strategic Outlook
14.5 Meggitt PLC
14.5.1 Company Snapshot
14.5.2 Company Overview
14.5.3 Financial Analysis
14.5.3.1 Net Revenue, 2017-2021
14.5.3.2 R&D, 2017-2021
14.5.3.3 Regional Market Shares, 2021
14.5.4 Product Benchmarking
14.5.5 Strategic Outlook
14.6 Eaton Corporation plc
14.6.1 Company Snapshot
14.6.2 Company Overview
14.6.3 Financial Analysis
14.6.3.1 Net Revenue, 2017-2021
14.6.3.2 R&D, 2017-2021
14.6.3.3 Regional Market Shares, 2021
14.6.4 Product Benchmarking
14.6.5 Strategic Outlook
14.7 Ametek Inc.
14.7.1 Company Snapshot
14.7.2 Company Overview
14.7.3 Financial Analysis
14.7.3.1 Net Revenue, 2017-2021
14.7.3.2 R&D, 2017-2021
14.7.3.3 Regional Market Shares, 2021
14.7.4 Product Benchmarking
14.7.5 Strategic Outlook
14.8 Thales Group
14.8.1 Company Snapshot
14.8.2 Company Overview
14.8.3 Financial Analysis
14.8.3.1 Net Revenue, 2017-2021
14.8.3.2 R&D, 2017-2021
14.8.3.3 Regional Market Shares, 2021
14.8.4 Product Benchmarking
14.8.5 Strategic Outlook
14.9 The Raytheon Company
14.9.1 Company Snapshot
14.9.2 Company Overview
14.9.3 Financial Analysis
14.9.3.1 Net Revenue, 2017-2021
14.9.3.2 R&D, 2017-2021
14.9.3.3 Regional Market Shares, 2021
14.9.4 Product Benchmarking
14.9.5 Strategic Outlook
14.10 General Electric Company
14.10.1 Company Snapshot
14.10.2 Company Overview
14.10.3 Financial Analysis
14.10.3.1 Net Revenue, 2017-2021
14.10.3.2 R&D, 2017-2021
14.10.3.3 Regional Market Shares, 2021
14.10.4 Product Benchmarking
14.10.5 Strategic Outlook
14.11 L3 Harris Technologies, Inc.
14.11.1 Company Snapshot
14.11.2 Company Overview
14.11.3 Financial Analysis
14.11.3.1 Net Revenue, 2017-2021
14.11.3.2 R&D, 2017-2021
14.11.3.3 Regional Market Shares, 2021
14.11.4 Product Benchmarking
14.11.5 Strategic Outlook
14.12 Safran SA
14.12.1 Company Snapshot
14.12.2 Company Overview
14.12.3 Financial Analysis
14.12.3.1 Net Revenue, 2017-2021
14.12.3.2 R&D, 2017-2021
14.12.3.3 Regional Market Shares, 2021
14.12.4 Product Benchmarking
14.12.5 Strategic Outlook
14.13 Woodward, Inc.
14.13.1 Company Snapshot
14.13.2 Company Overview
14.13.3 Financial Analysis
14.13.3.1 Net Revenue, 2017-2021
14.13.3.2 R&D, 2017-2021
14.13.3.3 Regional Market Shares, 2021
14.13.4 Product Benchmarking
14.13.5 Strategic Outlook
14.14 General Atomics
14.14.1 Company Snapshot
14.14.2 Company Overview
14.14.3 Product Benchmarking
14.14.4 Strategic Outlook
14.15 Curtiss-Wright Corporation
14.15.1 Company Snapshot
14.15.2 Company Overview
14.15.3 Financial Analysis
14.15.3.1 Net Revenue, 2017-2021
14.15.3.2 R&D, 2017-2021
14.15.3.3 Regional Market Shares, 2021
14.15.4 Product Benchmarking
14.15.5 Strategic Outlook
14.16 United Electric Controls (UE)
14.16.1 Company Snapshot
14.16.2 Company Overview
14.16.3 Product Benchmarking
14.16.4 Strategic Outlook
14.17 Hydra-Electric Company
14.17.1 Company Snapshot
14.17.2 Company Overview
14.17.3 Product Benchmarking
14.17.4 Strategic Outlook
15 Conclusion and Recommendations
15.1 Concluding Remarks from Visiongain
15.2 Recommendations for Market Players
List of Tables
Table 1 Aircraft Sensors Market Snapshot, 2023 & 2033 (US$ million, CAGR %)
Table 2 Air Travel Growth (%) Relative to 2019 levels
Table 3 Aircraft Sensors Market: Product Launches/ Development
Table 4 Aircraft Sensors Market by Region, 2023-2033 (US$ mn, AGR (%), CAGR(%)): “V” Shaped Recovery Scenario
Table 5 Aircraft Sensors Market by Region, 2023-2033 (US$ mn, AGR (%), CAGR(%)): “U” Shaped Recovery Scenario
Table 6 Aircraft Sensors Market by Region, 2023-2033 (US$ mn, AGR (%), CAGR(%)): “W” Shaped Recovery Scenario
Table 7 Aircraft Sensors Market by Region, 2023-2033 (US$ mn, AGR (%), CAGR(%)): “L” Shaped Recovery Scenario
Table 8 Aircraft Sensors Market Forecast by Sensor Type, 2023-2033 (US$ mn, AGR%, CAGR%)
Table 9 Pressure Sensor Market Forecast by Region, 2023-2033 (US$ mn, AGR%, CAGR%)
Table 10 Flow Sensor Market Forecast by Region, 2023-2033 (US$ mn, AGR%, CAGR%)
Table 11 Temperature Sensor Market Forecast by Region, 2023-2033 (US$ mn, AGR%, CAGR%)
Table 12 Position Sensor Market Forecast by Region, 2023-2033 (US$ mn, AGR%, CAGR%)
Table 13 Force Sensor Market Forecast by Region, 2023-2033 (US$ mn, AGR%, CAGR%)
Table 14 Speed Sensor Market Forecast by Region, 2023-2033 (US$ mn, AGR%, CAGR%)
Table 15 Level Sensor Market Forecast by Region, 2023-2033 (US$ mn, AGR%, CAGR%)
Table 16 Optical Sensor Market Forecast by Region, 2023-2033 (US$ mn, AGR%, CAGR%)
Table 17 Motion Sensor Market Forecast by Region, 2023-2033 (US$ mn, AGR%, CAGR%)
Table 18 Smoke Detection Sensor Market Forecast by Region, 2023-2033 (US$ mn, AGR%, CAGR%)
Table 19 Other Sensor Market Forecast by Region, 2023-2033 (US$ mn, AGR%, CAGR%)
Table 20 Aircraft Sensors Market Forecast by Application, 2023-2033 (US$ mn, AGR%, CAGR%)
Table 21 Cabin, Gallery, and Cargo Market Forecast by Region, 2023-2033 (US$ mn, AGR%, CAGR%)
Table 22 Cockpit Controls Market Forecast by Region, 2023-2033 (US$ mn, AGR%, CAGR%)
Table 23 Flight Controls and Actuation Market Forecast by Region, 2023-2033 (US$ mn, AGR%, CAGR%)
Table 24 Engine, Turbine, and APU Market Forecast by Region, 2023-2033 (US$ mn, AGR%, CAGR%)
Table 25 Landing Gear and Brakes Market Forecast by Region, 2023-2033 (US$ mn, AGR%, CAGR%)
Table 26 Aircraft Sensors Market Forecast by Aircraft Type, 2023-2033 (US$ mn, AGR%, CAGR%)
Table 27 Fixed Wing Market Forecast by Region, 2023-2033 (US$ mn, AGR%, CAGR%)
Table 28 Rotary Wing Market Forecast by Region, 2023-2033 (US$ mn, AGR%, CAGR%)
Table 29 UAV Market Forecast by Region, 2023-2033 (US$ mn, AGR%, CAGR%)
Table 30 Aircraft Sensors Market Forecast by End-use, 2023-2033 (US$ mn, AGR%, CAGR%)
Table 31 OEM Market Forecast by Region, 2023-2033 (US$ mn, AGR%, CAGR%)
Table 32 Aftermarket Market Forecast by Region, 2023-2033 (US$ mn, AGR%, CAGR%)
Table 33 Aircraft Sensors Market by Region, 2023-2033 (US$ mn, AGR (%), CAGR(%))
Table 34 North America Aircraft Sensors Market Forecast by Country, 2023-2033 (US$ mn, AGR%, CAGR%)
Table 35 North America Aircraft Sensors Market Forecast by Sensor Type, 2023-2033 (US$ mn, AGR%, CAGR%)
Table 36 North America Aircraft Sensors Market Forecast by Application, 2023-2033 (US$ mn, AGR%, CAGR%)
Table 37 North America Aircraft Sensors Market Forecast by Aircraft Type, 2023-2033 (US$ mn, AGR%, CAGR%)
Table 38 North America Aircraft Sensors Market Forecast by End-use, 2023-2033 (US$ mn, AGR%, CAGR%)
Table 39 U.S. Aircraft Sensors Market Forecast, 2023-2033 (US$ mn, AGR%, CAGR%)
Table 40 Canada Aircraft Sensors Market Forecast, 2023-2033 (US$ mn, AGR%, CAGR%)
Table 41 Europe Aircraft Sensors Market Forecast by Country, 2023-2033 (US$ mn, AGR%, CAGR%)
Table 42 Europe Aircraft Sensors Market Forecast by Sensor Type, 2023-2033 (US$ mn, AGR%, CAGR%)
Table 43 Europe Aircraft Sensors Market Forecast by Application, 2023-2033 (US$ mn, AGR%, CAGR%)
Table 44 Europe Aircraft Sensors Market Forecast by Aircraft Type, 2023-2033 (US$ mn, AGR%, CAGR%)
Table 45 Europe Aircraft Sensors Market Forecast by End-use, 2023-2033 (US$ mn, AGR%, CAGR%)
Table 46 Germany Aircraft Sensors Market Forecast, 2023-2033 (US$ mn, AGR%, CAGR%)
Table 47 France Aircraft Sensors Market Forecast, 2023-2033 (US$ mn, AGR%, CAGR%)
Table 48 UK Aircraft Sensors Market Forecast, 2023-2033 (US$ mn, AGR%, CAGR%)
Table 49 Italy Aircraft Sensors Market Forecast, 2023-2033 (US$ mn, AGR%, CAGR%)
Table 50 Spain Aircraft Sensors Market Forecast, 2023-2033 (US$ mn, AGR%, CAGR%)
Table 51 Russia Aircraft Sensors Market Forecast, 2023-2033 (US$ mn, AGR%, CAGR%)
Table 52 Rest of Europe Aircraft Sensors Market Forecast, 2023-2033 (US$ mn, AGR%, CAGR%)
Table 53 Asia-Pacific Aircraft Sensors Market Forecast by Country, 2023-2033 (US$ mn, AGR%, CAGR%)
Table 54 Asia-Pacific Aircraft Sensors Market Forecast by Sensor Type, 2023-2033 (US$ mn, AGR%, CAGR%)
Table 55 Asia-Pacific Aircraft Sensors Market Forecast by Application, 2023-2033 (US$ mn, AGR%, CAGR%)
Table 56 Asia-Pacific Aircraft Sensors Market Forecast by Aircraft Type, 2023-2033 (US$ mn, AGR%, CAGR%)
Table 57 Asia-Pacific Aircraft Sensors Market Forecast by End-use, 2023-2033 (US$ mn, AGR%, CAGR%)
Table 58 Japan Aircraft Sensors Market Forecast, 2023-2033 (US$ mn, AGR%, CAGR%)
Table 59 China Aircraft Sensors Market Forecast, 2023-2033 (US$ mn, AGR%, CAGR%)
Table 60 India Aircraft Sensors Market Forecast, 2023-2033 (US$ mn, AGR%, CAGR%)
Table 61 Australia Aircraft Sensors Market Forecast, 2023-2033 (US$ mn, AGR%, CAGR%)
Table 62 Singapore Aircraft Sensors Market Forecast, 2023-2033 (US$ mn, AGR%, CAGR%)
Table 63 Rest of APAC Aircraft Sensors Market Forecast, 2023-2033 (US$ mn, AGR%, CAGR%)
Table 64 Middle East & Africa Aircraft Sensors Market Forecast by Country, 2023-2033 (US$ mn, AGR%, CAGR%)
Table 65 Middle East & Africa Aircraft Sensors Market Forecast by Sensor Type, 2023-2033 (US$ mn, AGR%, CAGR%)
Table 66 Middle East & Africa Aircraft Sensors Market Forecast by Application, 2023-2033 (US$ mn, AGR%, CAGR%)
Table 67 Middle East & Africa Aircraft Sensors Market Forecast by Aircraft Type, 2023-2033 (US$ mn, AGR%, CAGR%)
Table 68 Middle East & Africa Aircraft Sensors Market Forecast by End-use, 2023-2033 (US$ mn, AGR%, CAGR%)
Table 69 GCC Aircraft Sensors Market Forecast, 2023-2033 (US$ mn, AGR%, CAGR%)
Table 70 South Africa Aircraft Sensors Market Forecast, 2023-2033 (US$ mn, AGR%, CAGR%)
Table 71 Rest of MEA Aircraft Sensors Market Forecast, 2023-2033 (US$ mn, AGR%, CAGR%)
Table 72 Latin America Aircraft Sensors Market Forecast by Country, 2023-2033 (US$ mn, AGR%, CAGR%)
Table 73 Latin America Aircraft Sensors Market Forecast by Sensor Type, 2023-2033 (US$ mn, AGR%, CAGR%)
Table 74 Latin America Aircraft Sensors Market Forecast by Application, 2023-2033 (US$ mn, AGR%, CAGR%)
Table 75 Latin America Aircraft Sensors Market Forecast by Aircraft Type, 2023-2033 (US$ mn, AGR%, CAGR%)
Table 76 Latin America Aircraft Sensors Market Forecast by End-use, 2023-2033 (US$ mn, AGR%, CAGR%)
Table 77 Brazil Aircraft Sensors Market Forecast, 2023-2033 (US$ mn, AGR%, CAGR%)
Table 78 Mexico Aircraft Sensors Market Forecast, 2023-2033 (US$ mn, AGR%, CAGR%)
Table 79 Rest of Latin America Aircraft Sensors Market Forecast, 2023-2033 (US$ mn, AGR%, CAGR%)
Table 80 Strategic Outlook
Table 81 Honeywell International Inc.: Key Details, (CEO, HQ, Revenue, Founded, No. of Employees, Company Type, Website, Business Segment)
Table 82 Honeywell International Inc.: Product Benchmarking
Table 83 Honeywell International Inc.: Strategic Outlook
Table 84 TE Connectivity Ltd.: Key Details, (CEO, HQ, Revenue, Founded, No. of Employees, Company Type, Website, Business Segment)
Table 85 TE Connectivity Ltd.: Product Benchmarking
Table 86 TE Connectivity Ltd.: Strategic Outlook
Table 87 Meggitt PLC: Key Details, (CEO, HQ, Revenue, Founded, No. of Employees, Company Type, Website, Business Segment)
Table 88 Meggitt PLC: Product Benchmarking
Table 89 Meggitt PLC: Strategic Outlook
Table 90 Eaton Corporation plc: Key Details, (CEO, HQ, Revenue, Founded, No. of Employees, Company Type, Website, Business Segment)
Table 91 Eaton Corporation plc: Product Benchmarking
Table 92 Eaton Corporation plc: Strategic Outlook
Table 93 Ametek Inc.: Key Details, (CEO, HQ, Revenue, Founded, No. of Employees, Company Type, Website, Business Segment)
Table 94 Ametek Inc.: Product Benchmarking
Table 95 Ametek Inc.: Strategic Outlook
Table 96 Thales Group: Key Details, (CEO, HQ, Revenue, Founded, No. of Employees, Company Type, Website, Business Segment)
Table 97 Thales Group: Product Benchmarking
Table 98 Thales Group: Strategic Outlook
Table 99 Raytheon Technologies Corporation: Key Details, (CEO, HQ, Revenue, Founded, No. of Employees, Company Type, Website, Business Segment)
Table 100 The Raytheon Company: Product Benchmarking
Table 101 The Raytheon Company: Strategic Outlook
Table 102 General Electric Company: Key Details, (CEO, HQ, Revenue, Founded, No. of Employees, Company Type, Website, Business Segment)
Table 103 General Electric Company: Product Benchmarking
Table 104 General Electric Company: Strategic Outlook
Table 105 L3 Harris Technologies, Inc.: Key Details, (CEO, HQ, Revenue, Founded, No. of Employees, Company Type, Website, Business Segment)
Table 106 L3Harris Technologies, Inc.: Product Benchmarking
Table 107 L3Harris Technologies, Inc.: Strategic Outlook
Table 108 Safran SA: Key Details, (CEO, HQ, Revenue, Founded, No. of Employees, Company Type, Website, Business Segment)
Table 109 Safran SA: Product Benchmarking
Table 110 Safran SA: Strategic Outlook
Table 111 Woodward, Inc.: Key Details, (CEO, HQ, Revenue, Founded, No. of Employees, Company Type, Website, Business Segment)
Table 112 Woodward, Inc.: Product Benchmarking
Table 113 Woodward, Inc.: Strategic Outlook
Table 114 General Atomics: Key Details, (CEO, HQ, Founded, No. of Employees, Company Type, Website, Business Segment)
Table 115 General Atomics: Product Benchmarking
Table 116 General Atomics: Strategic Outlook
Table 117 Curtiss-Wright Corporation: Key Details, (CEO, HQ, Revenue, Founded, No. of Employees, Company Type, Website, Business Segment)
Table 118 Curtiss-Wright Corporation: Product Benchmarking
Table 119 Curtiss-Wright Corporation: Strategic Outlook
Table 120 United Electric Controls (UE): Key Details, (CEO, HQ, Founded, No. of Employees, Company Type, Website, Business Segment)
Table 121 United Electric Controls (UE): Product Benchmarking
Table 122 United Electric Controls (UE): Strategic Outlook
Table 123 Hydra Electric Company: Key Details, (CEO, HQ, Revenue, Founded, No. of Employees, Company Type, Website, Business Segment)
Table 124 Hydra-Electric Company: Product Benchmarking
Table 125 Hydra-Electric Company: Strategic Outlook
List of Figures
Figure 1 Aircraft Sensors Market Segmentation
Figure 2 Aircraft Sensors Market by Sensor Type: Market Attractiveness Index
Figure 3 Aircraft Sensors Market by Application: Market Attractiveness Index
Figure 4 Aircraft Sensors Market by Aircraft Type: Market Attractiveness Index
Figure 5 Aircraft Sensors Market by End-use: Market Attractiveness Index
Figure 6 Aircraft Sensors Market Attractiveness Index by Region
Figure 7 Aircraft Sensors Market: Market Dynamics
Figure 8 The 15 Highest Military Spenders in 2021
Figure 9 COVID Impact Analysis: Aircraft Sensors Market Recovery Scenarios
Figure 10 Aircraft Sensors Market by Region, 2023-2033 (US$ mn, AGR (%), CAGR (%)): “V” Shaped Recovery
Figure 11 Aircraft Sensors Market by Region, 2023-2033 (US$ mn, AGR (%), CAGR (%)): “U” Shaped Recovery
Figure 12 Aircraft Sensors Market by Region, 2023-2033 (US$ mn, AGR (%), CAGR (%)): “W” Shaped Recovery
Figure 13 Aircraft Sensors Market by Region, 2023-2033 (US$ mn, AGR (%), CAGR (%)): “L” Shaped Recovery
Figure 14 Aircraft Sensors Market: Porter’s Five Forces Analysis
Figure 15 Aircraft Sensors Market: PEST Analysis
Figure 16 Aircraft Sensors Market by Sensor Type: Market Attractiveness Index
Figure 17 Aircraft Sensors Market Forecast by Sensor Type, 2023-2033 (US$ million)
Figure 18 Aircraft Sensors Market Share Forecast by Sensor Type, 2023, 2028, 2033 (%)
Figure 19 Pressure Sensor Market Forecast by Region, 2023-2033 (US$ million)
Figure 20 Pressure Sensor Market Share Forecast by Region, 2023 & 2033 (%)
Figure 21 Flow Sensor Market Forecast by Region, 2023-2033 (US$ million)
Figure 22 Flow Sensor Market Share Forecast by Region, 2023 & 2033 (%)
Figure 23 Temperature Sensor Market Forecast by Region, 2023-2033 (US$ million)
Figure 24 Temperature Sensor Market Share Forecast by Region, 2023 & 2033 (%)
Figure 25 Position Sensor Market Forecast by Region, 2023-2033 (US$ million)
Figure 26 Position Sensor Market Share Forecast by Region, 2023 & 2033 (%)
Figure 27 Force Sensor Market Forecast by Region, 2023-2033 (US$ million)
Figure 28 Force Sensor Market Share Forecast by Region, 2023 & 2033 (%)
Figure 29 Speed Sensor Market Forecast by Region, 2023-2033 (US$ million)
Figure 30 Speed Sensor Market Share Forecast by Region, 2023 & 2033 (%)
Figure 31 Level Sensor Market Forecast by Region, 2023-2033 (US$ million)
Figure 32 Level Sensor Market Share Forecast by Region, 2023 & 2033 (%)
Figure 33 Optical Sensor Market Forecast by Region, 2023-2033 (US$ million)
Figure 34 Optical Sensor Market Share Forecast by Region, 2023 & 2033 (%)
Figure 35 Motion Sensor Market Forecast by Region, 2023-2033 (US$ million)
Figure 36 Motion Sensor Market Share Forecast by Region, 2023 & 2033 (%)
Figure 37 Smoke Detection Sensor Market Forecast by Region, 2023-2033 (US$ million)
Figure 38 Smoke Detection Sensor Market Share Forecast by Region, 2023 & 2033 (%)
Figure 39 Other Sensor Market Forecast by Region, 2023-2033 (US$ million)
Figure 40 Other Sensor Market Share Forecast by Region, 2023 & 2033 (%)
Figure 41 Aircraft Sensors Market by Application: Market Attractiveness Index
Figure 42 Aircraft Sensors Market Forecast by Application, 2023-2033 (US$ million)
Figure 43 Aircraft Sensors Market Share Forecast by Application, 2023, 2028, 2033 (%)
Figure 44 Cabin, Gallery, and Cargo Market Forecast by Region, 2023-2033 (US$ million)
Figure 45 Cabin, Gallery, and Cargo Market Share Forecast by Region, 2023 & 2033 (%)
Figure 46 Cockpit Controls Market Forecast by Region, 2023-2033 (US$ million)
Figure 47 Cockpit Controls Market Share Forecast by Region, 2023 & 2033 (%)
Figure 48 Flight Controls and Actuation Market Forecast by Region, 2023-2033 (US$ million)
Figure 49 Flight Controls and Actuation Market Share Forecast by Region, 2023 & 2033 (%)
Figure 50 Engine, Turbine, and APU Market Forecast by Region, 2023-2033 (US$ million)
Figure 51 Engine, Turbine, and APU Market Share Forecast by Region, 2023 & 2033 (%)
Figure 52 Landing Gear and Brakes Market Forecast by Region, 2023-2033 (US$ million)
Figure 53 Landing Gear and Brakes Market Share Forecast by Region, 2023 & 2033 (%)
Figure 54 Aircraft Sensors Market by Aircraft Type: Market Attractiveness Index
Figure 55 Aircraft Sensors Market Forecast by Aircraft Type, 2023-2033 (US$ million)
Figure 56 Aircraft Sensors Market Share Forecast by Aircraft Type, 2023, 2028, 2033 (%)
Figure 57 Fixed Wing Market Forecast by Region, 2023-2033 (US$ million)
Figure 58 Fixed Wing Market Share Forecast by Region, 2023 & 2033 (%)
Figure 59 Rotary Wing Market Forecast by Region, 2023-2033 (US$ million)
Figure 60 Rotary Wing Market Share Forecast by Region, 2023 & 2033 (%)
Figure 61 UAV Market Forecast by Region, 2023-2033 (US$ million)
Figure 62 UAV Market Share Forecast by Region, 2023 & 2033 (%)
Figure 63 Aircraft Sensors Market by End-use: Market Attractiveness Index
Figure 64 Aircraft Sensors Market Forecast by End-use, 2023-2033 (US$ million)
Figure 65 Aircraft Sensors Market Share Forecast by End-use, 2023, 2028, 2033 (%)
Figure 66 OEM Market Forecast by Region, 2023-2033 (US$ million)
Figure 67 OEM Market Share Forecast by Region, 2023 & 2033 (%)
Figure 68 Aftermarket Market Forecast by Region, 2023-2033 (US$ million)
Figure 69 Aftermarket Market Share Forecast by Region, 2023 & 2033 (%)
Figure 70 Aircraft Sensors Market Forecast by Region 2023, 2028, 2033 (Revenue, CAGR%)
Figure 71 Aircraft Sensors Market Share Forecast by Region 2023, 2028, 2033(%)
Figure 72 Aircraft Sensors Market by Region, 2023-2033 (US$ mn)
Figure 73 North America Aircraft Sensors Market Attractiveness Index
Figure 74 North America Aircraft Sensors Market by Region, 2023, 2028 & 2033 (US$ million)
Figure 75 North America Aircraft Sensors Market Forecast by Country, 2023-2033 (US$ million)
Figure 76 North America Aircraft Sensors Market Share Forecast by Country, 2023 & 2033 (%)
Figure 77 North America Aircraft Sensors Market Forecast by Sensor Type, 2023-2033 (US$ million)
Figure 78 North America Aircraft Sensors Market Share Forecast by Sensor Type, 2023 & 2033 (%)
Figure 79 North America Aircraft Sensors Market Forecast by Application, 2023-2033 (US$ million)
Figure 80 North America Aircraft Sensors Market Share Forecast by Application, 2023 & 2033 (%)
Figure 81 North America Aircraft Sensors Market Forecast by Aircraft Type, 2023-2033 (US$ million)
Figure 82 North America Aircraft Sensors Market Share Forecast by Aircraft Type, 2023 & 2033 (%)
Figure 83 North America Aircraft Sensors Market Forecast by End-use, 2023-2033 (US$ million)
Figure 84 North America Aircraft Sensors Market Share Forecast by End-use, 2023 & 2033 (%)
Figure 85 U.S. Aircraft Sensors Market Forecast, 2023-2033 (US$ million, AGR %)
Figure 86 Canada Aircraft Sensors Market Forecast, 2023-2033 (US$ million, AGR %)
Figure 87 Europe Aircraft Sensors Market Attractiveness Index
Figure 88 Europe Aircraft Sensors Market by Region, 2023, 2028 & 2033 (US$ million)
Figure 89 Europe Aircraft Sensors Market Forecast by Country, 2023-2033 (US$ million)
Figure 90 Europe Aircraft Sensors Market Share Forecast by Country, 2023 & 2033 (%)
Figure 91 Europe Aircraft Sensors Market Forecast by Sensor Type, 2023-2033 (US$ million)
Figure 92 Europe Aircraft Sensors Market Share Forecast by Sensor Type, 2023 & 2033 (%)
Figure 93 Europe Aircraft Sensors Market Forecast by Application, 2023-2033 (US$ million)
Figure 94 Europe Aircraft Sensors Market Share Forecast by Application, 2023 & 2033 (%)
Figure 95 Europe Aircraft Sensors Market Forecast by Aircraft Type, 2023-2033 (US$ million)
Figure 96 Europe Aircraft Sensors Market Share Forecast by Aircraft Type, 2023 & 2033 (%)
Figure 97 Europe Aircraft Sensors Market Forecast by End-use, 2023-2033 (US$ million)
Figure 98 Europe Aircraft Sensors Market Share Forecast by End-use, 2023 & 2033 (%)
Figure 99 Germany Aircraft Sensors Market Forecast, 2023-2033 (US$ million, AGR %)
Figure 100 France Aircraft Sensors Market Forecast, 2023-2033 (US$ million, AGR %)
Figure 101 UK Aircraft Sensors Market Forecast, 2023-2033 (US$ million, AGR %)
Figure 102 Italy Aircraft Sensors Market Forecast, 2023-2033 (US$ million, AGR %)
Figure 103 Spain Aircraft Sensors Market Forecast, 2023-2033 (US$ million, AGR %)
Figure 104 Russia Aircraft Sensors Market Forecast, 2023-2033 (US$ million, AGR %)
Figure 105 Rest of Europe Aircraft Sensors Market Forecast, 2023-2033 (US$ million, AGR %)
Figure 106 Asia-Pacific Aircraft Sensors Market Attractiveness Index
Figure 107 Asia-Pacific Aircraft Sensors Market by Region, 2023, 2028 & 2033 (US$ million)
Figure 108 Asia-Pacific Aircraft Sensors Market Forecast by Country, 2023-2033 (US$ million)
Figure 109 Asia-Pacific Aircraft Sensors Market Share Forecast by Country, 2023 & 2033 (%)
Figure 110 Asia-Pacific Aircraft Sensors Market Forecast by Sensor Type, 2023-2033 (US$ million)
Figure 111 Asia-Pacific Aircraft Sensors Market Share Forecast by Sensor Type, 2023 & 2033 (%)
Figure 112 Asia-Pacific Aircraft Sensors Market Forecast by Application, 2023-2033 (US$ million)
Figure 113 Asia-Pacific Aircraft Sensors Market Share Forecast by Application, 2023 & 2033 (%)
Figure 114 Asia-Pacific Aircraft Sensors Market Forecast by Aircraft Type, 2023-2033 (US$ million)
Figure 115 Asia-Pacific Aircraft Sensors Market Share Forecast by Aircraft Type, 2023 & 2033 (%)
Figure 116 Asia-Pacific Aircraft Sensors Market Forecast by End-use, 2023-2033 (US$ million)
Figure 117 Asia-Pacific Aircraft Sensors Market Share Forecast by End-use, 2023 & 2033 (%)
Figure 118 Japan Aircraft Sensors Market Forecast, 2023-2033 (US$ million, AGR %)
Figure 119 China Aircraft Sensors Market Forecast, 2023-2033 (US$ million, AGR %)
Figure 120 India Aircraft Sensors Market Forecast, 2023-2033 (US$ million, AGR %)
Figure 121 Australia Aircraft Sensors Market Forecast, 2023-2033 (US$ million, AGR %)
Figure 122 Singapore Aircraft Sensors Market Forecast, 2023-2033 (US$ million, AGR %)
Figure 123 Rest of APAC Aircraft Sensors Market Forecast, 2023-2033 (US$ million, AGR %)
Figure 124 Middle East & Africa Aircraft Sensors Market Attractiveness Index
Figure 125 Middle East & Africa Aircraft Sensors Market by Region, 2023, 2028 & 2033 (US$ million)
Figure 126 Middle East & Africa Aircraft Sensors Market Forecast by Country, 2023-2033 (US$ million)
Figure 127 Middle East & Africa Aircraft Sensors Market Share Forecast by Country, 2023 & 2033 (%)
Figure 128 Middle East & Africa Aircraft Sensors Market Forecast by Sensor Type, 2023-2033 (US$ million)
Figure 129 Middle East & Africa Aircraft Sensors Market Share Forecast by Sensor Type, 2023 & 2033 (%)
Figure 130 Middle East & Africa Aircraft Sensors Market Forecast by Application, 2023-2033 (US$ million)
Figure 131 Middle East & Africa Aircraft Sensors Market Share Forecast by Application, 2023 & 2033 (%)
Figure 132 Middle East & Africa Aircraft Sensors Market Forecast by Aircraft Type, 2023-2033 (US$ million)
Figure 133 Middle East & Africa Aircraft Sensors Market Share Forecast by Aircraft Type, 2023 & 2033 (%)
Figure 134 Middle East & Africa Aircraft Sensors Market Forecast by End-use, 2023-2033 (US$ million)
Figure 135 Middle East & Africa Aircraft Sensors Market Share Forecast by End-use, 2023 & 2033 (%)
Figure 136 GCC Aircraft Sensors Market Forecast, 2023-2033 (US$ million, AGR %)
Figure 137 South Africa Aircraft Sensors Market Forecast, 2023-2033 (US$ million, AGR %)
Figure 138 Rest of MEA Aircraft Sensors Market Forecast, 2023-2033 (US$ million, AGR %)
Figure 139 Latin America Aircraft Sensors Market Attractiveness Index
Figure 140 Latin America Aircraft Sensors Market by Region, 2023, 2028 & 2033 (US$ million)
Figure 141 Latin America Aircraft Sensors Market Forecast by Country, 2023-2033 (US$ million)
Figure 142 Latin America Aircraft Sensors Market Share Forecast by Country, 2023 & 2033 (%)
Figure 143 Latin America Aircraft Sensors Market Forecast by Sensor Type, 2023-2033 (US$ million)
Figure 144 Latin America Aircraft Sensors Market Share Forecast by Sensor Type, 2023 & 2033 (%)
Figure 145 Latin America Aircraft Sensors Market Forecast by Application, 2023-2033 (US$ million)
Figure 146 Latin America Aircraft Sensors Market Share Forecast by Application, 2023 & 2033 (%)
Figure 147 Latin America Aircraft Sensors Market Forecast by Aircraft Type, 2023-2033 (US$ million)
Figure 148 Latin America Aircraft Sensors Market Share Forecast by Aircraft Type, 2023 & 2033 (%)
Figure 149 Latin America Aircraft Sensors Market Forecast by End-use, 2023-2033 (US$ million)
Figure 150 Latin America Aircraft Sensors Market Share Forecast by End-use, 2023 & 2033 (%)
Figure 151 Brazil Aircraft Sensors Market Forecast, 2023-2033 (US$ million, AGR %)
Figure 152 Mexico Aircraft Sensors Market Forecast, 2023-2033 (US$ million, AGR %)
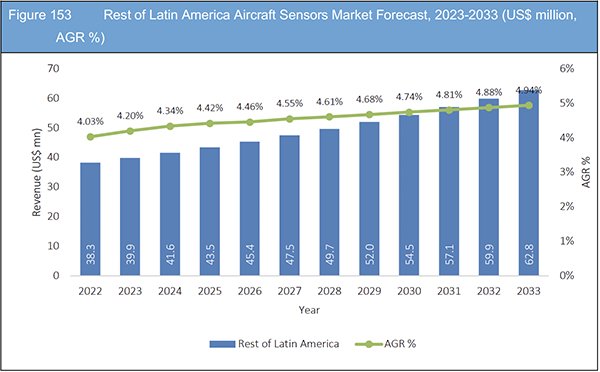
Figure 153 Rest of Latin America Aircraft Sensors Market Forecast, 2023-2033 (US$ million, AGR %)
Figure 154 Aircraft Sensors Market: Company Share/Ranking, 2021
Figure 155 Honeywell International Inc.: Net Revenue, 2017-2021 (US$ million, AGR%)
Figure 156 Honeywell International Inc.: R&D, 2017-2021 (US$ million, AGR%)
Figure 157 Honeywell International Inc.: Regional Market Shares, 2021
Figure 158 TE Connectivity Ltd.: Net Revenue, 2017-2021 (US$ million, AGR%)
Figure 159 TE Connectivity Ltd.: R&D, 2017-2021 (US$ million, AGR%)
Figure 160 TE Connectivity Ltd.: Regional Market Shares, 2021
Figure 161 Meggitt PLC: Net Revenue, 2017-2021 (US$ million, AGR%)
Figure 162 Meggitt PLC: R&D, 2017-2021 (US$ million, AGR%)
Figure 163 Meggitt PLC: Regional Market Shares, 2021
Figure 164 Eaton Corporation plc: Net Revenue, 2017-2021 (US$ million, AGR%)
Figure 165 Eaton Corporation plc: R&D, 2017-2021 (US$ million, AGR%)
Figure 166 Eaton Corporation plc: Regional Market Shares, 2021
Figure 167 Ametek, Inc.: Net Revenue, 2017-2021 (US$ million, AGR%)
Figure 168 Ametek, Inc.: R&D, 2017-2021 (US$ million, AGR%)
Figure 169 Ametek, Inc.: Regional Market Shares, 2021
Figure 170 Thales Group: Net Revenue, 2017-2021 (US$ million, AGR%)
Figure 171 Thales Group: R&D, 2017-2021 (US$ million, AGR%)
Figure 172 Thales Group: Regional Market Shares, 2021
Figure 173 Raytheon Technologies Corporation: Net Revenue, 2017-2021 (US$ million, AGR%)
Figure 174 Raytheon Technologies Corporation: R&D, 2017-2021 (US$ million, AGR%)
Figure 175 Raytheon Technologies Corporation: Regional Market Shares, 2021
Figure 176 General Electric Company: Net Revenue, 2017-2021 (US$ million, AGR%)
Figure 177 General Electric Company: R&D, 2017-2021 (US$ million, AGR%)
Figure 178 General Electric Company: Regional Market Shares, 2021
Figure 179 L3Harris Technologies Inc.: Net Revenue, 2017-2021 (US$ million, AGR%)
Figure 180 L3Harris Technologies Inc.: R&D, 2017-2021 (US$ million, AGR%)
Figure 181 L3Harris Technologies Inc.: Regional Market Shares, 2021
Figure 182 Safran SA: Net Revenue, 2017-2021 (US$ million, AGR%)
Figure 183 Safran SA: R&D, 2017-2021 (US$ million, AGR%)
Figure 184 Safran SA: Regional Market Shares, 2021
Figure 185 Woodward, Inc.: Net Revenue, 2017-2021 (US$ million, AGR%)
Figure 186 Woodward, Inc.: R&D, 2017-2021 (US$ million, AGR%)
Figure 187 Woodward, Inc.: Regional Market Shares, 2021
Figure 188 Curtiss-Wright Corporation: Net Revenue, 2017-2021 (US$ million, AGR%)
Figure 189 Curtiss-Wright Corporation: R&D, 2017-2021 (US$ million, AGR%)
Figure 190 Curtiss-Wright Corporation: Regional Market Shares, 2021
List of Companies Profiled in the Report
Ametek Inc.
Curtiss-Wright Corporation
Eaton Corporation plc
General Atomics
General Electric Company
Honeywell International Inc.
Hydra-Electric Company
L3 Harris Technologies, Inc.
Meggitt PLC
Safran SA
TE Connectivity Ltd.
Thales Group
The Raytheon Company
United Electric Controls (UE)
Woodward, Inc.
List of Other Companies Mentioned in the Report
2MoRO
Accelya
Aerialtronics
Airbus
Aircraft Maintenance Systems
Airline Software Applications Aps
Airport Analytics (AA+)
AirSuite
AV-Base Systems
Aviation Analytics Ltd.
Beep Analytics
Boeing
Booz Allen Hamilton
C3.ai
CGI
Cirium
Decision Software Systems
Delair
Enspan
FL3XX
Flightmapper.io
Flock
FLY Online Tools
Flylogs
ForeFlight
Goal Systems
HangarHero
Harris Corporatio
IBS Software
Instacart
Jugnoo
Kespry
Lufthansa Technik
Mercator Limited
MRX Systems
OAG
Parrot
Purolator
QAV Aviation Systems
Ricoh USA
Roadie
Rusada
Sabre
SITA
SmartBox
Soma Software
SysAIO
Tookan
Tracware Ltd.
TRAX
UpKeep Maintenance Management
UPS Flight Forward
Wipro
List of Associations Mentioned in the Report
Academy of Model Aeronautics (AMA)
Aerospace Arizona Association
Aerospace Industry Development Association
Airborne Sensor Operators Group (ASOG)
Airports Authority of India
Airports Council International
AMA Association for Sensor Technology
American Association of Airport Executives
Arab Air Carriers Organization
Civil Air Navigation Services Organization
Civil Air Transport
Civil Aviation Authority of Norway
Civil Aviation Authority of Singapore
Civil Aviation Safety Authority
Commercial Drone Alliance
Department of Defense (DoD)
Directorate General of Civil Aviation
Eurocontrol
European Union Aviation Safety Agency
Experimental Aircraft Association (EAA)
Federal Aviation Administration
Flight Safety Foundation (FSA)
ICUAS Association, Inc.
IEEE Sensors Council
Innovate UK KTN
International Air Transport Association (IATA)
International Civil Aviation Organization
Irish Aviation Authority
MEMS and Sensors Industry Group (MSIG)
Middle East Business Aviation Association
Ministry of Civil Aviation
NASA
National Air Transport Association
Professional Aviation Maintenance Association
Tanzania Aviation Authority of Norway
UK Civil Aviation Authority (CAA)

