Industries > Defence > Military Radar System Market Report 2021-2031

Military Radar System Market Report 2021-2031
Forecasts by Waveform (Frequency Modulated Continuous Wave (FMCW), Doppler), by Technology (Software-Defined Radar (SDR), Quantum Radar Traditional/Noise Radar, RF Microwave Assemblies), by Application (Air & Missile Defence, Ground Surveillance, Mine Detection & Underground Mapping, Heavy Component Removal, Other), by Product Type (Ground Penetrating Radar, Weapon Locating Radar & CRAM, Moving Target Indicator Radar, Surveillance & Airborne Early Warning, Tracking & Fire Control Radar, Other), by Frequency Band (VHF/UHF Band, L Band, X Band, Ku/Ka/K Band, Other), by End-user (Air Force, Navy, Army, Space-Based Radar) AND Regional and Leading National Market Analysis PLUS Analysis of Leading Companies AND COVID-19 Recovery Scenarios
The Military Radar System Market Report 2021-2031: This report will prove invaluable to leading firms striving for new revenue pockets if they wish to better understand the industry and its underlying dynamics. It will be useful for companies that would like to expand into different industries or to expand their existing operations in a new region.
Increasing Number Of Inter-Country Conflicts
Since the United Nations was founded 75 years ago, the nature of conflict and violence has changed dramatically. Conflicts are now less lethal and more frequently fought between domestic groups rather than states. Homicides are growing increasingly common in some regions of the world, while gender-based violence is on the rise worldwide. Interpersonal violence’s long-term influence on development, especially violence against children, is increasingly becoming more well recognised. Separately, improvements in technology have sparked fears about lethal autonomous weapons and cyberattacks, as well as the weaponization of bots and drones and the livestreaming of terrorist assaults. There has also been an increase in criminal behaviour, such as data hacking and ransomware. Meanwhile, international cooperation is strained, reducing the global capacity for preventing and resolving all types of conflict and violence.
What Are These Questions You Should Ask Before Buying A Market Research Report?
• How is the military radar system market evolving?
• What is driving and restraining the military radar system market?
• How will each military radar system submarket segment grow over the forecast period and how much revenue will these submarkets account for in 2031?
• How will the market shares for each military radar system submarket develop from 2021 to 2031?
• What will be the main driver for the overall market from 2021 to 2031?
• Will leading military radar system markets broadly follow the macroeconomic dynamics, or will individual national markets outperform others?
• How will the market shares of the national markets change by 2031 and which geographical region will lead the market in 2031?
• Who are the leading players and what are their prospects over the forecast period?
• What are the military radar system projects for these leading companies?
• How will the industry evolve during the period between 2020 and 2031?
• What are the implication of military radar system projects taking place now and over the next 10 years?
• Is there a greater need for product commercialisation to further scale the military radar system market?
• Where is the military radar system market heading? And how can you ensure you are at the forefront of the market?
• What can be the best investment options for new product and service lines?
• What are the key prospects for moving companies into a new growth path? C-suite?
You need to discover how this will impact the military radar system market today, and over the next 10 years:
• Our 749-page report provides 435 tables and 434 charts/graphs exclusively to you.
• The report highlights key lucrative areas in the industry so you can target them – NOW.
• Contains in-depth analyse of global, regional and national sales and growth
• Highlights for you the key successful trends, changes and revenue projections made by your competitors
This report tells you TODAY how the military radar system market will develop in the next 10 years, and in-line with the variations in COVID-19 economic recession and bounce. This market is more critical now than at any point over the last 10 years.
Delivers exclusive COVID-19 variations economic data specific to your market.
To access the data contained in this document please email contactus@visiongain.com
Forecasts to 2031 and other analyses reveal the commercial prospects
• In addition to revenue forecasting to 2031, our new study provides you with recent results, growth rates, and market shares.
• You find original analyses, with business outlooks and developments.
• Discover qualitative analyses (including market dynamics, drivers, opportunities, restraints and challenges), cost structure, impact of rising military radar system prices and recent developments.
This report includes data analysis and invaluable insight into how COVID-19 will affect the industry and your company. Four COVID-19 recovery patterns and their impact, namely, V, L, W and U are discussed in this report.
Global Military Radar System Market (COVID Impact Analysis) by End-User
• Air Force
• Navy
• Army
• Space-Based Radar
Global Military Radar System Market (COVID Impact Analysis) by Frequency Band
• VHF/UHF Band
• L Band
• X Band
• Ku/Ka/K Band
• Other Frequency Band
Global Military Radar System Market (COVID Impact Analysis) by Product Type
• Ground Penetrating Radar
• Weapon Locating Radar & C-RAM
• Moving Target Indicator Radar
• Surveillance & Airborne Early Warning
• Tracking & Fire Control Radar
• Other Product Type
Global Military Radar System Market (COVID Impact Analysis) by Application
• Air & Missile Defense
• Ground Surveillance
• Mine Detection & Underground Mapping
• Other Application
Global Military Radar System Market (COVID Impact Analysis) by Technology
• Software-Defined Radar (SDR)
• Quantum Radar
• Traditional/Noise Radar
• RF Microwave Assemblies
Global Military Radar System Market (COVID Impact Analysis) by Waveform
• Frequency Modulated Continuous Wave (FMCW)
• Doppler

In addition to the revenue predictions for the overall world market and segments, you will also find revenue forecasts for 4 regional and 20 leading national markets:
• North America Military Radar System Market, 2021 to 2031 Market Outlook
• U.S. Military Radar System Market, 2021 to 2031 Market Forecast & COVID Impact Analysis
• Canada Military Radar System Market, 2021 to 2031 Market Forecast & COVID Impact Analysis
• Mexico Military Radar System Market, 2021 to 2031 Market Forecast & COVID Impact Analysis
• Europe Military Radar System Market, 2021 to 2031 Market Outlook
• Germany Military Radar System Market, 2021 to 2031 Market Forecast & COVID Impact Analysis
• Spain Military Radar System Market, 2021 to 2031 Market Forecast & COVID Impact Analysis
• United Kingdom Military Radar System Market, 2021 to 2031 Market Forecast & COVID Impact Analysis
• France Military Radar System Market, 2021 to 2031 Market Forecast & COVID Impact Analysis
• Italy Military Radar System Market, 2021 to 2031 Market Forecast & COVID Impact Analysis
• Rest of Europe Market Forecast & COVID Impact Analysis
• Asia Pacific Military Radar System Market, 2021 to 2031 Market Outlook
• China Military Radar System Market, 2021 to 2031 Market Forecast & COVID Impact Analysis
• Japan Military Radar System Market, 2021 to 2031 Market Forecast & COVID Impact Analysis
• India Military Radar System Market, 2021 to 2031 Market Forecast & COVID Impact Analysis
• Australia Military Radar System Market, 2021 to 2031 Market Forecast & COVID Impact Analysis
• South Korea Military Radar System Market, 2021 to 2031 Market Forecast & COVID Impact Analysis
• Rest of Asia Pacific Market Forecast & COVID Impact Analysis
• Latin America Military Radar System Market, 2021 to 2031 Market Outlook
• Brazil Military Radar System Market, 2021 to 2031 Market Forecast & COVID Impact Analysis
• Mexico Military Radar System Market, 2021 to 2031 Market Forecast & COVID Impact Analysis
• Argentina Military Radar System Market, 2021 to 2031 Market Forecast & COVID Impact Analysis
• Rest of Latin America Military Radar System Market, 2021 to 2031 Market Forecast & COVID Impact Analysis
• Middle East & Africa Military Radar System Market, 2021 to 2031 Market Outlook
• Israel Military Radar System Market, 2021 to 2031 Market Forecast & COVID Impact Analysis
• Turkey Military Radar System Market, 2021 to 2031 Market Forecast & COVID Impact Analysis
• Saudi Arabia Military Radar System Market, 2021 to 2031 Market Forecast & COVID Impact Analysis
• South Africa Military Radar System Market, 2021 to 2031 Market Forecast & COVID Impact Analysis
• UAE Military Radar System Market, 2021 to 2031 Market Forecast & COVID Impact Analysis
• Rest of Middle East and Africa Military Radar System Market, 2021 to 2031 Market Forecast & COVID Impact Analysis
Need industry data? Please contact us today.
The report also includes profiles and for some of the leading companies in the Military Radar System Market, 2021 to 2031, with a focus on this segment of these companies’ operations.
Leading companies and the potential for market growth
• Bae Systems
• Ball Aerospace and Technologies Corp.
• Blighter Surveillance Systems Ltd.
• CEA Technologies
• Dassault Aviation
• Elbit Systems Limited
• Flir Systems Inc.
• General Atomics Aeronautical Systems, Inc.
• General Dynamics
• Honeywell International Inc
• Israel Aerospace Industries
• L3 Harris Technologies Inc.
• Leonardo Spa
• Lockheed Martin Corporation
• Mercury Systems Inc.
• Northrop Grumman Corporation
• Raytheon Technologies Corp
• Rheinmetal AG
• Saab AB
• Thales SA
Overall world revenue for Military Radar System Market, 2021 to 2031 in terms of value the market will surpass US$xx million in 2021, our work calculates. We predict strong revenue growth through to 2031. Our work identifies which organizations hold the greatest potential. Discover their capabilities, progress, and commercial prospects, helping you stay ahead.
How the Military Radar System Market, 2021 to 2031 Market report helps you?
In summary, our 748+ page report provides you with the following knowledge:
• Revenue forecasts to 2031 for Military Radar System Market, 2021 to 2031 Market, with forecasts for end-user, Frequency Band, Product Type, application, technology, waveform each forecasted at a global and regional level– discover the industry’s prospects, finding the most lucrative places for investments and revenues
• Revenue forecasts to 2031 for 4 regional and 20 key national markets – See forecasts for the Military Radar System Market, 2021 to 2031 market in North America, Europe, Asia-Pacific and LAMEA. Also forecasted is the market in the US, Canada, Mexico, Brazil, Germany, France, UK, Italy, China, India, Japan, and Australia among other prominent economies.
• Prospects for established firms and those seeking to enter the market– including company profiles for 20 of the major companies involved in the Military Radar System Market, 2021 to 2031 Market.
Find quantitative and qualitative analyses with independent predictions. Receive information that only our report contains, staying informed with this invaluable business intelligence.
Information found nowhere else
With our newly report title, you are less likely to fall behind in knowledge or miss out on opportunities. See how our work could benefit your research, analyses, and decisions. Visiongain’s study is for everybody needing commercial analyses for the Military Radar System Market, 2021 to 2031 Market and leading companies. You will find data, trends and predictions.
To access the data contained in this document please email contactus@visiongain.com
Buy our report today Military Radar System Market Report 2021-2031: Forecasts by Waveform (Frequency Modulated Continuous Wave (FMCW), Doppler), by Technology (Software-Defined Radar (SDR), Quantum Radar Traditional/Noise Radar, RF Microwave Assemblies), by Application (Air & Missile Defence, Ground Surveillance, Mine Detection & Underground Mapping, Heavy Component Removal, Other), by Product Type (Ground Penetrating Radar, Weapon Locating Radar & CRAM, Moving Target Indicator Radar, Surveillance & Airborne Early Warning, Tracking & Fire Control Radar, Other), by Frequency Band (VHF/UHF Band, L Band, X Band, Ku/Ka/K Band, Other), by End-user (Air Force, Navy, Army, Space-Based Radar) AND Regional and Leading National Market Analysis PLUS Analysis of Leading Companies AND COVID-19 Recovery Scenarios. Avoid missing out by staying informed – order our report now.
Visiongain is a trading partner with the US Federal Government
CCR Ref number: KD4R6
Do you have any custom requirements we can help you with? Any need for a specific country, geo region, market segment or specific company information? Contact us today, we can discuss your needs and see how we can help: sara.peerun@visiongain.com
1.1 Introduction to Military Radar System Market
1.2 Global Military Radar System Market Overview
1.3 What are the Objectives of this Report?
1.4 What is the Scope of the Report?
1.5 Why You Should Read This Report
1.6 What This Report Delivers
1.7 Key Questions Answered By This Analytical Report Include:
1.8 Who is This Report for?
1.9 Research Methodology
1.9.1 Primary Research
1.9.2 Secondary Research
1.9.3 Market Evaluation & Forecasting Methodology
1.10 Frequently Asked Questions (FAQs)
1.11 Associated Visiongain Reports
1.12 About Visiongain
2 Executive Summary
3 Global Market Dynamics
3.1 COVID-19 Impact On The Global Military Radars Market
3.2 Current Trends in the Global Market
3.3 Market Driving Factors
3.3.1 Increasing Number Of Inter-Country Conflicts
3.3.2 Growing Defense Budget of Major Countries Across the Globe
3.3.3 Growth In Use Of Radar Systems
3.3.4 Demand For Surveillance Equipment And System
3.3.5 Increasing Procurement Of Radar And Air Defense System
3.3.6 The Increasing Modernization Of Warfare Will Have A Positive Impact On Market Growth.
3.4 Market Restraining Factors
3.4.1 High Maintenance Of Radars
3.4.2 High Manufacturing Costs
3.4.3 Alternative Technologies
3.5 Opportunities in the Global Market
3.5.1 New-Generation Air And Missile Defence Systems Are Required.
3.5.2 Advancement In Technology Of Miltary Radar System
3.6 Challenges in the Global Market
3.6.1 New Radar Jamming Techniques
3.6.2 Sparse Sensing And Sparse Array Design In Radar
3.6.3 Radar Waveform Optimization
3.6.4 Cognitive Radar
3.6.5 Machine Learning For Radar
3.6.6 Coexistence Of Radar And Communication Systems
3.6.7 Radar For Advanced Driver Assistance Systems
3.6.8 Radar For Biomedicine And E-Healthcare
3.6.9 Micro-Doppler Radar
3.7 SWOT Analysis:
3.7.1 Strengths
3.7.1.1 Increasing Number Of Inter-Country Conflicts
3.7.1.2 Demand For Surveillance Equipment And System
3.7.1.3 Increasing Procurement Of Radar And Air Defense System
3.7.2 Weaknesses
3.7.2.1 High Manufacturing Costs
3.7.2.2 High Maintenance Of Radars
3.7.3 Opportunities
3.7.3.1 Advancement In Technology Of Miltary Radar System
3.7.4 Threats
3.7.4.1 New Radar Jamming Techniques
3.7.4.2 Radar Waveform Optimization
3.8 PESTEL Analysis
3.8.1 Political Factors
3.8.1.1 Rising Military Tensions and Political Instability Increasing Demand for Radars
3.8.1.2 High Government Intervention and Bureaucracy Affects Market Growth
3.8.2 Economic Factors
3.8.2.1 Emerging Markets
3.8.2.2 Globalization Making Way for Joint Venture and FDIs
3.8.2.3 Economic Slowdown
3.8.3 Social Factors
3.8.3.1 Investments in New Airport Construction Increasing Demand for Air Traffic Control Radars
3.8.4 Technological Factors
3.8.5 Legal Factors
3.8.5.1 Stringent Regulations on Radar Manufacturing
3.8.6 Environmental Factors
3.8.6.1 Rising Incidences of Hurricanes and Floods Increasing Demand for Weather Radars
3.8.6.2 Advanced Radars to Study Climate Change
3.9 Porter’s Five Forces Analysis
3.9.1 Industry Rivalry
3.9.2 Bargaining Power of Buyers
3.9.3 Bargaining Power of Suppliers
3.9.4 Threat of New Entrants
3.9.5 Threat of Substitutes
3.10 Supply Chain Analysis
3.10.1 Radar system components
3.10.1.1 Transmitter
3.10.1.2 Duplexer
3.10.1.3 Receiver
3.10.1.4 Radar Antenna
3.10.1.5 Indicator
3.10.2 Radar System Manufacturers
4 Global Military Radar System Market Analysis
4.1 Global Market Outlook
4.2 Global Market Size Estimation and Forecast
4.2.1 Pre-COVID-19 Market Scenario
4.2.2 Post-COVID-19 Market Scenarios (V, W, U, L-Shaped Recovery Analysis)
5 Global Military Radar System Market Analysis By Region
5.1 North America
5.2 Europe
5.3 Asia Pacific
5.4 Latin America
5.5 Middle East & Africa
5.6 Regional Market Size Estimation and Forecast
5.6.1 Pre-COVID-19 Market Scenario
5.6.2 Post-COVID-19 Market Scenarios (V, W, U, L-Shaped Recovery Analysis)
6 Global Military Radar System Market Analysis By End-User
6.1 Air Force
6.2 Navy
6.3 Army
6.4 Space-Based Radar
6.5 Global Market Size Estimation and Forecast By End-User
6.5.1 Pre-COVID-19 Market Scenario
6.5.2 Post-COVID-19 Market Scenarios (V, W, U, L-Shaped Recovery Analysis)
7 Global Military Radar System Market Analysis By Frequency Band
7.1 VHF/UHF Band
7.2 L Band
7.3 X Band
7.4 Ku/Ka/K Band
7.5 Global Market Size Estimation and Forecast by Frequency Band
7.5.1 Pre-COVID-19 Market Scenario
7.5.2 Post-COVID-19 Market Scenarios (V, W, U, L-Shaped Recovery Analysis)
8 Global Military Radar System Market Analysis By Product Type
8.1 Ground Penetrating Radar
8.2 Weapon Locating Radar & C-RAM
8.3 Moving Target Indicator Radar
8.4 Surveillance & Airborne Early Warning
8.5 Tracking & Fire Control Radar
8.6 Global Market Size Estimation and Forecast By Product Type
8.6.1 Pre-COVID-19 Market Scenario
8.6.2 Post-COVID-19 Market Scenarios (V, W, U, L-Shaped Recovery Analysis)
9 Global Military Radar System Market Analysis By Application
9.1 Air & Missile Defense
9.2 Ground Surveillance
9.3 Mine Detection & Underground Mapping
9.4 Global Market Size Estimation and Forecast By Application
9.4.1 Pre-COVID-19 Market Scenario
9.4.2 Post-COVID-19 Market Scenarios (V, W, U, L-Shaped Recovery Analysis)
10 Global Military Radar System Market Analysis By Technology
10.1 Software-Defined Radar (SDR)
10.2 Quantum Radar
10.3 Traditional/Noise Radar
10.4 RF Microwave Assemblies
10.5 Global Market Size Estimation and Forecast By Technology
10.5.1 Pre-COVID-19 Market Scenario
10.5.2 Post-COVID-19 Market Scenarios (V, W, U, L-Shaped Recovery Analysis)
11 Global Military Radar System Market Analysis By Waveform
11.1 Frequency Modulated Continuous Wave (FMCW)
11.2 Doppler
11.3 Global Market Size Estimation and Forecast By Waveform
11.3.1 Pre-COVID-19 Market Scenario
11.3.2 Post-COVID-19 Market Scenarios (V, W, U, L-Shaped Recovery Analysis)
12 North America Military Radar System Market Analysis
12.1 North America Increasing Defense Budget Is To Drive The Market
12.2 North America Demand Of Threat Intelligence Will Drive The Market
12.3 North America Market Size Estimation and Forecast
12.3.1 Pre-COVID-19 Market Scenario
12.3.2 Post-COVID-19 Market Scenarios (V, W, U, L-Shaped Recovery Analysis)
12.4 Country Market Size Estimation and Forecast
12.4.1 Pre-COVID-19 Market Scenario
12.4.2 Post-COVID-19 Market Scenarios (V, W, U, L-Shaped Recovery Analysis)
12.5 North America Market Size Estimation and Forecast By End-User
12.5.1 Pre-COVID-19 Market Scenario
12.5.2 Post-COVID-19 Market Scenarios (V, W, U, L-Shaped Recovery Analysis)
12.6 North America Market Size Estimation and Forecast By Frequency Band
12.6.1 Pre-COVID-19 Market Scenario
12.6.2 Post-COVID-19 Market Scenarios (V, W, U, L-Shaped Recovery Analysis)
12.7 North America Market Size Estimation and Forecast By Product Type
12.7.1 Pre-COVID-19 Market Scenario
12.7.2 Post-COVID-19 Market Scenarios (V, W, U, L-Shaped Recovery Analysis)
12.8 North America Market Size Estimation and Forecast By Application
12.8.1 Pre-COVID-19 Market Scenario
12.8.2 Post-COVID-19 Market Scenarios (V, W, U, L-Shaped Recovery Analysis)
12.9 North America Market Size Estimation and Forecast By Technology
12.9.1 Pre-COVID-19 Market Scenario
12.9.2 Post-COVID-19 Market Scenarios (V, W, U, L-Shaped Recovery Analysis)
12.10 North America Market Size Estimation and Forecast By Waveform
12.10.1 Pre-COVID-19 Market Scenario
12.10.2 Post-COVID-19 Market Scenarios (V, W, U, L-Shaped Recovery Analysis)
12.11 US Military Radar System Market Analysis
12.11.1 In The United States, Military Spending Has Been Considered To Be The Second-Largest Allocation In The Federal Budget, After Social Security.
12.11.2 Defense Department is asking Congress for $715 billion
12.11.3 Pre-COVID-19 Market Scenario
12.11.4 Post-COVID-19 Market Scenarios (V, W, U, L-Shaped Recovery Analysis)
12.12 Canada Military Radar System Market Analysis
12.12.1 Government Awards Military Radar Contract To Firm That Failed To Complete The Same Project Six Years Earlier
12.12.2 Canada Driving Security Innovation In Defence And Intelligence
12.12.3 Pre-COVID-19 Market Scenario
12.12.4 Post-COVID-19 Market Scenarios (V, W, U, L-Shaped Recovery Analysis)
13 Europe Military Radar System Market Analysis
13.1 Increase In Defense Budget Will Drive The Market In Europe
13.2 Sensor Suite In Development For Future European Combat Air System
13.3 Europe Market Size Estimation and Forecast
13.3.1 Pre-COVID-19 Market Scenario
13.3.2 Post-COVID-19 Market Scenarios (V, W, U, L-Shaped Recovery Analysis)
13.4 Country Market Size Estimation and Forecast
13.4.1 Pre-COVID-19 Market Scenario
13.4.2 Post-COVID-19 Market Scenarios (V, W, U, L-Shaped Recovery Analysis)
13.5 Europe Market Size Estimation and Forecast By End-User
13.5.1 Pre-COVID-19 Market Scenario
13.5.2 Post-COVID-19 Market Scenarios (V, W, U, L-Shaped Recovery Analysis)
13.6 Europe Market Size Estimation and Forecast By Frequency Band
13.6.1 Pre-COVID-19 Market Scenario
13.6.2 Post-COVID-19 Market Scenarios (V, W, U, L-Shaped Recovery Analysis)
13.7 Europe Market Size Estimation and Forecast By Product Type
13.7.1 Pre-COVID-19 Market Scenario
13.7.2 Post-COVID-19 Market Scenarios (V, W, U, L-Shaped Recovery Analysis)
13.8 Europe Market Size Estimation and Forecast By Application
13.8.1 Pre-COVID-19 Market Scenario
13.8.2 Post-COVID-19 Market Scenarios (V, W, U, L-Shaped Recovery Analysis)
13.9 Europe Market Size Estimation and Forecast By Technology
13.9.1 Pre-COVID-19 Market Scenario
13.9.2 Post-COVID-19 Market Scenarios (V, W, U, L-Shaped Recovery Analysis)
13.10 Europe Market Size Estimation and Forecast By Waveform
13.10.1 Pre-COVID-19 Market Scenario
13.10.2 Post-COVID-19 Market Scenarios (V, W, U, L-Shaped Recovery Analysis)
13.11 Germany Military Radar System Market Analysis
13.11.1 IAI And Hensoldt Team Up For German Ballistic Missile Defense Radar
13.11.2 Hensoldt To Develop AESA Radar For German And Spanish Eurofighters
13.11.3 Pre-COVID-19 Market Scenario
13.11.4 Post-COVID-19 Market Scenarios (V, W, U, L-Shaped Recovery Analysis)
13.12 UK Military Radar System Market Analysis
13.12.1 Despite The Impact Of The COVID-19 Pandemic On The Country’s Economy, The Government Announced That It Plans To Increase Its Military Budget
13.12.2 RAF Chooses Indra To Deliver LTR25 Deployable Military Radar System
13.12.3 Pre-COVID-19 Market Scenario
13.12.4 Post-COVID-19 Market Scenarios (V, W, U, L-Shaped Recovery Analysis)
13.13 France Military Radar System Market Analysis
13.13.1 French Defence Spending Is Expected To Reach $56.1 Billion In 2021 As The Country Invests In Its Domestic Defence Industry.
13.13.2 France’s ‘Strategic Autonomy’ Takes To Space
13.13.3 Pre-COVID-19 Market Scenario
13.13.4 Post-COVID-19 Market Scenarios (V, W, U, L-Shaped Recovery Analysis)
13.14 Italy Military Radar System Market Analysis
13.14.1 Impact of COVID-19 on Italy Market:
13.14.2 Italy – Gulfstream G550 Aircraft With Airborne Intelligence, Surveillance, Reconnaissance, And Electronic Warfare (Aisrew) Mission Systems
13.14.3 Pre-COVID-19 Market Scenario
13.14.4 Post-COVID-19 Market Scenarios (V, W, U, L-Shaped Recovery Analysis)
13.15 Spain Military Radar System Market Analysis
13.15.1 Indra Inaugurates The Biggest Radar Factory In Spain And One Of The Biggest In Europe
13.15.2 Spain’s Indra Gets A Key Role In New Eurofighter Radar Development
13.15.3 Pre-COVID-19 Market Scenario
13.15.4 Post-COVID-19 Market Scenarios (V, W, U, L-Shaped Recovery Analysis)
13.16 Rest of Europe Military Radar System Market Analysis
13.16.1 Pre-COVID-19 Market Scenario
13.16.2 Post-COVID-19 Market Scenarios (V, W, U, L-Shaped Recovery Analysis)
14 Asia-Pacific Military Radar System Market Analysis
14.1 Countries In The Asia-Pacific Region, Such As China And India, Are Investing Heavily Toward Strengthening Their Defense Capabilities
14.2 Growing Air Force Sector Will Drive The Miltary Radar System Market
14.3 Asia-Pacific Market Size Estimation and Forecast
14.3.1 Pre-COVID-19 Market Scenario
14.3.2 Post-COVID-19 Market Scenarios (V, W, U, L-Shaped Recovery Analysis)
14.4 Country Market Size Estimation and Forecast
14.4.1 Pre-COVID-19 Market Scenario
14.4.2 Post-COVID-19 Market Scenarios (V, W, U, L-Shaped Recovery Analysis)
14.5 Asia-Pacific Market Size Estimation and Forecast By End-User
14.5.1 Pre-COVID-19 Market Scenario
14.5.2 Post-COVID-19 Market Scenarios (V, W, U, L-Shaped Recovery Analysis)
14.6 Asia-Pacific Market Size Estimation and Forecast By Frequency Band
14.6.1 Pre-COVID-19 Market Scenario
14.6.2 Post-COVID-19 Market Scenarios (V, W, U, L-Shaped Recovery Analysis)
14.7 Asia-Pacific Market Size Estimation and Forecast By Product Type
14.7.1 Pre-COVID-19 Market Scenario
14.7.2 Post-COVID-19 Market Scenarios (V, W, U, L-Shaped Recovery Analysis)
14.8 Asia-Pacific Market Size Estimation and Forecast By Application
14.8.1 Pre-COVID-19 Market Scenario
14.8.2 Post-COVID-19 Market Scenarios (V, W, U, L-Shaped Recovery Analysis)
14.9 Asia-Pacific Market Size Estimation and Forecast By Technology
14.9.1 Pre-COVID-19 Market Scenario
14.9.2 Post-COVID-19 Market Scenarios (V, W, U, L-Shaped Recovery Analysis)
14.10 Asia-Pacific Market Size Estimation and Forecast By Waveform
14.10.1 Pre-COVID-19 Market Scenario
14.10.2 Post-COVID-19 Market Scenarios (V, W, U, L-Shaped Recovery Analysis)
14.11 China Military Radar System Market Analysis
14.11.1 China to Dominate the Asia-Pacific Defense Market
14.11.2 Chinese Developed Anti-Stealth Radar Is Superior To Its Foreign Counterparts
14.11.3 Pre-COVID-19 Market Scenario
14.11.4 Post-COVID-19 Market Scenarios (V, W, U, L-Shaped Recovery Analysis)
14.12 India Military Radar System Market Analysis
14.12.1 India Is Third Highest Military Spender In The World.
14.12.2 India Bags US$ 40 Million Defence Deal To Supply 4 Radar Systems To Armenia
14.12.3 Pre-COVID-19 Market Scenario
14.12.4 Post-COVID-19 Market Scenarios (V, W, U, L-Shaped Recovery Analysis)
14.13 Japan Military Radar System Market Analysis
14.13.1 Japan To Buy Advanced U.S. Radar For Missile Defense System
14.13.2 Japan Strikes First Arms Export Deal
14.13.3 Pre-COVID-19 Market Scenario
14.13.4 Post-COVID-19 Market Scenarios (V, W, U, L-Shaped Recovery Analysis)
14.14 South Korea Military Radar System Market Analysis
14.14.1 South Korea Develops Prototype Of Advanced Radar System
14.14.2 Pre-COVID-19 Market Scenario
14.14.3 Post-COVID-19 Market Scenarios (V, W, U, L-Shaped Recovery Analysis)
14.15 Australia Military Radar System Market Analysis
14.15.1 Australia Releases Enhanced Aesa And Passive Radars Capability Plan
14.15.2 HENSOLDT Completes Radar Installation For Australian Air Traffic Control
14.15.3 Pre-COVID-19 Market Scenario
14.15.4 Post-COVID-19 Market Scenarios (V, W, U, L-Shaped Recovery Analysis)
14.16 Rest of Asia-Pacific Military Radar System Market Analysis
14.16.1 Pre-COVID-19 Market Scenario
14.16.2 Post-COVID-19 Market Scenarios (V, W, U, L-Shaped Recovery Analysis)
15 Latin America Military Radar System Market Analysis
15.1 Longstanding Border Disputes, Illegal Weapons, And Drug Traffic Across The Borders Are The Reason For Growth Of Miltary Radar System Market
15.2 The Increasing Military Spending And Changing Political Situations In Latin America Are Expected To Open Up New Market Opportunities For International Players
15.3 Latin America Market Size Estimation and Forecast
15.3.1 Pre-COVID-19 Market Scenario
15.3.2 Post-COVID-19 Market Scenarios (V, W, U, L-Shaped Recovery Analysis)
15.4 Country Market Size Estimation and Forecast
15.4.1 Pre-COVID-19 Market Scenario
15.4.2 Post-COVID-19 Market Scenarios (V, W, U, L-Shaped Recovery Analysis)
15.5 Latin America Market Size Estimation and Forecast By End-User
15.5.1 Pre-COVID-19 Market Scenario
15.5.2 Post-COVID-19 Market Scenarios (V, W, U, L-Shaped Recovery Analysis)
15.6 Latin America Market Size Estimation and Forecast By Frequency Band
15.6.1 Pre-COVID-19 Market Scenario
15.6.2 Post-COVID-19 Market Scenarios (V, W, U, L-Shaped Recovery Analysis)
15.7 Latin America Market Size Estimation and Forecast By Product Type
15.7.1 Pre-COVID-19 Market Scenario
15.7.2 Post-COVID-19 Market Scenarios (V, W, U, L-Shaped Recovery Analysis)
15.8 Latin America Market Size Estimation and Forecast By Application
15.8.1 Pre-COVID-19 Market Scenario
15.8.2 Post-COVID-19 Market Scenarios (V, W, U, L-Shaped Recovery Analysis)
15.9 Latin America Market Size Estimation and Forecast By Technology
15.9.1 Pre-COVID-19 Market Scenario
15.9.2 Post-COVID-19 Market Scenarios (V, W, U, L-Shaped Recovery Analysis)
15.10 Latin America Market Size Estimation and Forecast By Waveform
15.10.1 Pre-COVID-19 Market Scenario
15.10.2 Post-COVID-19 Market Scenarios (V, W, U, L-Shaped Recovery Analysis)
15.11 Brazil Military Radar System Market Analysis
15.11.1 Radar Station To Increase The Brazilian Aerial Surveillance Is Inaugurated In Corumbá
15.11.2 Brazil Has The Highest Market Share In The Latin American Defense Market
15.11.3 Pre-COVID-19 Market Scenario
15.11.4 Post-COVID-19 Market Scenarios (V, W, U, L-Shaped Recovery Analysis)
15.12 Mexico Military Radar System Market Analysis
15.12.1 Mexican Radar To Monitor Mexico’s Airspace
15.12.2 Mexico Demand Of Defence Products Will Drive The Market For Miltary Radar System
15.12.3 Pre-COVID-19 Market Scenario
15.12.4 Post-COVID-19 Market Scenarios (V, W, U, L-Shaped Recovery Analysis)
15.13 Argentina Military Radar System Market Analysis
15.13.1 Argentina's INVAP Develops New Radars
15.13.2 Argentina Decline In Defence Budget Would Hamper The Market Growth In Forecast Period
15.13.3 Pre-COVID-19 Market Scenario
15.13.4 Post-COVID-19 Market Scenarios (V, W, U, L-Shaped Recovery Analysis)
15.14 Rest of Latin America Military Radar System Market Analysis
15.14.1 Pre-COVID-19 Market Scenario
15.14.2 Post-COVID-19 Market Scenarios (V, W, U, L-Shaped Recovery Analysis)
16 Middle East & Africa Military Radar System Market Analysis
16.1 The Decline In Revenues Of The Governments, Due To Decreasing Oil Prices, Caused A Budget Deficit, Which Impacted The Defense Spending Of The Countries In The Middle-East.
16.2 Middle East & Africa Countries Are Concentrating On Developing Their Local Manufacturing Facilities In Defense Sector
16.3 Middle East & Africa Market Size Estimation and Forecast
16.3.1 Pre-COVID-19 Market Scenario
16.3.2 Post-COVID-19 Market Scenarios (V, W, U, L-Shaped Recovery Analysis)
16.4 Country Market Size Estimation and Forecast
16.4.1 Pre-COVID-19 Market Scenario
16.4.2 Post-COVID-19 Market Scenarios (V, W, U, L-Shaped Recovery Analysis)
16.5 Middle East & Africa Market Size Estimation and Forecast By End-User
16.5.1 Pre-COVID-19 Market Scenario
16.5.2 Post-COVID-19 Market Scenarios (V, W, U, L-Shaped Recovery Analysis)
16.6 Middle East & Africa Market Size Estimation and Forecast By Frequency Band
16.6.1 Pre-COVID-19 Market Scenario
16.6.2 Post-COVID-19 Market Scenarios (V, W, U, L-Shaped Recovery Analysis)
16.7 Middle East & Africa Market Size Estimation and Forecast By Product Type
16.7.1 Pre-COVID-19 Market Scenario
16.7.2 Post-COVID-19 Market Scenarios (V, W, U, L-Shaped Recovery Analysis)
16.8 Middle East & Africa Market Size Estimation and Forecast By Application
16.8.1 Pre-COVID-19 Market Scenario
16.8.2 Post-COVID-19 Market Scenarios (V, W, U, L-Shaped Recovery Analysis)
16.9 Middle East & Africa Market Size Estimation and Forecast By Technology
16.9.1 Pre-COVID-19 Market Scenario
16.9.2 Post-COVID-19 Market Scenarios (V, W, U, L-Shaped Recovery Analysis)
16.10 Middle East & Africa Market Size Estimation and Forecast By Waveform
16.10.1 Pre-COVID-19 Market Scenario
16.10.2 Post-COVID-19 Market Scenarios (V, W, U, L-Shaped Recovery Analysis)
16.11 Saudi Arabia Military Radar System Market Analysis
16.11.1 US Air Force Seeks Radar Solutions For Saudi Air Defence
16.11.2 AEC Showcases Advanced Military System And Technology Solutions At 2020 Electronic Warfare And Radar International Conference
16.11.3 Pre-COVID-19 Market Scenario
16.11.4 Post-COVID-19 Market Scenarios (V, W, U, L-Shaped Recovery Analysis)
16.12 UAE Military Radar System Market Analysis
16.12.1 The United Arab Emirates And Missle Defense
16.12.2 Radar From Saab Gets $1.01 Billion Follow-On Contract From UAE
16.12.3 Pre-COVID-19 Market Scenario
16.12.4 Post-COVID-19 Market Scenarios (V, W, U, L-Shaped Recovery Analysis)
16.13 Turkey Military Radar System Market Analysis
16.13.1 Turkish Defense Giant ASELSAN To Complete Work On Domestic Long-Range Radars Soon
16.13.2 Turkish Defense Industry Thrived With New Products
16.13.3 Pre-COVID-19 Market Scenario
16.13.4 Post-COVID-19 Market Scenarios (V, W, U, L-Shaped Recovery Analysis)
16.14 South Africa Military Radar System Market Analysis
16.14.1 Radar, IFF, And Datalinks Focus Of HENSOLDT's New South African Business Unit
16.14.2 Pre-COVID-19 Market Scenario
16.14.3 Post-COVID-19 Market Scenarios (V, W, U, L-Shaped Recovery Analysis)
16.15 Israel Military Radar System Market Analysis
16.15.1 US Air Force Seeks Radar Solutions For Saudi Air Defence
16.15.2 AEC Showcases Advanced Military System And Technology Solutions At 2020 Electronic Warfare And Radar International Conference
16.15.3 Pre-COVID-19 Market Scenario
16.15.4 Post-COVID-19 Market Scenarios (V, W, U, L-Shaped Recovery Analysis)
16.16 Rest of Middle East & Africa Military Radar System Market Analysis
16.16.1 Pre-COVID-19 Market Scenario
16.16.2 Post-COVID-19 Market Scenarios (V, W, U, L-Shaped Recovery Analysis)
17 Leading Company Profiles
17.1 Elbit Systems Limited
17.1.1 Company Snapshot
17.1.2 Company Overview
17.1.3 Company Financial Profile
17.1.4 Company Product Benchmarking
17.1.5 Company Recent Developments
17.2 L3 Harris Technologies Inc.
17.2.1 Company Snapshot
17.2.2 Company Overview
17.2.3 Company Financial Profile
17.2.4 Company Product Benchmarking
17.2.5 Company Recent Developments
17.3 Lockheed Martin Corporation
17.3.1 Company Snapshot
17.3.2 Company Overview
17.3.3 Company Financial Profile
17.3.4 Company Product Benchmarking
17.3.5 Company Recent Developments
17.4 Raytheon
17.4.1 Company Snapshot
17.4.2 Company Overview
17.4.3 Company Financial Profile
17.4.4 Company Product Benchmarking
17.4.5 Company Recent Developments
17.5 Rheinmetal AG
17.5.1 Company Snapshot
17.5.2 Company Overview
17.5.3 Company Financial Profile
17.5.4 Company Product Benchmarking
17.6 Thales
17.6.1 Company Snapshot
17.6.2 Company Overview
17.6.3 Company Financial Profile
17.6.4 Company Product Benchmarking
17.6.5 Company Recent Developments
17.7 Ball Aerospace and Technologies Corp.
17.7.1 Company Snapshot
17.7.2 Company Overview
17.7.3 Company Financial Profile
17.7.4 Company Product Benchmarking
17.7.5 Company Recent Developments
17.8 Honeywell International Inc
17.8.1 Company Snapshot
17.8.2 Company Overview
17.8.3 Company Financial Profile
17.8.4 Company Product Benchmarking
17.8.5 Company Recent Developments
17.9 Leonardo Spa
17.9.1 Company Snapshot
17.9.2 Company Overview
17.9.3 Company Financial Profile
17.9.4 Company Product Benchmarking
17.9.5 Company Recent Developments
17.10 Mercury Systems Inc.
17.10.1 Company Snapshot
17.10.2 Company Overview
17.10.3 Company Financial Profile
17.10.4 Company Product Benchmarking
17.10.5 Company Recent Developments
17.11 Northrop Grumman Corporation
17.11.1 Company Snapshot
17.11.2 Company Overview
17.11.3 Company Financial Profile
17.11.4 Company Product Benchmarking
17.11.5 Company Recent Developments
17.12 Saab AB
17.12.1 Company Snapshot
17.12.2 Company Overview
17.12.3 Company Financial Profile
17.12.4 Company Product Benchmarking
17.12.5 Company Recent Developments
17.13 Dassault Aviation
17.13.1 Company Snapshot
17.13.2 Company Overview
17.13.3 Company Financial Profile
17.14 Bae Systems
17.14.1 Company Snapshot
17.14.2 Company Overview
17.14.3 Company Financial Profile
17.14.4 Company Product Benchmarking
17.14.5 Company Recent Developments
17.15 General Dynamics
17.15.1 Company Snapshot
17.15.2 Company Overview
17.15.3 Company Financial Profile
17.16 Flir Systems Inc.
17.16.1 Company Snapshot
17.16.2 Company Overview
17.16.3 Company Product Benchmarking
17.16.4 Company Recent Developments
17.17 Israel Aerospace Industries
17.17.1 Company Snapshot
17.17.2 Company Overview
17.17.3 Company Product Benchmarking
17.17.4 Company Recent Developments
17.18 Blighter Surveillance Systems Ltd.
17.18.1 Company Snapshot
17.18.2 Company Overview
17.18.3 Company Product Benchmarking
17.18.4 Company Recent Developments
17.19 CEA Technologies
17.19.1 Company Snapshot
17.19.2 Company Overview
17.19.3 Company Product Benchmarking
17.20 General Atomics Aeronautical Systems, Inc.
17.20.1 Company Snapshot
17.20.2 Company Overview
17.20.3 Company Product Benchmarking
17.20.4 Company Recent Developments
18 Competitive Landscape
18.1 Company Market Share Analysis
18.2 Key Business Strategy Analysis
18.3 New Product/Service Launch as the Key Business Strategy In the Global Market
18.4 Acquistion as the Key Business Strategy In the Global Market
18.5 Partnership as the Key Business Strategy In the Global Market
18.6 Collaboration as the Key Business Strategy In the Global Market
18.7 Expansion as the Key Business Strategy In the Global Market
18.8 Joint Venture as the Key Business Strategy In the Global Market
19 Conclusion
20 Recommendations
20.1 North America To Dominate The Miltary Radar System Market
20.2 Recommendation for Miltary Radar System Manufacturers
20.2.1 Continuous Increase of Operational Radar Frequency Ranges Towards Applications For Broadband Multifunctional RF-Systems
20.2.2 Progression Of Signal Digitization Along With Its Processing Capabilities Towards The Frontend
20.2.3 Multiple-In, Multiple-Out Radar Systems
21 Glossary Terms
List of Tables
Table 1. Global Military Radar System Market Forecast, 2021-2031 (USD Mn, AGR (%), CAGR(%))
Table 2. Global Military Radar System Market Snapshot, 2021 & 2031 (US$million, CAGR %)
Table 3. Global Military Radar System Market SWOT Analysis 2021-2031
Table 4. Radar system manufacturers
Table 1. Global Military Radar System Market Forecast, 2021-2031 (USD Mn, AGR (%), CAGR(%))
Table 2. Global Military Radar System Market Forecast, 2021-2031 (USD Mn, AGR (%), CAGR(%)) (V – Shaped Recovery)
Table 3. Global Military Radar System Market Forecast, 2021-2031 (USD Mn, AGR (%), CAGR(%)) (W – Shaped Recovery)
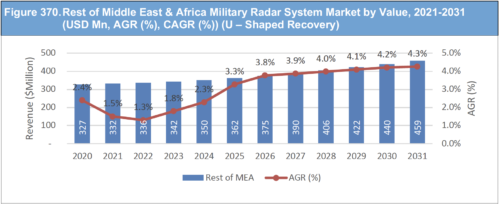
Table 4. Global Military Radar System Market Forecast, 2021-2031 (USD Mn, AGR (%), CAGR(%)) (U – Shaped Recovery)
Table 5. Global Military Radar System Market Forecast, 2021-2031 (USD Mn, AGR (%), CAGR(%)) (L – Shaped Recovery)
Table 6. Global Military Radar System Market by Region, 2021-2031 (USD Mn, AGR (%), CAGR(%))
Table 7. Global Military Radar System Market by Region, 2021-2031 (USD Mn, AGR (%), CAGR(%)) (V – Shaped Recovery)
Table 8. Global Military Radar System Market by Region, 2021-2031 (USD Mn, AGR (%), CAGR(%)) (W – Shaped Recovery)
Table 9. Global Military Radar System Market by Region, 2021-2031 (USD Mn, AGR (%), CAGR(%)) (U – Shaped Recovery)
Table 10. Global Military Radar System Market by Region, 2021-2031 (USD Mn, AGR (%), CAGR(%)) (L – Shaped Recovery)
Table 11. Global Military Radar System Market by End-User, 2021-2031 (USD Mn, AGR (%), CAGR(%))
Table 12. Global Military Radar System Market by End-User, 2021-2031 (USD Mn, AGR (%), CAGR(%)) (V – Shaped Recovery)
Table 13. Global Military Radar System Market by End-User, 2021-2031 (USD Mn, AGR (%), CAGR(%)) (W – Shaped Recovery)
Table 14. Global Military Radar System Market by End-User, 2021-2031 (USD Mn, AGR (%), CAGR(%)) (U – Shaped Recovery)
Table 15. Global Military Radar System Market by End-User, 2021-2031 (USD Mn, AGR (%), CAGR(%)) (L – Shaped Recovery)
Table 16. Global Military Radar System Markek by Frequency Band, 2021-2031 (USD Mn, AGR (%), CAGR(%))
Table 17. Global Military Radar System Markek by Frequency Band, 2021-2031 (USD Mn, AGR (%), CAGR(%)) (V – Shaped Recovery)
Table 18. Global Military Radar System Markek by Frequency Band, 2021-2031 (USD Mn, AGR (%), CAGR(%)) (W – Shaped Recovery)
Table 19. Global Military Radar System Markek by Frequency Band, 2021-2031 (USD Mn, AGR (%), CAGR(%)) (U – Shaped Recovery)
Table 20. Global Military Radar System Markek by Frequency Band, 2021-2031 (USD Mn, AGR (%), CAGR(%)) (L – Shaped Recovery)
Table 21. Global Military Radar System Market by Product Type, 2021-2031 (USD Mn, AGR (%), CAGR(%))
Table 22. Global Military Radar System Market by Product Type, 2021-2031 (USD Mn, AGR (%), CAGR(%)) (V – Shaped Recovery)
Table 23. Global Military Radar System Market by Product Type, 2021-2031 (USD Mn, AGR (%), CAGR(%)) (W – Shaped Recovery)
Table 24. Global Military Radar System Market by Product Type, 2021-2031 (USD Mn, AGR (%), CAGR(%)) (U – Shaped Recovery)
Table 25. Global Military Radar System Market by Product Type, 2021-2031 (USD Mn, AGR (%), CAGR(%)) (L – Shaped Recovery)
Table 26. Global Military Radar System Market by Application, 2021-2031 (USD Mn, AGR (%), CAGR(%))
Table 27. Global Military Radar System Market by Application, 2021-2031 (USD Mn, AGR (%), CAGR(%)) (V – Shaped Recovery)
Table 28. Global Military Radar System Market by Application, 2021-2031 (USD Mn, AGR (%), CAGR(%)) (W – Shaped Recovery)
Table 29. Global Military Radar System Market by Application, 2021-2031 (USD Mn, AGR (%), CAGR(%)) (U – Shaped Recovery)
Table 30. Global Military Radar System Market by Application, 2021-2031 (USD Mn, AGR (%), CAGR(%)) (L – Shaped Recovery)
Table 31. Global Military Radar System Market by Technology, 2021-2031 (USD Mn, AGR (%), CAGR(%))
Table 32. Global Military Radar System Market by Technology, 2021-2031 (USD Mn, AGR (%), CAGR(%)) (V – Shaped Recovery)
Table 33. Global Military Radar System Market by Technology, 2021-2031 (USD Mn, AGR (%), CAGR(%)) (W – Shaped Recovery)
Table 34. Global Military Radar System Market by Technology, 2021-2031 (USD Mn, AGR (%), CAGR(%)) (U – Shaped Recovery)
Table 35. Global Military Radar System Market by Technology, 2021-2031 (USD Mn, AGR (%), CAGR(%)) (L – Shaped Recovery)
Table 36. Global Military Radar System Market by Waveform, 2021-2031 (USD Mn, AGR (%), CAGR(%))
Table 37. Global Military Radar System Market by Waveform, 2021-2031 (USD Mn, AGR (%), CAGR(%)) (V – Shaped Recovery)
Table 38. Global Military Radar System Market by Waveform, 2021-2031 (USD Mn, AGR (%), CAGR(%)) (W – Shaped Recovery)
Table 39. Global Military Radar System Market by Waveform, 2021-2031 (USD Mn, AGR (%), CAGR(%)) (U – Shaped Recovery)
Table 40. Global Military Radar System Market by Waveform, 2021-2031 (USD Mn, AGR (%), CAGR(%)) (L – Shaped Recovery)
Table 41. North America Military Radar System Market by Value, 2021-2031 (USD Mn, AGR (%), CAGR(%))
Table 42. North America Military Radar System Market by Value, 2021-2031 (USD Mn, AGR (%), CAGR(%)) (V – Shaped Recovery)
Table 43. North America Military Radar System Market by Value, 2021-2031 (USD Mn, AGR (%), CAGR(%)) (W – Shaped Recovery)
Table 44. North America Military Radar System Market by Value, 2021-2031 (USD Mn, AGR (%), CAGR(%)) (U – Shaped Recovery)
Table 45. North America Military Radar System Market by Value, 2021-2031 (USD Mn, AGR (%), CAGR(%)) (L – Shaped Recovery)
Table 46. North America Military Radar System Market by Country, 2021-2031 (USD Mn, AGR (%), CAGR(%))
Table 47. North America Military Radar System Market by Country, 2021-2031 (USD Mn, AGR (%), CAGR(%)) (V – Shaped Recovery)
Table 48. North America Military Radar System Market by Country, 2021-2031 (USD Mn, AGR (%), CAGR(%)) (W – Shaped Recovery)
Table 49. North America Military Radar System Market by Country, 2021-2031 (USD Mn, AGR (%), CAGR(%)) (U – Shaped Recovery)
Table 50. North America Military Radar System Market by Country, 2021-2031 (USD Mn, AGR (%), CAGR(%)) (L – Shaped Recovery)
Table 51. North America Military Radar System Market by End-User, 2021-2031 (USD Mn, AGR (%), CAGR(%))
Table 52. North America Military Radar System Market by End-User, 2021-2031 (USD Mn, AGR (%), CAGR(%)) (V – Shaped Recovery)
Table 53. North America Military Radar System Market by End-User, 2021-2031 (USD Mn, AGR (%), CAGR(%)) (W – Shaped Recovery)
Table 54. North America Military Radar System Market by End-User, 2021-2031 (USD Mn, AGR (%), CAGR(%)) (U – Shaped Recovery)
Table 55. North America Military Radar System Market by End-User, 2021-2031 (USD Mn, AGR (%), CAGR(%)) (L – Shaped Recovery)
Table 56. North America Military Radar System Markek by Frequency Band, 2021-2031 (USD Mn, AGR (%), CAGR(%))
Table 57. North America Military Radar System Markek by Frequency Band, 2021-2031 (USD Mn, AGR (%), CAGR(%)) (V – Shaped Recovery)
Table 58. North America Military Radar System Markek by Frequency Band, 2021-2031 (USD Mn, AGR (%), CAGR(%)) (W – Shaped Recovery)
Table 59. North America Military Radar System Markek by Frequency Band, 2021-2031 (USD Mn, AGR (%), CAGR(%)) (U – Shaped Recovery)
Table 60. North America Military Radar System Markek by Frequency Band, 2021-2031 (USD Mn, AGR (%), CAGR(%)) (L – Shaped Recovery)
Table 61. North America Military Radar System Market by Product Type, 2021-2031 (USD Mn, AGR (%), CAGR(%))
Table 62. North America Military Radar System Market by Product Type, 2021-2031 (USD Mn, AGR (%), CAGR(%)) (V – Shaped Recovery)
Table 63. North America Military Radar System Market by Product Type, 2021-2031 (USD Mn, AGR (%), CAGR(%)) (W – Shaped Recovery)
Table 64. North America Military Radar System Market by Product Type, 2021-2031 (USD Mn, AGR (%), CAGR(%)) (U – Shaped Recovery)
Table 65. North America Military Radar System Market by Product Type, 2021-2031 (USD Mn, AGR (%), CAGR(%)) (L – Shaped Recovery)
Table 66. North America Military Radar System Market by Application, 2021-2031 (USD Mn, AGR (%), CAGR(%))
Table 67. North America Military Radar System Market by Application, 2021-2031 (USD Mn, AGR (%), CAGR(%)) (V – Shaped Recovery)
Table 68. North America Military Radar System Market by Application, 2021-2031 (USD Mn, AGR (%), CAGR(%)) (W – Shaped Recovery)
Table 69. North America Military Radar System Market by Application, 2021-2031 (USD Mn, AGR (%), CAGR(%)) (U – Shaped Recovery)
Table 70. North America Military Radar System Market by Application, 2021-2031 (USD Mn, AGR (%), CAGR(%)) (L – Shaped Recovery)
Table 71. North America Military Radar System Market by Technology, 2021-2031 (USD Mn, AGR (%), CAGR(%))
Table 72. North America Military Radar System Market by Technology, 2021-2031 (USD Mn, AGR (%), CAGR(%)) (V – Shaped Recovery)
Table 73. North America Military Radar System Market by Technology, 2021-2031 (USD Mn, AGR (%), CAGR(%)) (W – Shaped Recovery)
Table 74. North America Military Radar System Market by Technology, 2021-2031 (USD Mn, AGR (%), CAGR(%)) (U – Shaped Recovery)
Table 75. North America Military Radar System Market by Technology, 2021-2031 (USD Mn, AGR (%), CAGR(%)) (L – Shaped Recovery)
Table 76. North America Military Radar System Market by Waveform, 2021-2031 (USD Mn, AGR (%), CAGR(%))
Table 77. North America Military Radar System Market by Waveform, 2021-2031 (USD Mn, AGR (%), CAGR(%))(V – Shaped Recovery)
Table 78. North America Military Radar System Market by Waveform, 2021-2031 (USD Mn, AGR (%), CAGR(%)) (W – Shaped Recovery)
Table 79. North America Military Radar System Market by Waveform, 2021-2031 (USD Mn, AGR (%), CAGR(%)) (U – Shaped Recovery)
Table 80. North America Military Radar System Market by Waveform, 2021-2031 (USD Mn, AGR (%), CAGR(%)) (L – Shaped Recovery)
Table 81. US Military Radar System Market by Value, 2021-2031 (USD Mn, AGR (%), CAGR(%))
Table 82. US Military Radar System Market by Value, 2021-2031 (USD Mn, AGR (%), CAGR(%)) (V – Shaped Recovery)
Table 83. US Military Radar System Market by Value, 2021-2031 (USD Mn, AGR (%), CAGR(%)) (W – Shaped Recovery)
Table 84. US Military Radar System Market by Value, 2021-2031 (USD Mn, AGR (%), CAGR(%)) (U – Shaped Recovery)
Table 85. US Military Radar System Market by Value, 2021-2031 (USD Mn, AGR (%), CAGR(%)) (L – Shaped Recovery)
Table 86. Canada Military Radar System Market by Value, 2021-2031 (USD Mn, AGR (%), CAGR(%))
Table 87. Canada Military Radar System Market by Value, 2021-2031 (USD Mn, AGR (%), CAGR(%)) (V – Shaped Recovery)
Table 88. Canada Military Radar System Market by Value, 2021-2031 (USD Mn, AGR (%), CAGR(%)) (W – Shaped Recovery)
Table 89. Canada Military Radar System Market by Value, 2021-2031 (USD Mn, AGR (%), CAGR(%)) (U – Shaped Recovery)
Table 90. Canada Military Radar System Market by Value, 2021-2031 (USD Mn, AGR (%), CAGR(%)) (L – Shaped Recovery)
Table 91. Europe Military Radar System Market by Value, 2021-2031 (USD Mn, AGR (%), CAGR(%))
Table 92. Europe Military Radar System Market by Value, 2021-2031 (USD Mn, AGR (%), CAGR(%)) (V – Shaped Recovery)
Table 93. Europe Military Radar System Market by Value, 2021-2031 (USD Mn, AGR (%), CAGR(%)) (W – Shaped Recovery)
Table 94. Europe Military Radar System Market by Value, 2021-2031 (USD Mn, AGR (%), CAGR(%)) (U – Shaped Recovery)
Table 95. Europe Military Radar System Market by Value, 2021-2031 (USD Mn, AGR (%), CAGR(%)) (L – Shaped Recovery)
Table 96. Europe Military Radar System Market by Country, 2021-2031 (USD Mn, AGR (%), CAGR(%))
Table 97. Europe Military Radar System Market by Country, 2021-2031 (USD Mn, AGR (%), CAGR(%)) (V – Shaped Recovery)
Table 98. Europe Military Radar System Market by Country, 2021-2031 (USD Mn, AGR (%), CAGR(%)) (W – Shaped Recovery)
Table 99. Europe Military Radar System Market by Country, 2021-2031 (USD Mn, AGR (%), CAGR(%)) (U – Shaped Recovery)
Table 100. Europe Military Radar System Market by Country, 2021-2031 (USD Mn, AGR (%), CAGR(%)) (L – Shaped Recovery)
Table 101. Europe Military Radar System Market by End-User, 2021-2031 (USD Mn, AGR (%), CAGR(%))
Table 102. Europe Military Radar System Market by End-User, 2021-2031 (USD Mn, AGR (%), CAGR(%)) (V – Shaped Recovery)
Table 103. Europe Military Radar System Market by End-User, 2021-2031 (USD Mn, AGR (%), CAGR(%)) (W – Shaped Recovery)
Table 104. Europe Military Radar System Market by End-User, 2021-2031 (USD Mn, AGR (%), CAGR(%)) (U – Shaped Recovery)
Table 105. Europe Military Radar System Market by End-User, 2021-2031 (USD Mn, AGR (%), CAGR(%)) (L – Shaped Recovery)
Table 106. Europe Military Radar System Markek by Frequency Band, 2021-2031 (USD Mn, AGR (%), CAGR(%))
Table 107. Europe Military Radar System Markek by Frequency Band, 2021-2031 (USD Mn, AGR (%), CAGR(%)) (V – Shaped Recovery)
Table 108. Europe Military Radar System Markek by Frequency Band, 2021-2031 (USD Mn, AGR (%), CAGR(%)) (W – Shaped Recovery)
Table 109. Europe Military Radar System Markek by Frequency Band, 2021-2031 (USD Mn, AGR (%), CAGR(%)) (U – Shaped Recovery)
Table 110. Europe Military Radar System Markek by Frequency Band, 2021-2031 (USD Mn, AGR (%), CAGR(%)) (L – Shaped Recovery)
Table 111. Europe Military Radar System Market by Product Type, 2021-2031 (USD Mn, AGR (%), CAGR(%))
Table 112. Europe Military Radar System Market by Product Type, 2021-2031 (USD Mn, AGR (%), CAGR(%)) (V – Shaped Recovery)
Table 113. Europe Military Radar System Market by Product Type, 2021-2031 (USD Mn, AGR (%), CAGR(%)) (W – Shaped Recovery)
Table 114. Europe Military Radar System Market by Product Type, 2021-2031 (USD Mn, AGR (%), CAGR(%)) (U – Shaped Recovery)
Table 115. Europe Military Radar System Market by Product Type, 2021-2031 (USD Mn, AGR (%), CAGR(%)) (L – Shaped Recovery)
Table 116. Europe Military Radar System Market by Application, 2021-2031 (USD Mn, AGR (%), CAGR(%))
Table 117. Europe Military Radar System Market by Application, 2021-2031 (USD Mn, AGR (%), CAGR(%)) (V – Shaped Recovery)
Table 118. Europe Military Radar System Market by Application, 2021-2031 (USD Mn, AGR (%), CAGR(%)) (W – Shaped Recovery)
Table 119. Europe Military Radar System Market by Application, 2021-2031 (USD Mn, AGR (%), CAGR(%)) (U – Shaped Recovery)
Table 120. Europe Military Radar System Market by Application, 2021-2031 (USD Mn, AGR (%), CAGR(%)) (L – Shaped Recovery)
Table 121. Europe Military Radar System Market by Technology, 2021-2031 (USD Mn, AGR (%), CAGR(%))
Table 122. Europe Military Radar System Market by Technology, 2021-2031 (USD Mn, AGR (%), CAGR(%)) (V – Shaped Recovery)
Table 123. Europe Military Radar System Market by Technology, 2021-2031 (USD Mn, AGR (%), CAGR(%)) (W – Shaped Recovery)
Table 124. Europe Military Radar System Market by Technology, 2021-2031 (USD Mn, AGR (%), CAGR(%)) (U – Shaped Recovery)
Table 125. Europe Military Radar System Market by Technology, 2021-2031 (USD Mn, AGR (%), CAGR(%)) (L – Shaped Recovery)
Table 126. Europe Military Radar System Market by Waveform, 2021-2031 (USD Mn, AGR (%), CAGR(%))
Table 127. Europe Military Radar System Market by Waveform, 2021-2031 (USD Mn, AGR (%), CAGR(%)) (V – Shaped Recovery)
Table 128. Europe Military Radar System Market by Waveform, 2021-2031 (USD Mn, AGR (%), CAGR(%)) (W – Shaped Recovery)
Table 129. Europe Military Radar System Market by Waveform, 2021-2031 (USD Mn, AGR (%), CAGR(%)) (U – Shaped Recovery)
Table 130. Europe Military Radar System Market by Waveform, 2021-2031 (USD Mn, AGR (%), CAGR(%)) (L – Shaped Recovery)
Table 131. Germany Military Radar System Market by Value, 2021-2031 (USD Mn, AGR (%), CAGR(%))
Table 132. Germany Military Radar System Market by Value, 2021-2031 (USD Mn, AGR (%), CAGR(%)) (V – Shaped Recovery)
Table 133. Germany Military Radar System Market by Value, 2021-2031 (USD Mn, AGR (%), CAGR(%)) (W – Shaped Recovery)
Table 134. Germany Military Radar System Market by Value, 2021-2031 (USD Mn, AGR (%), CAGR(%)) (U – Shaped Recovery)
Table 135. Germany Military Radar System Market by Value, 2021-2031 (USD Mn, AGR (%), CAGR(%)) (L – Shaped Recovery)
Table 136. UK Military Radar System Market by Value, 2021-2031 (USD Mn, AGR (%), CAGR(%))
Table 137. UK Military Radar System Market by Value, 2021-2031 (USD Mn, AGR (%), CAGR(%)) (V – Shaped Recovery)
Table 138. UK Military Radar System Market by Value, 2021-2031 (USD Mn, AGR (%), CAGR(%)) (W – Shaped Recovery)
Table 139. UK Military Radar System Market by Value, 2021-2031 (USD Mn, AGR (%), CAGR(%)) (U – Shaped Recovery)
Table 140. UK Military Radar System Market by Value, 2021-2031 (USD Mn, AGR (%), CAGR(%)) (L – Shaped Recovery)
Table 141. France Military Radar System Market by Value, 2021-2031 (USD Mn, AGR (%), CAGR(%))
Table 142. France Military Radar System Market by Value, 2021-2031 (USD Mn, AGR (%), CAGR(%)) (V – Shaped Recovery)
Table 143. France Military Radar System Market by Value, 2021-2031 (USD Mn, AGR (%), CAGR(%)) (W – Shaped Recovery)
Table 144. France Military Radar System Market by Value, 2021-2031 (USD Mn, AGR (%), CAGR(%)) (U – Shaped Recovery)
Table 145. France Military Radar System Market by Value, 2021-2031 (USD Mn, AGR (%), CAGR(%)) (L – Shaped Recovery)
Table 146. Italy Military Radar System Market by Value, 2021-2031 (USD Mn, AGR (%), CAGR(%))
Table 147. Italy Military Radar System Market by Value, 2021-2031 (USD Mn, AGR (%), CAGR(%)) (V – Shaped Recovery)
Table 148. Italy Military Radar System Market by Value, 2021-2031 (USD Mn, AGR (%), CAGR(%)) (W – Shaped Recovery)
Table 149. Italy Military Radar System Market by Value, 2021-2031 (USD Mn, AGR (%), CAGR(%)) (U – Shaped Recovery)
Table 150. Italy Military Radar System Market by Value, 2021-2031 (USD Mn, AGR (%), CAGR(%)) (L – Shaped Recovery)
Table 151. Spain Military Radar System Market by Value, 2021-2031 (USD Mn, AGR (%), CAGR(%))
Table 152. Spain Military Radar System Market by Value, 2021-2031 (USD Mn, AGR (%), CAGR(%)) (V – Shaped Recovery)
Table 153. Spain Military Radar System Market by Value, 2021-2031 (USD Mn, AGR (%), CAGR(%)) (W – Shaped Recovery)
Table 154. Spain Military Radar System Market by Value, 2021-2031 (USD Mn, AGR (%), CAGR(%)) (U – Shaped Recovery)
Table 155. Spain Military Radar System Market by Value, 2021-2031 (USD Mn, AGR (%), CAGR(%)) (L – Shaped Recovery)
Table 156. Rest of Europe Military Radar System Market by Value, 2021-2031 (USD Mn, AGR (%), CAGR(%))
Table 157. Rest of Europe Military Radar System Market by Value, 2021-2031 (USD Mn, AGR (%), CAGR(%)) (V – Shaped Recovery)
Table 158. Rest of Europe Military Radar System Market by Value, 2021-2031 (USD Mn, AGR (%), CAGR(%)) (W – Shaped Recovery)
Table 159. Rest of Europe Military Radar System Market by Value, 2021-2031 (USD Mn, AGR (%), CAGR(%)) (U – Shaped Recovery)
Table 160. Rest of Europe Military Radar System Market by Value, 2021-2031 (USD Mn, AGR (%), CAGR(%)) (L – Shaped Recovery)
Table 161. Asia-Pacific Military Radar System Market by Value, 2021-2031 (USD Mn, AGR (%), CAGR(%))
Table 162. Asia-Pacific Military Radar System Market by Value, 2021-2031 (USD Mn, AGR (%), CAGR(%)) (V – Shaped Recovery)
Table 163. Asia-Pacific Military Radar System Market by Value, 2021-2031 (USD Mn, AGR (%), CAGR(%)) (W – Shaped Recovery)
Table 164. Asia-Pacific Military Radar System Market by Value, 2021-2031 (USD Mn, AGR (%), CAGR(%)) (U – Shaped Recovery)
Table 165. Asia-Pacific Military Radar System Market by Value, 2021-2031 (USD Mn, AGR (%), CAGR(%)) (L – Shaped Recovery)
Table 166. Asia-Pacific Military Radar System Market by Country, 2021-2031 (USD Mn, AGR (%), CAGR(%))
Table 167. Asia-Pacific Military Radar System Market by Country, 2021-2031 (USD Mn, AGR (%), CAGR(%)) (V – Shaped Recovery)
Table 168. Asia-Pacific Military Radar System Market by Country, 2021-2031 (USD Mn, AGR (%), CAGR(%)) (W – Shaped Recovery)
Table 169. Asia-Pacific Military Radar System Market by Country, 2021-2031 (USD Mn, AGR (%), CAGR(%)) (U – Shaped Recovery)
Table 170. Asia-Pacific Military Radar System Market by Country, 2021-2031 (USD Mn, AGR (%), CAGR(%)) (L – Shaped Recovery)
Table 171. Asia-Pacific Military Radar System Market by End-User, 2021-2031 (USD Mn, AGR (%), CAGR(%))
Table 172. Asia-Pacific Military Radar System Market by End-User, 2021-2031 (USD Mn, AGR (%), CAGR(%)) (V – Shaped Recovery)
Table 173. Asia-Pacific Military Radar System Market by End-User, 2021-2031 (USD Mn, AGR (%), CAGR(%)) (W – Shaped Recovery)
Table 174. Asia-Pacific Military Radar System Market by End-User, 2021-2031 (USD Mn, AGR (%), CAGR(%)) (U – Shaped Recovery)
Table 175. Asia-Pacific Military Radar System Market by End-User, 2021-2031 (USD Mn, AGR (%), CAGR(%)) (L – Shaped Recovery)
Table 176. Asia-Pacific Military Radar System Markek by Frequency Band, 2021-2031 (USD Mn, AGR (%), CAGR(%))
Table 177. Asia-Pacific Military Radar System Markek by Frequency Band, 2021-2031 (USD Mn, AGR (%), CAGR(%)) (V – Shaped Recovery)
Table 178. Asia-Pacific Military Radar System Markek by Frequency Band, 2021-2031 (USD Mn, AGR (%), CAGR(%)) (W – Shaped Recovery)
Table 179. Asia-Pacific Military Radar System Markek by Frequency Band, 2021-2031 (USD Mn, AGR (%), CAGR(%)) (U – Shaped Recovery)
Table 180. Asia-Pacific Military Radar System Markek by Frequency Band, 2021-2031 (USD Mn, AGR (%), CAGR(%)) (L – Shaped Recovery)
Table 181. Asia-Pacific Military Radar System Market by Product Type, 2021-2031 (USD Mn, AGR (%), CAGR(%))
Table 182. Asia-Pacific Military Radar System Market by Product Type, 2021-2031 (USD Mn, AGR (%), CAGR(%)) (V – Shaped Recovery)
Table 183. Asia-Pacific Military Radar System Market by Product Type, 2021-2031 (USD Mn, AGR (%), CAGR(%)) (W – Shaped Recovery)
Table 184. Asia-Pacific Military Radar System Market by Product Type, 2021-2031 (USD Mn, AGR (%), CAGR(%)) (U – Shaped Recovery)
Table 185. Asia-Pacific Military Radar System Market by Product Type, 2021-2031 (USD Mn, AGR (%), CAGR(%)) (L – Shaped Recovery)
Table 186. Asia-Pacific Military Radar System Market by Application, 2021-2031 (USD Mn, AGR (%), CAGR(%))
Table 187. Asia-Pacific Military Radar System Market by Application, 2021-2031 (USD Mn, AGR (%), CAGR(%)) (V – Shaped Recovery)
Table 188. Asia-Pacific Military Radar System Market by Application, 2021-2031 (USD Mn, AGR (%), CAGR(%)) (W – Shaped Recovery)
Table 189. Asia-Pacific Military Radar System Market by Application, 2021-2031 (USD Mn, AGR (%), CAGR(%)) (U – Shaped Recovery)
Table 190. Asia-Pacific Military Radar System Market by Application, 2021-2031 (USD Mn, AGR (%), CAGR(%)) (L – Shaped Recovery)
Table 191. Asia-Pacific Military Radar System Market by Technology, 2021-2031 (USD Mn, AGR (%), CAGR(%))
Table 192. Asia-Pacific Military Radar System Market by Technology, 2021-2031 (USD Mn, AGR (%), CAGR(%)) (V – Shaped Recovery)
Table 193. Asia-Pacific Military Radar System Market by Technology, 2021-2031 (USD Mn, AGR (%), CAGR(%)) (W – Shaped Recovery)
Table 194. Asia-Pacific Military Radar System Market by Technology, 2021-2031 (USD Mn, AGR (%), CAGR(%)) (U – Shaped Recovery)
Table 195. Asia-Pacific Military Radar System Market by Technology, 2021-2031 (USD Mn, AGR (%), CAGR(%)) (L – Shaped Recovery)
Table 196. Asia-Pacific Military Radar System Market by Waveform, 2021-2031 (USD Mn, AGR (%), CAGR(%))
Table 197. Asia-Pacific Military Radar System Market by Waveform, 2021-2031 (USD Mn, AGR (%), CAGR(%)) (V – Shaped Recovery)
Table 198. Asia-Pacific Military Radar System Market by Waveform, 2021-2031 (USD Mn, AGR (%), CAGR(%)) (W – Shaped Recovery)
Table 199. Asia-Pacific Military Radar System Market by Frequency Band, 2021-2031 (USD Mn, AGR (%), CAGR(%)) (U – Shaped Recovery)
Table 200. Asia-Pacific Military Radar System Market by Waveform, 2021-2031 (USD Mn, AGR (%), CAGR(%)) (L – Shaped Recovery)
Table 201. China Military Radar System Market by Value, 2021-2031 (USD Mn, AGR (%), CAGR(%))
Table 202. China Military Radar System Market by Value, 2021-2031 (USD Mn, AGR (%), CAGR(%)) (V – Shaped Recovery)
Table 203. China Military Radar System Market by Value, 2021-2031 (USD Mn, AGR (%), CAGR(%)) (W – Shaped Recovery)
Table 204. China Military Radar System Market by Value, 2021-2031 (USD Mn, AGR (%), CAGR(%)) (U – Shaped Recovery)
Table 205. China Military Radar System Market by Value, 2021-2031 (USD Mn, AGR (%), CAGR(%)) (L – Shaped Recovery)
Table 206. India Military Radar System Market by Value, 2021-2031 (USD Mn, AGR (%), CAGR(%))
Table 207. India Military Radar System Market by Value, 2021-2031 (USD Mn, AGR (%), CAGR(%)) (V – Shaped Recovery)
Table 208. India Military Radar System Market by Value, 2021-2031 (USD Mn, AGR (%), CAGR(%)) (W – Shaped Recovery)
Table 209. India Military Radar System Market by Value, 2021-2031 (USD Mn, AGR (%), CAGR(%)) (U – Shaped Recovery)
Table 210. India Military Radar System Market by Value, 2021-2031 (USD Mn, AGR (%), CAGR(%)) (L – Shaped Recovery)
Table 211. Japan Military Radar System Market by Value, 2021-2031 (USD Mn, AGR (%), CAGR(%))
Table 212. Japan Military Radar System Market by Value, 2021-2031 (USD Mn, AGR (%), CAGR(%)) (V – Shaped Recovery)
Table 213. Japan Military Radar System Market by Value, 2021-2031 (USD Mn, AGR (%), CAGR(%)) (W – Shaped Recovery)
Table 214. Japan Military Radar System Market by Value, 2021-2031 (USD Mn, AGR (%), CAGR(%)) (U – Shaped Recovery)
Table 215. Japan Military Radar System Market by Value, 2021-2031 (USD Mn, AGR (%), CAGR(%)) (L – Shaped Recovery)
Table 216. South Korea Military Radar System Market by Value, 2021-2031 (USD Mn, AGR (%), CAGR(%))
Table 217. South Korea Military Radar System Market by Value, 2021-2031 (USD Mn, AGR (%), CAGR(%)) (V – Shaped Recovery)
Table 218. South Korea Military Radar System Market by Value, 2021-2031 (USD Mn, AGR (%), CAGR(%)) (W – Shaped Recovery)
Table 219. South Korea Military Radar System Market by Value, 2021-2031 (USD Mn, AGR (%), CAGR(%)) (U – Shaped Recovery)
Table 220. South Korea Military Radar System Market by Value, 2021-2031 (USD Mn, AGR (%), CAGR(%)) (L – Shaped Recovery)
Table 221. Australia Military Radar System Market by Value, 2021-2031 (USD Mn, AGR (%), CAGR(%))
Table 222. Australia Military Radar System Market by Value, 2021-2031 (USD Mn, AGR (%), CAGR(%)) (V – Shaped Recovery)
Table 223. Australia Military Radar System Market by Value, 2021-2031 (USD Mn, AGR (%), CAGR(%)) (W – Shaped Recovery)
Table 224. Australia Military Radar System Market by Value, 2021-2031 (USD Mn, AGR (%), CAGR(%)) (U – Shaped Recovery)
Table 225. Australia Military Radar System Market by Value, 2021-2031 (USD Mn, AGR (%), CAGR(%)) (L – Shaped Recovery)
Table 226. Rest of Asia-Pacific Military Radar System Market by Value, 2021-2031 (USD Mn, AGR (%), CAGR(%))
Table 227. Rest of Asia-Pacific Military Radar System Market by Value, 2021-2031 (USD Mn, AGR (%), CAGR(%)) (V – Shaped Recovery)
Table 228. Rest of Asia-Pacific Military Radar System Market by Value, 2021-2031 (USD Mn, AGR (%), CAGR(%)) (W – Shaped Recovery)
Table 229. Rest of Asia-Pacific Military Radar System Market by Value, 2021-2031 (USD Mn, AGR (%), CAGR(%)) (U – Shaped Recovery)
Table 230. Rest of Asia-Pacific Military Radar System Market by Value, 2021-2031 (USD Mn, AGR (%), CAGR(%)) (L – Shaped Recovery)
Table 231. Latin America Military Radar System Market by Value, 2021-2031 (USD Mn, AGR (%), CAGR(%))
Table 232. Latin America Military Radar System Market by Value, 2021-2031 (USD Mn, AGR (%), CAGR(%)) (V – Shaped Recovery)
Table 233. Latin America Military Radar System Market by Value, 2021-2031 (USD Mn, AGR (%), CAGR(%)) (W – Shaped Recovery)
Table 234. Latin America Military Radar System Market by Value, 2021-2031 (USD Mn, AGR (%), CAGR(%)) (U – Shaped Recovery)
Table 235. Latin America Military Radar System Market by Value, 2021-2031 (USD Mn, AGR (%), CAGR(%)) (L – Shaped Recovery)
Table 236. Latin America Military Radar System Market by Country, 2021-2031 (USD Mn, AGR (%), CAGR(%))
Table 237. Latin America Military Radar System Market by Country, 2021-2031 (USD Mn, AGR (%), CAGR(%)) (V – Shaped Recovery)
Table 238. Latin America Military Radar System Market by Country, 2021-2031 (USD Mn, AGR (%), CAGR(%)) (W – Shaped Recovery)
Table 239. Latin America Military Radar System Market by Country, 2021-2031 (USD Mn, AGR (%), CAGR(%)) (U – Shaped Recovery)
Table 240. Latin America Military Radar System Market by Country, 2021-2031 (USD Mn, AGR (%), CAGR(%)) (L – Shaped Recovery)
Table 241. Latin America Military Radar System Market by End-User, 2021-2031 (USD Mn, AGR (%), CAGR(%))
Table 242. Latin America Military Radar System Market by End-User, 2021-2031 (USD Mn, AGR (%), CAGR(%)) (V – Shaped Recovery)
Table 243. Latin America Military Radar System Market by End-User, 2021-2031 (USD Mn, AGR (%), CAGR(%)) (W – Shaped Recovery)
Table 244. Latin America Military Radar System Market by End-User, 2021-2031 (USD Mn, AGR (%), CAGR(%)) (U – Shaped Recovery)
Table 245. Latin America Military Radar System Market by End-User, 2021-2031 (USD Mn, AGR (%), CAGR(%)) (L – Shaped Recovery)
Table 246. Latin America Military Radar System Markek by Frequency Band, 2021-2031 (USD Mn, AGR (%), CAGR(%))
Table 247. Latin America Military Radar System Markek by Frequency Band, 2021-2031 (USD Mn, AGR (%), CAGR(%)) (V – Shaped Recovery)
Table 248. Latin America Military Radar System Markek by Frequency Band, 2021-2031 (USD Mn, AGR (%), CAGR(%)) (W – Shaped Recovery)
Table 249. Latin America Military Radar System Markek by Frequency Band, 2021-2031 (USD Mn, AGR (%), CAGR(%)) (U – Shaped Recovery)
Table 250. Latin America Military Radar System Markek by Frequency Band, 2021-2031 (USD Mn, AGR (%), CAGR(%)) (L – Shaped Recovery)
Table 251. Latin America Military Radar System Market by Product Type, 2021-2031 (USD Mn, AGR (%), CAGR(%))
Table 252. Latin America Military Radar System Market by Product Type, 2021-2031 (USD Mn, AGR (%), CAGR(%)) (V – Shaped Recovery)
Table 253. Latin America Military Radar System Market by Product Type, 2021-2031 (USD Mn, AGR (%), CAGR(%)) (W – Shaped Recovery)
Table 254. Latin America Military Radar System Market by Product Type, 2021-2031 (USD Mn, AGR (%), CAGR(%)) (U – Shaped Recovery)
Table 255. Latin America Military Radar System Market by Product Type, 2021-2031 (USD Mn, AGR (%), CAGR(%)) (L – Shaped Recovery)
Table 256. Latin America Military Radar System Market by Application, 2021-2031 (USD Mn, AGR (%), CAGR(%))
Table 257. Latin America Military Radar System Market by Application, 2021-2031 (USD Mn, AGR (%), CAGR(%)) (V – Shaped Recovery)
Table 258. Latin America Military Radar System Market by Application, 2021-2031 (USD Mn, AGR (%), CAGR(%)) (W – Shaped Recovery)
Table 259. Latin America Military Radar System Market by Application, 2021-2031 (USD Mn, AGR (%), CAGR(%)) (U – Shaped Recovery)
Table 260. Latin America Military Radar System Market by Application, 2021-2031 (USD Mn, AGR (%), CAGR(%)) (L – Shaped Recovery)
Table 261. Latin America Military Radar System Market by Technology, 2021-2031 (USD Mn, AGR (%), CAGR(%))
Table 262. Latin America Military Radar System Market by Technology, 2021-2031 (USD Mn, AGR (%), CAGR(%)) (V – Shaped Recovery)
Table 263. Latin America Military Radar System Market by Technology, 2021-2031 (USD Mn, AGR (%), CAGR(%)) (W – Shaped Recovery)
Table 264. Latin America Military Radar System Market by Technology, 2021-2031 (USD Mn, AGR (%), CAGR(%)) (U – Shaped Recovery)
Table 265. Latin America Military Radar System Market by Technology, 2021-2031 (USD Mn, AGR (%), CAGR(%)) (L – Shaped Recovery)
Table 266. Latin America Military Radar System Market by Frequency Band, 2021-2031 (USD Mn, AGR (%), CAGR(%))
Table 267. Latin America Military Radar System Market by Frequency Band, 2021-2031 (USD Mn, AGR (%), CAGR(%)) (V – Shaped Recovery)
Table 268. Latin America Military Radar System Market by Frequency Band, 2021-2031 (USD Mn, AGR (%), CAGR(%)) (W – Shaped Recovery)
Table 269. Latin America Military Radar System Market by Frequency Band, 2021-2031 (USD Mn, AGR (%), CAGR(%)) (U – Shaped Recovery)
Table 270. Latin America Military Radar System Market by Frequency Band, 2021-2031 (USD Mn, AGR (%), CAGR(%)) (L – Shaped Recovery)
Table 271. Brazil Military Radar System Market by Value, 2021-2031 (USD Mn, AGR (%), CAGR(%))
Table 272. Brazil Military Radar System Market by Value, 2021-2031 (USD Mn, AGR (%), CAGR(%)) (V – Shaped Recovery)
Table 273. Brazil Military Radar System Market by Value, 2021-2031 (USD Mn, AGR (%), CAGR(%)) (W – Shaped Recovery)
Table 274. Brazil Military Radar System Market by Value, 2021-2031 (USD Mn, AGR (%), CAGR(%)) (U – Shaped Recovery)
Table 275. Brazil Military Radar System Market by Value, 2021-2031 (USD Mn, AGR (%), CAGR(%)) (L – Shaped Recovery)
Table 276. Mexico Military Radar System Market by Value, 2021-2031 (USD Mn, AGR (%), CAGR(%))
Table 277. Mexico Military Radar System Market by Value, 2021-2031 (USD Mn, AGR (%), CAGR(%)) (V – Shaped Recovery)
Table 278. Mexico Military Radar System Market by Value, 2021-2031 (USD Mn, AGR (%), CAGR(%)) (W – Shaped Recovery)
Table 279. Mexico Military Radar System Market by Value, 2021-2031 (USD Mn, AGR (%), CAGR(%)) (U – Shaped Recovery)
Table 280. Mexico Military Radar System Market by Value, 2021-2031 (USD Mn, AGR (%), CAGR(%)) (L – Shaped Recovery)
Table 281. Argentina Military Radar System Market by Value, 2021-2031 (USD Mn, AGR (%), CAGR(%))
Table 282. Argentina Military Radar System Market by Value, 2021-2031 (USD Mn, AGR (%), CAGR(%)) (V – Shaped Recovery)
Table 283. Argentina Military Radar System Market by Value, 2021-2031 (USD Mn, AGR (%), CAGR(%)) (W – Shaped Recovery)
Table 284. Argentina Military Radar System Market by Value, 2021-2031 (USD Mn, AGR (%), CAGR(%)) (U – Shaped Recovery)
Table 285. Argentina Military Radar System Market by Value, 2021-2031 (USD Mn, AGR (%), CAGR(%)) (L – Shaped Recovery)
Table 286. Rest of LATAM Military Radar System Market by Value, 2021-2031 (USD Mn, AGR (%), CAGR(%))
Table 287. Rest of LATAM Military Radar System Market by Value, 2021-2031 (USD Mn, AGR (%), CAGR(%)) (V – Shaped Recovery)
Table 288. Rest of LATAM Military Radar System Market by Value, 2021-2031 (USD Mn, AGR (%), CAGR(%)) (W – Shaped Recovery)
Table 289. Rest of LATAM Military Radar System Market by Value, 2021-2031 (USD Mn, AGR (%), CAGR(%)) (U – Shaped Recovery)
Table 290. Rest of LATAM Military Radar System Market by Value, 2021-2031 (USD Mn, AGR (%), CAGR(%)) (L – Shaped Recovery)
Table 291. Middle East & Africa Military Radar System Market by Value, 2021-2031 (USD Mn, AGR (%), CAGR(%))
Table 292. Middle East & Africa Military Radar System Market by Value, 2021-2031 (USD Mn, AGR (%), CAGR(%)) (V – Shaped Recovery)
Table 293. Middle East & Africa Military Radar System Market by Value, 2021-2031 (USD Mn, AGR (%), CAGR(%)) (W – Shaped Recovery)
Table 294. Middle East & Africa Military Radar System Market by Value, 2021-2031 (USD Mn, AGR (%), CAGR(%)) (U – Shaped Recovery)
Table 295. Middle East & Africa Military Radar System Market by Value, 2021-2031 (USD Mn, AGR (%), CAGR(%)) (L – Shaped Recovery)
Table 296. Middle East & Africa Military Radar System Market by Country, 2021-2031 (USD Mn, AGR (%), CAGR(%))
Table 297. Middle East & Africa Military Radar System Market by Country, 2021-2031 (USD Mn, AGR (%), CAGR(%)) (V – Shaped Recovery)
Table 298. Middle East & Africa Military Radar System Market by Country, 2021-2031 (USD Mn, AGR (%), CAGR(%)) (W – Shaped Recovery)
Table 299. Middle East & Africa Military Radar System Market by Country, 2021-2031 (USD Mn, AGR (%), CAGR(%)) (U – Shaped Recovery)
Table 300. Middle East & Africa Military Radar System Market by Country, 2021-2031 (USD Mn, AGR (%), CAGR(%)) (L – Shaped Recovery)
Table 301. Middle East & Africa Military Radar System Market by End-User, 2021-2031 (USD Mn, AGR (%), CAGR(%))
Table 302. Middle East & Africa Military Radar System Market by End-User, 2021-2031 (USD Mn, AGR (%), CAGR(%)) (V – Shaped Recovery)
Table 303. Middle East & Africa Military Radar System Market by End-User, 2021-2031 (USD Mn, AGR (%), CAGR(%)) (W – Shaped Recovery)
Table 304. Middle East & Africa Military Radar System Market by End-User, 2021-2031 (USD Mn, AGR (%), CAGR(%)) (U – Shaped Recovery)
Table 305. Middle East & Africa Military Radar System Market by End-User, 2021-2031 (USD Mn, AGR (%), CAGR(%)) (L – Shaped Recovery)
Table 306. Middle East & Africa Military Radar System Markek by Frequency Band, 2021-2031 (USD Mn, AGR (%), CAGR(%))
Table 307. Middle East & Africa Military Radar System Markek by Frequency Band, 2021-2031 (USD Mn, AGR (%), CAGR(%)) (V – Shaped Recovery)
Table 308. Middle East & Africa Military Radar System Markek by Frequency Band, 2021-2031 (USD Mn, AGR (%), CAGR(%)) (W – Shaped Recovery)
Table 309. Middle East & Africa Military Radar System Markek by Frequency Band, 2021-2031 (USD Mn, AGR (%), CAGR(%)) (U – Shaped Recovery)
Table 310. Middle East & Africa Military Radar System Markek by Frequency Band, 2021-2031 (USD Mn, AGR (%), CAGR(%)) (L – Shaped Recovery)
Table 311. Middle East & Africa Military Radar System Market by Product Type, 2021-2031 (USD Mn, AGR (%), CAGR(%))
Table 312. Middle East & Africa Military Radar System Market by Product Type, 2021-2031 (USD Mn, AGR (%), CAGR(%)) (V – Shaped Recovery)
Table 313. Middle East & Africa Military Radar System Market by Product Type, 2021-2031 (USD Mn, AGR (%), CAGR(%)) (W – Shaped Recovery)
Table 314. Middle East & Africa Military Radar System Market by Product Type, 2021-2031 (USD Mn, AGR (%), CAGR(%)) (U – Shaped Recovery)
Table 315. Middle East & Africa Military Radar System Market by Product Type, 2021-2031 (USD Mn, AGR (%), CAGR(%)) (L – Shaped Recovery)
Table 316. Middle East & Africa Military Radar System Market by Application, 2021-2031 (USD Mn, AGR (%), CAGR(%))
Table 317. Middle East & Africa Military Radar System Market by Application, 2021-2031 (USD Mn, AGR (%), CAGR(%)) (V – Shaped Recovery)
Table 318. Middle East & Africa Military Radar System Market by Application, 2021-2031 (USD Mn, AGR (%), CAGR(%)) (W – Shaped Recovery)
Table 319. Middle East & Africa Military Radar System Market by Application, 2021-2031 (USD Mn, AGR (%), CAGR(%)) (U – Shaped Recovery)
Table 320. Middle East & Africa Military Radar System Market by Application, 2021-2031 (USD Mn, AGR (%), CAGR(%)) (L – Shaped Recovery)
Table 321. Middle East & Africa Military Radar System Market by Technology, 2021-2031 (USD Mn, AGR (%), CAGR(%))
Table 322. Middle East & Africa Military Radar System Market by Technology, 2021-2031 (USD Mn, AGR (%), CAGR(%)) (V – Shaped Recovery)
Table 323. Middle East & Africa Military Radar System Market by Technology, 2021-2031 (USD Mn, AGR (%), CAGR(%)) (W – Shaped Recovery)
Table 324. Middle East & Africa Military Radar System Market by Technology, 2021-2031 (USD Mn, AGR (%), CAGR(%)) (U – Shaped Recovery)
Table 325. Middle East & Africa Military Radar System Market by Technology, 2021-2031 (USD Mn, AGR (%), CAGR(%)) (L – Shaped Recovery)
Table 326. Middle East & Africa Military Radar System Market by Frequency Band, 2021-2031 (USD Mn, AGR (%), CAGR(%))
Table 327. Middle East & Africa Military Radar System Market by Frequency Band, 2021-2031 (USD Mn, AGR (%), CAGR(%)) (V – Shaped Recovery)
Table 328. Middle East & Africa Military Radar System Market by Frequency Band, 2021-2031 (USD Mn, AGR (%), CAGR(%)) (W – Shaped Recovery)
Table 329. Middle East & Africa Military Radar System Market by Frequency Band, 2021-2031 (USD Mn, AGR (%), CAGR(%)) (U – Shaped Recovery)
Table 330. Middle East & Africa Military Radar System Market by Frequency Band, 2021-2031 (USD Mn, AGR (%), CAGR(%)) (L – Shaped Recovery)
Table 331. Saudi Arabia Military Radar System Market by Value, 2021-2031 (USD Mn, AGR (%), CAGR(%))
Table 332. Saudi Arabia Military Radar System Market by Value, 2021-2031 (USD Mn, AGR (%), CAGR(%)) (V – Shaped Recovery)
Table 333. Saudi Arabia Military Radar System Market by Value, 2021-2031 (USD Mn, AGR (%), CAGR(%)) (W – Shaped Recovery)
Table 334. Saudi Arabia Military Radar System Market by Value, 2021-2031 (USD Mn, AGR (%), CAGR(%)) (U – Shaped Recovery)
Table 335. Saudi Arabia Military Radar System Market by Value, 2021-2031 (USD Mn, AGR (%), CAGR(%)) (L – Shaped Recovery)
Table 336. UAE Military Radar System Market by Value, 2021-2031 (USD Mn, AGR (%), CAGR(%))
Table 337. UAE Military Radar System Market by Value, 2021-2031 (USD Mn, AGR (%), CAGR(%)) (V – Shaped Recovery)
Table 338. UAE Military Radar System Market by Value, 2021-2031 (USD Mn, AGR (%), CAGR(%)) (W – Shaped Recovery)
Table 339. UAE Military Radar System Market by Value, 2021-2031 (USD Mn, AGR (%), CAGR(%)) (U – Shaped Recovery)
Table 340. UAE Military Radar System Market by Value, 2021-2031 (USD Mn, AGR (%), CAGR(%)) (L – Shaped Recovery)
Table 341. Turkey Military Radar System Market by Value, 2021-2031 (USD Mn, AGR (%), CAGR(%))
Table 342. Turkey Military Radar System Market by Value, 2021-2031 (USD Mn, AGR (%), CAGR(%)) (V – Shaped Recovery)
Table 343. Turkey Military Radar System Market by Value, 2021-2031 (USD Mn, AGR (%), CAGR(%)) (W – Shaped Recovery)
Table 344. Turkey Military Radar System Market by Value, 2021-2031 (USD Mn, AGR (%), CAGR(%)) (U – Shaped Recovery)
Table 345. Turkey Military Radar System Market by Value, 2021-2031 (USD Mn, AGR (%), CAGR(%)) (L – Shaped Recovery)
Table 346. South Africa Military Radar System Market by Value, 2021-2031 (USD Mn, AGR (%), CAGR(%))
Table 347. South Africa Military Radar System Market by Value, 2021-2031 (USD Mn, AGR (%), CAGR(%)) (V – Shaped Recovery)
Table 348. South Africa Military Radar System Market by Value, 2021-2031 (USD Mn, AGR (%), CAGR(%)) (W – Shaped Recovery)
Table 349. South Africa Military Radar System Market by Value, 2021-2031 (USD Mn, AGR (%), CAGR(%)) (U – Shaped Recovery)
Table 350. South Africa Military Radar System Market by Value, 2021-2031 (USD Mn, AGR (%), CAGR(%)) (L – Shaped Recovery)
Table 351. Israel Military Radar System Market by Value, 2021-2031 (USD Mn, AGR (%), CAGR(%))
Table 352. Israel Military Radar System Market by Value, 2021-2031 (USD Mn, AGR (%), CAGR(%)) (V – Shaped Recovery)
Table 353. Israel Military Radar System Market by Value, 2021-2031 (USD Mn, AGR (%), CAGR(%)) (W – Shaped Recovery)
Table 354. Israel Military Radar System Market by Value, 2021-2031 (USD Mn, AGR (%), CAGR(%)) (U – Shaped Recovery)
Table 355. Israel Military Radar System Market by Value, 2021-2031 (USD Mn, AGR (%), CAGR(%)) (L – Shaped Recovery)
Table 356. Rest of MEA Military Radar System Market by Value, 2021-2031 (USD Mn, AGR (%), CAGR(%))
Table 357. Rest of MEA Military Radar System Market by Value, 2021-2031 (USD Mn, AGR (%), CAGR(%)) (V – Shaped Recovery)
Table 358. Rest of MEA Military Radar System Market by Value, 2021-2031 (USD Mn, AGR (%), CAGR(%)) (W – Shaped Recovery)
Table 359. Rest of MEA Military Radar System Market by Value, 2021-2031 (USD Mn, AGR (%), CAGR(%)) (U – Shaped Recovery)
Table 360. Rest of MEA Military Radar System Market by Value, 2021-2031 (USD Mn, AGR (%), CAGR(%)) (L – Shaped Recovery)
Table 361. Elbit Systems Limited: Company Information
Table 362. Elbit Systems Limited: Company Revenue 2016-2020 (US$Mn, AGR %)
Table 363. Elbit Systems Limited: Company Product and Service Benchmarking
Table 364. Elbit Systems Limited: Company Recent Developments
Table 365. L3 Harris Technologies Inc.: Company Information
Table 366. L3 Harris Technologies Inc.: Company Revenue 2017-2021 (US$Mn, AGR %)
Table 367. L3 Harris Technologies Inc.: Company Product and Service Benchmarking
Table 368. L3 Harris Technologies Inc.: Company Recent Developments
Table 369. Lockheed Martin Corporation: Company Information
Table 370. Lockheed Martin Corporation: Company Revenue 2016-2020 (US$Mn, AGR %)
Table 371. Lockheed Martin Corporation: Company Product and Service Benchmarking
Table 372. Lockheed Martin Corporation: Company Recent Developments
Table 373. Raytheon : Company Information
Table 374. Raytheon : Company Revenue 2016-2020 (US$Mn, AGR %)
Table 375. Raytheon : Company Product and Service Benchmarking
Table 376. Raytheon : Company Recent Developments
Table 377. Rheinmetal AG: Company Information
Table 378. Rheinmetal AG: Company Revenue 2016-2020 (US$Mn, AGR %)
Table 379. Rheinmetal AG: Company Product and Service Benchmarking
Table 380. Thales: Company Information
Table 381. Thales: Company Revenue 2016-2020 (US$Mn, AGR %)
Table 382. Thales: Company Product and Service Benchmarking
Table 383. Thales: Company Recent Developments
Table 384. Ball Aerospace and Technologies Corp.: Company Information
Table 385. Ball Aerospace and Technologies Corp.: Company Revenue 2016-2020 (US$Mn, AGR %)
Table 386. Ball Aerospace and Technologies Corp.: Company Product and Service Benchmarking
Table 387. Ball Aerospace and Technologies Corp.: Company Recent Developments
Table 388. Honeywell International Inc: Company Information
Table 389. Honeywell International Inc: Company Revenue 2016-2020 (US$Mn, AGR %)
Table 390. Honeywell International Inc: Company Product and Service Benchmarking
Table 391. Honeywell International Inc: Company Recent Developments
Table 392. Leonardo Spa: Company Information
Table 393. Leonardo Spa: Company Revenue 2016-2020 (US$Mn, AGR %)
Table 394. Leonardo Spa: Company Product and Service Benchmarking
Table 395. Leonardo Spa: Company Recent Developments
Table 396. Mercury Systems Inc.: Company Information
Table 397. Mercury Systems Inc.: Company Revenue 2017-2021 (US$Mn, AGR %)
Table 398. Mercury Systems Inc.: Company Product and Service Benchmarking
Table 399. Mercury Systems Inc.: Company Recent Developments
Table 400. Northrop Grumman Corporation: Company Information
Table 401. Northrop Grumman Corporation: Company Revenue 2016-2020 (US$Mn, AGR %)
Table 402. Northrop Grumman Corporation: Company Product and Service Benchmarking
Table 403. Northrop Grumman Corporation: Company Recent Developments
Table 404. Saab AB: Company Information
Table 405. Saab AB: Company Revenue 2016-2020 (US$Mn, AGR %)
Table 406. Saab AB: Company Product and Service Benchmarking
Table 407. Saab AB: Company Recent Developments
Table 408. Dassault Aviation: Company Information
Table 409. Dassault Aviation: Company Revenue 2016-2020 (US$Mn, AGR %)
Table 410. Bae Systems : Company Information
Table 411. Bae Systems : Company Revenue 2016-2020 (US$Mn, AGR %)
Table 412. Bae Systems : Company Product and Service Benchmarking
Table 413. Bae Systems : Company Recent Developments
Table 414. General Dynamics : Company Information
Table 415. General Dynamics : Company Revenue 2016-2020 (US$Mn, AGR %)
Table 416. Flir Systems Inc.: Company Information
Table 417. Flir Systems Inc.: Company Product and Service Benchmarking
Table 418. Flir Systems Inc.: Company Recent Developments
Table 419. Israel Aerospace Industries: Company Information
Table 420. Israel Aerospace Industries: Company Product and Service Benchmarking
Table 421. Israel Aerospace Industries: Company Recent Developments
Table 422. Blighter Surveillance Systems Ltd.: Company Information
Table 423. Blighter Surveillance Systems Ltd.: Company Product and Service Benchmarking
Table 424. Blighter Surveillance Systems Ltd.: Company Recent Developments
Table 425. CEA Technologies: Company Information
Table 426. CEA Technologies: Company Product and Service Benchmarking
Table 427. General Atomics Aeronautical Systems, Inc.: Company Information
Table 428. General Atomics Aeronautical Systems, Inc.: Company Product and Service Benchmarking
Table 429. General Atomics Aeronautical Systems, Inc.: Company Recent Developments
Table 430. New Product/Service Launch Strategy Adopted by Key Players in Global Miltary Radar Systems Market, 2018-2021
Table 431. Acquisition Strategy Adopted by Key Players in Global Miltary Radar Systems Market, 2018-2021
Table 432. Partnership Strategy Adopted by Key Players in Global Miltary Radar Systems Market, 2018-2021
Table 433. Collaboration Strategy Adopted by Key Players in Global Miltary Radar Systems Market, 2018-2021
Table 434. Expansion Strategy Adopted by Key Players in Global Miltary Radar Systems Market, 2018-2021
Table 435. Joint Venture Strategy Adopted by Key Players in Global Miltary Radar Systems Market, 2018-2021
List of Figures
Figure 1. Global Military Radar System Market by Value, 2021-2031 (USD Mn, AGR (%), CAGR (%))
Figure 2. Global Military Radar System Market Segmentation
Figure 3. Global Military Radar System Market Trends :
Figure 4. Porters Five Forces
Figure 5. Global Military Radar System Market by Value, 2021-2031 (USD Mn, AGR (%), CAGR (%))
Figure 6. Global Military Radar System Market by Value, 2021-2031 (USD Mn, AGR (%), CAGR (%)) (V – Shaped Recovery)
Figure 7. Global Military Radar System Market by Value, 2021-2031 (USD Mn, AGR (%), CAGR (%)) (W – Shaped Recovery)
Figure 8. Global Military Radar System Market by Value, 2021-2031 (USD Mn, AGR (%), CAGR (%)) (U – Shaped Recovery)
Figure 9. Global Military Radar System Market by Value, 2021-2031 (USD Mn, AGR (%), CAGR (%)) (L – Shaped Recovery)
Figure 10. Global Miltary Radar System Market Share Forecast by Region 2021, 2026, 2031 (%)
Figure 11. Global Military Radar System Market by Region, 2021-2031 (USD Mn, AGR (%), CAGR (%))
Figure 12. Global Military Radar System Market by Region, 2021-2031 (USD Mn, AGR (%), CAGR(%)) (V – Shaped Recovery)
Figure 13. Global Military Radar System Market by Region, 2021-2031 (USD Mn, AGR (%), CAGR(%)) (W – Shaped Recovery)
Figure 14. Global Military Radar System Market by Region, 2021-2031 (USD Mn, AGR (%), CAGR(%)) (U – Shaped Recovery)
Figure 15. Global Military Radar System Market by Region, 2021-2031 (USD Mn, AGR (%), CAGR(%)) (L – Shaped Recovery)
Figure 16. Global Miltary Radar System Market Share Forecast by End-User 2021, 2026, 2031 (%)
Figure 17. Global Military Radar System Market by by End-User, 2021-2031 (USD Mn, AGR (%), CAGR (%))
Figure 18. Global Military Radar System Market by by End-User, 2021-2031 (USD Mn, AGR (%), CAGR (%)) (V – Shaped Recovery)
Figure 19. Global Military Radar System Market by by End-User, 2021-2031 (USD Mn, AGR (%), CAGR (%)) (W – Shaped Recovery)
Figure 20. Global Military Radar System Market by by End-User, 2021-2031 (USD Mn, AGR (%), CAGR (%)) (U – Shaped Recovery)
Figure 21. Global Military Radar System Market by by End-User, 2021-2031 (USD Mn, AGR (%), CAGR (%)) (L – Shaped Recovery)
Figure 22. Global Miltary Radar System Market Share Forecast by Frequency Band 2021, 2026, 2031 (%)
Figure 23. Global Military Radar System Market by Frequency Band, 2021-2031 (USD Mn, AGR (%), CAGR (%))
Figure 24. Global Military Radar System Market by Frequency Band, 2021-2031 (USD Mn, AGR (%), CAGR (%)) (V – Shaped Recovery)
Figure 25. Global Military Radar System Market by Frequency Band, 2021-2031 (USD Mn, AGR (%), CAGR (%)) (W – Shaped Recovery)
Figure 26. Global Military Radar System Market by Frequency Band, 2021-2031 (USD Mn, AGR (%), CAGR (%)) (U – Shaped Recovery)
Figure 27. Global Military Radar System Market by Frequency Band, 2021-2031 (USD Mn, AGR (%), CAGR (%)) (L – Shaped Recovery)
Figure 28. Global Miltary Radar System Market Share Forecast by Product Type 2021, 2026, 2031 (%)
Figure 29. Global Military Radar System Market by Product Type, 2021-2031 (USD Mn, AGR (%), CAGR (%))
Figure 30. Global Military Radar System Market by Product Type, 2021-2031 (USD Mn, AGR (%), CAGR (%)) (V – Shaped Recovery)
Figure 31. Global Military Radar System Market by Product Type, 2021-2031 (USD Mn, AGR (%), CAGR (%)) (W – Shaped Recovery)
Figure 32. Global Military Radar System Market by Product Type, 2021-2031 (USD Mn, AGR (%), CAGR (%)) (U – Shaped Recovery)
Figure 33. Global Military Radar System Market by Product Type, 2021-2031 (USD Mn, AGR (%), CAGR (%)) (L – Shaped Recovery)
Figure 34. Global Miltary Radar System Market Share Forecast by Systems 2021, 2026, 2031 (%)
Figure 35. Global Military Radar System Market by Application, 2021-2031 (USD Mn, AGR (%), CAGR (%))
Figure 36. Global Military Radar System Market by Application, 2021-2031 (USD Mn, AGR (%), CAGR (%)) (V – Shaped Recovery)
Figure 37. Global Military Radar System Market by Application, 2021-2031 (USD Mn, AGR (%), CAGR (%)) (W – Shaped Recovery)
Figure 38. Global Military Radar System Market by Application, 2021-2031 (USD Mn, AGR (%), CAGR (%)) (U – Shaped Recovery)
Figure 39. Global Military Radar System Market by Application, 2021-2031 (USD Mn, AGR (%), CAGR (%)) (L – Shaped Recovery)
Figure 40. Global Miltary Radar System Market Share Forecast by Technology 2021, 2026, 2031 (%)
Figure 41. Global Military Radar System Market by Technology, 2021-2031 (USD Mn, AGR (%), CAGR (%))
Figure 42. Global Military Radar System Market by Technology, 2021-2031 (USD Mn, AGR (%), CAGR (%)) (V – Shaped Recovery)
Figure 43. Global Military Radar System Market by Technology, 2021-2031 (USD Mn, AGR (%), CAGR (%)) (W – Shaped Recovery)
Figure 44. Global Military Radar System Market by Technology, 2021-2031 (USD Mn, AGR (%), CAGR (%)) (U – Shaped Recovery)
Figure 45. Global Military Radar System Market by Technology, 2021-2031 (USD Mn, AGR (%), CAGR (%)) (L – Shaped Recovery)
Figure 46. Global Miltary Radar System Market Share Forecast by Waveform 2021, 2026, 2031 (%)
Figure 47. Global Military Radar System Market by Waveform, 2021-2031 (USD Mn, AGR (%), CAGR (%))
Figure 48. Global Military Radar System Market by Waveform, 2021-2031 (USD Mn, AGR (%), CAGR (%)) (V – Shaped Recovery)
Figure 49. Global Military Radar System Market by Waveform, 2021-2031 (USD Mn, AGR (%), CAGR (%)) (W – Shaped Recovery)
Figure 50. Global Military Radar System Market by Waveform, 2021-2031 (USD Mn, AGR (%), CAGR (%)) (U – Shaped Recovery)
Figure 51. Global Military Radar System Market by Waveform, 2021-2031 (USD Mn, AGR (%), CAGR (%)) (L – Shaped Recovery)
Figure 52. North America Military Radar System Market by Value, 2021-2031 (USD Mn, AGR (%), CAGR (%))
Figure 53. North America Military Radar System Market by Value, 2021-2031 (USD Mn, AGR (%), CAGR (%)) (V – Shaped Recovery)
Figure 54. North America Military Radar System Market by Value, 2021-2031 (USD Mn, AGR (%), CAGR (%)) (W – Shaped Recovery)
Figure 55. North America Military Radar System Market by Value, 2021-2031 (USD Mn, AGR (%), CAGR (%)) (U – Shaped Recovery)
Figure 56. North America Military Radar System Market by Value, 2021-2031 (USD Mn, AGR (%), CAGR (%)) (L – Shaped Recovery)
Figure 57. North America Military Radar System Market by Country, 2021-2031 (USD Mn, AGR (%), CAGR (%))
Figure 58. North America Military Radar System Market by Country, 2021-2031 (USD Mn, AGR (%), CAGR(%)) (V – Shaped Recovery)
Figure 59. North America Military Radar System Market by Country, 2021-2031 (USD Mn, AGR (%), CAGR(%)) (W – Shaped Recovery)
Figure 60. North America Military Radar System Market by Country, 2021-2031 (USD Mn, AGR (%), CAGR(%)) (U – Shaped Recovery)
Figure 61. North America Military Radar System Market by Country, 2021-2031 (USD Mn, AGR (%), CAGR(%)) (L – Shaped Recovery)
Figure 62. North America Military Radar System Market by by End-User, 2021-2031 (USD Mn, AGR (%), CAGR (%))
Figure 63. North America Military Radar System Market by by End-User, 2021-2031 (USD Mn, AGR (%), CAGR (%)) (V – Shaped Recovery)
Figure 64. North America Military Radar System Market by by End-User, 2021-2031 (USD Mn, AGR (%), CAGR (%)) (W – Shaped Recovery)
Figure 65. North America Military Radar System Market by by End-User, 2021-2031 (USD Mn, AGR (%), CAGR (%)) (U – Shaped Recovery)
Figure 66. North America Military Radar System Market by by End-User, 2021-2031 (USD Mn, AGR (%), CAGR (%)) (L – Shaped Recovery)
Figure 67. North America Military Radar System Market by Frequency Band, 2021-2031 (USD Mn, AGR (%), CAGR (%))
Figure 68. North America Military Radar System Market by Frequency Band, 2021-2031 (USD Mn, AGR (%), CAGR (%)) (V – Shaped Recovery)
Figure 69. North America Military Radar System Market by Frequency Band, 2021-2031 (USD Mn, AGR (%), CAGR (%)) (W – Shaped Recovery)
Figure 70. North America Military Radar System Market by Frequency Band, 2021-2031 (USD Mn, AGR (%), CAGR (%)) (U – Shaped Recovery)
Figure 71. North America Military Radar System Market by Frequency Band, 2021-2031 (USD Mn, AGR (%), CAGR (%)) (L – Shaped Recovery)
Figure 72. North America Military Radar System Market by Product Type, 2021-2031 (USD Mn, AGR (%), CAGR (%))
Figure 73. North America Military Radar System Market by Product Type, 2021-2031 (USD Mn, AGR (%), CAGR (%)) (V – Shaped Recovery)
Figure 74. North America Military Radar System Market by Product Type, 2021-2031 (USD Mn, AGR (%), CAGR (%)) (W – Shaped Recovery)
Figure 75. North America Military Radar System Market by Product Type, 2021-2031 (USD Mn, AGR (%), CAGR (%)) (U – Shaped Recovery)
Figure 76. North America Military Radar System Market by Product Type, 2021-2031 (USD Mn, AGR (%), CAGR (%)) (L – Shaped Recovery)
Figure 77. North America Military Radar System Market by Application, 2021-2031 (USD Mn, AGR (%), CAGR (%))
Figure 78. North America Military Radar System Market by Application, 2021-2031 (USD Mn, AGR (%), CAGR (%)) (V – Shaped Recovery)
Figure 79. North America Military Radar System Market by Application, 2021-2031 (USD Mn, AGR (%), CAGR (%)) (W – Shaped Recovery)
Figure 80. North America Military Radar System Market by Application, 2021-2031 (USD Mn, AGR (%), CAGR (%)) (U – Shaped Recovery)
Figure 81. North America Military Radar System Market by Application, 2021-2031 (USD Mn, AGR (%), CAGR (%)) (L – Shaped Recovery)
Figure 82. North America Military Radar System Market by Technology, 2021-2031 (USD Mn, AGR (%), CAGR (%))
Figure 83. North America Military Radar System Market by Technology, 2021-2031 (USD Mn, AGR (%), CAGR (%)) (V – Shaped Recovery)
Figure 84. North America Military Radar System Market by Technology, 2021-2031 (USD Mn, AGR (%), CAGR (%)) (W – Shaped Recovery)
Figure 85. North America Military Radar System Market by Technology, 2021-2031 (USD Mn, AGR (%), CAGR (%)) (U – Shaped Recovery)
Figure 86. North America Military Radar System Market by Technology, 2021-2031 (USD Mn, AGR (%), CAGR (%)) (L – Shaped Recovery)
Figure 87. North America Military Radar System Market by Waveform, 2021-2031 (USD Mn, AGR (%), CAGR (%))
Figure 88. North America Military Radar System Market by Waveform, 2021-2031 (USD Mn, AGR (%), CAGR (%)) (V – Shaped Recovery)
Figure 89. North America Military Radar System Market by Waveform, 2021-2031 (USD Mn, AGR (%), CAGR (%)) (W – Shaped Recovery)
Figure 90. North America Military Radar System Market by Waveform, 2021-2031 (USD Mn, AGR (%), CAGR (%)) (U – Shaped Recovery)
Figure 91. North America Military Radar System Market by Waveform, 2021-2031 (USD Mn, AGR (%), CAGR (%)) (L – Shaped Recovery)
Figure 92. US Military Radar System Market by Value, 2021-2031 (USD Mn, AGR (%), CAGR (%))
Figure 93. US Military Radar System Market by Value, 2021-2031 (USD Mn, AGR (%), CAGR (%)) (V – Shaped Recovery)
Figure 94. US Military Radar System Market by Value, 2021-2031 (USD Mn, AGR (%), CAGR (%)) (W – Shaped Recovery)
Figure 95. US Military Radar System Market by Value, 2021-2031 (USD Mn, AGR (%), CAGR (%)) (U – Shaped Recovery)
Figure 96. US Military Radar System Market by Value, 2021-2031 (USD Mn, AGR (%), CAGR (%)) (L – Shaped Recovery)
Figure 97. Canada Military Radar System Market by Value, 2021-2031 (USD Mn, AGR (%), CAGR (%))
Figure 98. Canada Military Radar System Market by Value, 2021-2031 (USD Mn, AGR (%), CAGR (%)) (V – Shaped Recovery)
Figure 99. Canada Military Radar System Market by Value, 2021-2031 (USD Mn, AGR (%), CAGR (%)) (W – Shaped Recovery)
Figure 100. Canada Military Radar System Market by Value, 2021-2031 (USD Mn, AGR (%), CAGR (%)) (U – Shaped Recovery)
Figure 101. Canada Military Radar System Market by Value, 2021-2031 (USD Mn, AGR (%), CAGR (%)) (L – Shaped Recovery)
Figure 102. Europe Military Radar System Market by Value, 2021-2031 (USD Mn, AGR (%), CAGR (%))
Figure 103. Europe Military Radar System Market by Value, 2021-2031 (USD Mn, AGR (%), CAGR (%)) (V – Shaped Recovery)
Figure 104. Europe Military Radar System Market by Value, 2021-2031 (USD Mn, AGR (%), CAGR (%)) (W – Shaped Recovery)
Figure 105. Europe Military Radar System Market by Value, 2021-2031 (USD Mn, AGR (%), CAGR (%)) (U – Shaped Recovery)
Figure 106. Europe Military Radar System Market by Value, 2021-2031 (USD Mn, AGR (%), CAGR (%)) (L – Shaped Recovery)
Figure 107. Europe Military Radar System Market by Country, 2021-2031 (USD Mn, AGR (%), CAGR (%))
Figure 108. Europe Military Radar System Market by Country, 2021-2031 (USD Mn, AGR (%), CAGR(%)) (V – Shaped Recovery)
Figure 109. Europe Military Radar System Market by Country, 2021-2031 (USD Mn, AGR (%), CAGR(%)) (W – Shaped Recovery)
Figure 110. Europe Military Radar System Market by Country, 2021-2031 (USD Mn, AGR (%), CAGR(%)) (U – Shaped Recovery)
Figure 111. Europe Military Radar System Market by Country, 2021-2031 (USD Mn, AGR (%), CAGR(%)) (L – Shaped Recovery)
Figure 112. Europe Military Radar System Market by End-User, 2021-2031 (USD Mn, AGR (%), CAGR (%))
Figure 113. Europe Military Radar System Market by End-User, 2021-2031 (USD Mn, AGR (%), CAGR (%)) (V – Shaped Recovery)
Figure 114. Europe Military Radar System Market by End-User, 2021-2031 (USD Mn, AGR (%), CAGR (%)) (W – Shaped Recovery)
Figure 115. Europe Military Radar System Market by End-User, 2021-2031 (USD Mn, AGR (%), CAGR (%)) (U – Shaped Recovery)
Figure 116. Europe Military Radar System Market by End-User, 2021-2031 (USD Mn, AGR (%), CAGR (%)) (L – Shaped Recovery)
Figure 117. Europe Military Radar System Market by Frequency Band, 2021-2031 (USD Mn, AGR (%), CAGR (%))
Figure 118. Europe Military Radar System Market by Frequency Band, 2021-2031 (USD Mn, AGR (%), CAGR (%)) (V – Shaped Recovery)
Figure 119. Europe Military Radar System Market by Frequency Band, 2021-2031 (USD Mn, AGR (%), CAGR (%)) (W – Shaped Recovery)
Figure 120. Europe Military Radar System Market by Frequency Band, 2021-2031 (USD Mn, AGR (%), CAGR (%)) (U – Shaped Recovery)
Figure 121. Europe Military Radar System Market by Frequency Band, 2021-2031 (USD Mn, AGR (%), CAGR (%)) (L – Shaped Recovery)
Figure 122. Europe Military Radar System Market by Product Type, 2021-2031 (USD Mn, AGR (%), CAGR (%))
Figure 123. Europe Military Radar System Market by Product Type, 2021-2031 (USD Mn, AGR (%), CAGR (%)) (V – Shaped Recovery)
Figure 124. Europe Military Radar System Market by Product Type, 2021-2031 (USD Mn, AGR (%), CAGR (%)) (W – Shaped Recovery)
Figure 125. Europe Military Radar System Market by Product Type, 2021-2031 (USD Mn, AGR (%), CAGR (%)) (U – Shaped Recovery)
Figure 126. Europe Military Radar System Market by Product Type, 2021-2031 (USD Mn, AGR (%), CAGR (%)) (L – Shaped Recovery)
Figure 127. Europe Military Radar System Market by Application, 2021-2031 (USD Mn, AGR (%), CAGR (%))
Figure 128. Europe Military Radar System Market by Application, 2021-2031 (USD Mn, AGR (%), CAGR (%)) (V – Shaped Recovery)
Figure 129. Europe Military Radar System Market by Application, 2021-2031 (USD Mn, AGR (%), CAGR (%)) (W – Shaped Recovery)
Figure 130. Europe Military Radar System Market by Application, 2021-2031 (USD Mn, AGR (%), CAGR (%)) (U – Shaped Recovery)
Figure 131. Europe Military Radar System Market by Application, 2021-2031 (USD Mn, AGR (%), CAGR (%)) (L – Shaped Recovery)
Figure 132. Europe Military Radar System Market by Technology, 2021-2031 (USD Mn, AGR (%), CAGR (%))
Figure 133. Europe Military Radar System Market by Technology, 2021-2031 (USD Mn, AGR (%), CAGR (%)) (V – Shaped Recovery)
Figure 134. Europe Military Radar System Market by Technology, 2021-2031 (USD Mn, AGR (%), CAGR (%)) (W – Shaped Recovery)
Figure 135. Europe Military Radar System Market by Technology, 2021-2031 (USD Mn, AGR (%), CAGR (%)) (U – Shaped Recovery)
Figure 136. Europe Military Radar System Market by Technology, 2021-2031 (USD Mn, AGR (%), CAGR (%)) (L – Shaped Recovery)
Figure 137. Europe Military Radar System Market by Waveform, 2021-2031 (USD Mn, AGR (%), CAGR (%))
Figure 138. Europe Military Radar System Market by Waveform, 2021-2031 (USD Mn, AGR (%), CAGR (%)) (V – Shaped Recovery)
Figure 139. Europe Military Radar System Market by Waveform, 2021-2031 (USD Mn, AGR (%), CAGR (%)) (W – Shaped Recovery)
Figure 140. Europe Military Radar System Market by Waveform, 2021-2031 (USD Mn, AGR (%), CAGR (%)) (U – Shaped Recovery)
Figure 141. Europe Military Radar System Market by Waveform, 2021-2031 (USD Mn, AGR (%), CAGR (%)) (L – Shaped Recovery)
Figure 142. Germany Military Radar System Market by Value, 2021-2031 (USD Mn, AGR (%), CAGR (%))
Figure 143. Germany Military Radar System Market by Value, 2021-2031 (USD Mn, AGR (%), CAGR (%)) (V – Shaped Recovery)
Figure 144. Germany Military Radar System Market by Value, 2021-2031 (USD Mn, AGR (%), CAGR (%)) (W – Shaped Recovery)
Figure 145. Germany Military Radar System Market by Value, 2021-2031 (USD Mn, AGR (%), CAGR (%)) (U – Shaped Recovery)
Figure 146. Germany Military Radar System Market by Value, 2021-2031 (USD Mn, AGR (%), CAGR (%)) (L – Shaped Recovery)
Figure 147. UK Military Radar System Market by Value, 2021-2031 (USD Mn, AGR (%), CAGR (%))
Figure 148. UK Military Radar System Market by Value, 2021-2031 (USD Mn, AGR (%), CAGR (%)) (V – Shaped Recovery)
Figure 149. UK Military Radar System Market by Value, 2021-2031 (USD Mn, AGR (%), CAGR (%)) (W – Shaped Recovery)
Figure 150. UK Military Radar System Market by Value, 2021-2031 (USD Mn, AGR (%), CAGR (%)) (U – Shaped Recovery)
Figure 151. UK Military Radar System Market by Value, 2021-2031 (USD Mn, AGR (%), CAGR (%)) (L – Shaped Recovery)
Figure 152. France Military Radar System Market by Value, 2021-2031 (USD Mn, AGR (%), CAGR (%))
Figure 153. France Military Radar System Market by Value, 2021-2031 (USD Mn, AGR (%), CAGR (%)) (V – Shaped Recovery)
Figure 154. France Military Radar System Market by Value, 2021-2031 (USD Mn, AGR (%), CAGR (%)) (W – Shaped Recovery)
Figure 155. France Military Radar System Market by Value, 2021-2031 (USD Mn, AGR (%), CAGR (%)) (U – Shaped Recovery)
Figure 156. France Military Radar System Market by Value, 2021-2031 (USD Mn, AGR (%), CAGR (%)) (L – Shaped Recovery)
Figure 157. Italy Military Radar System Market by Value, 2021-2031 (USD Mn, AGR (%), CAGR (%))
Figure 158. Italy Military Radar System Market by Value, 2021-2031 (USD Mn, AGR (%), CAGR (%)) (V – Shaped Recovery)
Figure 159. Italy Military Radar System Market by Value, 2021-2031 (USD Mn, AGR (%), CAGR (%)) (W – Shaped Recovery)
Figure 160. Italy Military Radar System Market by Value, 2021-2031 (USD Mn, AGR (%), CAGR (%)) (U – Shaped Recovery)
Figure 161. Italy Military Radar System Market by Value, 2021-2031 (USD Mn, AGR (%), CAGR (%)) (L – Shaped Recovery)
Figure 162. Spain Military Radar System Market by Value, 2021-2031 (USD Mn, AGR (%), CAGR (%))
Figure 163. Spain Military Radar System Market by Value, 2021-2031 (USD Mn, AGR (%), CAGR (%)) (V – Shaped Recovery)
Figure 164. Spain Military Radar System Market by Value, 2021-2031 (USD Mn, AGR (%), CAGR (%)) (W – Shaped Recovery)
Figure 165. Spain Military Radar System Market by Value, 2021-2031 (USD Mn, AGR (%), CAGR (%)) (U – Shaped Recovery)
Figure 166. Spain Military Radar System Market by Value, 2021-2031 (USD Mn, AGR (%), CAGR (%)) (L – Shaped Recovery)
Figure 167. Rest of Europe Military Radar System Market by Value, 2021-2031 (USD Mn, AGR (%), CAGR (%))
Figure 168. Rest of Europe Military Radar System Market by Value, 2021-2031 (USD Mn, AGR (%), CAGR (%)) (V – Shaped Recovery)
Figure 169. Rest of Europe Military Radar System Market by Value, 2021-2031 (USD Mn, AGR (%), CAGR (%)) (W – Shaped Recovery)
Figure 170. Rest of Europe Military Radar System Market by Value, 2021-2031 (USD Mn, AGR (%), CAGR (%)) (U – Shaped Recovery)
Figure 171. Rest of Europe Military Radar System Market by Value, 2021-2031 (USD Mn, AGR (%), CAGR (%)) (L – Shaped Recovery)
Figure 172. Asia-Pacific Military Radar System Market by Value, 2021-2031 (USD Mn, AGR (%), CAGR (%))
Figure 173. Asia-Pacific Military Radar System Market by Value, 2021-2031 (USD Mn, AGR (%), CAGR (%)) (V – Shaped Recovery)
Figure 174. Asia-Pacific Military Radar System Market by Value, 2021-2031 (USD Mn, AGR (%), CAGR (%)) (W – Shaped Recovery)
Figure 175. Asia-Pacific Military Radar System Market by Value, 2021-2031 (USD Mn, AGR (%), CAGR (%)) (U – Shaped Recovery)
Figure 176. Asia-Pacific Military Radar System Market by Value, 2021-2031 (USD Mn, AGR (%), CAGR (%)) (L – Shaped Recovery)
Figure 177. Asia-Pacific Military Radar System Market by Country, 2021-2031 (USD Mn, AGR (%), CAGR (%))
Figure 178. Asia-Pacific Military Radar System Market by Country, 2021-2031 (USD Mn, AGR (%), CAGR(%)) (V – Shaped Recovery)
Figure 179. Asia-Pacific Military Radar System Market by Country, 2021-2031 (USD Mn, AGR (%), CAGR(%)) (W – Shaped Recovery)
Figure 180. Asia-Pacific Military Radar System Market by Country, 2021-2031 (USD Mn, AGR (%), CAGR(%)) (U – Shaped Recovery)
Figure 181. Asia-Pacific Military Radar System Market by Country, 2021-2031 (USD Mn, AGR (%), CAGR(%)) (L – Shaped Recovery)
Figure 182. Asia-Pacific Military Radar System Market by by End-User, 2021-2031 (USD Mn, AGR (%), CAGR (%))
Figure 183. Asia-Pacific Military Radar System Market by by End-User, 2021-2031 (USD Mn, AGR (%), CAGR (%)) (V – Shaped Recovery)
Figure 184. Asia-Pacific Military Radar System Market by by End-User, 2021-2031 (USD Mn, AGR (%), CAGR (%)) (W – Shaped Recovery)
Figure 185. Asia-Pacific Military Radar System Market by by End-User, 2021-2031 (USD Mn, AGR (%), CAGR (%)) (U – Shaped Recovery)
Figure 186. Asia-Pacific Military Radar System Market by by End-User, 2021-2031 (USD Mn, AGR (%), CAGR (%)) (L – Shaped Recovery)
Figure 187. Asia-Pacific Military Radar System Market by Frequency Band, 2021-2031 (USD Mn, AGR (%), CAGR (%))
Figure 188. Asia-Pacific Military Radar System Market by Frequency Band, 2021-2031 (USD Mn, AGR (%), CAGR (%)) (V – Shaped Recovery)
Figure 189. Asia-Pacific Military Radar System Market by Frequency Band, 2021-2031 (USD Mn, AGR (%), CAGR (%)) (W – Shaped Recovery)
Figure 190. Asia-Pacific Military Radar System Market by Frequency Band, 2021-2031 (USD Mn, AGR (%), CAGR (%)) (U – Shaped Recovery)
Figure 191. Asia-Pacific Military Radar System Market by Frequency Band, 2021-2031 (USD Mn, AGR (%), CAGR (%)) (L – Shaped Recovery)
Figure 192. Asia-Pacific Military Radar System Market by Product Type, 2021-2031 (USD Mn, AGR (%), CAGR (%))
Figure 193. Asia-Pacific Military Radar System Market by Product Type, 2021-2031 (USD Mn, AGR (%), CAGR (%)) (V – Shaped Recovery)
Figure 194. Asia-Pacific Military Radar System Market by Product Type, 2021-2031 (USD Mn, AGR (%), CAGR (%)) (W – Shaped Recovery)
Figure 195. Asia-Pacific Military Radar System Market by Product Type, 2021-2031 (USD Mn, AGR (%), CAGR (%)) (U – Shaped Recovery)
Figure 196. Asia-Pacific Military Radar System Market by Product Type, 2021-2031 (USD Mn, AGR (%), CAGR (%)) (L – Shaped Recovery)
Figure 197. Asia-Pacific Military Radar System Market by Application, 2021-2031 (USD Mn, AGR (%), CAGR (%))
Figure 198. Asia-Pacific Military Radar System Market by Application, 2021-2031 (USD Mn, AGR (%), CAGR (%)) (V – Shaped Recovery)
Figure 199. Asia-Pacific Military Radar System Market by Application, 2021-2031 (USD Mn, AGR (%), CAGR (%)) (W – Shaped Recovery)
Figure 200. Asia-Pacific Military Radar System Market by Application, 2021-2031 (USD Mn, AGR (%), CAGR (%)) (U – Shaped Recovery)
Figure 201. Asia-Pacific Military Radar System Market by Application, 2021-2031 (USD Mn, AGR (%), CAGR (%)) (L – Shaped Recovery)
Figure 202. Asia-Pacific Military Radar System Market by Technology, 2021-2031 (USD Mn, AGR (%), CAGR (%))
Figure 203. Asia-Pacific Military Radar System Market by Technology, 2021-2031 (USD Mn, AGR (%), CAGR (%)) (V – Shaped Recovery)
Figure 204. Asia-Pacific Military Radar System Market by Technology, 2021-2031 (USD Mn, AGR (%), CAGR (%)) (W – Shaped Recovery)
Figure 205. Asia-Pacific Military Radar System Market by Technology, 2021-2031 (USD Mn, AGR (%), CAGR (%)) (U – Shaped Recovery)
Figure 206. Asia-Pacific Military Radar System Market by Technology, 2021-2031 (USD Mn, AGR (%), CAGR (%)) (L – Shaped Recovery)
Figure 207. Asia-Pacific Military Radar System Market by Waveform, 2021-2031 (USD Mn, AGR (%), CAGR (%))
Figure 208. Asia-Pacific Military Radar System Market by Waveform, 2021-2031 (USD Mn, AGR (%), CAGR (%)) (V – Shaped Recovery)
Figure 209. Asia-Pacific Military Radar System Market by Waveform, 2021-2031 (USD Mn, AGR (%), CAGR (%)) (W – Shaped Recovery)
Figure 210. Asia-Pacific Military Radar System Market by Waveform, 2021-2031 (USD Mn, AGR (%), CAGR (%)) (U – Shaped Recovery)
Figure 211. Asia-Pacific Military Radar System Market by Waveform, 2021-2031 (USD Mn, AGR (%), CAGR (%)) (L – Shaped Recovery)
Figure 212. China Asia-Pacific Military Radar System Market by Value, 2021-2031 (USD Mn, AGR (%), CAGR (%))
Figure 213. China Military Radar System Market by Value, 2021-2031 (USD Mn, AGR (%), CAGR (%)) (V – Shaped Recovery)
Figure 214. China Military Radar System Market by Value, 2021-2031 (USD Mn, AGR (%), CAGR (%)) (W – Shaped Recovery)
Figure 215. China Military Radar System Market by Value, 2021-2031 (USD Mn, AGR (%), CAGR (%)) (U – Shaped Recovery)
Figure 216. China Military Radar System Market by Value, 2021-2031 (USD Mn, AGR (%), CAGR (%)) (L – Shaped Recovery)
Figure 217. India Asia-Pacific Military Radar System Market by Value, 2021-2031 (USD Mn, AGR (%), CAGR (%))
Figure 218. India Military Radar System Market by Value, 2021-2031 (USD Mn, AGR (%), CAGR (%)) (V – Shaped Recovery)
Figure 219. India Military Radar System Market by Value, 2021-2031 (USD Mn, AGR (%), CAGR (%)) (W – Shaped Recovery)
Figure 220. India Military Radar System Market by Value, 2021-2031 (USD Mn, AGR (%), CAGR (%)) (U – Shaped Recovery)
Figure 221. India Military Radar System Market by Value, 2021-2031 (USD Mn, AGR (%), CAGR (%)) (L – Shaped Recovery)
Figure 222. Japan Military Radar System Market by Value, 2021-2031 (USD Mn, AGR (%), CAGR (%))
Figure 223. Japan Military Radar System Market by Value, 2021-2031 (USD Mn, AGR (%), CAGR (%)) (V – Shaped Recovery)
Figure 224. Japan Military Radar System Market by Value, 2021-2031 (USD Mn, AGR (%), CAGR (%)) (W – Shaped Recovery)
Figure 225. Japan Military Radar System Market by Value, 2021-2031 (USD Mn, AGR (%), CAGR (%)) (U – Shaped Recovery)
Figure 226. Japan Military Radar System Market by Value, 2021-2031 (USD Mn, AGR (%), CAGR (%)) (L – Shaped Recovery)
Figure 227. South Korea Military Radar System Market by Value, 2021-2031 (USD Mn, AGR (%), CAGR (%))
Figure 228. South Korea Military Radar System Market by Value, 2021-2031 (USD Mn, AGR (%), CAGR (%)) (V – Shaped Recovery)
Figure 229. South Korea Military Radar System Market by Value, 2021-2031 (USD Mn, AGR (%), CAGR (%)) (W – Shaped Recovery)
Figure 230. South Korea Military Radar System Market by Value, 2021-2031 (USD Mn, AGR (%), CAGR (%)) (U – Shaped Recovery)
Figure 231. South Korea Military Radar System Market by Value, 2021-2031 (USD Mn, AGR (%), CAGR (%)) (L – Shaped Recovery)
Figure 232. Australia Military Radar System Market by Value, 2021-2031 (USD Mn, AGR (%), CAGR (%))
Figure 233. Australia Military Radar System Market by Value, 2021-2031 (USD Mn, AGR (%), CAGR (%)) (V – Shaped Recovery)
Figure 234. Australia Military Radar System Market by Value, 2021-2031 (USD Mn, AGR (%), CAGR (%)) (W – Shaped Recovery)
Figure 235. Australia Military Radar System Market by Value, 2021-2031 (USD Mn, AGR (%), CAGR (%)) (U – Shaped Recovery)
Figure 236. Australia Military Radar System Market by Value, 2021-2031 (USD Mn, AGR (%), CAGR (%)) (L – Shaped Recovery)
Figure 237. Rest of Asia-Pacific Military Radar System Market by Value, 2021-2031 (USD Mn, AGR (%), CAGR (%))
Figure 238. Rest of Asia-Pacific Military Radar System Market by Value, 2021-2031 (USD Mn, AGR (%), CAGR (%)) (V – Shaped Recovery)
Figure 239. Rest of Asia-Pacific Military Radar System Market by Value, 2021-2031 (USD Mn, AGR (%), CAGR (%)) (W – Shaped Recovery)
Figure 240. Rest of Asia-Pacific Military Radar System Market by Value, 2021-2031 (USD Mn, AGR (%), CAGR (%)) (U – Shaped Recovery)
Figure 241. Rest of Asia-Pacific Military Radar System Market by Value, 2021-2031 (USD Mn, AGR (%), CAGR (%)) (L – Shaped Recovery)
Figure 242. Latin America Military Radar System Market by Value, 2021-2031 (USD Mn, AGR (%), CAGR (%))
Figure 243. Latin America Military Radar System Market by Value, 2021-2031 (USD Mn, AGR (%), CAGR (%)) (V – Shaped Recovery)
Figure 244. Latin America Military Radar System Market by Value, 2021-2031 (USD Mn, AGR (%), CAGR (%)) (W – Shaped Recovery)
Figure 245. Latin America Military Radar System Market by Value, 2021-2031 (USD Mn, AGR (%), CAGR (%)) (U – Shaped Recovery)
Figure 246. Latin America Military Radar System Market by Value, 2021-2031 (USD Mn, AGR (%), CAGR (%)) (L – Shaped Recovery)
Figure 247. Latin America Military Radar System Market by Country, 2021-2031 (USD Mn, AGR (%), CAGR (%))
Figure 248. Latin America Military Radar System Market by Country, 2021-2031 (USD Mn, AGR (%), CAGR(%)) (V – Shaped Recovery)
Figure 249. Latin America Military Radar System Market by Country, 2021-2031 (USD Mn, AGR (%), CAGR(%)) (W – Shaped Recovery)
Figure 250. Latin America Military Radar System Market by Country, 2021-2031 (USD Mn, AGR (%), CAGR(%)) (U – Shaped Recovery)
Figure 251. Latin America Military Radar System Market by Country, 2021-2031 (USD Mn, AGR (%), CAGR(%)) (L – Shaped Recovery)
Figure 252. Latin America Military Radar System Market by End-User, 2021-2031 (USD Mn, AGR (%), CAGR (%))
Figure 253. Latin America Military Radar System Market by End-User, 2021-2031 (USD Mn, AGR (%), CAGR (%)) (V – Shaped Recovery)
Figure 254. Latin America Military Radar System Market by End-User, 2021-2031 (USD Mn, AGR (%), CAGR (%)) (W – Shaped Recovery)
Figure 255. Latin America Military Radar System Market by End-User, 2021-2031 (USD Mn, AGR (%), CAGR (%)) (U – Shaped Recovery)
Figure 256. Latin America Military Radar System Market by End-User, 2021-2031 (USD Mn, AGR (%), CAGR (%)) (L – Shaped Recovery)
Figure 257. Latin America Military Radar System Market by Frequency Band, 2021-2031 (USD Mn, AGR (%), CAGR (%))
Figure 258. Latin America Military Radar System Market by Frequency Band, 2021-2031 (USD Mn, AGR (%), CAGR (%)) (V – Shaped Recovery)
Figure 259. Latin America Military Radar System Market by Frequency Band, 2021-2031 (USD Mn, AGR (%), CAGR (%)) (W – Shaped Recovery)
Figure 260. Latin America Military Radar System Market by Frequency Band, 2021-2031 (USD Mn, AGR (%), CAGR (%)) (U – Shaped Recovery)
Figure 261. Latin America Military Radar System Market by Frequency Band, 2021-2031 (USD Mn, AGR (%), CAGR (%)) (L – Shaped Recovery)
Figure 262. Latin America Military Radar System Market by Product Type, 2021-2031 (USD Mn, AGR (%), CAGR (%))
Figure 263. Latin America Military Radar System Market by Product Type, 2021-2031 (USD Mn, AGR (%), CAGR (%)) (V – Shaped Recovery)
Figure 264. Latin America Military Radar System Market by Product Type, 2021-2031 (USD Mn, AGR (%), CAGR (%)) (W – Shaped Recovery)
Figure 265. Latin America Military Radar System Market by Product Type, 2021-2031 (USD Mn, AGR (%), CAGR (%)) (U – Shaped Recovery)
Figure 266. Latin America Military Radar System Market by Product Type, 2021-2031 (USD Mn, AGR (%), CAGR (%)) (L – Shaped Recovery)
Figure 267. Latin America Military Radar System Market by Application, 2021-2031 (USD Mn, AGR (%), CAGR (%))
Figure 268. Latin America Military Radar System Market by Application, 2021-2031 (USD Mn, AGR (%), CAGR (%)) (V – Shaped Recovery)
Figure 269. Latin America Military Radar System Market by Application, 2021-2031 (USD Mn, AGR (%), CAGR (%)) (W – Shaped Recovery)
Figure 270. Latin America Military Radar System Market by Application, 2021-2031 (USD Mn, AGR (%), CAGR (%)) (U – Shaped Recovery)
Figure 271. Latin America Military Radar System Market by Application, 2021-2031 (USD Mn, AGR (%), CAGR (%)) (L – Shaped Recovery)
Figure 272. Latin America Military Radar System Market by Technology, 2021-2031 (USD Mn, AGR (%), CAGR (%))
Figure 273. Latin America Military Radar System Market by Technology, 2021-2031 (USD Mn, AGR (%), CAGR (%)) (V – Shaped Recovery)
Figure 274. Latin America Military Radar System Market by Technology, 2021-2031 (USD Mn, AGR (%), CAGR (%)) (W – Shaped Recovery)
Figure 275. Latin America Military Radar System Market by Technology, 2021-2031 (USD Mn, AGR (%), CAGR (%)) (U – Shaped Recovery)
Figure 276. Latin America Military Radar System Market by Technology, 2021-2031 (USD Mn, AGR (%), CAGR (%)) (L – Shaped Recovery)
Figure 277. Latin America Military Radar System Market by Waveform, 2021-2031 (USD Mn, AGR (%), CAGR (%))
Figure 278. Latin America Military Radar System Market by Waveform, 2021-2031 (USD Mn, AGR (%), CAGR (%)) (V – Shaped Recovery)
Figure 279. Latin America Military Radar System Market by Waveform, 2021-2031 (USD Mn, AGR (%), CAGR (%)) (W – Shaped Recovery)
Figure 280. Latin America Military Radar System Market by Waveform, 2021-2031 (USD Mn, AGR (%), CAGR (%)) (U – Shaped Recovery)
Figure 281. Latin America Military Radar System Market by Waveform, 2021-2031 (USD Mn, AGR (%), CAGR (%)) (L – Shaped Recovery)
Figure 282. Latin America Military Radar System Market by Value, 2021-2031 (USD Mn, AGR (%), CAGR (%))
Figure 283. Brazil Military Radar System Market by Value, 2021-2031 (USD Mn, AGR (%), CAGR (%)) (V – Shaped Recovery)
Figure 284. Brazil Military Radar System Market by Value, 2021-2031 (USD Mn, AGR (%), CAGR (%)) (W – Shaped Recovery)
Figure 285. Brazil Military Radar System Market by Value, 2021-2031 (USD Mn, AGR (%), CAGR (%)) (U – Shaped Recovery)
Figure 286. Brazil Military Radar System Market by Value, 2021-2031 (USD Mn, AGR (%), CAGR (%)) (L – Shaped Recovery)
Figure 287. Mexico Military Radar System Market by Value, 2021-2031 (USD Mn, AGR (%), CAGR (%))
Figure 288. Mexico Military Radar System Market by Value, 2021-2031 (USD Mn, AGR (%), CAGR (%)) (V – Shaped Recovery)
Figure 289. Mexico Military Radar System Market by Value, 2021-2031 (USD Mn, AGR (%), CAGR (%)) (W – Shaped Recovery)
Figure 290. Mexico Military Radar System Market by Value, 2021-2031 (USD Mn, AGR (%), CAGR (%)) (U – Shaped Recovery)
Figure 291. Mexico Military Radar System Market by Value, 2021-2031 (USD Mn, AGR (%), CAGR (%)) (L – Shaped Recovery)
Figure 292. Argentina Military Radar System Market by Value, 2021-2031 (USD Mn, AGR (%), CAGR (%))
Figure 293. Argentina Military Radar System Market by Value, 2021-2031 (USD Mn, AGR (%), CAGR (%)) (V – Shaped Recovery)
Figure 294. Argentina Military Radar System Market by Value, 2021-2031 (USD Mn, AGR (%), CAGR (%)) (W – Shaped Recovery)
Figure 295. Argentina Military Radar System Market by Value, 2021-2031 (USD Mn, AGR (%), CAGR (%)) (U – Shaped Recovery)
Figure 296. Argentina Military Radar System Market by Value, 2021-2031 (USD Mn, AGR (%), CAGR (%)) (L – Shaped Recovery)
Figure 297. Rest of Latin America Military Radar System Market by Value, 2021-2031 (USD Mn, AGR (%), CAGR (%))
Figure 298. Rest of Latin America Military Radar System Market by Value, 2021-2031 (USD Mn, AGR (%), CAGR (%)) (V – Shaped Recovery)
Figure 299. Rest of Latin America Military Radar System Market by Value, 2021-2031 (USD Mn, AGR (%), CAGR (%)) (W – Shaped Recovery)
Figure 300. Rest of Latin America Military Radar System Market by Value, 2021-2031 (USD Mn, AGR (%), CAGR (%)) (U – Shaped Recovery)
Figure 301. Rest of Latin America Military Radar System Market by Value, 2021-2031 (USD Mn, AGR (%), CAGR (%)) (L – Shaped Recovery)
Figure 302. Middle East & Africa Military Radar System Market by Value, 2021-2031 (USD Mn, AGR (%), CAGR (%))
Figure 303. Middle East & Africa Military Radar System Market by Value, 2021-2031 (USD Mn, AGR (%), CAGR (%)) (V – Shaped Recovery)
Figure 304. Middle East & Africa Military Radar System Market by Value, 2021-2031 (USD Mn, AGR (%), CAGR (%)) (W – Shaped Recovery)
Figure 305. Middle East & Africa Military Radar System Market by Value, 2021-2031 (USD Mn, AGR (%), CAGR (%)) (U – Shaped Recovery)
Figure 306. Middle East & Africa Military Radar System Market by Value, 2021-2031 (USD Mn, AGR (%), CAGR (%)) (L – Shaped Recovery)
Figure 307. Middle East & Africa Military Radar System Market by Country, 2021-2031 (USD Mn, AGR (%), CAGR (%))
Figure 308. Middle East & Africa Military Radar System Market by Country, 2021-2031 (USD Mn, AGR (%), CAGR(%)) (V – Shaped Recovery)
Figure 309. Middle East & Africa Military Radar System Market by Country, 2021-2031 (USD Mn, AGR (%), CAGR(%)) (W – Shaped Recovery)
Figure 310. Middle East & Africa Military Radar System Market by Country, 2021-2031 (USD Mn, AGR (%), CAGR(%)) (U – Shaped Recovery)
Figure 311. Middle East & Africa Military Radar System Market by Country, 2021-2031 (USD Mn, AGR (%), CAGR(%)) (L – Shaped Recovery)
Figure 312. Middle East & Africa Military Radar System Market by End-User, 2021-2031 (USD Mn, AGR (%), CAGR (%))
Figure 313. Middle East & Africa Military Radar System Market by End-User, 2021-2031 (USD Mn, AGR (%), CAGR (%)) (V – Shaped Recovery)
Figure 314. Middle East & Africa Military Radar System Market by End-User, 2021-2031 (USD Mn, AGR (%), CAGR (%)) (W – Shaped Recovery)
Figure 315. Middle East & Africa Military Radar System Market by End-User, 2021-2031 (USD Mn, AGR (%), CAGR (%)) (U – Shaped Recovery)
Figure 316. Middle East & Africa Military Radar System Market by End-User, 2021-2031 (USD Mn, AGR (%), CAGR (%)) (L – Shaped Recovery)
Figure 317. Middle East & Africa Military Radar System Market by Frequency Band, 2021-2031 (USD Mn, AGR (%), CAGR (%))
Figure 318. Middle East & Africa Military Radar System Market by Frequency Band, 2021-2031 (USD Mn, AGR (%), CAGR (%)) (V – Shaped Recovery)
Figure 319. Middle East & Africa Military Radar System Market by Frequency Band, 2021-2031 (USD Mn, AGR (%), CAGR (%)) (W – Shaped Recovery)
Figure 320. Middle East & Africa Military Radar System Market by Frequency Band, 2021-2031 (USD Mn, AGR (%), CAGR (%)) (U – Shaped Recovery)
Figure 321. Middle East & Africa Military Radar System Market by Frequency Band, 2021-2031 (USD Mn, AGR (%), CAGR (%)) (L – Shaped Recovery)
Figure 322. Middle East & Africa Military Radar System Market by Product Type, 2021-2031 (USD Mn, AGR (%), CAGR (%))
Figure 323. Middle East & Africa Military Radar System Market by Product Type, 2021-2031 (USD Mn, AGR (%), CAGR (%)) (V – Shaped Recovery)
Figure 324. Middle East & Africa Military Radar System Market by Product Type, 2021-2031 (USD Mn, AGR (%), CAGR (%)) (W – Shaped Recovery)
Figure 325. Middle East & Africa Military Radar System Market by Product Type, 2021-2031 (USD Mn, AGR (%), CAGR (%)) (U – Shaped Recovery)
Figure 326. Middle East & Africa Military Radar System Market by Product Type, 2021-2031 (USD Mn, AGR (%), CAGR (%)) (L – Shaped Recovery)
Figure 327. Middle East & Africa Military Radar System Market by Application, 2021-2031 (USD Mn, AGR (%), CAGR (%))
Figure 328. Middle East & Africa Military Radar System Market by Application, 2021-2031 (USD Mn, AGR (%), CAGR (%)) (V – Shaped Recovery)
Figure 329. Middle East & Africa Military Radar System Market by Application, 2021-2031 (USD Mn, AGR (%), CAGR (%)) (W – Shaped Recovery)
Figure 330. Middle East & Africa Military Radar System Market by Application, 2021-2031 (USD Mn, AGR (%), CAGR (%)) (U – Shaped Recovery)
Figure 331. Middle East & Africa Military Radar System Market by Application, 2021-2031 (USD Mn, AGR (%), CAGR (%)) (L – Shaped Recovery)
Figure 332. Middle East & Africa Military Radar System Market by Technology, 2021-2031 (USD Mn, AGR (%), CAGR (%))
Figure 333. Middle East & Africa Military Radar System Market by Technology, 2021-2031 (USD Mn, AGR (%), CAGR (%)) (V – Shaped Recovery)
Figure 334. Middle East & Africa Military Radar System Market by Technology, 2021-2031 (USD Mn, AGR (%), CAGR (%)) (W – Shaped Recovery)
Figure 335. Middle East & Africa Military Radar System Market by Technology, 2021-2031 (USD Mn, AGR (%), CAGR (%)) (U – Shaped Recovery)
Figure 336. Middle East & Africa Military Radar System Market by Technology, 2021-2031 (USD Mn, AGR (%), CAGR (%)) (L – Shaped Recovery)
Figure 337. Middle East & Africa Military Radar System Market by Waveform, 2021-2031 (USD Mn, AGR (%), CAGR (%))
Figure 338. Middle East & Africa Military Radar System Market by Waveform, 2021-2031 (USD Mn, AGR (%), CAGR (%)) (V – Shaped Recovery)
Figure 339. Middle East & Africa Military Radar System Market by Waveform, 2021-2031 (USD Mn, AGR (%), CAGR (%)) (W – Shaped Recovery)
Figure 340. Middle East & Africa Military Radar System Market by Waveform, 2021-2031 (USD Mn, AGR (%), CAGR (%)) (U – Shaped Recovery)
Figure 341. Middle East & Africa Military Radar System Market by Waveform, 2021-2031 (USD Mn, AGR (%), CAGR (%)) (L – Shaped Recovery)
Figure 342. Middle East & Africa Military Radar System Market by Value, 2021-2031 (USD Mn, AGR (%), CAGR (%))
Figure 343. Saudi Arabia Military Radar System Market by Value, 2021-2031 (USD Mn, AGR (%), CAGR (%)) (V – Shaped Recovery)
Figure 344. Saudi Arabia Military Radar System Market by Value, 2021-2031 (USD Mn, AGR (%), CAGR (%)) (W – Shaped Recovery)
Figure 345. Saudi Arabia Military Radar System Market by Value, 2021-2031 (USD Mn, AGR (%), CAGR (%)) (U – Shaped Recovery)
Figure 346. Saudi Arabia Military Radar System Market by Value, 2021-2031 (USD Mn, AGR (%), CAGR (%)) (L – Shaped Recovery)
Figure 347. UAE Military Radar System Market by Value, 2021-2031 (USD Mn, AGR (%), CAGR (%))
Figure 348. UAE Military Radar System Market by Value, 2021-2031 (USD Mn, AGR (%), CAGR (%)) (V – Shaped Recovery)
Figure 349. UAE Military Radar System Market by Value, 2021-2031 (USD Mn, AGR (%), CAGR (%)) (W – Shaped Recovery)
Figure 350. UAE Military Radar System Market by Value, 2021-2031 (USD Mn, AGR (%), CAGR (%)) (U – Shaped Recovery)
Figure 351. UAE Military Radar System Market by Value, 2021-2031 (USD Mn, AGR (%), CAGR (%)) (L – Shaped Recovery)
Figure 352. Turkey Military Radar System Market by Value, 2021-2031 (USD Mn, AGR (%), CAGR (%))
Figure 353. Turkey Military Radar System Market by Value, 2021-2031 (USD Mn, AGR (%), CAGR (%)) (V – Shaped Recovery)
Figure 354. Turkey Military Radar System Market by Value, 2021-2031 (USD Mn, AGR (%), CAGR (%)) (W – Shaped Recovery)
Figure 355. Turkey Military Radar System Market by Value, 2021-2031 (USD Mn, AGR (%), CAGR (%)) (U – Shaped Recovery)
Figure 356. Turkey Military Radar System Market by Value, 2021-2031 (USD Mn, AGR (%), CAGR (%)) (L – Shaped Recovery)
Figure 357. South Africa Military Radar System Market by Value, 2021-2031 (USD Mn, AGR (%), CAGR (%))
Figure 358. South Africa Military Radar System Market by Value, 2021-2031 (USD Mn, AGR (%), CAGR (%)) (V – Shaped Recovery)
Figure 359. South Africa Military Radar System Market by Value, 2021-2031 (USD Mn, AGR (%), CAGR (%)) (W – Shaped Recovery)
Figure 360. South Africa Military Radar System Market by Value, 2021-2031 (USD Mn, AGR (%), CAGR (%)) (U – Shaped Recovery)
Figure 361. South Africa Military Radar System Market by Value, 2021-2031 (USD Mn, AGR (%), CAGR (%)) (L – Shaped Recovery)
Figure 362. Israel Military Radar System Market by Value, 2021-2031 (USD Mn, AGR (%), CAGR (%))
Figure 363. Israel Military Radar System Market by Value, 2021-2031 (USD Mn, AGR (%), CAGR (%)) (V – Shaped Recovery)
Figure 364. Israel Military Radar System Market by Value, 2021-2031 (USD Mn, AGR (%), CAGR (%)) (W – Shaped Recovery)
Figure 365. Israel Military Radar System Market by Value, 2021-2031 (USD Mn, AGR (%), CAGR (%)) (U – Shaped Recovery)
Figure 366. Israel Military Radar System Market by Value, 2021-2031 (USD Mn, AGR (%), CAGR (%)) (L – Shaped Recovery)
Figure 367. Rest of Middle East & Africa Military Radar System Market by Value, 2021-2031 (USD Mn, AGR (%), CAGR (%))
Figure 368. Rest of Middle East & Africa Military Radar System Market by Value, 2021-2031 (USD Mn, AGR (%), CAGR (%)) (V – Shaped Recovery)
Figure 369. Rest of Middle East & Africa Military Radar System Market by Value, 2021-2031 (USD Mn, AGR (%), CAGR (%)) (W – Shaped Recovery)
Figure 370. Rest of Middle East & Africa Military Radar System Market by Value, 2021-2031 (USD Mn, AGR (%), CAGR (%)) (U – Shaped Recovery)
Figure 371. Rest of Middle East & Africa Military Radar System Market by Value, 2021-2031 (USD Mn, AGR (%), CAGR (%)) (L – Shaped Recovery)
Figure 372. Elbit Systems Limited: Company Revenue 2016-2020 (US$Mn, AGR %)
Figure 373. Elbit Systems Limited: Company Operating Income 2016-2020 (US$Mn, AGR %)
Figure 374. Elbit Systems Limited: Company Net Income 2016-2020 (US$Mn, AGR %)
Figure 375. Elbit Systems Limited: Company EBITDA 2016-2020 (US$Mn, AGR %)
Figure 376. L3 Harris Technologies Inc.: Company Revenue 2017-2021 (US$Mn, AGR %)
Figure 377. L3 Harris Technologies Inc.: Company Operating Income 2017-2021 (US$Mn, AGR %)
Figure 378. L3 Harris Technologies Inc.: Company Net Income 2016-2020 (US$Mn, AGR %)
Figure 379. L3 Harris Technologies Inc.: Company EBITDA 2016-2020 (US$Mn, AGR %)
Figure 380. Lockheed Martin Corporation: Company Revenue 2016-2020 (US$Mn, AGR %)
Figure 381. Lockheed Martin Corporation: Company Operating Income 2016-2020 (US$Mn, AGR %)
Figure 382. Lockheed Martin Corporation: Company Net Income 2016-2020 (US$Mn, AGR %)
Figure 383. Lockheed Martin Corporation: Company EBITDA 2016-2020 (US$Mn, AGR %)
Figure 384. Raytheon : Company Revenue 2016-2020 (US$Mn, AGR %)
Figure 385. Raytheon : Company Operating Income 2016-2020 (US$Mn, AGR %)
Figure 386. Raytheon : Company Net Income 2016-2020 (US$Mn, AGR %)
Figure 387. Raytheon : Company EBITDA 2016-2020 (US$Mn, AGR %)
Figure 388. Rheinmetal AG: Company Revenue 2016-2020 (US$Mn, AGR %)
Figure 389. Rheinmetal AG: Company Operating Income 2016-2020 (US$Mn, AGR %)
Figure 390. Rheinmetal AG: Company Net Income 2016-2020 (US$Mn, AGR %)
Figure 391. Rheinmetal AG: Company EBITDA 2016-2020 (US$Mn, AGR %)
Figure 392. Thales: Company Revenue 2016-2020 (US$Mn, AGR %)
Figure 393. Thales: Company Operating Income 2016-2020 (US$Mn, AGR %)
Figure 394. Thales: Company Net Income 2016-2020 (US$Mn, AGR %)
Figure 395. Thales: Company EBITDA 2016-2020 (US$Mn, AGR %)
Figure 396. Ball Aerospace and Technologies Corp.: Company Revenue 2016-2020 (US$Mn, AGR %)
Figure 397. Ball Aerospace and Technologies Corp.: Company Operating Income 2016-2020 (US$Mn, AGR %)
Figure 398. Ball Aerospace and Technologies Corp.: Company Net Income 2016-2020 (US$Mn, AGR %)
Figure 399. Ball Aerospace and Technologies Corp.: Company EBITDA 2016-2020 (US$Mn, AGR %)
Figure 400. Honeywell International Inc: Company Revenue 2016-2020 (US$Mn, AGR %)
Figure 401. Honeywell International Inc: Company Operating Income 2016-2020 (US$Mn, AGR %)
Figure 402. Honeywell International Inc: Company Net Income 2016-2020 (US$Mn, AGR %)
Figure 403. Honeywell International Inc: Company EBITDA 2016-2020 (US$Mn, AGR %)
Figure 404. Leonardo Spa: Company Revenue 2016-2020 (US$Mn, AGR %)
Figure 405. Leonardo Spa: Company Operating Income 2016-2020 (US$Mn, AGR %)
Figure 406. Leonardo Spa: Company Net Income 2016-2020 (US$Mn, AGR %)
Figure 407. Leonardo Spa: Company EBITDA 2016-2020 (US$Mn, AGR %)
Figure 408. Mercury Systems Inc.: Company Revenue 2017-2021 (US$Mn, AGR %)
Figure 409. Mercury Systems Inc.: Company Operating Income 2017-2021 (US$Mn, AGR %)
Figure 410. Mercury Systems Inc.: Company Net Income 2017-2021 (US$Mn, AGR %)
Figure 411. Mercury Systems Inc.: Company EBITDA 2017-2021 (US$Mn, AGR %)
Figure 412. Northrop Grumman Corporation: Company Revenue 2016-2020 (US$Mn, AGR %)
Figure 413. Northrop Grumman Corporation: Company Operating Income 2016-2020 (US$Mn, AGR %)
Figure 414. Northrop Grumman Corporation: Company Net Income 2016-2020 (US$Mn, AGR %)
Figure 415. Northrop Grumman Corporation: Company EBITDA 2016-2020 (US$Mn, AGR %)
Figure 416. Saab AB: Company Revenue 2016-2020 (US$Mn, AGR %)
Figure 417. Saab AB: Company Operating Income 2016-2020 (US$Mn, AGR %)
Figure 418. Saab AB: Company Net Income 2016-2020 (US$Mn, AGR %)
Figure 419. Saab AB: Company EBITDA 2016-2020 (US$Mn, AGR %)
Figure 420. Dassault Aviation: Company Revenue 2016-2020 (US$Mn, AGR %)
Figure 421. Dassault Aviation: Company Operating Income 2016-2020 (US$Mn, AGR %)
Figure 422. Dassault Aviation: Company Net Income 2016-2020 (US$Mn, AGR %)
Figure 423. Dassault Aviation: Company EBITDA 2016-2020 (US$Mn, AGR %)
Figure 424. Bae Systems : Company Revenue 2016-2020 (US$Mn, AGR %)
Figure 425. Bae Systems : Company Operating Income 2016-2020 (US$Mn, AGR %)
Figure 426. Bae Systems : Company Net Income 2016-2020 (US$Mn, AGR %)
Figure 427. Bae Systems : Company EBITDA 2016-2020 (US$Mn, AGR %)
Figure 428. General Dynamics : Company Revenue 2016-2020 (US$Mn, AGR %)
Figure 429. General Dynamics : Company Operating Income 2016-2020 (US$Mn, AGR %)
Figure 430. General Dynamics : Company Net Income 2016-2020 (US$Mn, AGR %)
Figure 431. General Dynamics : Company EBITDA 2016-2020 (US$Mn, AGR %)
Figure 432. Miltary Radar Systems Market by Company Share, 2020 (%)
Figure 433. Miltary Radar Systems Market by Key Business Strategy, 2018-2021 (%)
Figure 434. Global Miltary Radar System Market Share Forecast by Region 2021, 2026, 2031 (%)
Bae Systems
Ball Aerospace and Technologies Corp.
Blighter Surveillance Systems Ltd.
CEA Technologies
Dassault Aviation
Elbit Systems Limited
Flir Systems Inc.
General Atomics Aeronautical Systems, Inc.
General Dynamics
Honeywell International Inc
Israel Aerospace Industries
L3 Harris Technologies Inc.
Leonardo Spa
Lockheed Martin Corporation
Mercury Systems Inc.
Northrop Grumman Corporation
Raytheon Technologies Corp
Rheinmetal AG
Saab AB
Thales SA
List of Other Companies Mentioned in the report
Amur Shipbuilding Plant
ARCTEC Alaska JV
Arralis
Aselsan AS
Babcock
BAE Systems
BAE Systems Technology Solutions & Services Inc.
BAE Systems, Information and Electronic Systems Integration Inc.
Ball Aerospace and Technologies Corp. Tactical Solutions
Basant Private Aerospace Limited
Basic Commerce & Industries Inc
Bath Iron Works
BEDEK Aviation
Bell-Boeing Joint Project Office
Beriev
Bharat Electronics Ltd.
Blighter Surveillance Systems Ltd
Boeing
CEA Technologies
Chengdu
China North Industries Group Corporation
Concern Radio-Electronic Technologies (KRET)
Daher
Dassault Aviation
DRS Power & Control Technologies, Inc
Elibit Systems
ELTA System Ltd
Embraer
Eurofighter Jadgflugzeug GmbH
Exelis Inc.
General Atomics Aeronautical Systems, Inc
General Dynamics Advanced Information Systems
General Dynamics Corporation
Georgia Tech Applied Research Corp.
Griffon Corp.
Harris Corporation
Hensoldt GmbH
Hindustan Aeronautics Limited (HAL)
Honeywell International Defense and Space
Huntington Ingalls Inc
IBCOL
Indra
Indra Espacio
Innovative Signal Analysis
Interstate Electronics Corp
Israel Aerospace Industries
ITT Corporation
JSC Almaz-Antey
JSC PO Sevmash
JSC V.V. Tikhomirov Scientific Research Institute of Instrument Design (NIIP)
Kelvin Hughes
KnAAPO
Kongsberg D&A
L-3 Communications and Communications & Power Industries
L-3 Communications Corp.
L-3 Technologies
LEIDOS Inc
Leonardo SpA
LIG Nex1
Lockheed Martin Corp., Aeronautics Co.
Lockheed Martin Corporation
Lockheed Martin Mission Systems and Training
Lockheed Martin Rotary and Mission Systems
Lockheed Martin UK
Longbow LLC
MacAulay-Brown Inc.
MacDonald, Dettwiler and Associates (MDA)
Mahindra Group
Mahindra Telephonics Integrated Systems (MTIS)
MBDA
Mikoyan Guryevich Design Bureau
Mil (Mil Moscow Helicopter Plant)
Minelab
Mitsubishi Heavy Industries
NIITEK
Northrop Grumman
Northrop Grumman Corp. - Aerospace Systems
Northrop Grumman Corp. Electronic Systems
NOVA Integrated Systems Limited
OHB System AG
Orbital Sciences Corp
Phazotron-NIIR
RADA Electronic Industries
Radio-Electronic Technologies (KRET)
Rafael Advanced Defence Systems
Raytheon Canada Limited
Raytheon Co. Space and Airborne Systems
Raytheon Company
Raytheon Integrated Defense Systems
Raytheon Technical Services
RDRTec, Inc.
Rheinmetall Canada Inc
Robin Radar Systems B.V.
Rockwell Collins
Rubin Central Design Bureau for Marine Engineering
Russian Aircraft Corporation MiG
Saab AB
Saab Defence and Security
Saab Microwave Canada Ltd
Selex ES
Sener
Shenyang
Socata
SRCTec Inc
STELIA Group
STKB Granit
Sukhoi
Tata Advanced Systems Ltd
TASC, Inc (formerly known as The Analytic Sciences Corporation, Inc)
Technovative Applications
Telephonics Corp
Telephonics Corp. Communications & Integrated Systems Division
Telespazio.
Terma A/S
Thales
Thales Alenia Space
Thales Canada
Thales Raytheon Systems
The Analytic Sciences Corp. Inc.
ThyssenKrupp Marine Systems AB
TOTE Services Inc.
United Technologies Corporation
WR Systems Ltd.
List of Associations Mentioned in the Report
Aerospace Industries Association
Air Force Life Cycle Management Center
Agency for Defense Development (ADD
Air National Guard (ANG)
Baylor University's School of Engineering and Computer Science
Brazilian Airforce
Canadian Air Force
Canadian Armed Forces
Defence Advanced Research Projects Agency (DARPA)
Defense Security Cooperation Agency (DSCA)
Egyptian Airforce
European Union
Federal Aviation Authority (FAA)
Federal Communications Commission (FCC)
“Federal Research and Production Center” Nizhny Novgorod Research Institute of Radio “(JSC” FNPC “NNIIRT”)
Fraunhofer Institute for High Frequency Physics and Radar Techniques
German Armed Forces
Indian Airforce
Indian Armed Forces
Indian Ministry of Defence
Indian Navy
Intelligent Perception Technology Laboratory of the 14th Institute of CETC duplication
Intelligent Perception Technology Laboratory of the 14th Institute of China Electronics Technology Group Corporation (CETC)
International Trade Administration
Iraqi Airforce
Islamic State group
Italian AirForce
Kazakh Airforce
Japan's Aerospace Exploration Agency (JAXA)
Japanese Armed Forces
Latvia Defence Forces
Make in India
Marine Corps
Mexican Armed Forces
Missile Defense Agency
Moroccan Airforce
NATO
NATO Eurofighter and Tornado Management Agency (NETMA)
Naval Air Systems Command
North American Aerospace Defense Command (NORAD)
Office of Naval Research (ONR)
Omani Airforce
Pakistani Armed Forces
Pentagon
People’s Liberation Army
People’s Liberation Army Navy
People’s Liberation Army Air Force (PLAAF)
Qatari Armed Forces
Rosoboronexport
Rostec
Royal Airforce (RAF)
Royal Navy
Royal Saudi Air Force
Royal Saudi Arabian National Guard
Royal Saudi Armed Forces
Russian Aerospace Forces
Russian Air Force
Russian Armed Forces
Russian Ground Forces
Scientific Research Center
Singapore Military Organization
South Korean Armed Forces
Space and Missile Systems Center
Spanish Armed Forces
Spanish Ministry of Defence
Stockholm International Peace Research Institute (SIPRI)
Tornado Management Agency (NETMA
Turkish Armed Forces
U.K Royal Navy
U.S. Army Research Laboratory
U.S. Missile Defense Agency
U.S. Naval Sea Systems Command (NAVSEA)
United States Air Force
United States Armed Forces
United States Army
United States Department of Defence
United States Department of Veteran Affairs
United States Marine Corps
United States Navy
United States Special Operations Command (USSOCOM)
Wallops Island Engineering Test Center
Download sample pages
Complete the form below to download your free sample pages for Military Radar System Market Report 2021-2031Related reports
-

Counter-UAV (C-UAV) Market Report 2022-2032
The global counter-UAV market was valued at US$1,087 million in 2021 and is projected to grow at a CAGR of...Full DetailsPublished: 05 July 2022 -

Targeting Pods Market Report 2022-2032
The introduction of a precision targeting system in which optical targeting facilitators define, identify, and track targets using laser beams...Full DetailsPublished: 06 January 2022 -
Military Shelter Market Report 2022-2032
Rise in defense budgets of countries; increasing territorial disputes among the countries; increase in investment towards the procurement of robust...Full DetailsPublished: 15 November 2021 -

Network Centric Warfare Market Report 2021-2031
The growth of this market can be attributed to technological advancements in defense operations across the globe, growing need for...
Full DetailsPublished: 01 January 1970 -

Chemical, Biological, Radiological & Nuclear (CBRN) Defence Market Report 2022-2032
Ongoing CBRN defense projects; rise in defense spending of the countries; and alarming terrorism activities are some of the major...Full DetailsPublished: 15 November 2021 -

Military Video Analytics and Back-End Systems Market Report 2022-2032
Deep learning technology has allowed video analytics tasks that were previously handled solely by humans to be automated. Video analytics...Full DetailsPublished: 08 December 2021 -
Military Identification Friend or Foe Market Report 2022-2032
We predict strong revenue growth through to 2032. Discover capabilities, progress, and commercial prospects, helping you stay ahead....Full DetailsPublished: 04 November 2021 -

Air Traffic Management Market Report 2022-2032
The air traffic management market was valued at US$9.68 billion in 2021 and is projected to grow at a CAGR...Full DetailsPublished: 03 October 2022 -

X-Band Radar Market Report to 2031
Growing threat of unprecedented terrorist threats amid coronavirus pandemic is anticipated to propel the growth of x-band radar market over...Full DetailsPublished: 01 January 1970 -

Military GPS and GNSS Devices Market Report 2022-2032
One of the major factors fuelling the growth of the military GNSS devices market is innovation in navigation and positioning...Full DetailsPublished: 19 January 2022
Download sample pages
Complete the form below to download your free sample pages for Military Radar System Market Report 2021-2031Do you have any custom requirements we can help you with?
Any specific country, geo region, market segment or specific company information?
Email us today, we can discuss your needs and see how we can help: jamie.roberts@visiongain.com
Would you like a free report overview of the report of your choice?
If so, please drop an email to Jamie Roberts stating your chosen report title to jamie.roberts@visiongain.com
Visiongain defence reports are compiled using a broad and rich mixture of both primary and secondary information to produce an overall industry outlook. In order to provide our clients with the best product possible, Visiongain analysts reach out to market-leading vendors and industry experts and review a wealth of financial data and product information from a vast range of sources. To find out more about our reports methodology, please email jamie.roberts@visiongain.com
Would you like to get the latest Visiongain defence reports catalogue?
What are the dynamic growth sectors? where are the regional business opportunities?
Which technologies will prevail and who are the leading companies succeeding in these sectors and why?
If you want definitive answers to business critical questions, discover Visiongain’s full range of business intelligence reports.
If so, please email Jamie Roberts on jamie.roberts@visiongain.com or call her today on +44 207 336 6100
ADS Group
Aerial Refueling Systems Advisory Group
Aerospace and Defence Industries Association of Nova Scotia
Aerospace Industries Association
Aerospace Industries Association of Canada
AHS International – The Vertical Flight Technical Society
Air Force Association
Aircraft Electronics Association
Airlift/Tanker Association
American Astronautical Society
American Gear Manufacturers Association
American Institute of Aeronautics and Astronautics
American Logistics Association
American Society of Naval Engineers
AMSUS – The Society of the Federal Health Agencies
Armed Forces Communications and Electronics Association
Armed Forces Communications and Electronics Association
Army Aviation Association of America
ASD – Aerospace & Defence Association of Europe
Association for Unmanned Vehicle Systems International
Association of Aviation Manufacturers of the Czech Republic
Association of Naval Aviation
Association of Old Crows
Association of Polish Aviation Industry
Association of the Defense Industry of the Czech Republic
Association of the United States Army
Association of the United States Navy
Australia Defence Association
Australian Industry & Defence Network
Australian Industry Group Defence Council
Austrian Aeronautics Industries Group
Aviation Distributors and Manufacturers Association
Aviation Suppliers Association
Belgian Security and Defence Industry
Bulgarian Defence Industry Association
Business Executives for National Security
Canadian Association of Defence and Security Industries
Conference of Defense Associations
Council of Defense and Space Industry Associations
Danish Defence & Security Industries Association
Defence Industry Manufacturers Association
Defense Industry Initiative on Business Ethics and Conduct
Defense Industry Offset Association
Defense Orientation Conference Association
Deutsche Gesellschaft fur Wehrtechnik
Federal Association of the German Security and Defence Industry
Federation of Aerospace Enterprises in Ireland
French Aerospace Industries Association
French Land Defence Manufacturers Association (GICAT)
German Aerospace Industries Association
Helicopter Association International
Hellenic Aerospace & Defense Industries Group
Homeland Security & Defense Business Council
International Stability Operations Association
Japan Association of Defense Industry
Korea Defense Industry Association
Marine Corps Association & Foundation
National Aeronautic Association
National Association of Ordnance and Explosive Waste Contractors
National Defense Industrial Association
National Defense Transportation Association
National Guard Association of the U.S.
Navy League of the United States
Netherlands Aerospace Group
New Zealand Defence Industry Association
Portuguese Association of Defense Related Industries & New Technologies Companies
Québec Ground Transportation Cluster
Satellite Industry Association
Society of American Military Engineers
South African Aerospace Maritime and Defence Industries Association
Spanish Aerospace and Defence Association Industries
Submarine Industrial Base Council
Swedish Aerospace Industries
Swedish Security and Defence Industry Association
Swiss Aeronautical Industries Group
The Association of Finnish Defence and Aerospace Industries
The Italian Industries Association for Aerospace Systems and Defence
The Netherlands Defence Manufacturers Association
The Society of Japanese Aerospace Companies
UK AeroSpace, Defence & Security Industries
United Kingdom National Defence Association
Latest Defence news
Visiongain Publishes Directed Energy Weapons (DEW) Market Report 2024-2034
The global Directed Energy Weapons (DEW) market was valued at US$6.4 billion in 2023 and is projected to grow at a CAGR of 19.6% during the forecast period 2024-2034.
26 February 2024
Visiongain Publishes Military Embedded Satellite Systems Market Report 2024-2034
The global Military Embedded Satellite Systems market is projected to grow at a CAGR of 8.7% by 2034
21 February 2024
Visiongain Publishes Military Simulation, Modelling and Virtual Training Market Report 2024-2034
The global military simulation, modelling and virtual training market was valued at US$13.2 billion in 2023 and is projected to grow at a CAGR of 8.3% during the forecast period 2024-2034.
15 February 2024
Visiongain Publishes Military Armoured Vehicle Market Report 2024-2034
The global Military Armoured Vehicle market was valued at US$36,123.6 million in 2023 and is projected to grow at a CAGR of 3.6% during the forecast period 2024-2034.
07 February 2024


