The Liquified Natural Gas (LNG) Market Report 2023-2033: This report will prove invaluable to leading firms striving for new revenue pockets if they wish to better understand the industry and its underlying dynamics. It will be useful for companies that would like to expand into different industries or to expand their existing operations in a new region.
Important Trend in the LNG Market Is the Growing Number of New Liquefaction Projects
The liquefied natural gas (LNG) market has grown rapidly in recent years and is expected to continue to do so in the coming years. The demand for LNG is driven by several factors, including the increasing need for cleaner energy sources, the growth of natural gas production, and the expansion of the global energy market.
One of the major trends in the LNG market is the increasing demand from Asia, particularly China and India. These countries are experiencing significant economic growth, leading to an increase in energy demand. The increasing use of natural gas in the power generation sector, coupled with the rise in demand for cleaner-burning fuels, has led to a surge in LNG imports.
Another important trend in the LNG market is the growing number of new liquefaction projects. Several countries, including the United States, Russia, and Qatar, have invested heavily in new LNG projects in recent years. These projects are aimed at increasing LNG production capacity and meeting the growing demand for LNG.
Despite the growth potential of the LNG market, there are several challenges that need to be addressed. One of the major challenges is the high cost of building new LNG infrastructure, such as liquefaction plants, regasification terminals, and shipping vessels. The volatility of LNG prices is also a concern, as it makes it difficult for buyers and sellers to plan for the future.
What Questions Should You Ask before Buying a Market Research Report?
• How is the liquified natural gas (LNG) market evolving?
• What is driving and restraining the liquified natural gas (LNG) market?
• How will each liquified natural gas (LNG) submarket segment grow over the forecast period and how much revenue will these submarkets account for in 2033?
• How will the market shares for each liquified natural gas (LNG) submarket develop from 2023 to 2033?
• What will be the main driver for the overall market from 2023 to 2033?
• Will leading liquified natural gas (LNG) markets broadly follow the macroeconomic dynamics, or will individual national markets outperform others?
• How will the market shares of the national markets change by 2033 and which geographical region will lead the market in 2033?
• Who are the leading players and what are their prospects over the forecast period?
• What are the liquified natural gas (LNG) projects for these leading companies?
• How will the industry evolve during the period between 2023 and 2033?What are the implications of liquified natural gas (LNG) projects taking place now and over the next 10 years?
• Is there a greater need for product commercialisation to further scale the liquified natural gas (LNG) market?
• Where is the liquified natural gas (LNG) market heading and how can you ensure you are at the forefront of the market?
• What are the best investment options for new product and service lines?
• What are the key prospects for moving companies into a new growth path and C-suite?
You need to discover how this will impact the liquified natural gas (LNG) market today, and over the next 10 years:
• Our 345-page report provides 165 tables and 207 charts/graphs exclusively to you.
• The report highlights key lucrative areas in the industry so you can target them – NOW.
• It contains in-depth analysis of global, regional and national sales and growth.
• It highlights for you the key successful trends, changes and revenue projections made by your competitors.
This report tells you TODAY how the liquified natural gas (LNG) market will develop in the next 10 years, and in line with the variations in COVID-19 economic recession and bounce. This market is more critical now than at any point over the last 10 years.
Forecasts to 2033 and other analyses reveal commercial prospects
• In addition to revenue forecasting to 2033, our new study provides you with recent results, growth rates, and market shares.
• You will find original analyses, with business outlooks and developments.
• Discover qualitative analyses (including market dynamics, drivers, opportunities, restraints and challenges), cost structure, impact of rising liquified natural gas (LNG) prices and recent developments.
This report includes data analysis and invaluable insight into how COVID-19 will affect the industry and your company. Four COVID-19 recovery patterns and their impact, namely, “V”, “L”, “W” and “U” are discussed in this report.
Segments Covered in the Report
Market Segment by
• Value (US$ Billion)
• Volume (BCM)
Market Segment by Transport Fuel
• Heavy-Duty Vehicles
• Passenger Vehicles
• Marine Transport
• Other Transport Fuel
Market Segment by End-Use
• Domestic Use
• Industrial Use
• Commercial Use
• Transportation Use
• Utilities and Power Use
• Other End-Use

In addition to the revenue predictions for the overall world market and segments, you will also find revenue forecasts for four regional and 20 leading national markets:
North America
• U.S.
• Canada
Europe
• Germany
• Russia
• United Kingdom
• France
• Italy
• Rest of Europe
Asia Pacific
• China
• Japan
• India
• Thailand
• South Korea
• Rest of Asia Pacific
Latin America
• Argentina
• Mexico
• Rest of Latin America
Middle East & Africa
• GCC
• South Africa
• Rest of Middle East & Africa
Need industry data? Please contact us today.
The report also includes profiles and for some of the leading companies in the Liquified Natural Gas (LNG) Market, 2023 to 2033, with a focus on this segment of these companies’ operations.
Leading companies and the potential for market growth
• BG Group plc
• BP Plc
• Chesapeake Energy Corporation
• Chevron Corporation
• ConocoPhillips Company
• Eni S.p.A.
• Equinor ASA
• ExxonMobil Corporation
• Gazprom PJSC
• INPEX Corporation
• Petronas Dagangan Berhad
• Qatargas
• Royal Dutch Shell Plc.
• TotalEnergies SE
• Woodside Energy Group Ltd
Overall world revenue for Liquified Natural Gas (LNG) Market, 2023 to 2033 in terms of value the market will surpass US$286.58 billion in 2023, our work calculates. We predict strong revenue growth through to 2033. Our work identifies which organizations hold the greatest potential. Discover their capabilities, progress, and commercial prospects, helping you stay ahead.
How will the Liquified Natural Gas (LNG) Market, 2023 to 2033 report help you?
In summary, our 340+ page report provides you with the following knowledge:
• Revenue forecasts to 2033 for Liquified Natural Gas (LNG) Market, 2023 to 2033 Market, with forecasts for market value, market volume, transport fuel, and end-use, each forecast at a global and regional level – discover the industry’s prospects, finding the most lucrative places for investments and revenues.
• Revenue forecasts to 2033 for four regional and 20 key national markets – See forecasts for the Liquified Natural Gas (LNG) Market, 2023 to 2033 market in North America, Europe, Asia-Pacific, Latin America and Middle East & Africa. Also forecasted is the market in the US, Canada, Russia, Germany, France, UK, Italy, China, India, Japan, and Australia among other prominent economies.
• Prospects for established firms and those seeking to enter the market – including company profiles for 15 of the major companies involved in the Liquified Natural Gas (LNG) Market, 2023 to 2033.
Find quantitative and qualitative analyses with independent predictions. Receive information that only our report contains, staying informed with invaluable business intelligence.
Information found nowhere else
With our new report, you are less likely to fall behind in knowledge or miss out on opportunities. See how our work could benefit your research, analyses, and decisions. Visiongain’s study is for everybody needing commercial analyses for the Liquified Natural Gas (LNG) Market, 2023 to 2033, market-leading companies. You will find data, trends and predictions.
To access the data contained in this document please email contactus@visiongain.com
Buy our report today Liquified Natural Gas (LNG) Market Report 2023-2033: Forecasts by Transport Fuel (Heavy-Duty Vehicles, Passenger Vehicles, Marine Transport, Other), by End-use (Domestic Use, Industrial Use, Commercial Use, Transportation Use, Utilities and Power Use, Other) AND Regional and Leading National Market Analysis PLUS Analysis of Leading Companies AND COVID-19 Impact and Recovery Pattern Analysis. Avoid missing out by staying informed – order our report now.
Visiongain is a trading partner with the US Federal Government
CCR Ref number: KD4R6
Do you have any custom requirements we can help you with? Any need for a specific country, geo region, market segment or specific company information? Contact us today, we can discuss your needs and see how we can help: contactus@visiongain.com
1 Report Overview
1.1 Objectives of the Study
1.2 Introduction to Liquified Natural Gas Market
1.3 What This Report Delivers
1.4 Why You Should Read This Report
1.5 Key Questions Answered by This Analytical Report
1.6 Who is This Report for?
1.7 Research Methodology
1.7.1 Market Definitions
1.7.2 Market Evaluation & Forecasting Methodology
1.7.3 Data Validation
1.7.3.1 Primary Research
1.7.3.2 Secondary Research
1.8 Frequently Asked Questions (FAQs)
1.9 Associated Visiongain Reports
1.10 About Visiongain
2 Executive Summary
2.1 Segment analysis
2.1.1 Transport Fuel Segment: Market Attractiveness Index
2.1.2 End-Use Segment: Market Attractiveness Index
2.2 Regional Analysis
3 Market Overview
3.1 Key Findings
3.2 Market Dynamics
3.2.1 Market Driving Factors
3.2.1.1 High Demand for Small-Scale Liquefied Natural Gas (LNG)
3.2.1.2 Clean Energy Demand
3.2.2 Market Restraining Factors
3.2.2.1 Oversupply: A Major Cause of Concern
3.2.2.2 Geopolitical Uncertainty Leading to Low Rate of Growth
3.2.2.3 Environmental Concerns as a Restraint to the Growth of LNG Market
3.2.3 Market Opportunities
3.2.3.1 Technology and Government Policy Integration
3.2.3.2 Improved Economics Aiding the Growth of the LNG Market
3.2.3.3 Fuel Flexibility is Aided by LNG Infrastructure
3.3 COVID-19 Impact Analysis
3.3.1 V-Shaped Recovery
3.3.2 W-Shaped Recovery
3.3.3 U-Shaped Recovery
3.3.4 L-Shaped Recovery
3.4 Porter’s Five Forces Analysis
3.4.1 Bargaining Power of Suppliers
3.4.2 Bargaining Power of Buyers
3.4.3 Competitive Rivalry
3.4.4 Threat from Substitutes
3.4.5 Threat of New Entrants
3.5 PEST Analysis
3.5.1 Political Factors
3.5.2 Economic Factors
3.5.3 Social Factors
3.5.4 Technological Factors
4 Liquified Natural Gas Market Analysis by Transport Fuel
4.1 Key Findings
4.2 Transport Fuel Segment: Market Attractiveness Index
4.3 Liquified Natural Gas Market Size Estimation and Forecast by Transport Fuel
4.4 Heavy-Duty Vehicles Market
4.4.1 Market Size by Region, 2023-2033 (US$ bn)
4.4.2 Market Share by Region, 2023 & 2033 (%)
4.5 Passenger Vehicles Market
4.5.1 Market Size by Region, 2023-2033 (US$ bn)
4.5.2 Market Share by Region, 2023 & 2033 (%)
4.6 Marine Transport Market
4.6.1 Market Size by Region, 2023-2033 (US$ bn)
4.6.2 Market Share by Region, 2023 & 2033 (%)
4.7 Other Transport Fuel Market
4.7.1 Market Size by Region, 2023-2033 (US$ bn)
4.7.2 Market Share by Region, 2023 & 2033 (%)
5 Liquified Natural Gas Market Analysis by End-Use
5.1 Key Findings
5.2 End-Use Segment: Market Attractiveness Index
5.3 Liquified Natural Gas Market Size Estimation and Forecast by End-Use
5.4 Domestic Use Market
5.4.1 Market Size by Region, 2023-2033 (US$ bn)
5.4.2 Market Share by Region, 2023 & 2033 (%)
5.5 Industrial Use Market
5.5.1 Market Size by Region, 2023-2033 (US$ bn)
5.5.2 Market Share by Region, 2023 & 2033 (%)
5.6 Commercial Use Market
5.6.1 Market Size by Region, 2023-2033 (US$ bn)
5.6.2 Market Share by Region, 2023 & 2033 (%)
5.7 Transportation Use Market
5.7.1 Market Size by Region, 2023-2033 (US$ bn)
5.7.2 Market Share by Region, 2023 & 2033 (%)
5.8 Utilities and Power Use Market
5.8.1 Market Size by Region, 2023-2033 (US$ bn)
5.8.2 Market Share by Region, 2023 & 2033 (%)
5.9 Other End-Use Market
5.9.1 Market Size by Region, 2023-2033 (US$ bn)
5.9.2 Market Share by Region, 2023 & 2033 (%)
6 Liquified Natural Gas Market Analysis by Region
6.1 Key Findings
6.2 Regional Market Size Estimation and Forecast
6.3 Global Liquified Natural Gas (LNG) Market by Region
6.4 Global Liquified Natural Gas (LNG) Market by Transport Fuel
6.5 Global Liquified Natural Gas (LNG) Market by End-Use
7 North America Liquified Natural Gas Market Analysis
7.1 Key Findings
7.2 North America Liquified Natural Gas Market Attractiveness Index
7.3 North America Liquified Natural Gas Market Size Estimation and Forecast by Value
7.4 North America Liquified Natural Gas (LNG) Market by Country
7.5 North America Liquified Natural Gas (LNG) Market by Transport Fuel
7.6 North America Liquified Natural Gas (LNG) Market by End-Use
7.7 U.S. Liquified Natural Gas Market Analysis
7.8 Canada Liquified Natural Gas Market Analysis
8 Europe Liquified Natural Gas Market Analysis
8.1 Key Findings
8.2 Europe Liquified Natural Gas Market Attractiveness Index
8.3 Europe Liquified Natural Gas Market Size Estimation and Forecast by Value
8.4 Europe Liquified Natural Gas (LNG) Market by Country
8.5 Europe Liquified Natural Gas (LNG) Market by Transport Fuel
8.6 Europe Liquified Natural Gas (LNG) Market by End-Use
8.7 Russia Liquified Natural Gas Market Analysis
8.8 Germany Liquified Natural Gas Market Analysis
8.9 Italy Liquified Natural Gas Market Analysis
8.10 UK Liquified Natural Gas Market Analysis
8.11 France Liquified Natural Gas Market Analysis
8.12 Rest of Europe Liquified Natural Gas Market Analysis
9 Asia Pacific Liquified Natural Gas Market Analysis
9.1 Key Findings
9.2 Asia Pacific Liquified Natural Gas Market Attractiveness Index
9.3 Asia Pacific Liquified Natural Gas Market Size Estimation and Forecast by Value
9.4 Asia-Pacific Liquified Natural Gas (LNG) Market by Country
9.5 Asia-Pacific Liquified Natural Gas (LNG) Market by Transport Fuel
9.6 Asia-Pacific Liquified Natural Gas (LNG) Market by End-Use
9.7 China Liquified Natural Gas Market Analysis
9.8 Japan Liquified Natural Gas Market Analysis
9.9 South Korea Liquified Natural Gas Market Analysis
9.10 India Liquified Natural Gas Market Analysis
9.11 Thailand Liquified Natural Gas Market Analysis
9.12 Rest of Asia Pacific Liquified Natural Gas Market Analysis
10 Middle East & Africa Liquified Natural Gas Market Analysis
10.1 Key Findings
10.2 Middle East & Africa Liquified Natural Gas Market Attractiveness Index
10.3 Middle East & Africa Liquified Natural Gas Market Size Estimation and Forecast by Value
10.4 Middle East & Africa Liquified Natural Gas (LNG) Market by Country
10.5 Middle East & Africa Liquified Natural Gas (LNG) Market by Transport Fuel
10.6 Middle East & Africa Liquified Natural Gas (LNG) Market by End-Use
10.7 GCC Liquified Natural Gas Market Analysis
10.8 South Africa Liquified Natural Gas Market Analysis
10.9 Rest of Middle East & Africa Liquified Natural Gas Market Analysis
11 Latin America Liquified Natural Gas Market Analysis
11.1 Key Findings
11.2 Latin America Liquified Natural Gas Market Attractiveness Index
11.3 Latin America Liquified Natural Gas Market Size Estimation and Forecast by Value
11.4 Latin America Liquified Natural Gas (LNG) Market by Country
11.5 Latin America Liquified Natural Gas (LNG) Market by Transport Fuel
11.6 Latin America Liquified Natural Gas (LNG) Market by End-Use
11.7 Argentina Liquified Natural Gas Market Analysis
11.8 Mexico Liquified Natural Gas Market Analysis
11.9 Rest of Latin America Liquified Natural Gas Market Analysis
12 Company Profiles
12.1 Competitive Landscape, 2022
12.2 Strategic Outlook
12.2.1 Acquisitions as Key Business Strategy
12.2.2 Partnership as Key Business Strategy
12.2.3 Collaboration as Key Business Strategy
12.2.4 New Product Launch as Key Business Strategy
12.2.5 Expansion as Key Business Strategy
12.3 Royal Dutch Shell Plc.
12.3.1 Company Snapshot
12.3.2 Company Overview
12.3.3 Financial Analysis
12.3.3.1 Net Revenue, 2018-2022
12.3.3.2 R&D, 2018-2022
12.3.3.3 Regional Market Shares, 2022
12.3.3.4 Business Segment Market Shares, 2022
12.3.4 Product Benchmarking
12.3.5 Strategic Outlook
12.4 Gazprom PJSC
12.4.1 Company Snapshot
12.4.2 Company Overview
12.4.3 Product Benchmarking
12.4.4 Strategic Outlook
12.5 Petronas Dagangan Berhad
12.5.1 Company Snapshot
12.5.2 Company Overview
12.5.3 Product Benchmarking
12.5.4 Strategic Outlook
12.6 Equinor ASA
12.6.1 Company Snapshot
12.6.2 Company Overview
12.6.3 Financial Analysis
12.6.3.1 Net Revenue, 2018-2022
12.6.3.2 R&D, 2018-2022
12.6.3.3 Regional Market Shares, 2022
12.6.3.4 Business Segment Market Shares, 2022
12.6.4 Strategic Outlook
12.7 ExxonMobil Corporation
12.7.1 Company Snapshot
12.7.2 Company Overview
12.7.3 Financial Analysis
12.7.3.1 Net Revenue, 2018-2022
12.7.3.2 R&D, 2018-2022
12.7.3.3 Regional Market Shares, 2022
12.7.3.4 Business Segment Market Shares, 2022
12.7.4 Product Benchmarking
12.7.5 Strategic Outlook
12.8 Chevron Corporation
12.8.1 Company Snapshot
12.8.2 Company Overview
12.8.3 Financial Analysis
12.8.3.1 Net Revenue, 2018-2022
12.8.3.2 R&D, 2018-2022
12.8.3.3 Regional Market Shares, 2022
12.8.3.4 Business Segment Market Shares, 2022
12.8.4 Product Benchmarking
12.8.5 Strategic Outlook
12.9 BP Plc
12.9.1 Company Snapshot
12.9.2 Company Overview
12.9.3 Financial Analysis
12.9.3.1 Net Revenue, 2018-2022
12.9.3.2 R&D, 2018-2022
12.9.3.3 Business Segment Market Shares, 2022
12.9.4 Product Benchmarking
12.10 TotalEnergies SE
12.10.1 Company Snapshot
12.10.2 Company Overview
12.10.3 Financial Analysis
12.10.3.1 Net Revenue, 2018-2022
12.10.3.2 R&D, 2018-2022
12.10.3.3 Regional Market Shares, 2022
12.10.3.4 Business Segment Market Shares, 2022
12.10.4 Product Benchmarking
12.10.5 Strategic Outlook
12.11 ConocoPhillips Company
12.11.1 Company Snapshot
12.11.2 Company Overview
12.11.3 Financial Analysis
12.11.3.1 Net Revenue, 2018-2022
12.11.3.2 R&D, 2018-2022
12.11.3.3 Regional Market Shares, 2022
12.11.3.4 Business Segment Market Shares, 2022
12.11.4 Product Benchmarking
12.11.5 Strategic Outlook
12.12 Eni S.p.A.
12.12.1 Company Snapshot
12.12.2 Company Overview
12.12.3 Financial Analysis
12.12.3.1 Net Revenue, 2018-2022
12.12.3.2 R&D, 2018-2022
12.12.3.3 Regional Market Shares, 2022
12.12.3.4 Business Segment Market Shares, 2022
12.12.4 Product Benchmarking
12.12.5 Strategic Outlook
12.13 Woodside Energy Group Ltd
12.13.1 Company Snapshot
12.13.2 Company Overview
12.13.3 Financial Analysis
12.13.3.1 Net Revenue, 2017-2021
12.13.3.2 Regional Market Shares, 2022
12.13.3.3 Business Segment Market Shares, 2022
12.13.4 Product Benchmarking
12.13.5 Strategic Outlook
12.14 BG Group plc
12.14.1 Company Snapshot
12.14.2 Company Overview
12.14.3 Financial Analysis
12.14.3.1 Net Revenue, 2018-2022
12.14.3.2 R&D, 2018-2022
12.14.3.3 Regional Market Shares, 2022
12.14.3.4 Business Segment Market Shares, 2022
12.14.4 Product Benchmarking
12.15 INPEX Corporation
12.15.1 Company Snapshot
12.15.2 Company Overview
12.15.3 Financial Analysis
12.15.3.1 Net Revenue, 2017-2021
12.15.3.2 R&D, 2017-2021
12.15.3.3 Regional Market Shares, 2021
12.15.3.4 Business Segment Market Shares, 2021
12.15.4 Product Benchmarking
12.15.5 Strategic Outlook
12.16 Chesapeake Energy Corporation
12.16.1 Company Snapshot
12.16.2 Company Overview
12.16.3 Financial Analysis
12.16.3.1 Net Revenue, 2018-2022
12.16.3.2 R&D, 2018-2022
12.16.3.3 Business Segment Market Shares, 2021
12.16.4 Product Benchmarking
12.17 Qatargas
12.17.1 Company Snapshot
12.17.2 Company Overview
12.17.3 Product Benchmarking
12.17.4 Strategic Outlook
13 Conclusion and Recommendations
13.1 Concluding Remarks from Visiongain
13.2 Recommendations for Market Players
List of Tables
Table 1 Liquified Natural Gas Market Snapshot, 2023 & 2033 (US$ billion, CAGR %)
Table 2 Global Liquified Natural Gas (LNG) Market Forecast, 2023-2033 (US$ Bn, AGR (%), CAGR (%)) (V-Shaped Recovery Scenario)
Table 3 Global Liquified Natural Gas (LNG) Market by Region, 2023-2033 (US$ Bn, AGR (%), CAGR (%)) (V-Shaped Recovery Scenario)
Table 4 Global Liquified Natural Gas (LNG) Market Forecast, 2023-2033 (US$ Bn, AGR (%), CAGR (%)) (W-Shaped Recovery Scenario)
Table 5 Global Liquified Natural Gas (LNG) Market by Region, 2023-2033 (US$ Bn, AGR (%), CAGR (%)) (W-Shaped Recovery Scenario)
Table 6 Global Liquified Natural Gas (LNG) Market Forecast, 2023-2033 (US$ Bn, AGR (%), CAGR (%)) (U-Shaped Recovery Scenario)
Table 7 Global Liquified Natural Gas (LNG) Market by Region, 2023-2033 (US$ Bn, AGR (%), CAGR (%)) (U-Shaped Recovery Scenario)
Table 8 Global Liquified Natural Gas (LNG) Market Forecast, 2023-2033 (US$ Bn, AGR (%), CAGR (%)) (L-Shaped Recovery Scenario)
Table 9 Global Liquified Natural Gas (LNG) Market by Region, 2023-2033 (US$ Bn, AGR (%), CAGR (%)) (L-Shaped Recovery Scenario)
Table 10 Global Liquified Natural Gas (LNG) Market by Transport Fuel, 2023-2033 (US$ Bn, AGR (%), CAGR (%))
Table 11 Global Liquified Natural Gas (LNG) Market by Transport Fuel, 2023-2033 (BCM, AGR (%), CAGR (%))
Table 12 Heavy-Duty Vehicles Market by Region, 2023-2033 (US$ Bn, AGR (%), CAGR (%))
Table 13 Heavy-Duty Vehicles Market by Region, 2023-2033 (BCM, AGR (%), CAGR (%))
Table 14 Passenger Vehicles Market by Region, 2023-2033 (US$ Bn, AGR (%), CAGR (%))
Table 15 Passenger Vehicles Market by Region, 2023-2033 (BCM, AGR (%), CAGR (%))
Table 16 Marine Transport Market by Region, 2023-2033 (US$ Bn, AGR (%), CAGR (%))
Table 17 Marine Transport Market by Region, 2023-2033 (BCM, AGR (%), CAGR (%))
Table 18 Other Transport Fuel Market by Region, 2023-2033 (US$ Bn, AGR (%), CAGR (%))
Table 19 Marine Transport Market by Region, 2023-2033 (BCM, AGR (%), CAGR (%))
Table 20 Global Liquified Natural Gas (LNG) Market by End-Use, 2023-2033 (US$ Bn, AGR (%), CAGR (%))
Table 21 Global Liquified Natural Gas (LNG) Market by End-Use, 2023-2033 (BCM, AGR (%), CAGR (%))
Table 22 Domestic Use Market by Region, 2023-2033 (US$ Bn, AGR (%), CAGR (%))
Table 23 Domestic Use Market by Region, 2023-2033 (BCM, AGR (%), CAGR (%))
Table 24 Industrial Use Market by Region, 2023-2033 (US$ Bn, AGR (%), CAGR (%))
Table 25 Industrial Use Market by Region, 2023-2033 (BCM, AGR (%), CAGR (%))
Table 26 Commercial Use Market by Region, 2023-2033 (US$ Bn, AGR (%), CAGR (%))
Table 27 Commercial Use Market by Region, 2023-2033 (BCM, AGR (%), CAGR (%))
Table 28 Transportation Use Market by Region, 2023-2033 (US$ Bn, AGR (%), CAGR (%))
Table 29 Transportation Use Market by Region, 2023-2033 (BCM, AGR (%), CAGR (%))
Table 30 Utilities and Power Use Market by Region, 2023-2033 (US$ Bn, AGR (%), CAGR (%))
Table 31 Utilities and Power Use Market by Region, 2023-2033 (BCM, AGR (%), CAGR (%))
Table 32 Other End-Use Market by Region, 2023-2033 (US$ Bn, AGR (%), CAGR (%))
Table 33 Other End-Use Market by Region, 2023-2033 (BCM, AGR (%), CAGR (%))
Table 34 Global Liquified Natural Gas (LNG) Market Forecast, 2023-2033 (US$ Bn, AGR (%), CAGR (%))
Table 35 Global Liquified Natural Gas (LNG) Market Forecast, 2023-2033 (BCM, AGR (%), CAGR (%))
Table 36 Global Liquified Natural Gas (LNG) Market by Region, 2023-2033 (US$ Bn, AGR (%), CAGR (%))
Table 37 Global Liquified Natural Gas (LNG) Market by Region, 2023-2033 (BCM, AGR (%), CAGR (%))
Table 38 Global Liquified Natural Gas (LNG) Market by Transport Fuel, 2023-2033 (US$ Bn, AGR (%), CAGR (%))
Table 39 Global Liquified Natural Gas (LNG) Market by Transport Fuel, 2023-2033 (BCM, AGR (%), CAGR (%))
Table 40 Global Liquified Natural Gas (LNG) Market by End-Use, 2023-2033 (US$ Bn, AGR (%), CAGR (%))
Table 41 Global Liquified Natural Gas (LNG) Market by End-Use, 2023-2033 (BCM, AGR (%), CAGR (%))
Table 42 North America Liquified Natural Gas (LNG) Market by Value, 2023-2033 (US$ Bn, AGR (%), CAGR (%))
Table 43 North America Liquified Natural Gas (LNG) Market by Volume, 2023-2033 (BCM, AGR (%), CAGR (%))
Table 44 North America Liquified Natural Gas (LNG) Market by Country, 2023-2033 (US$ Bn, AGR (%), CAGR (%))
Table 45 North America Liquified Natural Gas (LNG) Market by Country, 2023-2033 (BCM, AGR (%), CAGR (%))
Table 46 North America Liquified Natural Gas (LNG) Market by Transport Fuel, 2023-2033 (US$ Bn, AGR (%), CAGR (%))
Table 47 North America Liquified Natural Gas (LNG) Market by Transport Fuel, 2023-2033 (BCM, AGR (%), CAGR (%))
Table 48 North America Liquified Natural Gas (LNG) Market by End-Use, 2023-2033 (US$ Bn, AGR (%), CAGR (%))
Table 49 North America Liquified Natural Gas (LNG) Market by End-Use, 2023-2033 (BCM, AGR (%), CAGR (%))
Table 50 US Liquified Natural Gas (LNG) Market by Value, 2023-2033 (US$ Bn, AGR (%), CAGR (%))
Table 51 US Liquified Natural Gas (LNG) Market by Volume, 2023-2033 (BCM, AGR (%), CAGR (%))
Table 52 Canada Liquified Natural Gas (LNG) Market by Value, 2023-2033 (US$ Bn, AGR (%), CAGR (%))
Table 53 Canada Liquified Natural Gas (LNG) Market by Volume, 2023-2033 (BCM, AGR (%), CAGR (%))
Table 54 Europe Liquified Natural Gas (LNG) Market by Value, 2023-2033 (US$ Bn, AGR (%), CAGR (%))
Table 55 Europe Liquified Natural Gas (LNG) Market by Volume, 2023-2033 (BCM, AGR (%), CAGR (%))
Table 56 Europe Liquified Natural Gas (LNG) Market by Country, 2023-2033 (US$ Bn, AGR (%), CAGR (%))
Table 57 Europe Liquified Natural Gas (LNG) Market by Country, 2023-2033 (BCM, AGR (%), CAGR (%))
Table 58 Europe Liquified Natural Gas (LNG) Market by Transport Fuel, 2023-2033 (US$ Bn, AGR (%), CAGR (%))
Table 59 Europe Liquified Natural Gas (LNG) Market by Transport Fuel, 2023-2033 (BCM, AGR (%), CAGR (%))
Table 60 Europe Liquified Natural Gas (LNG) Market by End-Use, 2023-2033 (US$ Bn, AGR (%), CAGR (%))
Table 61 Europe Liquified Natural Gas (LNG) Market by End-Use, 2023-2033 (BCM, AGR (%), CAGR (%))
Table 62 Russia Liquified Natural Gas (LNG) Market by Value, 2023-2033 (US$ Bn, AGR (%), CAGR (%))
Table 63 Russia Liquified Natural Gas (LNG) Market by Volume, 2023-2033 (BCM, AGR (%), CAGR (%))
Table 64 Germany Liquified Natural Gas (LNG) Market by Value, 2023-2033 (US$ Bn, AGR (%), CAGR (%))
Table 65 Germany Liquified Natural Gas (LNG) Market by Volume, 2023-2033 (BCM, AGR (%), CAGR (%))
Table 66 Italy Liquified Natural Gas (LNG) Market by Value, 2023-2033 (US$ Bn, AGR (%), CAGR (%))
Table 67 Italy Liquified Natural Gas (LNG) Market by Volume, 2023-2033 (BCM, AGR (%), CAGR (%))
Table 68 UK Liquified Natural Gas (LNG) Market by Value, 2023-2033 (US$ Bn, AGR (%), CAGR (%))
Table 69 UK Liquified Natural Gas (LNG) Market by Volume, 2023-2033 (BCM, AGR (%), CAGR (%))
Table 70 France Liquified Natural Gas (LNG) Market by Value, 2023-2033 (US$ Bn, AGR (%), CAGR (%))
Table 71 France Liquified Natural Gas (LNG) Market by Volume, 2023-2033 (BCM, AGR (%), CAGR (%))
Table 72 Rest of Europe Liquified Natural Gas (LNG) Market by Value, 2023-2033 (US$ Bn, AGR (%), CAGR (%))
Table 73 Rest of Europe Liquified Natural Gas (LNG) Market by Volume, 2023-2033 (BCM, AGR (%), CAGR (%))
Table 74 Asia-Pacific Liquified Natural Gas (LNG) Market by Value, 2023-2033 (US$ Bn, AGR (%), CAGR (%))
Table 75 Asia-Pacific Liquified Natural Gas (LNG) Market by Volume, 2023-2033 (BCM, AGR (%), CAGR (%))
Table 76 Asia-Pacific Liquified Natural Gas (LNG) Market by Country, 2023-2033 (US$ Bn, AGR (%), CAGR (%))
Table 77 Asia-Pacific Liquified Natural Gas (LNG) Market by Country, 2023-2033 (BCM, AGR (%), CAGR (%))
Table 78 Asia-Pacific Liquified Natural Gas (LNG) Market by Transport Fuel, 2023-2033 (US$ Bn, AGR (%), CAGR (%))
Table 79 Asia-Pacific Liquified Natural Gas (LNG) Market by Transport Fuel, 2023-2033 (BCM, AGR (%), CAGR (%))
Table 80 Asia-Pacific Liquified Natural Gas (LNG) Market by End-Use, 2023-2033 (US$ Bn, AGR (%), CAGR (%))
Table 81 Asia-Pacific Liquified Natural Gas (LNG) Market by End-Use, 2023-2033 (BCM, AGR (%), CAGR (%))
Table 82 China Liquified Natural Gas (LNG) Market by Value, 2023-2033 (US$ Bn, AGR (%), CAGR (%))
Table 83 China Liquified Natural Gas (LNG) Market by Volume, 2023-2033 (BCM, AGR (%), CAGR (%))
Table 84 Japan Liquified Natural Gas (LNG) Market by Value, 2023-2033 (US$ Bn, AGR (%), CAGR (%))
Table 85 Japan Liquified Natural Gas (LNG) Market by Volume, 2023-2033 (BCM, AGR (%), CAGR (%))
Table 86 South Korea Liquified Natural Gas (LNG) Market by Value, 2023-2033 (US$ Bn, AGR (%), CAGR (%))
Table 87 South Korea Liquified Natural Gas (LNG) Market by Volume, 2023-2033 (BCM, AGR (%), CAGR (%))
Table 88 India Liquified Natural Gas (LNG) Market by Value, 2023-2033 (US$ Bn, AGR (%), CAGR (%))
Table 89 India Liquified Natural Gas (LNG) Market by Volume, 2023-2033 (BCM, AGR (%), CAGR (%))
Table 90 Thailand Liquified Natural Gas (LNG) Market by Value, 2023-2033 (US$ Bn, AGR (%), CAGR (%))
Table 91 Thailand Liquified Natural Gas (LNG) Market by Volume, 2023-2033 (BCM, AGR (%), CAGR (%))
Table 92 Rest of Asia-Pacific Liquified Natural Gas (LNG) Market by Value, 2023-2033 (US$ Bn, AGR (%), CAGR (%))
Table 93 Rest of Asia-Pacific Liquified Natural Gas (LNG) Market by Volume, 2023-2033 (BCM, AGR (%), CAGR (%))
Table 94 Middle East & Africa Liquified Natural Gas (LNG) Market by Value, 2023-2033 (US$ Bn, AGR (%), CAGR (%))
Table 95 Middle East & Africa Liquified Natural Gas (LNG) Market by Volume, 2023-2033 (BCM, AGR (%), CAGR (%))
Table 96 Middle East & Africa Liquified Natural Gas (LNG) Market by Country, 2023-2033 (US$ Bn, AGR (%), CAGR (%))
Table 97 Middle East & Africa Liquified Natural Gas (LNG) Market by Country, 2023-2033 (BCM, AGR (%), CAGR (%))
Table 98 Middle East & Africa Liquified Natural Gas (LNG) Market by Transport Fuel, 2023-2033 (US$ Bn, AGR (%), CAGR (%))
Table 99 Middle East & Africa Liquified Natural Gas (LNG) Market by Transport Fuel, 2023-2033 (BCM, AGR (%), CAGR (%))
Table 100 Middle East & Africa Liquified Natural Gas (LNG) Market by End-Use, 2023-2033 (US$ Bn, AGR (%), CAGR (%))
Table 101 Middle East & Africa Liquified Natural Gas (LNG) Market by End-Use, 2023-2033 (BCM, AGR (%), CAGR (%))
Table 102 GCC Liquified Natural Gas (LNG) Market by Value, 2023-2033 (US$ Bn, AGR (%), CAGR (%))
Table 103 GCC Liquified Natural Gas (LNG) Market by Volume, 2023-2033 (BCM, AGR (%), CAGR (%))
Table 104 South Africa Liquified Natural Gas (LNG) Market by Value, 2023-2033 (US$ Bn, AGR (%), CAGR (%))
Table 105 South Africa Liquified Natural Gas (LNG) Market by Volume, 2023-2033 (BCM, AGR (%), CAGR (%))
Table 106 Rest of Middle East & Africa Liquified Natural Gas (LNG) Market by Value, 2023-2033 (US$ Bn, AGR (%), CAGR (%))
Table 107 Rest of Middle East & Africa Liquified Natural Gas (LNG) Market by Volume, 2023-2033 (BCM, AGR (%), CAGR (%))
Table 108 Latin America Liquified Natural Gas (LNG) Market by Value, 2023-2033 (US$ Bn, AGR (%), CAGR (%))
Table 109 Latin America Liquified Natural Gas (LNG) Market by Volume, 2023-2033 (BCM, AGR (%), CAGR (%))
Table 110 Latin America Liquified Natural Gas (LNG) Market by Country, 2023-2033 (US$ Bn, AGR (%), CAGR (%))
Table 111 Latin America Liquified Natural Gas (LNG) Market by Country, 2023-2033 (BCM, AGR (%), CAGR (%))
Table 112 Latin America Liquified Natural Gas (LNG) Market by Transport Fuel, 2023-2033 (US$ Bn, AGR (%), CAGR (%))
Table 113 Latin America Liquified Natural Gas (LNG) Market by Transport Fuel, 2023-2033 (BCM, AGR (%), CAGR (%))
Table 114 Latin America Liquified Natural Gas (LNG) Market by End-Use, 2023-2033 (US$ Bn, AGR (%), CAGR (%))
Table 115 Latin America Liquified Natural Gas (LNG) Market by End-Use, 2023-2033 (BCM, AGR (%), CAGR (%))
Table 116 Argentina Liquified Natural Gas (LNG) Market by Value, 2023-2033 (US$ Bn, AGR (%), CAGR (%))
Table 117 Argentina Liquified Natural Gas (LNG) Market by Volume, 2023-2033 (BCM, AGR (%), CAGR (%))
Table 118 Mexico Liquified Natural Gas (LNG) Market by Value, 2023-2033 (US$ Bn, AGR (%), CAGR (%))
Table 119 Mexico Liquified Natural Gas (LNG) Market by Volume, 2023-2033 (BCM, AGR (%), CAGR (%))
Table 120 Rest of Latin America Liquified Natural Gas (LNG) Market by Value, 2023-2033 (US$ Bn, AGR (%), CAGR (%))
Table 121 Rest of Latin America Liquified Natural Gas (LNG) Market by Volume, 2023-2033 (BCM, AGR (%), CAGR (%))
Table 122 Acquisitions as Key Business Strategy
Table 123 Partnership as Key Business Strategy
Table 124 Collaboration as Key Business Strategy
Table 125 New Product Launch as Key Business Strategy
Table 126 Expansion as Key Business Strategy
Table 127 Royal Dutch Shell Plc: Key Details, (CEO, HQ, Revenue, Founded, No. of Employees, Company Type, Website, Business Segment)
Table 128 Royal Dutch Shell Plc: Product Benchmarking
Table 129 Royal Dutch Shell Plc: Strategic Outlook
Table 130 Gazprom PJSC: Key Details, (CEO, HQ, Revenue, Founded, No. of Employees, Company Type, Website, Business Segment)
Table 131 Gazprom PJSC: Product Benchmarking
Table 132 Gazprom PJSC: Strategic Outlook
Table 133 Petronas Dagangan Berhad: Key Details, (CEO, HQ, Revenue, Founded, No. of Employees, Company Type, Website, Business Segment)
Table 134 Petronas Dagangan Berhad: Product Benchmarking
Table 135 Petronas Dagangan Berhad: Strategic Outlook
Table 136 Equinor ASA: Key Details, (CEO, HQ, Revenue, Founded, No. of Employees, Company Type, Website, Business Segment)
Table 137 Equinor ASA: Strategic Outlook
Table 138 ExxonMobil Corporation: Key Details, (CEO, HQ, Revenue, Founded, No. of Employees, Company Type, Website, Business Segment)
Table 139 ExxonMobil Corporation: Product Benchmarking
Table 140 ExxonMobil Corporation: Strategic Outlook
Table 141 Chevron Corporation: Key Details, (CEO, HQ, Revenue, Founded, No. of Employees, Company Type, Website, Business Segment)
Table 142 Chevron Corporation: Product Benchmarking
Table 143 Chevron Corporation: Strategic Outlook
Table 144 BP Plc: Key Details, (CEO, HQ, Revenue, Founded, No. of Employees, Company Type, Website, Business Segment)
Table 145 BP Plc: Product Benchmarking
Table 146 TotalEnergies SE: Key Details, (CEO, HQ, Revenue, Founded, No. of Employees, Company Type, Website, Business Segment)
Table 147 TotalEnergies SE: Product Benchmarking
Table 148 TotalEnergies SE: Strategic Outlook
Table 149 ConocoPhillips Company: Key Details, (CEO, HQ, Revenue, Founded, No. of Employees, Company Type, Website, Business Segment)
Table 150 ConocoPhillips Company: Product Benchmarking
Table 151 ConocoPhillips Company: Strategic Outlook
Table 152 Eni S.p.A.: Key Details, (CEO, HQ, Revenue, Founded, No. of Employees, Company Type, Website, Business Segment)
Table 153 Eni S.p.A.: Product Benchmarking
Table 154 . Eni S.p.A: Strategic Outlook
Table 155 Woodside Energy Group Ltd: Key Details, (CEO, HQ, Revenue, Founded, No. of Employees, Company Type, Website, Business Segment)
Table 156 Woodside Energy Group Ltd: Product Benchmarking
Table 157 Woodside Energy Group Ltd: Strategic Outlook
Table 158 BG Group plc: Key Details, (CEO, HQ, Revenue, Founded, No. of Employees, Company Type, Website, Business Segment)
Table 159 BG Group plc: Product Benchmarking
Table 160 INPEX Corporation: Key Details, (CEO, HQ, Revenue, Founded, No. of Employees, Company Type, Website, Business Segment)
Table 161 INPEX Corporation: Product Benchmarking
Table 162 INPEX Corporation: Strategic Outlook
Table 163 Chesapeake Energy Corporation: Key Details, (CEO, HQ, Revenue, Founded, No. of Employees, Company Type, Website, Business Segment)
Table 164 Qatargas: Key Details, (CEO, HQ, Revenue, Founded, No. of Employees, Company Type, Website, Business Segment)
Table 165 Qatargas: Strategic Outlook
List of Figures
Figure 1 Liquified Natural Gas Market Segmentation
Figure 2 Liquified Natural Gas Market by Transport Fuel: Market Attractiveness Index
Figure 3 Liquified Natural Gas Market by End-use: Market Attractiveness Index
Figure 4 Liquified Natural Gas Market Attractiveness Index by Region
Figure 5 Liquified Natural Gas Market: Market Dynamics
Figure 6 Transportation Industry Market Size Over Time
Figure 7 COVID Impact Analysis: Liquified Natural Gas Market Recovery Scenarios
Figure 8 Global Liquified Natural Gas (LNG) Market Forecast, 2023-2033 (US$ Bn, AGR (%)) (V-Shaped Recovery Scenario)
Figure 9 Global Liquified Natural Gas (LNG) Market by Region, 2023-2033 (US$ Bn, AGR (%)) (V-Shaped Recovery Scenario)
Figure 10 Global Liquified Natural Gas (LNG) Market Forecast, 2023-2033 (US$ Bn, AGR (%)) (W-Shaped Recovery Scenario)
Figure 11 Global Liquified Natural Gas (LNG) Market by Region, 2023-2033 (US$ Bn, AGR (%)) (W-Shaped Recovery Scenario)
Figure 12 Global Liquified Natural Gas (LNG) Market Forecast, 2023-2033 (US$ Bn, AGR (%)) (U-Shaped Recovery Scenario)
Figure 13 Global Liquified Natural Gas (LNG) Market by Region, 2023-2033 (US$ Bn, AGR (%)) (U-Shaped Recovery Scenario)
Figure 14 Global Liquified Natural Gas (LNG) Market Forecast, 2023-2033 (US$ Bn, AGR (%)) (L-Shaped Recovery Scenario)
Figure 15 Global Liquified Natural Gas (LNG) Market by Region, 2023-2033 (US$ Bn, AGR (%)) (L-Shaped Recovery Scenario)
Figure 16 Liquified Natural Gas Market: Porter’s Five Forces Analysis
Figure 17 Liquified Natural Gas Market: PEST Analysis
Figure 18 Liquified Natural Gas Market by Transport Fuel: Market Attractiveness Index
Figure 19 Global Liquified Natural Gas (LNG) Market by Transport Fuel, 2023-2033 (US$ Bn, AGR (%))
Figure 20 Global Liquified Natural Gas (LNG) Market by Transport Fuel, 2023-2033 (BCM, AGR (%))
Figure 21 Heavy-Duty Vehicles Market by Region, 2023-2033 (US$ Bn, AGR (%))
Figure 22 Heavy-Duty Vehicles Market by Region, 2023-2033 (BCM, AGR (%))
Figure 23 Heavy Duty Vehicles Market Share Forecast by Region, 2023 & 2033 (%)
Figure 24 Passenger Vehicles Market by Region, 2023-2033 (US$ Bn, AGR (%))
Figure 25 Passenger Vehicles Market by Region, 2023-2033 (BCM, AGR (%))
Figure 26 Passenger Vehicles Market Share Forecast by Region, 2023 & 2033 (%)
Figure 27 Marine Transport Market by Region, 2023-2033 (US$ Bn, AGR (%))
Figure 28 Marine Transport Market by Region, 2023-2033 (BCM, AGR (%))
Figure 29 Marine Transport Vehicles Market Share Forecast by Region, 2023 & 2033 (%)
Figure 30 Other Transport Fuel Market by Region, 2023-2033 (US$ Bn, AGR (%))
Figure 31 Marine Transport Market by Region, 2023-2033 (BCM, AGR (%))
Figure 32 Other Transport Fuel Market Share Forecast by Region, 2023 & 2033 (%)
Figure 33 Liquified Natural Gas Market by End-use: Market Attractiveness Index
Figure 34 Global Liquified Natural Gas (LNG) Market by End-Use, 2023-2033 (US$ Bn, AGR (%))
Figure 35 Global Liquified Natural Gas (LNG) Market by End-Use, 2023-2033 (BCM, AGR (%))
Figure 36 Domestic Use Market by Region, 2023-2033 (US$ Bn, AGR (%))
Figure 37 Domestic Use Market by Region, 2023-2033 (BCM, AGR (%))
Figure 38 Domestic Use Market Share Forecast by Region, 2023 & 2033 (%)
Figure 39 Industrial Use Market by Region, 2023-2033 (US$ Bn, AGR (%))
Figure 40 Industrial Use Market by Region, 2023-2033 (BCM, AGR (%))
Figure 41 Industrial Use Market Share Forecast by Region, 2023 & 2033 (%)
Figure 42 Commercial Use Market by Region, 2023-2033 (US$ Bn, AGR (%))
Figure 43 Commercial Use Market by Region, 2023-2033 (BCM, AGR (%))
Figure 44 Commercial Use Market Share Forecast by Region, 2023 & 2033 (%)
Figure 45 Transportation Use Market by Region, 2023-2033 (US$ Bn, AGR (%))
Figure 46 Transportation Use Market by Region, 2023-2033 (BCM, AGR (%))
Figure 47 Transportation Use Market Share Forecast by Region, 2023 & 2033 (%)
Figure 48 Utilities and Power Use Market by Region, 2023-2033 (US$ Bn, AGR (%))
Figure 49 Utilities and Power Use Market by Region, 2023-2033 (BCM, AGR (%))
Figure 50 Utilities and Power Use Market Share Forecast by Region, 2023 & 2033 (%)
Figure 51 Other End-Use Market by Region, 2023-2033 (US$ Bn, AGR (%))
Figure 52 Other End-Use Market by Region, 2023-2033 (BCM, AGR (%))
Figure 53 Other End-Use Market Share Forecast by Region, 2023 & 2033 (%)
Figure 54 Global Liquified Natural Gas (LNG) Market Forecast, 2023-2033 (US$ Bn, AGR (%))
Figure 55 Global Liquified Natural Gas (LNG) Market Forecast, 2023-2033 (BCM, AGR (%))
Figure 56 Global Liquified Natural Gas (LNG) Market by Region, 2023-2033 (US$ Bn, AGR (%))
Figure 57 Global Liquified Natural Gas (LNG) Market by Region, 2023-2033 (BCM, AGR (%))
Figure 58 Global Liquified Natural Gas (LNG) Market by Transport Fuel, 2023-2033 (US$ Bn, AGR (%))
Figure 59 Global Liquified Natural Gas (LNG) Market by Transport Fuel, 2023-2033 (BCM, AGR (%))
Figure 60 Global Liquified Natural Gas (LNG) Market by End-Use, 2023-2033 (US$ Bn, AGR (%))
Figure 61 Global Liquified Natural Gas (LNG) Market by End-Use, 2023-2033 (BCM, AGR (%))
Figure 62 North America Liquified Natural Gas Market Attractiveness Index
Figure 63 North America Liquified Natural Gas (LNG) Market by Value, 2023-2033 (US$ Bn, AGR (%))
Figure 64 North America Liquified Natural Gas (LNG) Market by Volume, 2023-2033 (BCM, AGR (%))
Figure 65 North America Liquified Natural Gas (LNG) Market by Country, 2023-2033 (US$ Bn, AGR (%))
Figure 66 North America Liquified Natural Gas (LNG) Market by Country, 2023-2033 (BCM, AGR (%))
Figure 67 North America Liquified Natural Gas (LNG) Market Share Forecast by Country, 2023-2033 (%)
Figure 68 North America Liquified Natural Gas (LNG) Market by Transport Fuel, 2023-2033 (US$ Bn, AGR (%))
Figure 69 North America Liquified Natural Gas (LNG) Market by Transport Fuel, 2023-2033 (BCM, AGR (%))
Figure 70 North America Liquified Natural Gas (LNG) Market Share Forecast by Transport Fuel, 2023-2033 (%)
Figure 71 North America Liquified Natural Gas (LNG) Market by End-Use, 2023-2033 (US$ Bn, AGR (%))
Figure 72 North America Liquified Natural Gas (LNG) Market by End-Use, 2023-2033 (BCM, AGR (%))
Figure 73 North America Liquified Natural Gas (LNG) Market Share Forecast by End-Use, 2023-2033 (%)
Figure 74 US Liquified Natural Gas (LNG) Market by Value, 2023-2033 (US$ Bn, AGR (%))
Figure 75 US Liquified Natural Gas (LNG) Market by Volume, 2023-2033 (BCM, AGR (%))
Figure 76 Canada Liquified Natural Gas (LNG) Market by Value, 2023-2033 (US$ Bn, AGR (%))
Figure 77 Canada Liquified Natural Gas (LNG) Market by Volume, 2023-2033 (BCM, AGR (%))
Figure 78 Europe Liquified Natural Gas Market Attractiveness Index
Figure 79 Europe Liquified Natural Gas (LNG) Market by Value, 2023-2033 (US$ Bn, AGR (%))
Figure 80 Europe Liquified Natural Gas (LNG) Market by Volume, 2023-2033 (BCM, AGR (%))
Figure 81 Europe Liquified Natural Gas (LNG) Market by Country, 2023-2033 (US$ Bn, AGR (%))
Figure 82 Europe Liquified Natural Gas (LNG) Market by Country, 2023-2033 (BCM, AGR (%))
Figure 83 Europe Liquified Natural Gas (LNG) Market Share Forecast by Country, 2023-2033 (%)
Figure 84 Europe Liquified Natural Gas (LNG) Market by Transport Fuel, 2023-2033 (US$ Bn, AGR (%))
Figure 85 Europe Liquified Natural Gas (LNG) Market by Transport Fuel, 2023-2033 (BCM, AGR (%))
Figure 86 Europe Liquified Natural Gas (LNG) Market Share Forecast by Transport Fuel, 2023-2033 (%)
Figure 87 Europe Liquified Natural Gas (LNG) Market by End-Use, 2023-2033 (US$ Bn, AGR (%))
Figure 88 Europe Liquified Natural Gas (LNG) Market by End-Use, 2023-2033 (BCM, AGR (%))
Figure 89 Europe Liquified Natural Gas (LNG) Market Share Forecast by End-Use, 2023-2033 (%)
Figure 90 Russia Liquified Natural Gas (LNG) Market by Value, 2023-2033 (US$ Bn, AGR (%))
Figure 91 Russia Liquified Natural Gas (LNG) Market by Volume, 2023-2033 (BCM, AGR (%))
Figure 92 Germany Liquified Natural Gas (LNG) Market by Value, 2023-2033 (US$ Bn, AGR (%))
Figure 93 Germany Liquified Natural Gas (LNG) Market by Volume, 2023-2033 (BCM, AGR (%))
Figure 94 Italy Liquified Natural Gas (LNG) Market by Value, 2023-2033 (US$ Bn, AGR (%))
Figure 95 Italy Liquified Natural Gas (LNG) Market by Volume, 2023-2033 (BCM, AGR (%))
Figure 96 UK Liquified Natural Gas (LNG) Market by Value, 2023-2033 (US$ Bn, AGR (%))
Figure 97 UK Liquified Natural Gas (LNG) Market by Volume, 2023-2033 (BCM, AGR (%))
Figure 98 France Liquified Natural Gas (LNG) Market by Value, 2023-2033 (US$ Bn, AGR (%))
Figure 99 France Liquified Natural Gas (LNG) Market by Volume, 2023-2033 (BCM, AGR (%))
Figure 100 Rest of Europe Liquified Natural Gas (LNG) Market by Value, 2023-2033 (US$ Bn, AGR (%))
Figure 101 Rest of Europe Liquified Natural Gas (LNG) Market by Volume, 2023-2033 (BCM, AGR (%))
Figure 102 Asia Pacific Liquified Natural Gas Market Attractiveness Index
Figure 103 Asia-Pacific Liquified Natural Gas (LNG) Market by Value, 2023-2033 (US$ Bn, AGR (%))
Figure 104 Asia-Pacific Liquified Natural Gas (LNG) Market by Volume, 2023-2033 (BCM, AGR (%))
Figure 105 Asia-Pacific Liquified Natural Gas (LNG) Market by Country, 2023-2033 (US$ Bn, AGR (%))
Figure 106 Asia-Pacific Liquified Natural Gas (LNG) Market by Country, 2023-2033 (BCM, AGR (%))
Figure 107 Asia-Pacific Liquified Natural Gas (LNG) Market Share Forecast by Country, 2023-2033 (%)
Figure 108 Asia-Pacific Liquified Natural Gas (LNG) Market by Transport Fuel, 2023-2033 (US$ Bn, AGR (%))
Figure 109 Asia-Pacific Liquified Natural Gas (LNG) Market by Transport Fuel, 2023-2033 (BCM, AGR (%))
Figure 110 Asia-Pacific Liquified Natural Gas (LNG) Market Share Forecast by Transport Fuel, 2023-2033 (%)
Figure 111 Asia-Pacific Liquified Natural Gas (LNG) Market by End-Use, 2023-2033 (US$ Bn, AGR (%))
Figure 112 Asia-Pacific Liquified Natural Gas (LNG) Market by End-Use, 2023-2033 (BCM, AGR (%))
Figure 113 Asia-Pacific Liquified Natural Gas (LNG) Market Share Forecast by End-Use, 2023-2033 (%)
Figure 114 China Liquified Natural Gas (LNG) Market by Value, 2023-2033 (US$ Bn, AGR (%))
Figure 115 China Liquified Natural Gas (LNG) Market by Volume, 2023-2033 (BCM, AGR (%))
Figure 116 Japan Liquified Natural Gas (LNG) Market by Value, 2023-2033 (US$ Bn, AGR (%))
Figure 117 Japan Liquified Natural Gas (LNG) Market by Volume, 2023-2033 (BCM, AGR (%))
Figure 118 South Korea Liquified Natural Gas (LNG) Market by Value, 2023-2033 (US$ Bn, AGR (%))
Figure 119 South Korea Liquified Natural Gas (LNG) Market by Volume, 2023-2033 (BCM, AGR (%))
Figure 120 India Liquified Natural Gas (LNG) Market by Value, 2023-2033 (US$ Bn, AGR (%))
Figure 121 India Liquified Natural Gas (LNG) Market by Volume, 2023-2033 (BCM, AGR (%))
Figure 122 Thailand Liquified Natural Gas (LNG) Market by Value, 2023-2033 (US$ Bn, AGR (%))
Figure 123 Thailand Liquified Natural Gas (LNG) Market by Volume, 2023-2033 (BCM, AGR (%))
Figure 124 Rest of Asia-Pacific Liquified Natural Gas (LNG) Market by Value, 2023-2033 (US$ Bn, AGR (%))
Figure 125 Rest of Asia-Pacific Liquified Natural Gas (LNG) Market by Volume, 2023-2033 (BCM, AGR (%))
Figure 126 Middle East & Africa Liquified Natural Gas Market Attractiveness Index
Figure 127 Middle East & Africa Liquified Natural Gas (LNG) Market by Value, 2023-2033 (US$ Bn, AGR (%))
Figure 128 Middle East & Africa Liquified Natural Gas (LNG) Market by Volume, 2023-2033 (BCM, AGR (%))
Figure 129 Middle East & Africa Liquified Natural Gas (LNG) Market by Country, 2023-2033 (US$ Bn, AGR (%))
Figure 130 Middle East & Africa Liquified Natural Gas (LNG) Market by Country, 2023-2033 (BCM, AGR (%))
Figure 131 Middle East & Africa Liquified Natural Gas (LNG) Market Share Forecast by Country, 2023-2033 (%)
Figure 132 Middle East & Africa Liquified Natural Gas (LNG) Market by Transport Fuel, 2023-2033 (US$ Bn, AGR (%))
Figure 133 Middle East & Africa Liquified Natural Gas (LNG) Market by Transport Fuel, 2023-2033 (BCM, AGR (%))
Figure 134 Middle East & Africa Liquified Natural Gas (LNG) Market Share Forecast by Transport Fuel, 2023-2033 (%)
Figure 135 Middle East & Africa Liquified Natural Gas (LNG) Market by End-Use, 2023-2033 (US$ Bn, AGR (%))
Figure 136 Middle East & Africa Liquified Natural Gas (LNG) Market by End-Use, 2023-2033 (BCM, AGR (%))
Figure 137 Middle East & Africa Liquified Natural Gas (LNG) Market Share Forecast by End-Use, 2023-2033 (%)
Figure 138 GCC Liquified Natural Gas (LNG) Market by Value, 2023-2033 (US$ Bn, AGR (%))
Figure 139 GCC Liquified Natural Gas (LNG) Market by Volume, 2023-2033 (BCM, AGR (%))
Figure 140 South Africa Liquified Natural Gas (LNG) Market by Value, 2023-2033 (US$ Bn, AGR (%))
Figure 141 South Africa Liquified Natural Gas (LNG) Market by Volume, 2023-2033 (BCM, AGR (%))
Figure 142 Rest of Middle East & Africa Liquified Natural Gas (LNG) Market by Value, 2023-2033 (US$ Bn, AGR (%))
Figure 143 Rest of Middle East & Africa Liquified Natural Gas (LNG) Market by Volume, 2023-2033 (BCM, AGR (%))
Figure 144 Latin America Liquified Natural Gas Market Attractiveness Index
Figure 145 Latin America Liquified Natural Gas (LNG) Market by Value, 2023-2033 (US$ Bn, AGR (%))
Figure 146 Latin America Liquified Natural Gas (LNG) Market by Volume, 2023-2033 (BCM, AGR (%))
Figure 147 Latin America Liquified Natural Gas (LNG) Market by Country, 2023-2033 (US$ Bn, AGR (%))
Figure 148 Latin America Liquified Natural Gas (LNG) Market by Country, 2023-2033 (BCM, AGR (%))
Figure 149 Latin America Liquified Natural Gas (LNG) Market Share Forecast by Country, 2023-2033 (%)
Figure 150 Latin America Liquified Natural Gas (LNG) Market by Transport Fuel, 2023-2033 (US$ Bn, AGR (%))
Figure 151 Latin America Liquified Natural Gas (LNG) Market by Transport Fuel, 2023-2033 (BCM, AGR (%))
Figure 152 Latin America Liquified Natural Gas (LNG) Market Share Forecast by Transport Fuel, 2023-2033 (%)
Figure 153 Latin America Liquified Natural Gas (LNG) Market by End-Use, 2023-2033 (US$ Bn, AGR (%))
Figure 154 Latin America Liquified Natural Gas (LNG) Market by End-Use, 2023-2033 (BCM, AGR (%))
Figure 155 Latin America Liquified Natural Gas (LNG) Market Share Forecast by End-Use, 2023-2033 (%)
Figure 156 Argentina Liquified Natural Gas (LNG) Market by Value, 2023-2033 (US$ Bn, AGR (%))
Figure 157 Argentina Liquified Natural Gas (LNG) Market by Volume, 2023-2033 (BCM, AGR (%))
Figure 158 Mexico Liquified Natural Gas (LNG) Market by Value, 2023-2033 (US$ Bn, AGR (%))
Figure 159 Argentina Liquified Natural Gas (LNG) Market by Volume, 2023-2033 (BCM, AGR (%))
Figure 160 Rest of Latin America Liquified Natural Gas (LNG) Market by Value, 2023-2033 (US$ Bn, AGR (%))
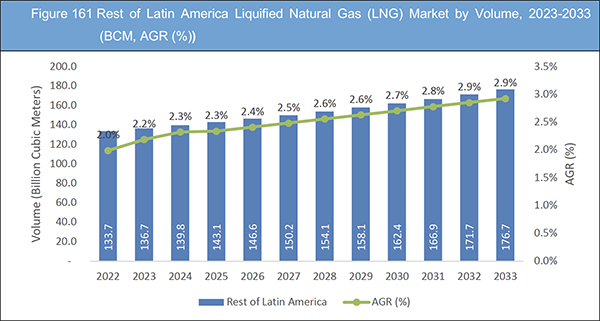
Figure 161 Rest of Latin America Liquified Natural Gas (LNG) Market by Volume, 2023-2033 (BCM, AGR (%))
Figure 162 Liquified Natural Gas Market: Company Share, 2022
Figure 163 Royal Dutch Shell Plc: Net Revenue, 2018-2022 (US$ million, AGR%)
Figure 164 Royal Dutch Shell Plc: R&D, 2018-2022 (US$ million, AGR%)
Figure 165 Royal Dutch Shell Plc: Regional Market Shares, 2022
Figure 166 Royal Dutch Shell Plc: Business Segment Market Shares, 2022
Figure 167 Equinor ASA: Net Revenue, 2018-2022 (US$ million, AGR%)
Figure 168 Equinor ASA: R&D, 2018-2022 (US$ million, AGR%)
Figure 169 Equinor ASA: Regional Market Shares, 2022
Figure 170 Equinor ASA: Business Segment Market Shares, 2022
Figure 171 ExxonMobil Corporation: Net Revenue, 2018-2022 (US$ million, AGR%)
Figure 172 ExxonMobil Corporation: R&D, 2018-2022 (US$ million, AGR%)
Figure 173 ExxonMobil Corporation: Regional Market Shares, 2022
Figure 174 ExxonMobil Corporation: Business Segment Market Shares, 2022
Figure 175 Chevron Corporation: Net Revenue, 2018-2022 (US$ million, AGR%)
Figure 176 Chevron Corporation: R&D, 2018-2022 (US$ million, AGR%)
Figure 177 Chevron Corporation: Regional Market Shares, 2022
Figure 178 Chevron Corporation: Business Market Shares, 2022
Figure 179 BP Plc: Net Revenue, 2018-2022 (US$ million, AGR%)
Figure 180 BP Plc: R&D, 2018-2022 (US$ million, AGR%)
Figure 181 BP Plc: Business Segment Market Shares, 2022
Figure 182 TotalEnergies SE: Net Revenue, 2018-2022 (US$ million, AGR%)
Figure 183 TotalEnergies SE: R&D, 2018-2022 (US$ million, AGR%)
Figure 184 TotalEnergies SE: Regional Market Shares, 2022
Figure 185 TotalEnergies SE: Business Segment Market Shares, 2022
Figure 186 ConocoPhillips Company: Net Revenue, 2018-2022 (US$ million, AGR%)
Figure 187 ConocoPhillips Company: R&D, 2018-2022 (US$ million, AGR%)
Figure 188 ConocoPhillips Company: Regional Market Shares, 2022
Figure 189 ConocoPhillips Company: Regional Market Shares, 2022
Figure 190 Eni S.p.A.: Net Revenue, 2018-2022 (US$ million, AGR%)
Figure 191 Eni S.p.A.: R&D, 2018-2022 (US$ million, AGR%)
Figure 192 Eni S.p.A.: Regional Market Shares, 2022
Figure 193 Eni S.p.A.: Business Segment Market Shares, 2022
Figure 194 Woodside Energy Group Ltd: Net Revenue, 2017-2021 (US$ million, AGR%)
Figure 195 Woodside Energy Group Ltd: Regional Market Shares, 2022
Figure 196 Woodside Energy Group Ltd: Business Segment Market Shares, 2022
Figure 197 BG Group plc: Net Revenue, 2018-2022 (US$ million, AGR%)
Figure 198 BG Group plc: R&D, 2018-2022 (US$ million, AGR%)
Figure 199 BG Group plc: Regional Market Shares, 2022
Figure 200 BG Group plc: Business Segment Market Shares, 2022
Figure 201 INPEX Corporation: Net Revenue, 2017-2021 (US$ million, AGR%)
Figure 202 INPEX Corporation: R&D, 2017-2021 (US$ million, AGR%)
Figure 203 INPEX Corporation: Regional Market Shares, 2021
Figure 204 INPEX Corporation: Regional Market Shares, 2021
Figure 205 Chesapeake Energy Corporation: Net Revenue, 2018-2022 (US$ million, AGR%)
Figure 206 Chesapeake Energy Corporation: R&D, 2018-2022 (US$ million, AGR%)
Figure 207 Chesapeake Energy Corporation: Regional Market Shares, 2021
List of Companies Profiled in the report
BG Group plc
BP Plc
Chesapeake Energy Corporation
Chevron Corporation
ConocoPhillips Company
Eni S.p.A.
Equinor ASA
ExxonMobil Corporation
Gazprom PJSC
INPEX Corporation
Petronas Dagangan Berhad
Qatargas
Royal Dutch Shell Plc.
TotalEnergies SE
Woodside Energy Group Ltd
List of Other Companies Mentioned in the report
Anadarko Petroleum Corporation
Bechtel Corporation
BG Group
Bharat Petroleum Corporation Limited (BPCL)
Cheniere Energy, Inc.
China National Offshore Oil Corporation (CNOOC)
China National Petroleum Corporation (CNPC)
CNOOC Limited
Concho Resources Inc.
ConocoPhillips
Dominion Cove Point LNG, LP
Dominion Energy
Dominion Energy Cove Point LNG, LP
ENI S.p.A.
ENN Energy Holdings Limited
Equinor
Freeport LNG
Gasum Oy
Gazprom
Golar LNG
Hyundai Heavy Industries Co. Ltd.
JERA Co. Inc.
Kinder Morgan, Inc.
Korea Gas Corporation
LNG Canada
Marubeni Corporation
Mitsubishi Corporation
NextDecade Corporation
Novatek
Occidental Petroleum Corporation
Origin Energy
Petróleo Brasileiro S.A. (Petrobras)
Petronas
PTT Public Company Limited
Qatar Petroleum
Repsol
Royal Vopak N.V.
Santos Ltd.
Sempra Energy
Shell Gas B.V.
Sinopec
Tellurian Inc.
Tokyo Gas Co. Ltd.
Venture Global LNG, Inc.
Woodside Petroleum
List of Associations Mentioned in the Report
American Gas Association (AGA)
Gas Exporting Countries Forum (GECF)
Gas Processors Association (GPA)
Gas Technology Institute (GTI)
Global Gas Analytics (GGA)
International Association of Classification Societies (IACS)
International Association of Dredging Companies (IADC)
International Association of Energy Economics (IAEE)
International Association of LNG Suppliers (IALNGS)
International Association of Oil and Gas Producers (IOGP)
International Energy Agency (IEA)
International Energy Forum (IEF)
International Gas Research Conference (IGRC)
International Gas Union (IGU)
International Gas Union Research Conference (IGRC)
International Group of Liquefied Natural Gas Importers (GIIGNL)
LNG Bunkering & Refuelling Association (LNG BFR)
LNG Marine Fuel Institute (LNG MFI)
LNG Producers Association (LNGPA)
National Association of Regulatory Utility Commissioners (NARUC)
Society for Gas as a Marine Fuel (SGMF)
Society of Gas Lighters (SGL)
Society of International Gas Tanker and Terminal Operators (SIGTTO)
The LNG Marine Fuel Institute (LNG MFI)
World LNG Report
 Market Report 2023-2033")