The Small Scale Liquefied Natural Gas (SSLNG) Market Report 2023-2033: This report will prove invaluable to leading firms striving for new revenue pockets if they wish to better understand the industry and its underlying dynamics. It will be useful for companies that would like to expand into different industries or to expand their existing operations in a new region.
The Small Scale LNG Market Is Poised for Significant Growth in the Coming Years
The Small Scale LNG market is poised for significant growth in the coming years, driven by increasing demand for natural gas as a cleaner and more cost-effective fuel option. The market is expected to play a key role in supporting the global transition to a more sustainable energy system, as countries look to reduce their carbon footprint and meet their climate targets.
North America and Europe are expected to be key markets for Small Scale LNG, driven by the growth of the transportation and power generation sectors, as well as the development of LNG bunkering infrastructure. In the Asia Pacific region, India, Indonesia, and China are expected to be the major growth drivers, as these countries look to expand their natural gas infrastructure and reduce their reliance on traditional fossil fuels.
In the Middle East and Africa, the Small Scale LNG market is expected to benefit from the region’s significant natural gas reserves and the development of new LNG liquefaction and regasification technologies. The market is also expected to play a key role in supporting the region’s efforts to diversify its energy mix and reduce its carbon footprint.
Overall, the growth of the Small Scale LNG market is expected to be driven by a combination of government policies, technological advancements, and increasing demand for cleaner and more cost-effective fuel options. While the market still faces some challenges, such as the high capital costs associated with liquefaction and regasification infrastructure, the long-term outlook for Small Scale LNG remains positive, as it offers a viable solution for meeting the growing demand for natural gas in a sustainable manner.
What Questions Should You Ask before Buying a Market Research Report?
• How is the small scale liquefied natural gas (SSLNG) market evolving?
• What is driving and restraining the small scale liquefied natural gas (SSLNG) market?
• How will each small scale liquefied natural gas (SSLNG) submarket segment grow over the forecast period and how much revenue will these submarkets account for in 2033?
• How will the market shares for each small scale liquefied natural gas (SSLNG) submarket develop from 2023 to 2033?
• What will be the main driver for the overall market from 2023 to 2033?
• Will leading small scale liquefied natural gas (SSLNG) markets broadly follow the macroeconomic dynamics, or will individual national markets outperform others?
• How will the market shares of the national markets change by 2033 and which geographical region will lead the market in 2033?
• Who are the leading players and what are their prospects over the forecast period?
• What are the small scale liquefied natural gas (SSLNG) projects for these leading companies?
• How will the industry evolve during the period between 2023 and 2033? What are the implications of small scale liquefied natural gas (SSLNG) projects taking place now and over the next 10 years?
• Is there a greater need for product commercialisation to further scale the small scale liquefied natural gas (SSLNG) market?
• Where is the small scale liquefied natural gas (SSLNG) market heading and how can you ensure you are at the forefront of the market?
• What are the best investment options for new product and service lines?
• What are the key prospects for moving companies into a new growth path and C-suite?
You need to discover how this will impact the small scale liquefied natural gas (SSLNG) market today, and over the next 10 years:
• Our 376-page report provides 171 tables and 203 charts/graphs exclusively to you.
• The report highlights key lucrative areas in the industry so you can target them – NOW.
• It contains in-depth analysis of global, regional and national sales and growth.
• It highlights for you the key successful trends, changes and revenue projections made by your competitors.
This report tells you TODAY how the small scale liquefied natural gas (SSLNG) market will develop in the next 10 years, and in line with the variations in COVID-19 economic recession and bounce. This market is more critical now than at any point over the last 10 years.
Forecasts to 2033 and other analyses reveal commercial prospects
• In addition to revenue forecasting to 2033, our new study provides you with recent results, growth rates, and market shares.
• You will find original analyses, with business outlooks and developments.
• Discover qualitative analyses (including market dynamics, drivers, opportunities, restraints and challenges), cost structure, impact of rising small scale liquefied natural gas (SSLNG) prices and recent developments.
This report includes data analysis and invaluable insight into how COVID-19 will affect the industry and your company. Four COVID-19 recovery patterns and their impact, namely, “V”, “L”, “W” and “U” are discussed in this report.
Segments Covered in the Report
Market Segment by Plant Process
• Gas Treatment
• H2S/CO2 Removal
• Dehydration
• Heavy Component Removal
• LNG Liquefaction
• Other Plant Process
Market Segment by Transport
• Small LNG Carriers
• Small LNG Trucks
• Other SSLNG Transport
Market Segment by Value Chain
• SSLNG Liquefaction Plant
• SSLNG Storage
• SSLNG Transport
• SSLNG Re-gasification
Market Segment by Re-Gasification
• Open Rack Vaporisers (ORV)
• Submerged Combustion Vaporisers (SCV)
• Ambient Air Vaporisers (AAV)
• Odorisation, Send-out, and Delivery
• Other Re-Gasification
Market Segment by Storage
• Single Containment Tanks
• Double Containment Tanks
• Full Containment Tanks
• Pressurized Small Tanks
• Membrane Tanks
• In-ground Tanks

In addition to the revenue predictions for the overall world market and segments, you will also find revenue forecasts for four regional and 20 leading national markets:
North America
• U.S.
• Canada
Europe
• Russia
• Spain
• Portugal
• France
• Belgium
• Rest of Europe
Asia Pacific
• China
• India
• Japan
• Indonesia
• Malaysia
• Rest of Asia Pacific
Latin America
• Brazil
• Mexico
• Rest of Latin America
Middle East & Africa
• GCC
• South Africa
• Rest of Middle East & Africa
Need industry data? Please contact us today.
The report also includes profiles and for some of the leading companies in the Small Scale Liquefied Natural Gas (SSLNG) Market, 2023 to 2033, with a focus on this segment of these companies’ operations.
Leading companies and the potential for market growth
• Buffalo Marine Service INC
• Gasum Oy
• Gazprom ltd
• ENN Energy Holdings Ltd.
• China Petroleum & Chemical Corporation (SINOPEC)
• Encana (Ovintiv Inc)
• Equinor ASA
• Ferus Inc.
• Flint Hills Resources LLC
• Hokkaido Gas co., ltd.
• Japan Petroleum Exploration Co., Ltd.
• Nippon Gas Co., Ltd
• Petronas Dagangan Berhad
• Polish Oil and Gas Company (PGNiG)
• Royal Dutch Shell Plc.
Overall world revenue for Small Scale Liquefied Natural Gas (SSLNG) Market, 2023 to 2033 in terms of value the market will surpass US$7.30 billion in 2023, our work calculates. We predict strong revenue growth through to 2033. Our work identifies which organizations hold the greatest potential. Discover their capabilities, progress, and commercial prospects, helping you stay ahead.
How will the Small Scale Liquefied Natural Gas (SSLNG) Market, 2023 to 2033 report help you?
In summary, our 370+ page report provides you with the following knowledge:
• Revenue forecasts to 2033 for Small Scale Liquefied Natural Gas (SSLNG) Market, 2023 to 2033 Market, with forecasts for plant process, transport, storage, value chain, regasification and company size, each forecast at a global and regional level – discover the industry’s prospects, finding the most lucrative places for investments and revenues.
• Revenue forecasts to 2033 for four regional and 20 key national markets – See forecasts for the Small Scale Liquefied Natural Gas (SSLNG) Market, 2023 to 2033 market in North America, Europe, Asia-Pacific, Latin America and Middle East & Africa. Also forecasted is the market in the US, Canada, Russia, France, Belgium, China, Indonesia, India, and GCC among other prominent economies.
• Prospects for established firms and those seeking to enter the market – including company profiles for 15 of the major companies involved in the Small Scale Liquefied Natural Gas (SSLNG) Market, 2023 to 2033.
Find quantitative and qualitative analyses with independent predictions. Receive information that only our report contains, staying informed with invaluable business intelligence.
Information found nowhere else
With our new report, you are less likely to fall behind in knowledge or miss out on opportunities. See how our work could benefit your research, analyses, and decisions. Visiongain’s study is for everybody needing commercial analyses for the Small Scale Liquefied Natural Gas (SSLNG) Market, 2023 to 2033, market-leading companies. You will find data, trends and predictions.
To access the data contained in this document please email contactus@visiongain.com
Buy our report today Small Scale Liquefied Natural Gas (SSLNG) Market Report 2023-2033: Forecasts by Plant Process (Gas Treatment, H2S/CO2 Removal, Dehydration, Heavy Component Removal, LNG Liquefaction, Other), by Transport (Small LNG Carriers, Small LNG Trucks, Other), by Value Chain (SSLNG Liquefaction Plant, SSLNG Storage, SSLNG Transport, SSLNG Re-gasification), by Re-Gasification (Open Rack Vaporisers (ORV), Submerged Combustion Vaporisers (SCV), Ambient Air Vaporisers (AAV), Odorisation, Send-out, and Delivery, Other), by Storage (Single Containment Tanks, Double Containment Tanks, Full Containment Tanks, Pressurised Small Tanks, Membrane Tanks, In-ground Tanks) AND Regional and Leading National Market Analysis PLUS Analysis of Leading Companies AND COVID-19 Impact and Recovery Pattern Analysis. Avoid missing out by staying informed – order our report now.
Visiongain is a trading partner with the US Federal Government
CCR Ref number: KD4R6
Do you have any custom requirements we can help you with? Any need for a specific country, geo region, market segment or specific company information? Contact us today, we can discuss your needs and see how we can help: contactus@visiongain.com
1 Report Overview
1.1 Objectives of the Study
1.2 Introduction to Global SSLNG Market
1.3 What This Report Delivers
1.4 Why You Should Read This Report
1.5 Key Questions Answered by This Analytical Report
1.6 Who is This Report for?
1.7 Research Methodology
1.7.1 Market Definitions
1.7.2 Market Evaluation & Forecasting Methodology
1.7.3 Data Validation
1.8 Frequently Asked Questions (FAQs)
1.9 Associated Visiongain Reports
1.10 About Visiongain
2 Executive Summary
2.1 Geographical Snapshot: Global SSLNG Market
2.2 Plant Process Segment: Market Attractiveness Index
2.3 Transport Segment: Market Attractiveness Index
2.4 Value Chain Segment: Market Attractiveness Index
2.5 Re-Gasification Segment: Market Attractiveness Index
2.6 Storage Segment: Market Attractiveness Index
3 Industry Structure Overview
3.1 Overview
3.1.1 Standards and Safety
3.2 LNG Value Chain
3.3 Recent Development
4 Market Overview
4.1 Key Findings
4.2 Market Driving Factors
4.2.1 Need for Reliable and Affordable Energy in Off-Grid Areas
4.2.2 Growing Demand for Natural Gas as a Cleaner Energy Source
4.3 Market Restraining Factors
4.3.1 Shipping Cost is Very High
4.3.2 Availability of Supply and Demand
4.4 Market Opportunities
4.4.1 Limited Pipeline Infrastructure in Remote Areas
4.4.2 Increased Focus on Reducing Carbon Emissions
4.4.3 Low Investment Costs
4.4.4 Lower Taxes and Fees
4.5 SWOT Analysis
4.5.1 Market Strengths
4.5.2 Market Weaknesses
4.5.3 Market Opportunities
4.5.4 Market Threats
4.6 COVID-19 Impact Analysis
4.7 Porter’s Five Forces Analysis
4.7.1 Bargaining Power of Suppliers
4.7.2 Bargaining Power of Buyers
4.7.3 Competitive Rivalry
4.7.4 Threat from Substitutes
4.7.5 Threat of New Entrants
4.8 PESTLE Analysis
4.8.1 Political Factors
4.8.2 Economical Factors
4.8.3 Social Factors
4.8.4 Technology Factors
4.8.5 Environment Factors
4.8.6 Legal Factors
5 Global SSLNG Market Analysis
6 Small Scale LNG Market Analysis by Plant Process
6.1 Key Findings
6.2 Plant Process Segment: Market Attractiveness Index
6.3 SSLNG Market Size Estimation and Forecast by Plant Process
6.4 Gas Treatment
6.4.1 Global Gas Treatment Market by Region
6.5 H2S/CO2 Removal
6.5.1 Global H2S/CO2 Removal Market by Region
6.6 Dehydration
6.6.1 Global Dehydration Market by Region
6.7 Heavy Component Removal
6.7.1 Global Heavy Component Removal Market by Region
6.8 LNG Liquefaction
6.8.1 Global LNG Liquefaction Market by Region
6.9 Other Plant Process
6.9.2 Global Other Plant Process Market by Region
7 Small Scale LNG Market Analysis by Transport
7.1 Key Findings
7.2 Transport Segment: Market Attractiveness Index
7.3 Small LNG Carriers
7.3.1 Global Small LNG Carriers Market by Region
7.4 Small LNG Trucks
7.4.1 Global Small LNG Trucks Market by Region
7.5 Other SSLNG Transport
7.5.1 Ship
7.5.2 Global Other SSLNG Transport Market by Region
8 Small Scale LNG Market Analysis by Value Chain
8.1 Key Findings
8.2 Value Chain Segment: Market Attractiveness Index
8.3 SSLNG Liquefaction Plant
8.3.1 Global SSLNG Liquefaction Plant Market by Region
8.4 SSLNG Storage
8.4.1 Global SSLNG Storage Market by Region
8.5 SSLNG Transport
8.5.1 Global SSLNG Transport Market by Region
8.6 SSLNG Re-gasification
8.6.1 Global SSLNG Re-gasification Market by Region
9 Small Scale LNG Market Analysis by Re-Gasification
9.1 Key Findings
9.2 Re-Gasification Segment: Market Attractiveness Index
9.3 Ambient Air Vaporisers (AAV)
9.3.1 Global Ambient Air Vaporisers (AAV) Market by Region
9.4 Odorization, Send-out, and Delivery
9.4.1 Global Odorization, Send-out, and Delivery Market by Region
9.5 Open Rack Vaporisers (ORV)
9.5.1 Global Open Rack Vaporizers (ORV) Market by Region
9.6 Submerged Combustion Vaporizers (SCV)
9.6.1 Global Submerged Combustion Vaporisers (SCV) Market by Region
9.7 Other Re-Gasification
9.7.2 Global Other Re-Gasification Market by Region
10 Small Scale LNG Market Analysis by Storage
10.1 Key Findings
10.2 Storage Segment: Market Attractiveness Index
10.2.1 Single & Double Containment Tanks
10.2.2 Double Containment Tanks
10.2.3 Full Containment Tanks
10.2.4 Pressurized Small Tanks
10.2.5 Membrane Tanks
10.2.6 In-ground Tanks
11 Small Scale LNG Market Analysis by Region
11.1 Key Findings
11.2 Regional Market Size Estimation and Forecast
12 North America Global SSLNG Market Analysis
12.1 Key Findings
12.1.1 North America’s First LNG Bunker Barge Completes 300th Bunkering OP
12.1.2 North America Small Scale Liquefied Natural Gas (SSLNG) Market by Country
12.1.3 North America Small Scale Liquefied Natural Gas (SSLNG) Market by Plant Process
12.1.4 North America Small Scale Liquefied Natural Gas (SSLNG) Market by Transport
12.1.5 North America Small Scale Liquefied Natural Gas (SSLNG) Market by Value Chain
12.1.6 North America Small Scale Liquefied Natural Gas (SSLNG) Market by Re-Gasification
12.1.7 North America Small Scale Liquefied Natural Gas (SSLNG) Market by Storage
12.2 U.S. SSLNG Market Analysis
12.2.1 Stabilis Working to Reach Overseas Customers with Small-Scale LNG After DOE Approval
12.3 Canada SSLNG Market Analysis
12.3.1 LNG Canada, Country's $40-Billion 'Second Chance' at Becoming a Global LNG Leader, Takes Shape
13 Europe Global SSLNG Market Analysis
13.1 Key Findings
13.1.1 Elengy and Delta Rail to Launch New LNG Container Service from in Europe
13.1.2 Europe Small Scale Liquefied Natural Gas (SSLNG) Market by Country
13.1.3 Europe Small Scale Liquefied Natural Gas (SSLNG) Market by Plant Process
13.1.4 Europe Small Scale Liquefied Natural Gas (SSLNG) Market by Transport
13.1.5 Europe Small Scale Liquefied Natural Gas (SSLNG) Market by Value Chain
13.1.6 Europe Small Scale Liquefied Natural Gas (SSLNG) Market by Re-Gasification
13.1.7 Europe Small Scale Liquefied Natural Gas (SSLNG) Market by Storage
13.2 Russia SSLNG Market Analysis
13.2.1 Novatek Signs Small-Scale LNG Cooperation Agreements
13.3 Spain SSLNG Market Analysis
13.3.1 First Small-Scale LNG Bunker Vessel Built In Spain Delivered
13.4 Portugal SSLNG Market Analysis
13.4.1 Portugal: Kanfer Enters LNG Bunkering MOA with Suardiaz and SSY
13.5 France SSLNG Market Analysis
13.5.1 Total Realizes France's First Ship-to-Containership LNG Bunkering Operation, after Inaugural Loading at Dunkirk LNG Terminal
13.6 Belgium SSLNG Market Analysis
13.6.1 Belgium Plans to Double Gas Transit to Germany, Build New Interconnectors
13.7 Rest of Europe SSLNG Market Analysis
14 Asia-Pacific Global SSLNG Market Analysis
14.1 Key Findings
14.1.1 Asia-Pacific Freight Premia for Bigger LNG Carriers Spurt as Storage Demand Jumps
14.1.2 Asia-Pacific Small Scale Liquefied Natural Gas (SSLNG) Market by Country
14.1.3 Asia-Pacific Small Scale Liquefied Natural Gas (SSLNG) Market by Plant Process
14.1.4 Asia-Pacific Small Scale Liquefied Natural Gas (SSLNG) Market by Transport
14.1.5 Asia-Pacific Small Scale Liquefied Natural Gas (SSLNG) Market by Value Chain
14.1.6 Asia-Pacific Small Scale Liquefied Natural Gas (SSLNG) Market by Re-Gasification
14.1.7 Asia-Pacific Small Scale Liquefied Natural Gas (SSLNG) Market by Storage
14.2 China SSLNG Market Analysis
14.2.1 Anthony Veder Takes Delivery of Small-Scale LNG Carrier in China
14.3 India SSLNG Market Analysis
14.3.1 GAIL (India) Hires New LNG Carrier from NYK Line on Multi-Year Deal
14.4 Japan SSLNG Market Analysis
14.4.1 Japan’s Mitsui Eyes Small-Scale LNG In India
14.5 Indonesia SSLNG Market Analysis
14.5.1 Pertamina Set to Build Small-Scale LNG Regas Unit
14.6 Malaysia SSLNG Market Analysis
14.6.1 Avenir LNG First Dual-Purpose LNG Bunkering and Supply Vessel has Begun Operations in Malaysia
14.7 Rest of Asia-Pacific SSLNG Market Analysis
15 Middle East and Africa Global SSLNG Market Analysis
15.1 Key Findings
15.1.1 Nigeria FLNG Project FEED Contract is Signed by UTM Offshore
15.1.2 First LNG Exports from Coral Sul, Mozambique
15.1.3 Middle East & Africa Small Scale Liquefied Natural Gas (SSLNG) Market by Country
15.1.4 Middle East & Africa Small Scale Liquefied Natural Gas (SSLNG) Market by Plant Process
15.1.5 Middle East & Africa Small Scale Liquefied Natural Gas (SSLNG) Market by Transport
15.1.6 Middle East & Africa Small Scale Liquefied Natural Gas (SSLNG) Market by Value Chain
15.1.7 Middle East & Africa Small Scale Liquefied Natural Gas (SSLNG) Market by Re-Gasification
15.1.8 Middle East & Africa Small Scale Liquefied Natural Gas (SSLNG) Market by Storage
15.2 GCC SSLNG Market Analysis
15.3 South Africa SSLNG Market Analysis
15.3.1 Small-Scale LNG Schemes Start to Gain Momentum
15.4 Rest of Middle East & Africa SSLNG Market Analysis
15.4.1 UAE Agrees LNG Deal with Germany as Berlin Looks to Replace Russian Gas
16 Latin America Global SSLNG Market Analysis
16.1 Key Findings
16.1.1 LNG Seen as Baseload Option in Latin American Energy Transition Push
16.1.2 Latin America Small Scale Liquefied Natural Gas (SSLNG) Market by Country
16.1.3 Latin America Small Scale Liquefied Natural Gas (SSLNG) Market by Plant Process
16.1.4 Latin America Small Scale Liquefied Natural Gas (SSLNG) Market by Transport
16.1.5 Latin America Small Scale Liquefied Natural Gas (SSLNG) Market by Value Chain
16.1.6 Latin America Small Scale Liquefied Natural Gas (SSLNG) Market by Re-Gasification
16.1.7 Latin America Small Scale Liquefied Natural Gas (SSLNG) Market by Storage
16.2 Brazil SSLNG Market Analysis
16.2.1 Small-Scale LNG to Expand Brazil's Gas Grid: EPE
16.3 Mexico SSLNG Market Analysis
16.3.1 Mexico Likely to Further Expand LNG Export Capacity
16.4 Rest of Latin America SSLNG Market Analysis
16.4.1 Trinidad Gets to Work on Design of Small LNG Hub to Feed The Caribbean
17 Competitive Landscape
17.1 Strategic Outlook
17.1.1 Acquisitions as Key Business Strategy
17.1.2 Partnership as Key Business Strategy
17.1.3 Collaboration as Key Business Strategy
17.1.4 New Product Launch as Key Business Strategy
17.1.5 Expansion as Key Business Strategy
17.1.6 Joint Venture as Key Business Strategy
18 Company Profiling
18.1 Buffalo Marine Service INC
18.1.1 Company Snapshot
18.1.2 Company Overview
18.1.3 Product Benchmarking
18.2 Gasum Oy
18.2.1 Company Snapshot
18.2.2 Company Overview
18.2.3 Product Benchmarking
18.2.4 Strategic Outlook
18.3 Gazprom ltd
18.3.1 Company Snapshot
18.3.2 Company Overview
18.3.3 Product Benchmarking
18.3.4 Strategic Outlook
18.4 ENN Energy Holdings Ltd.
18.4.1 Company Snapshot
18.4.2 Company Overview
18.4.3 Financial Analysis
18.4.4 Strategic Outlook
18.5 China Petroleum & Chemical Corporation (SINOPEC)
18.5.1 Company Snapshot
18.5.2 Company Overview
18.5.3 Financial Analysis
18.5.4 Product Benchmarking
18.5.5 Strategic Outlook
18.6 Ovintiv Inc.
18.6.1 Company Snapshot
18.6.2 Company Overview
18.6.3 Financial Analysis
18.6.4 Product Benchmarking
18.6.5 Strategic Outlook
18.7 Equinor ASA
18.7.1 Company Snapshot
18.7.2 Company Overview
18.7.3 Financial Analysis
18.7.4 Product Benchmarking
18.7.5 Strategic Outlook
18.8 Ferus Inc
18.8.1 Company Snapshot
18.8.2 Company Overview
18.8.3 Product Benchmarking
18.8.4 Strategic Outlook
18.9 Flint Hills Resources LLC
18.9.1 Company Snapshot
18.9.2 Company Overview
18.9.3 Product Benchmarking
18.10 Hokkaido gas co., ltd.
18.10.1 Company Snapshot
18.10.2 Company Overview
18.10.3 Financial Analysis
18.10.4 Strategic Outlook
18.11 Japan Petroleum Exploration Co., Ltd.
18.11.1 Company Snapshot
18.11.2 Company Overview
18.11.3 Product Benchmarking
18.11.4 Strategic Outlook
18.12 Nippon Gas Co., Ltd
18.12.1 Company Snapshot
18.12.2 Company Overview
18.12.3 Product Benchmarking
18.13 Petronas Dagangan Berhad
18.13.1 Company Snapshot
18.13.2 Company Overview
18.13.3 Product Benchmarking
18.13.4 Strategic Outlook
18.14 Polish Oil and Gas Company (PGNiG)
18.14.1 Company Snapshot
18.14.2 Company Overview
18.14.3 Product Benchmarking
18.14.4 Strategic Outlook
18.15 Royal Dutch Shell Plc.
18.15.1 Company Snapshot
18.15.2 Company Overview
18.15.3 Financial Analysis
18.15.4 Product Benchmarking
18.15.5 Strategic Outlook
19 Conclusion and Recommendations
19.1 Concluding Remarks from Visiongain
19.2 Recommendations for Market Players
List of Tables
Table 1 Small Scale LNG Market Snapshot, 2023 & 2033 (US$ billion, CAGR %)
Table 2 Global Small Scale Liquefied Natural Gas (SSLNG) Market Forecast, 2023-2033 (US$ Bn, AGR (%), CAGR (%)) (V-Shaped Recovery Scenario)
Table 3 Global Small Scale Liquefied Natural Gas (SSLNG) Market by Region, 2023-2033 (US$ Bn, AGR (%), CAGR (%)) (V-Shaped Recovery Scenario)
Table 4 Global Small Scale Liquefied Natural Gas (SSLNG) Market Forecast, 2023-2033 (US$ Bn, AGR (%), CAGR (%)) (W-Shaped Recovery Scenario)
Table 5 Global Small Scale Liquefied Natural Gas (SSLNG) Market by Region, 2023-2033 (US$ Bn, AGR (%), CAGR (%)) (W-Shaped Recovery Scenario)
Table 6 Global Small Scale Liquefied Natural Gas (SSLNG) Market Forecast, 2023-2033 (US$ Bn, AGR (%), CAGR (%)) (U-Shaped Recovery Scenario)
Table 7 Global Small Scale Liquefied Natural Gas (SSLNG) Market by Region, 2023-2033 (US$ Bn, AGR (%), CAGR (%)) (U-Shaped Recovery Scenario)
Table 8 Global Small Scale Liquefied Natural Gas (SSLNG) Market Forecast, 2023-2033 (US$ Bn, AGR (%), CAGR (%)) (L-Shaped Recovery Scenario)
Table 9 Global Small Scale Liquefied Natural Gas (SSLNG) Market by Region, 2023-2033 (US$ Bn, AGR (%), CAGR (%)) (L-Shaped Recovery Scenario)
Table 10 Global Small Scale Liquefied Natural Gas (SSLNG) Market Forecast, 2023-2033 (US$ Bn, AGR (%), CAGR (%))
Table 11 Global Small Scale Liquefied Natural Gas (SSLNG) Market by Region, 2023-2033 (US$ Bn, AGR (%), CAGR (%))
Table 12 Global Small Scale Liquefied Natural Gas (SSLNG) Market by Plant Process, 2023-2033 (US$ Bn, AGR (%), CAGR (%))
Table 13 Global Small Scale Liquefied Natural Gas (SSLNG) Market by Transport, 2023-2033 (US$ Bn, AGR (%), CAGR (%))
Table 14 Global Small Scale Liquefied Natural Gas (SSLNG) Market by Value Chain, 2023-2033 (US$ Bn, AGR (%), CAGR (%))
Table 15 Global Small Scale Liquefied Natural Gas (SSLNG) Market by Re-Gasification, 2023-2033 (US$ Bn, AGR (%), CAGR (%))
Table 16 Global Small Scale Liquefied Natural Gas (SSLNG) Market by Storage, 2023-2033 (US$ Bn, AGR (%), CAGR (%))
Table 17 Global Small Scale Liquefied Natural Gas (SSLNG) Market by Plant Process, 2023-2033 (US$ Bn, AGR (%), CAGR (%))
Table 18 Global Small Scale Liquefied Natural Gas (SSLNG) Market by Gas Treatment, 2023-2033 (US$ Bn, AGR (%), CAGR (%))
Table 19 Global Gas Treatment Market by Region, 2023-2033 (US$ Bn, AGR (%), CAGR (%))
Table 20 Global H2S/CO2 Removal Market Forecast, 2023-2033 (US$ Bn, AGR (%), CAGR (%))
Table 21 Global H2S/CO2 Removal Market by Region, 2023-2033 (US$ Bn, AGR (%), CAGR (%))
Table 22 Global Dehydration Market Forecast, 2023-2033 (US$ Bn, AGR (%), CAGR (%))
Table 23 Global Dehydration Market by Region, 2023-2033 (US$ Bn, AGR (%), CAGR (%))
Table 24 Global Heavy Component Removal Market Forecast, 2023-2033 (US$ Bn, AGR (%), CAGR (%))
Table 25 Global Heavy Component Removal Market by Region, 2023-2033 (US$ Bn, AGR (%), CAGR (%))
Table 26 Global LNG Liquefaction Market Forecast, 2023-2033 (US$ Bn, AGR (%), CAGR (%))
Table 27 Global LNG Liquefaction Market by Region, 2023-2033 (US$ Bn, AGR (%), CAGR (%))
Table 28 Global Other Plant Process Market Forecast, 2023-2033 (US$ Bn, AGR (%), CAGR (%))
Table 29 Global Other Plant Process Market by Region, 2023-2033 (US$ Bn, AGR (%), CAGR (%))
Table 30 Global Small Scale Liquefied Natural Gas (SSLNG) Market by Transport, 2023-2033 (US$ Bn, AGR (%), CAGR (%))
Table 31 Global Small LNG Carriers Market Forecast, 2023-2033 (US$ Bn, AGR (%), CAGR (%))
Table 32 Global Small LNG Carriers Market by Region, 2023-2033 (US$ Bn, AGR (%), CAGR (%))
Table 33 Global Small LNG Trucks Market Forecast, 2023-2033 (US$ Bn, AGR (%), CAGR (%))
Table 34 Global Small LNG Trucks Market by Region, 2023-2033 (US$ Bn, AGR (%), CAGR (%))
Table 35 Global Other SSLNG Transport Market Forecast, 2023-2033 (US$ Bn, AGR (%), CAGR (%))
Table 36 Global Other SSLNG Transport Market by Region, 2023-2033 (US$ Bn, AGR (%), CAGR (%))
Table 37 Global Small Scale Liquefied Natural Gas (SSLNG) Market by Value Chain, 2023-2033 (US$ Bn, AGR (%), CAGR (%))
Table 38 Global SSLNG Liquefaction Plant Market Forecast, 2023-2033 (US$ Bn, AGR (%), CAGR (%))
Table 39 Global SSLNG Liquefaction Plant Market by Region, 2023-2033 (US$ Bn, AGR (%), CAGR (%))
Table 40 Global SSLNG Storage Market Forecast, 2023-2033 (US$ Bn, AGR (%), CAGR (%))
Table 41 Global SSLNG Storage Market by Region, 2023-2033 (US$ Bn, AGR (%), CAGR (%))
Table 42 Global SSLNG Transport Market Forecast, 2023-2033 (US$ Bn, AGR (%), CAGR (%))
Table 43 Global SSLNG Transport Market by Region, 2023-2033 (US$ Bn, AGR (%), CAGR (%))
Table 44 Global SSLNG Re-gasification Market Forecast, 2023-2033 (US$ Bn, AGR (%), CAGR (%))
Table 45 Global SSLNG Re-gasification Market by Region, 2023-2033 (US$ Bn, AGR (%), CAGR (%))
Table 46 Global Small Scale Liquefied Natural Gas (SSLNG) Market by Re-Gasification, 2023-2033 (US$ Bn, AGR (%), CAGR (%))
Table 47 Global Ambient Air Vaporisers (AAV) Market Forecast, 2023-2033 (US$ Bn, AGR (%), CAGR (%))
Table 48 Global Ambient Air Vaporisers (AAV) Market by Region, 2023-2033 (US$ Bn, AGR (%), CAGR (%))
Table 49 Global Odorization, Send-out, and Delivery Market Forecast, 2023-2033 (US$ Bn, AGR (%), CAGR (%))
Table 50 Global Odorization, Send-out, and Delivery Market by Region, 2023-2033 (US$ Bn, AGR (%), CAGR (%))
Table 51 Global Open Rack Vaporizers (ORV) Market Forecast, 2023-2033 (US$ Bn, AGR (%), CAGR (%))
Table 52 Global Open Rack Vaporizers (ORV) Market by Region, 2023-2033 (US$ Bn, AGR (%), CAGR (%))
Table 53 Global Submerged Combustion Vaporisers (SCV) Market Forecast, 2023-2033 (US$ Bn, AGR (%), CAGR (%))
Table 54 Global Submerged Combustion Vaporisers (SCV) Market by Region, 2023-2033 (US$ Bn, AGR (%), CAGR (%))
Table 55 Global Other Re-Gasification Market Forecast, 2023-2033 (US$ Bn, AGR (%), CAGR (%))
Table 56 Global Other Re-Gasification Market by Region, 2023-2033 (US$ Bn, AGR (%), CAGR (%))
Table 57 Global Small Scale Liquefied Natural Gas (SSLNG) Market by Storage, 2023-2033 (US$ Bn, AGR (%), CAGR (%))
Table 58 Global Single Containment Tanks Market Forecast, 2023-2033 (US$ Bn, AGR (%), CAGR (%))
Table 59 Global Single Containment Tanks Market by Region, 2023-2033 (US$ Bn, AGR (%), CAGR (%))
Table 60 Global Double Containment Tanks Market Forecast, 2023-2033 (US$ Bn, AGR (%), CAGR (%))
Table 61 Global Double Containment Tanks Market by Region, 2023-2033 (US$ Bn, AGR (%), CAGR (%))
Table 62 Global Full Containment Tanks Market Forecast, 2023-2033 (US$ Bn, AGR (%), CAGR (%))
Table 63 Global Full Containment Tanks Market by Region, 2023-2033 (US$ Bn, AGR (%), CAGR (%))
Table 64 Global Pressurized Small Tanks Market Forecast, 2023-2033 (US$ Bn, AGR (%), CAGR (%))
Table 65 Global Pressurized Small Tanks Market by Region, 2023-2033 (US$ Bn, AGR (%), CAGR (%))
Table 66 Global Membrane Tanks Market Forecast, 2023-2033 (US$ Bn, AGR (%), CAGR (%))
Table 67 Global Membrane Tanks Market by Region, 2023-2033 (US$ Bn, AGR (%), CAGR (%))
Table 68 Global In-ground Tanks Market Forecast, 2023-2033 (US$ Bn, AGR (%), CAGR (%))
Table 69 Global In-ground Tanks Market by Region, 2023-2033 (US$ Bn, AGR (%), CAGR (%))
Table 70 Global Small Scale Liquefied Natural Gas (SSLNG) Market by Region, 2023-2033 (US$ Bn, AGR (%), CAGR (%))
Table 71 North America Small Scale Liquefied Natural Gas (SSLNG) Market by Value, 2023-2033 (US$ Bn, AGR (%), CAGR (%))
Table 72 North America Small Scale Liquefied Natural Gas (SSLNG) Market by Country, 2023-2033 (US$ Bn, AGR (%), CAGR (%))
Table 73 North America Small Scale Liquefied Natural Gas (SSLNG) Market by Plant Process, 2023-2033 (US$ Bn, AGR (%), CAGR (%))
Table 74 North America Small Scale Liquefied Natural Gas (SSLNG) Market by Transport, 2023-2033 (US$ Bn, AGR (%), CAGR (%))
Table 75 North America Small Scale Liquefied Natural Gas (SSLNG) Market by Value Chain, 2023-2033 (US$ Bn, AGR (%), CAGR (%))
Table 76 North America Small Scale Liquefied Natural Gas (SSLNG) Market by Re-Gasification, 2023-2033 (US$ Bn, AGR (%), CAGR (%))
Table 77 North America Small Scale Liquefied Natural Gas (SSLNG) Market by Storage, 2023-2033 (US$ Bn, AGR (%), CAGR (%))
Table 78 US Small Scale Liquefied Natural Gas (SSLNG) Market by Value, 2023-2033 (US$ Bn, AGR (%), CAGR (%))
Table 79 Canada Small Scale Liquefied Natural Gas (SSLNG) Market by Value, 2023-2033 (US$ Bn, AGR (%), CAGR (%))
Table 80 Europe Small Scale Liquefied Natural Gas (SSLNG) Market by Value, 2023-2033 (US$ Bn, AGR (%), CAGR (%))
Table 81 Europe Small Scale Liquefied Natural Gas (SSLNG) Market by Country, 2023-2033 (US$ Bn, AGR (%), CAGR (%))
Table 82 Europe Small Scale Liquefied Natural Gas (SSLNG) Market by Plant Process, 2023-2033 (US$ Bn, AGR (%), CAGR (%))
Table 83 Europe Small Scale Liquefied Natural Gas (SSLNG) Market by Transport, 2023-2033 (US$ Bn, AGR (%), CAGR (%))
Table 84 Europe Small Scale Liquefied Natural Gas (SSLNG) Market by Value Chain, 2023-2033 (US$ Bn, AGR (%), CAGR (%))
Table 85 Europe Small Scale Liquefied Natural Gas (SSLNG) Market by Re-Gasification, 2023-2033 (US$ Bn, AGR (%), CAGR (%))
Table 86 Europe Small Scale Liquefied Natural Gas (SSLNG) Market by Storage, 2023-2033 (US$ Bn, AGR (%), CAGR (%))
Table 87 Russia Small Scale Liquefied Natural Gas (SSLNG) Market by Value, 2023-2033 (US$ Bn, AGR (%), CAGR (%))
Table 88 Spain Small Scale Liquefied Natural Gas (SSLNG) Market by Value, 2023-2033 (US$ Bn, AGR (%), CAGR (%))
Table 89 Portugal Small Scale Liquefied Natural Gas (SSLNG) Market by Value, 2023-2033 (US$ Bn, AGR (%), CAGR (%))
Table 90 France Small Scale Liquefied Natural Gas (SSLNG) Market by Value, 2023-2033 (US$ Bn, AGR (%), CAGR (%))
Table 91 Belgium Small Scale Liquefied Natural Gas (SSLNG) Market by Value, 2023-2033 (US$ Bn, AGR (%), CAGR (%))
Table 92 Rest of Europe Small Scale Liquefied Natural Gas (SSLNG) Market by Value, 2023-2033 (US$ Bn, AGR (%), CAGR (%))
Table 93 Asia-Pacific Small Scale Liquefied Natural Gas (SSLNG) Market by Value, 2023-2033 (US$ Bn, AGR (%), CAGR (%))
Table 94 Asia-Pacific Small Scale Liquefied Natural Gas (SSLNG) Market by Country, 2023-2033 (US$ Bn, AGR (%), CAGR (%))
Table 95 Asia-Pacific Small Scale Liquefied Natural Gas (SSLNG) Market by Plant Process, 2023-2033 (US$ Bn, AGR (%), CAGR (%))
Table 96 Asia-Pacific Small Scale Liquefied Natural Gas (SSLNG) Market by Transport, 2023-2033 (US$ Bn, AGR (%), CAGR (%))
Table 97 Asia-Pacific Small Scale Liquefied Natural Gas (SSLNG) Market by Value Chain, 2023-2033 (US$ Bn, AGR (%), CAGR (%))
Table 98 Asia-Pacific Small Scale Liquefied Natural Gas (SSLNG) Market by Re-Gasification, 2023-2033 (US$ Bn, AGR (%), CAGR (%))
Table 99 Asia-Pacific Small Scale Liquefied Natural Gas (SSLNG) Market by Storage, 2023-2033 (US$ Bn, AGR (%), CAGR (%))
Table 100 China Small Scale Liquefied Natural Gas (SSLNG) Market by Value, 2023-2033 (US$ Bn, AGR (%), CAGR (%))
Table 101 India Small Scale Liquefied Natural Gas (SSLNG) Market by Value, 2023-2033 (US$ Bn, AGR (%), CAGR (%))
Table 102 Japan Small Scale Liquefied Natural Gas (SSLNG) Market by Value, 2023-2033 (US$ Bn, AGR (%), CAGR (%))
Table 103 Indonesia Small Scale Liquefied Natural Gas (SSLNG) Market by Value, 2023-2033 (US$ Bn, AGR (%), CAGR (%))
Table 104 Malaysia Small Scale Liquefied Natural Gas (SSLNG) Market by Value, 2023-2033 (US$ Bn, AGR (%), CAGR (%))
Table 105 Rest of Asia-Pacific Small Scale Liquefied Natural Gas (SSLNG) Market by Value, 2023-2033 (US$ Bn, AGR (%), CAGR (%))
Table 106 Middle East & Africa Small Scale Liquefied Natural Gas (SSLNG) Market by Value, 2023-2033 (US$ Bn, AGR (%), CAGR (%))
Table 107 Middle East & Africa Small Scale Liquefied Natural Gas (SSLNG) Market by Country, 2023-2033 (US$ Bn, AGR (%), CAGR (%))
Table 108 Middle East & Africa Small Scale Liquefied Natural Gas (SSLNG) Market by Plant Process, 2023-2033 (US$ Bn, AGR (%), CAGR (%))
Table 109 Middle East & Africa Small Scale Liquefied Natural Gas (SSLNG) Market by Transport, 2023-2033 (US$ Bn, AGR (%), CAGR (%))
Table 110 Middle East & Africa Small Scale Liquefied Natural Gas (SSLNG) Market by Value Chain, 2023-2033 (US$ Bn, AGR (%), CAGR (%))
Table 111 Middle East & Africa Small Scale Liquefied Natural Gas (SSLNG) Market by Re-Gasification, 2023-2033 (US$ Bn, AGR (%), CAGR (%))
Table 112 Middle East & Africa Small Scale Liquefied Natural Gas (SSLNG) Market by Storage, 2023-2033 (US$ Bn, AGR (%), CAGR (%))
Table 113 GCC Small Scale Liquefied Natural Gas (SSLNG) Market by Value, 2023-2033 (US$ Bn, AGR (%), CAGR (%))
Table 114 South Africa Small Scale Liquefied Natural Gas (SSLNG) Market by Value, 2023-2033 (US$ Bn, AGR (%), CAGR (%))
Table 115 Rest of Middle East & Africa Small Scale Liquefied Natural Gas (SSLNG) Market by Value, 2023-2033 (US$ Bn, AGR (%), CAGR (%))
Table 116 Latin America Small Scale Liquefied Natural Gas (SSLNG) Market by Value, 2023-2033 (US$ Bn, AGR (%), CAGR (%))
Table 117 Latin America Small Scale Liquefied Natural Gas (SSLNG) Market by Country, 2023-2033 (US$ Bn, AGR (%), CAGR (%))
Table 118 Latin America Small Scale Liquefied Natural Gas (SSLNG) Market by Plant Process, 2023-2033 (US$ Bn, AGR (%), CAGR (%))
Table 119 Latin America Small Scale Liquefied Natural Gas (SSLNG) Market by Transport, 2023-2033 (US$ Bn, AGR (%), CAGR (%))
Table 120 Latin America Small Scale Liquefied Natural Gas (SSLNG) Market by Value Chain, 2023-2033 (US$ Bn, AGR (%), CAGR (%))
Table 121 Latin America Small Scale Liquefied Natural Gas (SSLNG) Market by Re-Gasification, 2023-2033 (US$ Bn, AGR (%), CAGR (%))
Table 122 Latin America Small Scale Liquefied Natural Gas (SSLNG) Market by Storage, 2023-2033 (US$ Bn, AGR (%), CAGR (%))
Table 123 Brazil Small Scale Liquefied Natural Gas (SSLNG) Market by Value, 2023-2033 (US$ Bn, AGR (%), CAGR (%))
Table 124 Mexico Small Scale Liquefied Natural Gas (SSLNG) Market by Value, 2023-2033 (US$ Bn, AGR (%), CAGR (%))
Table 125 Rest of Latin America Small Scale Liquefied Natural Gas (SSLNG) Market by Value, 2023-2033 (US$ Bn, AGR (%), CAGR (%))
Table 126 Acquisitions as Key Business Strategy
Table 127 Acquisitions as Key Business Strategy
Table 128 Acquisitions as Key Business Strategy
Table 129 Acquisitions as Key Business Strategy
Table 130 Acquisitions as Key Business Strategy
Table 131 Acquisitions as Key Business Strategy
Table 132 Buffalo Marine Service INC: Key Details, (CEO, HQ, Revenue, Founded, No. of Employees, Company Type, Website, Business Segment)
Table 133 Buffalo Marine Service INC: Product Benchmarking
Table 134 Gasum Oy: Key Details, (CEO, HQ, Revenue, Founded, No. of Employees, Company Type, Website, Business Segment)
Table 135 Gasum Oy: Product Benchmarking
Table 136 Gasum Oy: Strategic Outlook
Table 137 Gazprom ltd: Key Details, (CEO, HQ, Revenue, Founded, No. of Employees, Company Type, Website, Business Segment)
Table 138 Gazprom ltd: Product Benchmarking
Table 139 Gazprom ltd: Strategic Outlook
Table 140 ENN Energy Holdings Ltd: Key Details, (CEO, HQ, Revenue, Founded, No. of Employees, Company Type, Website, Business Segment)
Table 141 ENN Energy Holdings Ltd: Strategic Outlook
Table 142 China Petroleum & Chemical Corporation. (SINOPEC): Key Details, (CEO, HQ, Revenue, Founded, No. of Employees, Company Type, Website, Business Segment)
Table 143 China Petroleum & Chemical Corporation (SINOPEC): Product Benchmarking
Table 144 China Petroleum & Chemical Corporation. (SINOPEC): Strategic Outlook
Table 145 Ovintiv Inc.: Key Details, (CEO, HQ, Revenue, Founded, No. of Employees, Company Type, Website, Business Segment)
Table 146 Ovintiv Inc.: Product Benchmarking
Table 147 Ovintiv Inc.: Strategic Outlook
Table 148 Equinor ASA: Key Details, (CEO, HQ, Revenue, Founded, No. of Employees, Company Type, Website, Business Segment)
Table 149 Equinor ASA: Product Benchmarking
Table 150 Equinor ASA: Strategic Outlook
Table 151 Ferus Inc: Key Details, (CEO, HQ, Revenue, Founded, No. of Employees, Company Type, Website, Business Segment)
Table 152 Ferus Inc: Product Benchmarking
Table 153 Ferus Inc: Strategic Outlook
Table 154 Flint Hills Resources LLC: Key Details, (CEO, HQ, Revenue, Founded, No. of Employees, Company Type, Website, Business Segment)
Table 155 Flint Hills Resources LLC: Product Benchmarking
Table 156 Hokkaido gas co., ltd: Key Details, (CEO, HQ, Revenue, Founded, No. of Employees, Company Type, Website, Business Segment)
Table 157 Hokkaido gas co., ltd: Strategic Outlook
Table 158 Japan Petroleum Exploration Co., Ltd: Key Details, (CEO, HQ, Revenue, Founded, No. of Employees, Company Type, Website, Business Segment)
Table 159 Japan Petroleum Exploration Co., Ltd: Product Benchmarking
Table 160 Japan Petroleum Exploration Co., Ltd: Strategic Outlook
Table 161 Nippon Gas Co., Ltd: Key Details, (CEO, HQ, Revenue, Founded, No. of Employees, Company Type, Website, Business Segment)
Table 162 Nippon Gas Co., Ltd: Product Benchmarking
Table 163 Petronas Dagangan Berhad: Key Details, (CEO, HQ, Revenue, Founded, No. of Employees, Company Type, Website, Business Segment)
Table 164 Petronas Dagangan Berhad: Product Benchmarking
Table 165 Petronas Dagangan Berhad: Strategic Outlook
Table 166 Polish Oil and Gas Company: Key Details, (CEO, HQ, Revenue, Founded, No. of Employees, Company Type, Website, Business Segment)
Table 167 Polish Oil and Gas Company: Product Benchmarking
Table 168 Polish Oil and Gas Company: Strategic Outlook
Table 169 Royal Dutch Shell Plc: Key Details, (CEO, HQ, Revenue, Founded, No. of Employees, Company Type, Website, Business Segment)
Table 170 Royal Dutch Shell Plc: Product Benchmarking
Table 171 Royal Dutch Shell Plc: Strategic Outlook
List of Figures
Figure 1 Small Scale LNG Market Segmentation
Figure 2 Global Small Scale Liquefied Natural Gas (SSLNG) Market by Region: Market Attractiveness Index
Figure 3 Global Small Scale Liquefied Natural Gas (SSLNG) Market by Plant Process: Market Attractiveness Index
Figure 4 Global Small Scale Liquefied Natural Gas (SSLNG) Market by Transport: Market Attractiveness Index
Figure 5 Global Small Scale Liquefied Natural Gas (SSLNG) Market by Value Chain: Market Attractiveness Index
Figure 6 Global Small Scale Liquefied Natural Gas (SSLNG) Market by Re-Gasification: Market Attractiveness Index
Figure 7 Global Small Scale Liquefied Natural Gas (SSLNG) Market by Storage: Market Attractiveness Index
Figure 8 SSLNG Value Chain
Figure 9 Small Scale LNG Market: Market Dynamics
Figure 10 Global Small Scale Liquefied Natural Gas (SSLNG) Market Share Forecast by COVID, 2023-2033 (%)
Figure 11 Global Small Scale Liquefied Natural Gas (SSLNG) Market Forecast, 2023-2033 (US$ Bn, AGR (%)) (V-Shaped Recovery Scenario)
Figure 12 Global Small Scale Liquefied Natural Gas (SSLNG) Market by Region, 2023-2033 (US$ Bn, AGR (%)) (V-Shaped Recovery Scenario)
Figure 13 Global Small Scale Liquefied Natural Gas (SSLNG) Market Forecast, 2023-2033 (US$ Bn, AGR (%)) (W-Shaped Recovery Scenario)
Figure 14 Global Small Scale Liquefied Natural Gas (SSLNG) Market by Region, 2023-2033 (US$ Bn, AGR (%)) (W-Shaped Recovery Scenario)
Figure 15 Global Small Scale Liquefied Natural Gas (SSLNG) Market Forecast, 2023-2033 (US$ Bn, AGR (%)) (U-Shaped Recovery Scenario)
Figure 16 Global Small Scale Liquefied Natural Gas (SSLNG) Market by Region, 2023-2033 (US$ Bn, AGR (%)) (U-Shaped Recovery Scenario)
Figure 17 Global Small Scale Liquefied Natural Gas (SSLNG) Market Forecast, 2023-2033 (US$ Bn, AGR (%)) (L-Shaped Recovery Scenario)
Figure 18 Global Small Scale Liquefied Natural Gas (SSLNG) Market by Region, 2023-2033 (US$ Bn, AGR (%)) (L-Shaped Recovery Scenario)
Figure 19 Small Scale LNG Market: Porter’s Five Forces Analysis
Figure 20 Small Scale LNG Market: PEST Analysis
Figure 21 Global Small Scale Liquefied Natural Gas (SSLNG) Market Forecast, 2023-2033 (US$ Bn, AGR (%))
Figure 22 Global Small Scale Liquefied Natural Gas (SSLNG) Market by Region, 2023-2033 (US$ Bn, AGR (%))
Figure 23 Global Small Scale Liquefied Natural Gas (SSLNG) Market by Plant Process, 2023-2033 (US$ Bn, AGR (%))
Figure 24 Global Small Scale Liquefied Natural Gas (SSLNG) Market by Transport, 2023-2033 (US$ Bn, AGR (%))
Figure 25 Global Small Scale Liquefied Natural Gas (SSLNG) Market by Value Chain, 2023-2033 (US$ Bn, AGR (%))
Figure 26 Global Small Scale Liquefied Natural Gas (SSLNG) Market by Re-Gasification, 2023-2033 (US$ Bn, AGR (%))
Figure 27 Global Small Scale Liquefied Natural Gas (SSLNG) Market by Storage, 2023-2033 (US$ Bn, AGR (%))
Figure 28 Global Small Scale Liquefied Natural Gas (SSLNG) Market by Plant Process: Market Attractiveness Index
Figure 29 Global Small Scale Liquefied Natural Gas (SSLNG) Market Share Forecast by Plant Process, 2023-2033 (%)
Figure 30 Global Small Scale Liquefied Natural Gas (SSLNG) Market by Plant Process, 2023-2033 (US$ Bn, AGR (%))
Figure 31 Global Small Scale Liquefied Natural Gas (SSLNG) Market Share Forecast by Plant Process, 2023-2033 (%)
Figure 32 Global Small Scale Liquefied Natural Gas (SSLNG) Market by Gas Treatment, 2023-2033 (US$ Bn, AGR (%))
Figure 33 Global Gas Treatment Market by Region, 2023-2033 (US$ Bn, AGR (%))
Figure 34 Global H2S/CO2 Removal Market Forecast, 2023-2033 (US$ Bn, AGR (%))
Figure 35 Global H2S/CO2 Removal Market by Region, 2023-2033 (US$ Bn, AGR (%))
Figure 36 Global Dehydration Market Forecast, 2023-2033 (US$ Bn, AGR (%))
Figure 37 Global Dehydration Market by Region, 2023-2033 (US$ Bn, AGR (%))
Figure 38 Global Heavy Component Removal Market Forecast, 2023-2033 (US$ Bn, AGR (%))
Figure 39 Global Heavy Component Removal Market by Region, 2023-2033 (US$ Bn, AGR (%))
Figure 40 Global LNG Liquefaction Market Forecast, 2023-2033 (US$ Bn, AGR (%))
Figure 41 Global LNG Liquefaction Market by Region, 2023-2033 (US$ Bn, AGR (%))
Figure 42 Global Other Plant Process Market Forecast, 2023-2033 (US$ Bn, AGR (%))
Figure 43 Global Other Plant Process Market by Region, 2023-2033 (US$ Bn, AGR (%))
Figure 44 Global Small Scale Liquefied Natural Gas (SSLNG) Market by Transport: Market Attractiveness Index
Figure 45 Global Small Scale Liquefied Natural Gas (SSLNG) Market Share Forecast by Transport, 2023-2033 (%)
Figure 46 Global Small Scale Liquefied Natural Gas (SSLNG) Market by Transport, 2023-2033 (US$ Bn, AGR (%))
Figure 47 Global Small Scale Liquefied Natural Gas (SSLNG) Market Share Forecast by Transport, 2023-2033 (%)
Figure 48 Global Small LNG Carriers Market Forecast, 2023-2033 (US$ Bn, AGR (%))
Figure 49 Global Small LNG Carriers Market by Region, 2023-2033 (US$ Bn, AGR (%))
Figure 50 Global Small LNG Trucks Market Forecast, 2023-2033 (US$ Bn, AGR (%))
Figure 51 Global Small LNG Trucks Market by Region, 2023-2033 (US$ Bn, AGR (%))
Figure 52 Global Other SSLNG Transport Market Forecast, 2023-2033 (US$ Bn, AGR (%))
Figure 53 Global Other SSLNG Transport Market by Region, 2023-2033 (US$ Bn, AGR (%))
Figure 54 Global Small Scale Liquefied Natural Gas (SSLNG) Market by Value Chain: Market Attractiveness Index
Figure 55 Global Small Scale Liquefied Natural Gas (SSLNG) Market Share Forecast by Value Chain, 2023-2033 (%)
Figure 56 Global Small Scale Liquefied Natural Gas (SSLNG) Market by Value Chain, 2023-2033 (US$ Bn, AGR (%))
Figure 57 Global Small Scale Liquefied Natural Gas (SSLNG) Market Share Forecast by Value Chain, 2023-2033 (%)
Figure 58 Global SSLNG Liquefaction Plant Market Forecast, 2023-2033 (US$ Bn, AGR (%))
Figure 59 Global SSLNG Liquefaction Plant Market by Region, 2023-2033 (US$ Bn, AGR (%))
Figure 60 Global SSLNG Storage Market Forecast, 2023-2033 (US$ Bn, AGR (%))
Figure 61 Global SSLNG Storage Market by Region, 2023-2033 (US$ Bn, AGR (%))
Figure 62 Global SSLNG Transport Market Forecast, 2023-2033 (US$ Bn, AGR (%))
Figure 63 Global SSLNG Transport Market by Region, 2023-2033 (US$ Bn, AGR (%))
Figure 64 Global SSLNG Re-gasification Market Forecast, 2023-2033 (US$ Bn, AGR (%))
Figure 65 Global SSLNG Re-gasification Market by Region, 2023-2033 (US$ Bn, AGR (%))
Figure 66 Global Small Scale Liquefied Natural Gas (SSLNG) Market by Re-Gasification: Market Attractiveness Index
Figure 67 Global Small Scale Liquefied Natural Gas (SSLNG) Market Share Forecast by Re-Gasification, 2023-2033 (%)
Figure 68 Global Small Scale Liquefied Natural Gas (SSLNG) Market by Re-Gasification, 2023-2033 (US$ Bn, AGR (%))
Figure 69 Global Small Scale Liquefied Natural Gas (SSLNG) Market Share Forecast by Re-Gasification, 2023-2033 (%)
Figure 70 Global Ambient Air Vaporisers (AAV) Market Forecast, 2023-2033 (US$ Bn, AGR (%))
Figure 71 Global Ambient Air Vaporisers (AAV) Market by Region, 2023-2033 (US$ Bn, AGR (%))
Figure 72 Global Odorization, Send-out, and Delivery Market Forecast, 2023-2033 (US$ Bn, AGR (%))
Figure 73 Global Odorization, Send-out, and Delivery Market by Region, 2023-2033 (US$ Bn, AGR (%))
Figure 74 Global Open Rack Vaporizers (ORV) Market Forecast, 2023-2033 (US$ Bn, AGR (%))
Figure 75 Global Open Rack Vaporizers (ORV) Market by Region, 2023-2033 (US$ Bn, AGR (%))
Figure 76 Global Submerged Combustion Vaporisers (SCV) Market Forecast, 2023-2033 (US$ Bn, AGR (%))
Figure 77 Global Submerged Combustion Vaporisers (SCV) Market by Region, 2023-2033 (US$ Bn, AGR (%))
Figure 78 Global Other Re-Gasification Market Forecast, 2023-2033 (US$ Bn, AGR (%))
Figure 79 Global Other Re-Gasification Market by Region, 2023-2033 (US$ Bn, AGR (%))
Figure 80 Global Small Scale Liquefied Natural Gas (SSLNG) Market by Storage: Market Attractiveness Index
Figure 81 Global Small Scale Liquefied Natural Gas (SSLNG) Market Share Forecast by Storage, 2023-2033 (%)
Figure 82 Global Small Scale Liquefied Natural Gas (SSLNG) Market by Storage, 2023-2033 (US$ Bn, AGR (%))
Figure 83 Global Small Scale Liquefied Natural Gas (SSLNG) Market Share Forecast by Storage, 2023-2033 (%)
Figure 84 Global Single Containment Tanks Market Forecast, 2023-2033 (US$ Bn, AGR (%))
Figure 85 Global Single Containment Tanks Market by Region, 2023-2033 (US$ Bn, AGR (%))
Figure 86 Global Double Containment Tanks Market Forecast, 2023-2033 (US$ Bn, AGR (%))
Figure 87 Global Double Containment Tanks Market by Region, 2023-2033 (US$ Bn, AGR (%))
Figure 88 Global Full Containment Tanks Market Forecast, 2023-2033 (US$ Bn, AGR (%))
Figure 89 Global Full Containment Tanks Market by Region, 2023-2033 (US$ Bn, AGR (%))
Figure 90 Global Pressurized Small Tanks Market Forecast, 2023-2033 (US$ Bn, AGR (%))
Figure 91 Global Pressurized Small Tanks Market by Region, 2023-2033 (US$ Bn, AGR (%))
Figure 92 Global Membrane Tanks Market Forecast, 2023-2033 (US$ Bn, AGR (%))
Figure 93 Global Membrane Tanks Market by Region, 2023-2033 (US$ Bn, AGR (%))
Figure 94 Global In-ground Tanks Market Forecast, 2023-2033 (US$ Bn, AGR (%))
Figure 95 Global In-ground Tanks Market by Region, 2023-2033 (US$ Bn, AGR (%))
Figure 96 Small Scale LNG Market Forecast by Region 2022, 2027, 2032 (Revenue, CAGR%)
Figure 97 Global Small Scale Liquefied Natural Gas (SSLNG) Market by Region, 2023-2033 (US$ Bn, AGR (%))
Figure 98 North America Small Scale Liquefied Natural Gas (SSLNG) Market by North America: Market Attractiveness Index
Figure 99 North America Small Scale Liquefied Natural Gas (SSLNG) Market by Value, 2023-2033 (US$ Bn, AGR (%))
Figure 100 North America Small Scale Liquefied Natural Gas (SSLNG) Market by Country, 2023-2033 (US$ Bn, AGR (%))
Figure 101 North America Small Scale Liquefied Natural Gas (SSLNG) Market Share Forecast by Country, 2023-2033 (%)
Figure 102 North America Small Scale Liquefied Natural Gas (SSLNG) Market by Plant Process, 2023-2033 (US$ Bn, AGR (%))
Figure 103 North America Small Scale Liquefied Natural Gas (SSLNG) Market Share Forecast by Plant Process, 2023-2033 (%)
Figure 104 North America Small Scale Liquefied Natural Gas (SSLNG) Market by Transport, 2023-2033 (US$ Bn, AGR (%))
Figure 105 North America Small Scale Liquefied Natural Gas (SSLNG) Market Share Forecast by Transport, 2023-2033 (%)
Figure 106 North America Small Scale Liquefied Natural Gas (SSLNG) Market by Value Chain, 2023-2033 (US$ Bn, AGR (%))
Figure 107 North America Small Scale Liquefied Natural Gas (SSLNG) Market Share Forecast by Value Chain, 2023-2033 (%)
Figure 108 North America Small Scale Liquefied Natural Gas (SSLNG) Market by Re-Gasification, 2023-2033 (US$ Bn, AGR (%))
Figure 109 North America Small Scale Liquefied Natural Gas (SSLNG) Market Share Forecast by Re-Gasification, 2023-2033 (%)
Figure 110 North America Small Scale Liquefied Natural Gas (SSLNG) Market by Storage, 2023-2033 (US$ Bn, AGR (%))
Figure 111 North America Small Scale Liquefied Natural Gas (SSLNG) Market Share Forecast by Storage, 2023-2033 (%)
Figure 112 US Small Scale Liquefied Natural Gas (SSLNG) Market by Value, 2023-2033 (US$ Bn, AGR (%))
Figure 113 Canada Small Scale Liquefied Natural Gas (SSLNG) Market by Value, 2023-2033 (US$ Bn, AGR (%))
Figure 114 Europe Small Scale Liquefied Natural Gas (SSLNG) Market by Europe: Market Attractiveness Index
Figure 115 Europe Small Scale Liquefied Natural Gas (SSLNG) Market by Value, 2023-2033 (US$ Bn, AGR (%))
Figure 116 Europe Small Scale Liquefied Natural Gas (SSLNG) Market by Country, 2023-2033 (US$ Bn, AGR (%))
Figure 117 Europe Small Scale Liquefied Natural Gas (SSLNG) Market Share Forecast by Country, 2023-2033 (%)
Figure 118 Europe Small Scale Liquefied Natural Gas (SSLNG) Market by Plant Process, 2023-2033 (US$ Bn, AGR (%))
Figure 119 Europe Small Scale Liquefied Natural Gas (SSLNG) Market Share Forecast by Plant Process, 2023-2033 (%)
Figure 120 Europe Small Scale Liquefied Natural Gas (SSLNG) Market by Transport, 2023-2033 (US$ Bn, AGR (%))
Figure 121 Europe Small Scale Liquefied Natural Gas (SSLNG) Market Share Forecast by Transport, 2023-2033 (%)
Figure 122 Europe Small Scale Liquefied Natural Gas (SSLNG) Market by Value Chain, 2023-2033 (US$ Bn, AGR (%))
Figure 123 Europe Small Scale Liquefied Natural Gas (SSLNG) Market Share Forecast by Value Chain, 2023-2033 (%)
Figure 124 Europe Small Scale Liquefied Natural Gas (SSLNG) Market by Re-Gasification, 2023-2033 (US$ Bn, AGR (%))
Figure 125 Europe Small Scale Liquefied Natural Gas (SSLNG) Market Share Forecast by Re-Gasification, 2023-2033 (%)
Figure 126 Europe Small Scale Liquefied Natural Gas (SSLNG) Market by Storage, 2023-2033 (US$ Bn, AGR (%))
Figure 127 Europe Small Scale Liquefied Natural Gas (SSLNG) Market Share Forecast by Storage, 2023-2033 (%)
Figure 128 Russia Small Scale Liquefied Natural Gas (SSLNG) Market by Value, 2023-2033 (US$ Bn, AGR (%))
Figure 129 Spain Small Scale Liquefied Natural Gas (SSLNG) Market by Value, 2023-2033 (US$ Bn, AGR (%))
Figure 130 Portugal Small Scale Liquefied Natural Gas (SSLNG) Market by Value, 2023-2033 (US$ Bn, AGR (%))
Figure 131 France Small Scale Liquefied Natural Gas (SSLNG) Market by Value, 2023-2033 (US$ Bn, AGR (%))
Figure 132 Belgium Small Scale Liquefied Natural Gas (SSLNG) Market by Value, 2023-2033 (US$ Bn, AGR (%))
Figure 133 Rest of Europe Small Scale Liquefied Natural Gas (SSLNG) Market by Value, 2023-2033 (US$ Bn, AGR (%))
Figure 134 Asia-Pacific Small Scale Liquefied Natural Gas (SSLNG) Market by Asia-Pacific: Market Attractiveness Index
Figure 135 Asia-Pacific Small Scale Liquefied Natural Gas (SSLNG) Market by Value, 2023-2033 (US$ Bn, AGR (%))
Figure 136 Asia-Pacific Small Scale Liquefied Natural Gas (SSLNG) Market by Country, 2023-2033 (US$ Bn, AGR (%))
Figure 137 Asia-Pacific Small Scale Liquefied Natural Gas (SSLNG) Market Share Forecast by Country, 2023-2033 (%)
Figure 138 Asia-Pacific Small Scale Liquefied Natural Gas (SSLNG) Market by Plant Process, 2023-2033 (US$ Bn, AGR (%))
Figure 139 Asia-Pacific Small Scale Liquefied Natural Gas (SSLNG) Market Share Forecast by Plant Process, 2023-2033 (%)
Figure 140 Asia-Pacific Small Scale Liquefied Natural Gas (SSLNG) Market by Transport, 2023-2033 (US$ Bn, AGR (%))
Figure 141 Asia-Pacific Small Scale Liquefied Natural Gas (SSLNG) Market Share Forecast by Transport, 2023-2033 (%)
Figure 142 Asia-Pacific Small Scale Liquefied Natural Gas (SSLNG) Market by Value Chain, 2023-2033 (US$ Bn, AGR (%))
Figure 143 Asia-Pacific Small Scale Liquefied Natural Gas (SSLNG) Market Share Forecast by Value Chain, 2023-2033 (%)
Figure 144 Asia-Pacific Small Scale Liquefied Natural Gas (SSLNG) Market by Re-Gasification, 2023-2033 (US$ Bn, AGR (%))
Figure 145 Asia-Pacific Small Scale Liquefied Natural Gas (SSLNG) Market Share Forecast by Re-Gasification, 2023-2033 (%)
Figure 146 Asia-Pacific Small Scale Liquefied Natural Gas (SSLNG) Market by Storage, 2023-2033 (US$ Bn, AGR (%))
Figure 147 Asia-Pacific Small Scale Liquefied Natural Gas (SSLNG) Market Share Forecast by Storage, 2023-2033 (%)
Figure 148 China Small Scale Liquefied Natural Gas (SSLNG) Market by Value, 2023-2033 (US$ Bn, AGR (%))
Figure 149 India Small Scale Liquefied Natural Gas (SSLNG) Market by Value, 2023-2033 (US$ Bn, AGR (%))
Figure 150 Japan Small Scale Liquefied Natural Gas (SSLNG) Market by Value, 2023-2033 (US$ Bn, AGR (%))
Figure 151 Indonesia Small Scale Liquefied Natural Gas (SSLNG) Market by Value, 2023-2033 (US$ Bn, AGR (%))
Figure 152 Malaysia Small Scale Liquefied Natural Gas (SSLNG) Market by Value, 2023-2033 (US$ Bn, AGR (%))
Figure 153 Rest of Asia-Pacific Small Scale Liquefied Natural Gas (SSLNG) Market by Value, 2023-2033 (US$ Bn, AGR (%))
Figure 154 Middle East & Africa Small Scale Liquefied Natural Gas (SSLNG) Market by MEA: Market Attractiveness Index
Figure 155 Middle East & Africa Small Scale Liquefied Natural Gas (SSLNG) Market by Value, 2023-2033 (US$ Bn, AGR (%))
Figure 156 Middle East & Africa Small Scale Liquefied Natural Gas (SSLNG) Market by Country, 2023-2033 (US$ Bn, AGR (%))
Figure 157 Middle East & Africa Small Scale Liquefied Natural Gas (SSLNG) Market Share Forecast by Country, 2023-2033 (%)
Figure 158 Middle East & Africa Small Scale Liquefied Natural Gas (SSLNG) Market by Plant Process, 2023-2033 (US$ Bn, AGR (%))
Figure 159 Middle East & Africa Small Scale Liquefied Natural Gas (SSLNG) Market Share Forecast by Plant Process, 2023-2033 (%)
Figure 160 Middle East & Africa Small Scale Liquefied Natural Gas (SSLNG) Market by Transport, 2023-2033 (US$ Bn, AGR (%))
Figure 161 Middle East & Africa Small Scale Liquefied Natural Gas (SSLNG) Market Share Forecast by Transport, 2023-2033 (%)
Figure 162 Middle East & Africa Small Scale Liquefied Natural Gas (SSLNG) Market by Value Chain, 2023-2033 (US$ Bn, AGR (%))
Figure 163 Middle East & Africa Small Scale Liquefied Natural Gas (SSLNG) Market Share Forecast by Value Chain, 2023-2033 (%)
Figure 164 Middle East & Africa Small Scale Liquefied Natural Gas (SSLNG) Market by Re-Gasification, 2023-2033 (US$ Bn, AGR (%))
Figure 165 Middle East & Africa Small Scale Liquefied Natural Gas (SSLNG) Market Share Forecast by Re-Gasification, 2023-2033 (%)
Figure 166 Middle East & Africa Small Scale Liquefied Natural Gas (SSLNG) Market by Storage, 2023-2033 (US$ Bn, AGR (%))
Figure 167 Middle East & Africa Small Scale Liquefied Natural Gas (SSLNG) Market Share Forecast by Storage, 2023-2033 (%)
Figure 168 GCC Small Scale Liquefied Natural Gas (SSLNG) Market by Value, 2023-2033 (US$ Bn, AGR (%))
Figure 169 South Africa Small Scale Liquefied Natural Gas (SSLNG) Market by Value, 2023-2033 (US$ Bn, AGR (%))
Figure 170 Rest of Middle East & Africa Small Scale Liquefied Natural Gas (SSLNG) Market by Value, 2023-2033 (US$ Bn, AGR (%))
Figure 171 Latin America Small Scale Liquefied Natural Gas (SSLNG) Market by Latin America: Market Attractiveness Index
Figure 172 Latin America Small Scale Liquefied Natural Gas (SSLNG) Market by Value, 2023-2033 (US$ Bn, AGR (%))
Figure 173 Latin America Small Scale Liquefied Natural Gas (SSLNG) Market by Country, 2023-2033 (US$ Bn, AGR (%))
Figure 174 Latin America Small Scale Liquefied Natural Gas (SSLNG) Market Share Forecast by Country, 2023-2033 (%)
Figure 175 Latin America Small Scale Liquefied Natural Gas (SSLNG) Market by Plant Process, 2023-2033 (US$ Bn, AGR (%))
Figure 176 Latin America Small Scale Liquefied Natural Gas (SSLNG) Market Share Forecast by Plant Process, 2023-2033 (%)
Figure 177 Latin America Small Scale Liquefied Natural Gas (SSLNG) Market by Transport, 2023-2033 (US$ Bn, AGR (%))
Figure 178 Latin America Small Scale Liquefied Natural Gas (SSLNG) Market Share Forecast by Transport, 2023-2033 (%)
Figure 179 Latin America Small Scale Liquefied Natural Gas (SSLNG) Market by Value Chain, 2023-2033 (US$ Bn, AGR (%))
Figure 180 Latin America Small Scale Liquefied Natural Gas (SSLNG) Market Share Forecast by Value Chain, 2023-2033 (%)
Figure 181 Latin America Small Scale Liquefied Natural Gas (SSLNG) Market by Re-Gasification, 2023-2033 (US$ Bn, AGR (%))
Figure 182 Latin America Small Scale Liquefied Natural Gas (SSLNG) Market Share Forecast by Re-Gasification, 2023-2033 (%)
Figure 183 Latin America Small Scale Liquefied Natural Gas (SSLNG) Market by Storage, 2023-2033 (US$ Bn, AGR (%))
Figure 184 Latin America Small Scale Liquefied Natural Gas (SSLNG) Market Share Forecast by Storage, 2023-2033 (%)
Figure 185 Brazil Small Scale Liquefied Natural Gas (SSLNG) Market by Value, 2023-2033 (US$ Bn, AGR (%))
Figure 186 Mexico Small Scale Liquefied Natural Gas (SSLNG) Market by Value, 2023-2033 (US$ Bn, AGR (%))
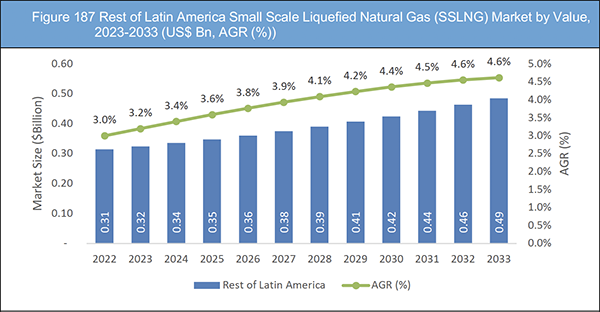
Figure 187 Rest of Latin America Small Scale Liquefied Natural Gas (SSLNG) Market by Value, 2023-2033 (US$ Bn, AGR (%))
Figure 188 SSLNG Market: Company Ranking, 2022
Figure 189 ENN Energy Holdings Ltd: Net Revenue, 2017-2021 (US$ million, AGR%)
Figure 190 ENN Energy Holdings Ltd: Gross Profit, 2017-2021 (US$ million, AGR%)
Figure 191 China Petroleum & Chemical Corporation. (SINOPEC): Net Revenue, 2017-2021 (US$ million, AGR%)
Figure 192 China Petroleum & Chemical Corporation. (SINOPEC): Gross Profit, 2017-2021 (US$ million, AGR%)
Figure 193 China Petroleum & Chemical Corporation. (SINOPEC):R&D Expenses, 2017-2021 (US$ million, AGR%)
Figure 194 Ovintiv Inc.: Net Revenue, 2018-2022 (US$ million, AGR%)
Figure 195 Ovintiv Inc.: Gross Profit, 2018-2022 (US$ million, AGR%)
Figure 196 Equinor ASA: Net Revenue, 2018-2022 (US$ million, AGR%)
Figure 197 Equinor ASA: Gross Profit, 2018-2022 (US$ million, AGR%)
Figure 198 Equinor ASA :R&D Expenses, 2018-2022 (US$ million, AGR%)
Figure 199 Hokkaido gas co., ltd: Net Revenue, 2017-2021 (US$ million, AGR%)
Figure 200 Hokkaido gas co., ltd: Gross Profit, 2017-2021 (US$ million, AGR%)
Figure 201 Royal Dutch Shell Plc: Net Revenue, 2017-2021 (US$ million, AGR%)
Figure 202 Royal Dutch Shell Plc: Gross Profit, 2017-2021 (US$ million, AGR%)
Figure 203 Royal Dutch Shell Plc:R&D Expenses, 2017-2021 (US$ million, AGR%)
List of Companies Profiled in the report
Buffalo Marine Service INC
Gasum Oy
Gazprom ltd
ENN Energy Holdings Ltd.
China Petroleum & Chemical Corporation (SINOPEC)
Encana (Ovintiv Inc)
Equinor ASA
Ferus Inc.
Flint Hills Resources LLC
Hokkaido Gas co., ltd.
Japan Petroleum Exploration Co., Ltd.
Nippon Gas Co., Ltd
Petronas Dagangan Berhad
Polish Oil and Gas Company (PGNiG)
Royal Dutch Shell Plc.
List of Other Companies Mentioned in the report
Anadarko Petroleum
BG Group
Cheniere Energy
China LNG Group
CNOOC
CPC Corporation, Taiwan
Dominion Energy
Edison S.p.A.
Elengy
Engie
ENI
Excelerate Energy
Flex LNG
Fluxys
Freeport LNG
Gas Malaysia Berhad
GasLog
Gasum
Gazprom
Golar LNG
Höegh LNG
Kinder Morgan
Klaipedos Nafta
Korea Gas Corporation (KOGAS)
Mitsubishi Corporation
National Grid
Naturgy
Novatek
Osaka Gas
Pavilion Energy
Pertamina
PETRONAS
Petronet LNG
PT Donggi-Senoro LNG
Qatargas
Repsol
Sempra Energy
Shell
Sinopec
Snam
Statoil
Sumitomo Corporation
Taiwan Power Company
Tellurian
Tokyo Electric Power Company (TEPCO)
Tokyo Gas
Total
Vopak
Wärtsilä
Woodside Energy
List of Associations Mentioned in the Report
Asia Pacific Natural Gas Vehicles Association (ANGVA)
Australian Gas Infrastructure Group (AGIG)
Canadian Gas Association (CGA)
Center for Liquefied Natural Gas (CLNG)
Clean Energy Council (CEC)
Energy Networks Australia (ENA).
Energy Web Foundation (EWF)
European Biogas Association (EBA)
Gas Infrastructure Europe (GIE)
Gas Technology Institute (GTI)
International Association of Ports and Harbors (IAPH)
International Group of Liquefied Natural Gas Importers (GIIGNL)
Natural Gas Supply Association (NGSA)
Natural Gas Vehicles Association (NGVA)
Society for Gas as a Marine Fuel (SGMF)
Society of International Gas Tanker and Terminal Operators (SIGTTO)
The Liquefied Natural Gas Industry Safety Advisory Group (LNGISAG)
The Society of Gas Lighting (SGL)
The World Biogas Association (WBA)
World LPG Association (WLPGA)
 Market Report 2023-2033")