The Floating Liquefied Natural Gas (FLNG) Market Report 2022-2032: This report will prove invaluable to leading firms striving for new revenue pockets if they wish to better understand the industry and its underlying dynamics. It will be useful for companies that would like to expand into different industries or to expand their existing operations in a new region.
FLNG Competes for Customers and Investors in the Congested LNG Market
Although FLNG only makes up a small percentage of the entire LNG business, it has recently generated significant interest. In a world where rigorous capital management is required, FLNG offers lower capital investment and controlled costs. Faster building times provide early cash flows to finance further development, as seen by the FIDs created for Coral and Tortue. In contrast, it is anticipated that growth would slow down and become more consistent as FLNG competes for customers and investors in the congested LNG market.
The major drivers for the growth of the floating liquefied natural gas (FLNG) market are a rising level of confidence in the capacity to conduct the liquefaction process offshore, an increase in global LNG supply, and the convenience of using it (using FSRUs). On the other hand, uncertainty around the FLNG’s viability and safety factors are restraining the growth of FLNG market. The industry’s expansion depends on determining the safety, functionality, and problem areas of these vessels because doing so will make projects easier to finance and easier to insure. The market is still low due to FLNG’s specialty, despite the fact that there are fewer barriers to entry on the FSRU side.
Rise of Clean and Alternate Technologies Will Limit the Growth of FLNG Market
The use of LNG as a ship fuel can greatly lessen the effects of maritime operations on the environment, most likely without raising expenses. International trade is likely to increase dramatically in the next years, and if nothing is done, maritime shipping emissions are predicted to rise by a factor of 2-3 by 2050. IMO regulations mandate that new-build boats be more fuel-efficient in order to slow the growth of emissions. Thus, LNG is one possibility for lowering the GHG emissions from ships. LNG’s reduced carbon content allows it to contribute to a reduction in GHG emissions. The fuel used as a benchmark determines the possibility for well-to-propeller GHG reduction.
What Questions Should You Ask before Buying a Market Research Report?
• How is the floating liquefied natural gas (FLNG) market evolving?
• What is driving and restraining the floating liquefied natural gas (FLNG) market?
• How will each floating liquefied natural gas (FLNG) submarket segment grow over the forecast period and how much revenue will these submarkets account for in 2032?
• How will the market shares for each floating liquefied natural gas (FLNG) submarket develop from 2022 to 2032?
• What will be the main driver for the overall market from 2022 to 2032?
• Will leading floating liquefied natural gas (FLNG) markets broadly follow the macroeconomic dynamics, or will individual national markets outperform others?
• How will the market shares of the national markets change by 2032 and which geographical region will lead the market in 2032?
• Who are the leading players and what are their prospects over the forecast period?
• What are the floating liquefied natural gas (FLNG) projects for these leading companies?
• How will the industry evolve during the period between 2020 and 2032? What are the implications of floating liquefied natural gas (FLNG) projects taking place now and over the next 10 years?
• Is there a greater need for product commercialisation to further scale the floating liquefied natural gas (FLNG) market?
• Where is the floating liquefied natural gas (FLNG) market heading and how can you ensure you are at the forefront of the market?
• What are the best investment options for new product and service lines?
• What are the key prospects for moving companies into a new growth path and C-suite?
You need to discover how this will impact the floating liquefied natural gas (FLNG) market today, and over the next 10 years:
• Our 363-page report provides 174 tables and 160 charts/graphs exclusively to you.
• The report highlights key lucrative areas in the industry so you can target them – NOW.
• It contains in-depth analysis of global, regional and national sales and growth.
• It highlights for you the key successful trends, changes and revenue projections made by your competitors.
This report tells you TODAY how the floating liquefied natural gas (FLNG) market will develop in the next 10 years, and in line with the variations in COVID-19 economic recession and bounce. This market is more critical now than at any point over the last 10 years.
The report delivers exclusive COVID-19 variations and economic data specific to your market.
To access the data contained in this document please email contactus@visiongain.com
Forecasts to 2032 and other analyses reveal commercial prospects
• In addition to revenue forecasting to 2032, our new study provides you with recent results, growth rates, and market shares.
• You will find original analyses, with business outlooks and developments.
• Discover qualitative analyses (including market dynamics, drivers, opportunities, restraints and challenges), cost structure, impact of rising floating liquefied natural gas (FLNG) prices and recent developments.
This report includes data analysis and invaluable insight into how COVID-19 will affect the industry and your company. Four COVID-19 recovery patterns and their impact, namely, “V”, “L”, “W” and “U” are discussed in this report.
Segments Covered in the Report
Market Segmentation by Spending
• OPEX ($Mn)
• CAPEX ($Mn)
Market Segmentation by Type
• Floating Production, Storage and Offloading (FPSO)
• Floating Storage Regasification Unit (FSRU)
Market Segmentation by OPEX Type
• Topside Development
• Hull Design & Construction
• Mooring System
• LNG Transfer Systems
Market Segmentation by CAPEX Type
• Engineering & Design
• Materials & Parts Procurement
• FLNG Construction
• FLNG Commissioning
• Other CAPEX Type

In addition to the revenue predictions for the overall world market and segments, you will also find revenue forecasts for four regional and 20 leading national markets:
North America
• U.S.
• Canada
Europe
• Germany
• Norway
• United Kingdom
• Russia
• Italy
• Rest of Europe
Asia Pacific
• China
• Indonesia
• India
• Rest of Asia Pacific
Middle East & Africa
• Angola
• Nigeria
• Iran
• Ghana
• Mauritania
• Rest of Middle East & Africa
South America
• Brazil
• Rest of South America
Need industry data? Please contact us today.
The report also includes profiles and for some of the leading companies in the Floating Liquefied Natural Gas Market, 2022 to 2032, with a focus on this segment of these companies’ operations.
Leading companies and the potential for market growth
• Chevron Corporation
• Daewoo Shipbuilding & Marine Engineering Co., Ltd
• Equinor ASA
• Excelerate Energy L.P.
• Exmar NV
• Exxon Mobil Corporation
• Golar LNG
• Hoegh LNG Partners LP
• Hyundai Heavy Industries Holdings Co Ltd
• Lloyds Energy
• Petroleo Brasileiro S.A
• Royal Dutch Shell
• Samsung Heavy Industries Co Ltd.
• TechnipFMC Plc
• Total SE
• Woodside Petroleum Ltd
Overall world revenue for Floating Liquefied Natural Gas Market, 2022 to 2032 in terms of value the market will surpass US$19,587 million in 2022, our work calculates. We predict strong revenue growth through to 2032. Our work identifies which organizations hold the greatest potential. Discover their capabilities, progress, and commercial prospects, helping you stay ahead.
How will the Floating Liquefied Natural Gas Market, 2022 to 2032 report help you?
In summary, our 363-page report provides you with the following knowledge:
• Revenue forecasts to 2032 for Floating Liquefied Natural Gas Market, 2022 to 2032 Market, with forecasts for market value, market volume, spending, FLNG Type, OPEX Type, CAPEX Type and company size, each forecast at a global and regional level – discover the industry’s prospects, finding the most lucrative places for investments and revenues.
• Revenue forecasts to 2032 for four regional and 20 key national markets – See forecasts for the Floating Liquefied Natural Gas Market, 2022 to 2032 market in North America, Europe, Asia-Pacific and LAMEA. Also forecasted is the market in the US, Canada, Brazil, Germany, Russia, UK, Italy, China, India, Indonesia, and Angola among other prominent economies.
• Prospects for established firms and those seeking to enter the market – including company profiles for 15 of the major companies involved in the Floating Liquefied Natural Gas Market, 2022 to 2032.
Find quantitative and qualitative analyses with independent predictions. Receive information that only our report contains, staying informed with invaluable business intelligence.
Information found nowhere else
With our new report, you are less likely to fall behind in knowledge or miss out on opportunities. See how our work could benefit your research, analyses, and decisions. Visiongain’s study is for everybody needing commercial analyses for the Floating Liquefied Natural Gas Market, 2022 to 2032, market-leading companies. You will find data, trends and predictions.
To access the data contained in this document please email contactus@visiongain.com
Buy our report today Floating Liquefied Natural Gas (FLNG) Market Report 2022-2032: Forecasts by Spending (OPEX ($Mn), CAPEX ($Mn)), by Number of Vessels (Units), by Type (Floating Production, Storage and Offloading (FPSO), Floating Storage Regasification Unit (FSRU)), by OPEX Type (Topside Development, Hull Design & Construction, Mooring System, LNG Transfer Systems), by CAPEX Type (Engineering & Design, Materials & Parts Procurement, FLNG Construction, FLNG Commissioning, Other) AND Regional and Leading National Market Analysis PLUS Analysis of Leading Companies AND COVID-19 Impact and Recovery Pattern Analysis. Avoid missing out by staying informed – order our report now.
Visiongain is a trading partner with the US Federal Government
CCR Ref number: KD4R6
Do you have any custom requirements we can help you with? Any need for a specific country, geo region, market segment or specific company information? Contact us today, we can discuss your needs and see how we can help: contactus@visiongain.com
1 Report Overview
1.1 Objectives of the Study
1.2 Introduction to Floating Liquefied Natural Gas (FLNG) Market
1.2.1 FLNG Technology
1.2.2 Liquefaction and Gas Processing
1.2.3 Processes of Liquefaction of FLNG
1.2.4 Process for Mixed Refrigerants (MR)
1.2.5 Process for Nitrogen Refrigerant (N2)
1.2.6 Storage & Offloading of LNG
1.2.7 Accommodations and utilities
1.3 What this Report Delivers
1.4 Why You Should Read this Report
1.5 Key Questions Answered by this Analytical Report Include:
1.6 Who is this Report for?
1.7 Methodology
1.7.1 Market Definitions
1.7.2 Market Evaluation & Forecasting Methodology
1.7.3 Data Validation
1.8 Frequently Asked Questions (FAQs)
1.9 Associated Visiongain Reports
1.10 About Visiongain
2 Executive Summary
3 Global Floating Liquefied Natural Gas (FLNG) Industry Overview
3.1 Overview/Structure
3.2 FLNG Operation
3.3 FLNG Safety
3.4 FLNG Benefits
3.5 FLNG Drawbacks
3.6 FLNG Vessels
3.7 Regasification vessel
3.8 Liquefaction vessel
3.9 FLNG Type
3.10 Regasification
3.11 Supply Chain
3.11.1 Managing the Challenges of LNG
3.12 Value Chain
3.13 Recent Trends/ Developments
4 Global Market Dynamics
4.1 Market Drivers
4.1.1 Monetization of Stranded Gas Reserves
4.1.2 High Onshore Terminal Costs
4.1.3 Environmental Solutions
4.1.4 Rising Natural Gas Demand
4.2 Market Restraints
4.2.1 Rise of Clean and Alternate Technologies
4.2.2 LNG Finance: Valuable for Organizations
4.2.3 Issues with Execution and Technology
4.3 Market Opportunities
4.3.1 The Advancement of Technology
4.3.2 Capital Improvement of Project
4.4 Market Challenges
4.4.1 Protracted Oil Price Downturn
4.4.2 Securing Contracts Insurance and Project Finance
4.4.3 Costly FLNG Infrastructure-Related Issues
4.5 COVID-19 Impact Analysis
4.5.1 Pandemic Overview and its impact
4.5.2 V-Shaped Recovery
4.5.3 W-Shaped Recovery
4.5.4 U-Shaped Recovery
4.5.5 L-Shaped Recovery
4.6 SWOT Analysis
4.6.1 Market Strengths
4.6.2 Market Weaknesses
4.6.3 Market Opportunities
4.6.4 Market Threats
4.7 Porter’s Five Forces Analysis
4.7.1 Bargaining Power of Buyers
4.7.2 Bargaining Power of Suppliers
4.7.3 Threat of New Entrants
4.7.4 Threat of Product Substitute
4.7.5 Competitive Rivalry
4.8 PESTLE Analysis
4.8.1 Political Factors
4.8.2 Economic Factors
4.8.3 Social Factors
4.8.4 Technological Factors
4.8.5 Environmental Factors
5 Global Floating Liquefied Natural Gas (FLNG) Market Analysis
5.1 Global Scenario
5.2 Global Market Size Estimation and Forecast Analysis
6 Global Floating Liquefied Natural Gas (FLNG) Market Analysis by Type
6.1 Global Floating Liquefied Natural Gas (FLNG) Overview
6.2 Market by Type:
6.2.1 LNG Floating Production, Storage and Offloading (FPSO)
6.2.2 Floating Storage Regasification Unit (FSRU)
7 Global Market Size Estimation and Forecast by Spending
7.1 Capital Expenditure (CAPEX)
7.1.1 Cost Analysis of FLNG Products
7.1.2 Comparison of Costs with Onshore Plants
7.1.3 Operating/ Running Costs (OPEX)
7.1.4 Individuals on board
7.1.5 Fuel gas
7.1.6 Consumables
7.1.7 Maintenance
7.1.8 Support Vessels and Tugs
7.1.9 Costs Based on Supply
8 Global Market Size Estimation and Forecast by Capacity
8.1 Small/Mid-Scale Capacity
8.2 Large-Scale Capacity
8.2.1 The following main players are mentioned in the FLNG report:
9 Global Market Size Estimation and Forecast by CAPEX Type
9.1 Capex Spending
9.1.1 Technology & Design (Engineering and Design)
9.1.2 Purchasing of Materials & Parts
9.1.3 Construction FLNG
9.1.4 Commissioning of FLNG
9.1.5 By Spending
10 Global Market Size Estimation and Forecast by OPEX Type
10.1 OPEX Spending
10.1.1 Topside Development
10.1.2 Hull Design & Construction
10.1.3 Mooring System
10.1.4 LNG Transfer Systems
11 Global Market Size Estimation and Forecast by No. Of Vessels
11.1 Segment Overview
12 Global Market Size Estimation and Forecast by Region and Country Spending
12.1 Segment Overview
12.1.1 Global FLNG Market by Region
12.1.2 Global FLNG market by Country
13 North America Floating Liquefied Natural Gas (FLNG) Market Analysis
13.1 North America Market Outlook
13.2 North America Market Size Estimation and Forecast
13.3 Market Size Estimation and Forecast by No. Of Vessels
13.4 Market Size Estimation and Forecast by Type
13.5 Market Size Estimation and Forecast by OPEX Type
13.6 Market Size Estimation and Forecast by CAPEX Type
13.7 Market Size Estimation and Forecast by Country
13.8 North America Market Size Estimation and Forecast by Country’s Spending
13.9 US Market Analysis Outlook
13.9.1 Liquefaction Plant Status
13.9.2 US Market Analysis by Value
13.9.3 US Market Analysis by Volume
13.10 Canada Market Analysis Outlook
13.10.1 Liquefaction Plant Status
13.10.2 Canada Market Analysis by Value
13.10.3 Canada Market Analysis by Volume
14 Europe Floating Liquefied Natural Gas (FLNG) Market Analysis
14.1 Europe Market Outlook
14.2 Europe Market Size Estimation and Forecast
14.3 Europe Market Size Estimation and Forecast by No. of Vessels
14.4 Europe Market Size Estimation and Forecast by Type
14.5 Europe Market Size Estimation and Forecast by OPEX Type
14.6 Europe Market Size Estimation and Forecast by CAPEX Type
14.7 Europe Market Size Estimation and Forecast by Country
14.8 Europe Market Size Estimation and Forecast by Country’s Spending
14.9 Germany Market Analysis Outlook
14.9.1 Liquefaction Status
14.9.2 Germany Market Analysis by Value
14.9.3 Germany Market Analysis by Volume
14.10 UK Market Outlook
14.10.1 UK Market Analysis by Value
14.10.2 UK Market Analysis by Volume
14.11 Italy Market Outlook
14.11.1 Italy Market Analysis by Value
14.11.2 Italy Market Analysis by Volume
14.12 Spain Market Overview
14.13 Norway Market Analysis
14.13.1 Norway Market Analysis by Value
14.13.2 Norway Market Analysis by Volume
14.14 Russia Market Analysis
14.14.1 Russia Market Analysis by Value
14.14.2 Russia Market Analysis by Volume
14.15 Rest of Europe Market Analysis
14.15.1 Rest of Europe Market Analysis by Value
14.15.2 Rest of Europe Market Analysis by Volume
15 Asia-Pacific Floating Liquefied Natural Gas (FLNG) Market Analysis
15.1 Asia-Pacific Market Outlook
15.2 Asia-Pacific Market Size Estimation and Forecast
15.3 Market Size Estimation and Forecast by No. of Vessels
15.4 Market Size Estimation and Forecast by Type
15.5 Market Size Estimation and Forecast by OPEX Type
15.6 Market Size Estimation and Forecast by CAPEX Type
15.7 Market Size Estimation and Forecast by Country
15.8 China Market Outlook
15.8.1 China Market Analysis by Value
15.8.2 China Market Analysis by Volume
15.9 India Market Outlook
15.9.1 Current Scenario
15.9.2 India Market Analysis by Value
15.9.3 India Market Analysis by Value
15.10 Indonesia Market Analysis
15.10.1 Indonesia Market Analysis by Value
15.10.2 Indonesia Market Analysis by Volume
15.11 Rest of Asia Pacific Market Analysis
15.11.1 Rest of Asia Pacific Market Analysis by Value
15.11.2 Rest of Asia Pacific Market Analysis by Value
16 Latin America Floating Liquefied Natural Gas (FLNG) Market Analysis
16.1 Latin America Market Outlook
16.2 Latin America Market Size Estimation and Forecast
16.2 Market Size Estimation and Forecast by Type
16.3 Market Size Estimation and Forecast by OPEX Type
16.4 Market Size Estimation and Forecast by CAPEX Type
16.5 Market Size Estimation and Forecast by Country
16.6 Brazil Market Outlook
16.6.1 Brazil Market Analysis by Value
16.6.2 Brazil Market Analysis by Value
16.7 Rest of Latin America Market Analysis
16.7.1 Rest of Latin America Market Analysis by Value
16.7.2 Rest of Latin America Market Analysis by Volume
17 Middle East & Africa Floating Liquefied Natural Gas (FLNG) Market Analysis
17.1 Middle East and Africa Market Outlook
17.2 South Africa Market Outlook
17.2 Middle East & Africa Market Size Estimation and Forecast
17.3 Market Size Estimation and Forecast by No. of Vessels
17.4 Market Size Estimation and Forecast by Type
17.5 Market Size Estimation and Forecast by OPEX Type
17.6 Market Size Estimation and Forecast by CAPEX Type
17.7 Market Size Estimation and Forecast by Country
17.3 Iran Market Analysis
17.3.1 Iran Market Analysis by Value
17.3.2 Iran Market Analysis by Volume
17.4 Angola Market Analysis
17.4.1 Angola Market Analysis by Value
17.4.2 Angola Market Analysis by Volume
17.5 Nigeria Market Analysis
17.5.1 Nigeria Market Analysis by Value
17.5.2 Nigeria Market Analysis by Volume
17.6 Ghana Market Analysis
17.6.1 Ghana Market Analysis by Value
17.6.2 Ghana Market Analysis by Volume
17.7 Mauritania Market Analysis
17.7.1 Mauritania Market Analysis by Value
17.7.2 Mauritania Market Analysis by Value
17.8 Rest of MEA Market Analysis
17.8.1 Rest of MEA Market Analysis by Value
17.8.2 Rest of MEA Market Analysis by Volume
18 Competitive Landscape
18.1 Acquisition as the Key Business Strategy in the Global Market
18.2 New Product/Service Launch as the Key Business Strategy in the Global Market
18.3 Partnership as the Key Business Strategy In the Global Market
18.4 Collaboration as the Key Business Strategy In the Global Market
18.5 Expansion as the Key Business Strategy In the Global Market
18.6 Joint Venture as the Key Business Strategy In the Global Market
18.7 Agreement as the Key Business Strategy In the Global Market
18.8 Contract as the Key Business Strategy in the Global Market
18.9 Investment as the Key Business Strategy in the Global Market
18.10 Divestment as the Key Business Strategy in the Global Market
19 Company Profiles
19.1 Hyundai Heavy Industries Holdings Co Ltd
19.1.1 Company Snapshot
19.1.2 Company Overview
19.1.3 Company Financial Profile
19.1.4 Company Product Benchmarking
19.1.5 Company Recent Developments
19.2 Samsung Heavy Industries Co Ltd.
19.2.1 Company Snapshot
19.2.2 Company Overview
19.2.3 Company Financial Profile
19.2.4 Company Product Benchmarking
19.2.5 Company Recent Developments
19.3 Daewoo Shipbuilding & Marine Engineering Co., Ltd
19.3.1 Company Snapshot
19.3.2 Company Overview
19.3.3 Company Financial Profile
19.3.4 Company Product Benchmarking
19.3.5 Company Recent Developments
19.4 Petroleo Brasileiro S.A
19.4.1 Company Snapshot
19.4.2 Company Overview
19.4.3 Company Financial Profile
19.4.4 Performance and Activities
19.4.5 Main Operations of the Company
19.4.6 Company Product Benchmarking
19.4.7 Company Recent Developments
19.5 Royal Dutch Shell
19.5.1 Company Snapshot
19.5.2 Company Overview
19.5.3 Company Financial Profile
19.5.4 Company Product Benchmarking
19.5.5 Company Recent Developments
19.6 Excelerate Energy L.P.
19.6.1 Company Snapshot
19.6.2 Company Overview
19.6.3 Company Product Benchmarking
19.6.4 Company Recent Developments
19.7 Hoegh LNG Partners LP
19.7.1 Company Snapshot
19.7.2 Company Overview
19.7.3 Company Financial Profile
19.7.4 Company Product Benchmarking
19.7.5 Company Recent Development
19.8 Golar LNG
19.8.1 Company Snapshot
19.8.2 Company Overview
19.8.3 Company Financial Profile
19.8.4 Company Product Benchmarking
19.8.5 Company Recent Developments
19.9 Exxon Mobil Corporation.
19.9.1 Company Snapshot
19.9.2 Company Overview
19.9.3 Company Financial Profile
19.9.4 Company Product Benchmarking
19.9.5 Company Recent Developments
19.10 Total SE
19.10.1 Company Snapshot
19.10.2 Company Overview
19.10.3 Company Financial Profile
19.10.4 Company Product Benchmarking
19.10.5 Company Recent Developments
19.11 Chevron Corporation
19.11.1 Company Snapshot
19.11.2 Company Overview
19.11.3 Company Financial Profile
19.11.4 Company Product Benchmarking
19.11.5 Company Technology
19.11.6 Company Recent Developments
19.12 Equinor ASA
19.12.1 Company Snapshot
19.12.2 Company Overview
19.12.3 Company Financial Profile
19.12.4 Company Product Benchmarking
19.12.5 Company Recent Developments
19.13 Exmar NV
19.13.1 Company Snapshot
19.13.2 Company Overview
19.13.3 Company Financial Profile
19.13.4 Company Product Benchmarking
19.13.5 Company Recent Developments
19.14 Woodside Petroleum Ltd
19.14.1 Company Snapshot
19.14.2 Company Overview
19.14.3 Company Financial Profile
19.14.4 Company Product Benchmarking
19.14.5 Company Recent Developments
19.15 Lloyds Energy
19.15.1 Company Snapshot
19.15.2 Company Overview
19.15.3 Company Product Benchmarking
19.15.4 Company Recent Developments
19.16 TechnipFMC Plc
19.16.1 Company Snapshot
19.16.2 Company Overview
19.16.3 Company Financial Profile
19.16.4 Company Product Benchmarking
19.16.5 Company Recent Developments
20 Conclusion and Recommendations
20.1 Concluding Remarks from Visiongain
20.2 Recommendations for Market Players
List of Tables
Table 1 Global Floating Liquefied Natural Gas (FLNG) Market Snapshot, 2022 & 2032 (US$million, CAGR %)
Table 2 Global Floating Liquefied Natural Gas (FLNG) Market Forecast, 2022-2032 (USD Mn, AGR (%), CAGR(%)) (V-Shaped Recovery Scenario)
Table 3 Global Floating Liquefied Natural Gas (FLNG) Market by Region, 2022-2032 (USD Mn, AGR (%), CAGR(%)) (V-Shaped Recovery Scenario)
Table 4 Global Floating Liquefied Natural Gas (FLNG) Market Forecast, 2022-2032 (USD Mn, AGR (%), CAGR(%)) (W-Shaped Recovery Scenario)
Table 5 Global Floating Liquefied Natural Gas (FLNG) Market by Region, 2022-2032 (USD Mn, AGR (%), CAGR(%)) (W-Shaped Recovery Scenario)
Table 6 Global Floating Liquefied Natural Gas (FLNG) Market Forecast, 2022-2032 (USD Mn, AGR (%), CAGR(%)) (U-Shaped Recovery Scenario)
Table 7 Global Floating Liquefied Natural Gas (FLNG) Market by Region, 2022-2032 (USD Mn, AGR (%), CAGR(%)) (U-Shaped Recovery Scenario)
Table 8 Global Floating Liquefied Natural Gas (FLNG) Market Forecast, 2022-2032 (USD Mn, AGR (%), CAGR(%)) (L-Shaped Recovery Scenario)
Table 9 Global Floating Liquefied Natural Gas (FLNG) Market by Region, 2022-2032 (USD Mn, AGR (%), CAGR(%)) (L-Shaped Recovery Scenario)
Table 10 Global Floating Liquefied Natural Gas (FLNG) Market Forecast, 2022-2032 (USD Mn, AGR (%), CAGR(%))
Table 11 Global Floating Liquefied Natural Gas (FLNG) Market Forecast, 2022-2032 (USD Mn, AGR (%), CAGR(%))
Table 12 Global Floating Liquefied Natural Gas (FLNG) Market Forecast by Number of Vessels, 2022-2032 (Units, AGR (%), CAGR(%))
Table 13 Global Floating Liquefied Natural Gas (FLNG) Market Forecast by Type, 2022-2032 (Units, AGR (%), CAGR(%))
Table 14 Global Floating Liquefied Natural Gas (FLNG) Market by OPEX Type, 2022-2032 (USD Million, AGR (%), CAGR(%))
Table 15 Global Floating Liquefied Natural Gas (FLNG) Market by CAPEX Type, 2022-2032 (USD Million, AGR (%), CAGR(%))
Table 16 Global Floating Liquefied Natural Gas (FLNG) Market by Region, 2022-2032 (USD Mn, AGR (%), CAGR(%))
Table 17 Global Floating Liquefied Natural Gas (FLNG) Market by Country, 2022-2032 (Units, AGR (%), CAGR(%))
Table 18 Global Floating Liquefied Natural Gas (FLNG) Market Forecast by Type, 2022-2032 (Units, AGR (%), CAGR(%))
Table 19 Global Floating Liquefied Natural Gas (FLNG) Market by CAPEX Type, 2022-2032 (USD Million, AGR (%), CAGR(%))
Table 20 Global Floating Liquefied Natural Gas (FLNG) Market by OPEX Type, 2022-2032 (USD Million, AGR (%), CAGR(%))
Table 21 Global Floating Liquefied Natural Gas (FLNG) Market Forecast by Number of Vessels, 2022-2032 (Units, AGR (%), CAGR(%))
Table 22 Global Floating Liquefied Natural Gas (FLNG) Market by Region, 2022-2032 (USD Mn, AGR (%), CAGR(%))
Table 23 Global Floating Liquefied Natural Gas (FLNG) Market by Country, 2022-2032 (Units, AGR (%), CAGR(%))
Table 24 North America Floating Liquefied Natural Gas (FLNG) Market Forecast, 2022-2032 (USD Mn, AGR (%), CAGR(%))
Table 25 North America Floating Liquefied Natural Gas (FLNG) Market Forecast, 2022-2032 (USD Mn, AGR (%), CAGR(%))
Table 26 North America Floating Liquefied Natural Gas (FLNG) Market Forecast by Number of Vessels, 2022-2032 (Units, AGR (%), CAGR(%))
Table 27 North America Floating Liquefied Natural Gas (FLNG) Market Forecast by Type, 2022-2032 (Units, AGR (%), CAGR(%))
Table 28 North America Floating Liquefied Natural Gas (FLNG) Market by OPEX Type, 2022-2032 (USD Million, AGR (%), CAGR(%))
Table 29 North America Floating Liquefied Natural Gas (FLNG) Market by CAPEX Type, 2022-2032 (USD Million, AGR (%), CAGR(%))
Table 30 North America Floating Liquefied Natural Gas (FLNG) Market by Country, 2022-2032 (USD Mn, AGR (%), CAGR(%))
Table 31 North America Floating Liquefied Natural Gas (FLNG) Market by Country, 2022-2032 (Units, AGR (%), CAGR(%))
Table 32 US Floating Liquefied Natural Gas (FLNG) Market Forecast, 2022-2032 (USD Mn, AGR (%), CAGR(%))
Table 33 US Floating Liquefied Natural Gas (FLNG) Market Forecast, 2022-2032 (Units, AGR (%), CAGR(%))
Table 34 Canada Floating Liquefied Natural Gas (FLNG) Market Forecast, 2022-2032 (USD Mn, AGR (%), CAGR(%))
Table 35 Canada Floating Liquefied Natural Gas (FLNG) Market Forecast, 2022-2032 (Units, AGR (%), CAGR(%))
Table 36 Europe Floating Liquefied Natural Gas (FLNG) Market Forecast, 2022-2032 (USD Mn, AGR (%), CAGR(%))
Table 37 Europe Floating Liquefied Natural Gas (FLNG) Market Forecast, 2022-2032 (USD Mn, AGR (%), CAGR(%))
Table 38 Europe Floating Liquefied Natural Gas (FLNG) Market Forecast by Number of Vessels, 2022-2032 (Units, AGR (%), CAGR(%))
Table 39 Europe Floating Liquefied Natural Gas (FLNG) Market Forecast by Type, 2022-2032 (Units, AGR (%), CAGR(%))
Table 40 Europe Floating Liquefied Natural Gas (FLNG) Market by OPEX Type, 2022-2032 (USD Million, AGR (%), CAGR(%))
Table 41 Europe Floating Liquefied Natural Gas (FLNG) Market by CAPEX Type, 2022-2032 (USD Million, AGR (%), CAGR(%))
Table 42 Europe Floating Liquefied Natural Gas (FLNG) Market by Country, 2022-2032 (USD Mn, AGR (%), CAGR(%))
Table 43 Europe Floating Liquefied Natural Gas (FLNG) Market by Country, 2022-2032 (Units, AGR (%), CAGR(%))
Table 44 Germany Floating Liquefied Natural Gas (FLNG) Market Forecast, 2022-2032 (USD Mn, AGR (%), CAGR(%))
Table 45 Germany Floating Liquefied Natural Gas (FLNG) Market Forecast, 2022-2032 (Units, AGR (%), CAGR(%))
Table 46 UK Floating Liquefied Natural Gas (FLNG) Market Forecast, 2022-2032 (USD Mn, AGR (%), CAGR(%))
Table 47 UK Floating Liquefied Natural Gas (FLNG) Market Forecast, 2022-2032 (Units, AGR (%), CAGR(%))
Table 48 Italy Floating Liquefied Natural Gas (FLNG) Market Forecast, 2022-2032 (USD Mn, AGR (%), CAGR(%))
Table 49 Italy Floating Liquefied Natural Gas (FLNG) Market Forecast, 2022-2032 (Units, AGR (%), CAGR(%))
Table 50 Norway Floating Liquefied Natural Gas (FLNG) Market Forecast, 2022-2032 (USD Mn, AGR (%), CAGR(%))
Table 51 Norway Floating Liquefied Natural Gas (FLNG) Market Forecast, 2022-2032 (Units, AGR (%), CAGR(%))
Table 52 Russia Floating Liquefied Natural Gas (FLNG) Market Forecast, 2022-2032 (USD Mn, AGR (%), CAGR(%))
Table 53 Russia Floating Liquefied Natural Gas (FLNG) Market Forecast, 2022-2032 (Units, AGR (%), CAGR(%))
Table 54 Rest of Europe Floating Liquefied Natural Gas (FLNG) Market Forecast, 2022-2032 (USD Mn, AGR (%), CAGR(%))
Table 55 Rest of Europe Floating Liquefied Natural Gas (FLNG) Market Forecast, 2022-2032 (Units, AGR (%), CAGR(%))
Table 56 Asia-Pacific Floating Liquefied Natural Gas (FLNG) Market Forecast, 2022-2032 (USD Mn, AGR (%), CAGR(%))
Table 57 Asia-Pacific Floating Liquefied Natural Gas (FLNG) Market Forecast, 2022-2032 (USD Mn, AGR (%), CAGR(%))
Table 58 Asia-Pacific Floating Liquefied Natural Gas (FLNG) Market Forecast by Number of Vessels, 2022-2032 (Units, AGR (%), CAGR(%))
Table 59 Asia-Pacific Floating Liquefied Natural Gas (FLNG) Market Forecast by Type, 2022-2032 (Units, AGR (%), CAGR(%))
Table 60 Asia-Pacific Floating Liquefied Natural Gas (FLNG) Market by OPEX Type, 2022-2032 (USD Million, AGR (%), CAGR(%))
Table 61 Asia-Pacific Floating Liquefied Natural Gas (FLNG) Market by CAPEX Type, 2022-2032 (USD Million, AGR (%), CAGR(%))
Table 62 Asia-Pacific Floating Liquefied Natural Gas (FLNG) Market by Country, 2022-2032 (USD Mn, AGR (%), CAGR(%))
Table 63 Asia-Pacific Floating Liquefied Natural Gas (FLNG) Market by Country, 2022-2032 (Units, AGR (%), CAGR(%))
Table 64 China Floating Liquefied Natural Gas (FLNG) Market Forecast, 2022-2032 (USD Mn, AGR (%), CAGR(%))
Table 65 China Floating Liquefied Natural Gas (FLNG) Market Forecast, 2022-2032 (Units, AGR (%), CAGR(%))
Table 66 India Floating Liquefied Natural Gas (FLNG) Market Forecast, 2022-2032 (USD Mn, AGR (%), CAGR(%))
Table 67 India Floating Liquefied Natural Gas (FLNG) Market Forecast, 2022-2032 (Units, AGR (%), CAGR(%))
Table 68 Indonesia Floating Liquefied Natural Gas (FLNG) Market Forecast, 2022-2032 (USD Mn, AGR (%), CAGR(%))
Table 69 Indonesia Floating Liquefied Natural Gas (FLNG) Market Forecast, 2022-2032 (Units, AGR (%), CAGR(%))
Table 70 Rest of Asia-Pacific Floating Liquefied Natural Gas (FLNG) Market Forecast, 2022-2032 (USD Mn, AGR (%), CAGR(%))
Table 71 Rest of Asia-Pacific Floating Liquefied Natural Gas (FLNG) Market Forecast, 2022-2032 (Units, AGR (%), CAGR(%))
Table 72 Latin America Floating Liquefied Natural Gas (FLNG) Market Forecast, 2022-2032 (USD Mn, AGR (%), CAGR(%))
Table 73 Latin America Floating Liquefied Natural Gas (FLNG) Market Forecast, 2022-2032 (USD Mn, AGR (%), CAGR(%))
Table 74 Latin America Floating Liquefied Natural Gas (FLNG) Market Forecast by Number of Vessels, 2022-2032 (Units, AGR (%), CAGR(%))
Table 75 Latin America Floating Liquefied Natural Gas (FLNG) Market Forecast by Type, 2022-2032 (Units, AGR (%), CAGR(%))
Table 76 Latin America Floating Liquefied Natural Gas (FLNG) Market by OPEX Type, 2022-2032 (USD Million, AGR (%), CAGR(%))
Table 77 Latin America Floating Liquefied Natural Gas (FLNG) Market by CAPEX Type, 2022-2032 (USD Million, AGR (%), CAGR(%))
Table 78 Latin America Floating Liquefied Natural Gas (FLNG) Market by Country, 2022-2032 (USD Mn, AGR (%), CAGR(%))
Table 79 Latin America Floating Liquefied Natural Gas (FLNG) Market by Country, 2022-2032 (Units, AGR (%), CAGR(%))
Table 80 Brazil Floating Liquefied Natural Gas (FLNG) Market Forecast, 2022-2032 (USD Mn, AGR (%), CAGR(%))
Table 81 Brazil Floating Liquefied Natural Gas (FLNG) Market Forecast, 2022-2032 (Units, AGR (%), CAGR(%))
Table 82 Rest of Latin America Floating Liquefied Natural Gas (FLNG) Market Forecast, 2022-2032 (USD Mn, AGR (%), CAGR(%))
Table 83 Rest of Latin America Floating Liquefied Natural Gas (FLNG) Market Forecast, 2022-2032 (Units, AGR (%), CAGR(%))
Table 84 Middle East & Africa Floating Liquefied Natural Gas (FLNG) Market Forecast, 2022-2032 (USD Mn, AGR (%), CAGR(%))
Table 85 Middle East & Africa Floating Liquefied Natural Gas (FLNG) Market Forecast, 2022-2032 (USD Mn, AGR (%), CAGR(%))
Table 86 Middle East & Africa Floating Liquefied Natural Gas (FLNG) Market Forecast by Number of Vessels, 2022-2032 (Units, AGR (%), CAGR(%))
Table 87 Middle East & Africa Floating Liquefied Natural Gas (FLNG) Market Forecast by Type, 2022-2032 (Units, AGR (%), CAGR(%))
Table 88 Middle East & Africa Floating Liquefied Natural Gas (FLNG) Market by OPEX Type, 2022-2032 (USD Million, AGR (%), CAGR(%))
Table 89 Middle East & Africa Floating Liquefied Natural Gas (FLNG) Market by CAPEX Type, 2022-2032 (USD Million, AGR (%), CAGR(%))
Table 90 Middle East & Africa Floating Liquefied Natural Gas (FLNG) Market by Country, 2022-2032 (USD Mn, AGR (%), CAGR(%))
Table 91 Middle East & Africa Floating Liquefied Natural Gas (FLNG) Market by Country, 2022-2032 (Units, AGR (%), CAGR(%))
Table 92 Iran Floating Liquefied Natural Gas (FLNG) Market Forecast, 2022-2032 (USD Mn, AGR (%), CAGR(%))
Table 93 Iran Floating Liquefied Natural Gas (FLNG) Market Forecast, 2022-2032 (Units, AGR (%), CAGR(%))
Table 94 Angola Floating Liquefied Natural Gas (FLNG) Market Forecast, 2022-2032 (USD Mn, AGR (%), CAGR(%))
Table 95 Angola Floating Liquefied Natural Gas (FLNG) Market Forecast, 2022-2032 (Units, AGR (%), CAGR(%))
Table 96 Nigeria Floating Liquefied Natural Gas (FLNG) Market Forecast, 2022-2032 (USD Mn, AGR (%), CAGR(%))
Table 97 Nigeria Floating Liquefied Natural Gas (FLNG) Market Forecast, 2022-2032 (Units, AGR (%), CAGR(%))
Table 98 Ghana Floating Liquefied Natural Gas (FLNG) Market Forecast, 2022-2032 (USD Mn, AGR (%), CAGR(%))
Table 99 Ghana Floating Liquefied Natural Gas (FLNG) Market Forecast, 2022-2032 (Units, AGR (%), CAGR(%))
Table 100 Mauritania Floating Liquefied Natural Gas (FLNG) Market Forecast, 2022-2032 (USD Mn, AGR (%), CAGR(%))
Table 101 Mauritania Floating Liquefied Natural Gas (FLNG) Market Forecast, 2022-2032 (Units, AGR (%), CAGR(%))
Table 102 Rest of MEA Floating Liquefied Natural Gas (FLNG) Market Forecast, 2022-2032 (USD Mn, AGR (%), CAGR(%))
Table 103 Rest of MEA Floating Liquefied Natural Gas (FLNG) Market Forecast, 2022-2032 (Units, AGR (%), CAGR(%))
Table 104 Acquisition Strategy Adopted by Key Players in Global Floating Liquefied Natural Gas (FLNG) Market, 2018-2022
Table 105 Launch Adopted by Key Players in Global Floating Liquefied Natural Gas (FLNG) Market, 2018-2022
Table 106 Partnership Strategy Adopted by Key Players in Global Floating Liquefied Natural Gas (FLNG) Market, 2018-2022
Table 107 Collaboration Strategy Adopted by Key Players in Global Floating Liquefied Natural Gas (FLNG) Market, 2018-2022
Table 108 Expansion Strategy Adopted by Key Players in Global Floating Liquefied Natural Gas (FLNG) Market, 2018-2022
Table 109 Joint Venture Strategy Adopted by Key Players in Global Floating Liquefied Natural Gas (FLNG) Market, 2018-2022
Table 110 Agreement Strategy Adopted by Key Players in Global Floating Liquefied Natural Gas (FLNG) Market, 2018-2022
Table 111 Contract Strategy Adopted by Key Players in Global Floating Liquefied Natural Gas (FLNG) Market, 2018-2022
Table 112 Investment Strategy Adopted by Key Players in Global Floating Liquefied Natural Gas (FLNG) Market, 2018-2022
Table 113 Divestment Strategy Adopted by Key Players in Global Floating Liquefied Natural Gas (FLNG) Market, 2018-2022
Table 114 Hyundai Heavy Industries Holdings Co Ltd.: Company Information
Table 115 Samsung Heavy Industries Co Ltd..: Company Revenue 2017-2021 (US$Mn, AGR %)
Table 116 Hyundai Heavy Industries Holdings Co Ltd.: Company Recent Developments till Apr,2021
Table 117 Samsung Heavy Industries Co Ltd..: Company Information
Table 118 Samsung Heavy Industries Co Ltd..: Company Revenue 2017-2021 (US$Mn, AGR %)
Table 119 Samsung Heavy Industries Co Ltd..: Company Service Benchmarking
Table 120 Samsung Heavy Industries Co Ltd..: Company Recent Developments till Apr,2021
Table 121 Daewoo Shipbuilding & Marine Engineering Co., Ltd: Company Information
Table 122 Daewoo Shipbuilding & Marine Engineering Co., Ltd: Company Revenue 2017-2021 (US$Mn, AGR %)
Table 123 Daewoo Shipbuilding & Marine Engineering Co., Ltd: Company Product and Service Benchmarking
Table 124 Daewoo Shipbuilding & Marine Engineering Co., Ltd: Company Recent Developments till May,2021
Table 125 Petroleo Brasileiro S.A.: Company Information
Table 126 Petroleo Brasileiro S.A.: Company Revenue 2017-2021(US$Mn, AGR %)
Table 127 Petroleo Brasileiro S.A.: Company Product and Service
Table 128 Petroleo Brasileiro S.A Company Recent Developments till Feb,2021
Table 129 Royal Dutch Shell: Company Information
Table 130 Royal Dutch Shell: Company Revenue 2017-2021(US$Mn, AGR %)
Table 131 Royal Dutch Shell: Company Product and Service
Table 132 Royal Dutch Shell.: Company Recent Developments till Feb,2021
Table 133 Excelerate Energy L.P. : Company Information
Table 134 Excelerate Energy L.P. : Company Product and Service Benchmarking
Table 135 Excelerate Energy L.P.: Company Recent Developments till Feb,2021
Table 136 Hoegh LNG Partners LP .: Company Information
Table 137 Hoegh LNG Partners LP: Company Revenue 2017-2021 (US$Mn, AGR %)
Table 138 Hoegh LNG Partners LP.: Company Product and Service Benchmarking
Table 139 Hoegh LNG Partners LP.: Company Recent Developments till Feb,2021
Table 140 Golar LNG.: Company Information
Table 141 Golar LNG: Company Revenue 2017-2021 (US$Mn, AGR %)
Table 142 Golar LNG. Recent Developments till Apr,2021
Table 143 Exxon Mobil Corporation.: Company Information
Table 144 Exxon Mobil Corporation.: Company Revenue 2017-2021(US$Mn, AGR %)
Table 145 Exxon Mobil Corporation.: Company Product and Service Benchmarking
Table 146 Exxon Mobil Corporation.: Company Recent Developments till Feb,2021
Table 147 Total SE.: Company Information
Table 148 Total SE.: Company Revenue 2017-2021 (US$Mn, AGR %)
Table 149 Total SE.: Company Product and Service Benchmarking
Table 150 Total SE.: Company Recent Developments till Feb,2021
Table 151 Chevron Corporation.: Company Information
Table 152 Chevron Corporation.: Company Revenue 2017-2021(US$Mn, AGR %)
Table 153 Chevron Corporation.: Company Product and Service Benchmarking
Table 154 Chevron Corporation.: Company Recent Developments till Mar,2021
Table 155 Equinor ASA.: Company Information
Table 156 Equinor ASA.: Company Revenue 2017-2021 (US$Mn, AGR %)
Table 157 Equinor ASA.: Company Product and Service
Table 158 Equinor ASA Company Recent Developments till Feb,2021
Table 159 Exmar NV.: Company Information
Table 160 Exmar NV: Revenue 2017-2021 (US$Mn, AGR %)
Table 161 EXMAR NV: Product and Service
Table 162 Exmar NV: Recent Developments till Apr,2021
Table 163 Woodside Petroleum Ltd: Company Information
Table 164 Woodside Petroleum Ltd: Company Revenue 2017-2021 (US$Mn, AGR %)
Table 165 Woodside Petroleum Ltd: Company Product and Service Benchmarking
Table 166 Woodside Petroleum Ltd.: Recent Developments till Apr,2021
Table 167 Lloyds Energy: Company Information
Table 168 Lloyds Energy: Company Product and Service
Table 169 Lloyds Energy.: Company Recent Developments till Feb,2021
Table 170 TechnipFMC Plc.: Company Information
Table 171 TechnipFMC Plc.: Company Revenue 2016-2020 (US$Mn, AGR %)
Table 172 TechnipFMC Plc .: Company Product and Service Benchmarking
Table 173 TechnipFMC Plc.: Company Recent Developments till Feb,2021
Table 174 Glossary Terms
List of Figures
Figure 1 Breakdown of Primary Interviews: By Company Type, Designation, & Region
Figure 2 Global Floating Liquefied Natural Gas (FLNG) Market Forecast, 2022-2032 (USD Mn, AGR (%)) (V-Shaped Recovery Scenario)
Figure 3 Global Floating Liquefied Natural Gas (FLNG) Market by Region, 2022-2032 (USD Mn, AGR (%)) (V-Shaped Recovery Scenario)
Figure 4 Global Floating Liquefied Natural Gas (FLNG) Market Forecast, 2022-2032 (USD Mn, AGR (%)) (W-Shaped Recovery Scenario)
Figure 5 Global Floating Liquefied Natural Gas (FLNG) Market by Region, 2022-2032 (USD Mn, AGR (%)) (W-Shaped Recovery Scenario)
Figure 6 Global Floating Liquefied Natural Gas (FLNG) Market Forecast, 2022-2032 (USD Mn, AGR (%)) (U-Shaped Recovery Scenario)
Figure 7 Global Floating Liquefied Natural Gas (FLNG) Market by Region, 2022-2032 (USD Mn, AGR (%)) (U-Shaped Recovery Scenario)
Figure 8 Global Floating Liquefied Natural Gas (FLNG) Market by Region, 2022-2032 (USD Mn, AGR (%)) (L-Shaped Recovery Scenario)
Figure 9 Global Floating Liquefied Natural Gas (FLNG) Market by Region, 2022-2032 (USD Mn, AGR (%)) (L-Shaped Recovery Scenario)
Figure 10 Global Floating Liquefied Natural Gas (FLNG) Market: Porter’s Five Forces Analysis
Figure 11 Global Floating Liquefied Natural Gas (FLNG) Market Forecast, 2022-2032 (USD Mn, AGR (%))
Figure 12 Global Floating Liquefied Natural Gas (FLNG) Market Forecast, 2022-2032 (USD Mn, AGR (%))
Figure 13 Global Floating Liquefied Natural Gas (FLNG) Market Forecast by Number of Vessels, 2022-2032 (Units, AGR (%))
Figure 14 Global Floating Liquefied Natural Gas (FLNG) Market Forecast by Type, 2022-2032 (Units, AGR (%))
Figure 15 Global Floating Liquefied Natural Gas (FLNG) Market by OPEX Type, 2022-2032 (USD Million, AGR (%))
Figure 16 Global Floating Liquefied Natural Gas (FLNG) Market by CAPEX Type, 2022-2032 (USD Million, AGR (%))
Figure 17 Global Floating Liquefied Natural Gas (FLNG) Market by Region, 2022-2032 (USD Mn, AGR (%))
Figure 18 Global Floating Liquefied Natural Gas (FLNG) Market by Country, 2022-2032 (Units, AGR (%))
Figure 19 Global Floating Liquefied Natural Gas (FLNG) Market Forecast by Type, 2022-2032 (Units, AGR (%))
Figure 20 Global Floating Liquefied Natural Gas (FLNG) Market by CAPEX Type, 2022-2032 (USD Million, AGR (%))
Figure 21 Global Floating Liquefied Natural Gas (FLNG) Market by OPEX Type, 2022-2032 (USD Million, AGR (%))
Figure 22 Global Floating Liquefied Natural Gas (FLNG) Market Forecast by Number of Vessels, 2022-2032 (Units, AGR (%))
Figure 23 Global Floating Liquefied Natural Gas (FLNG) Market by Region, 2022-2032 (USD Mn, AGR (%))
Figure 24 Global Floating Liquefied Natural Gas (FLNG) Market by Country, 2022-2032 (Units, AGR (%))
Figure 25 North America Floating Liquefied Natural Gas (FLNG) Market Forecast, 2022-2032 (USD Mn, AGR (%))
Figure 26 North America Floating Liquefied Natural Gas (FLNG) Market Forecast, 2022-2032 (USD Mn, AGR (%))
Figure 27 North America Floating Liquefied Natural Gas (FLNG) Market Forecast by Number of Vessels, 2022-2032 (Units, AGR (%))
Figure 28 North America Floating Liquefied Natural Gas (FLNG) Market Forecast by Type, 2022-2032 (Units, AGR (%))
Figure 29 North America Floating Liquefied Natural Gas (FLNG) Market by OPEX Type, 2022-2032 (USD Million, AGR (%))
Figure 30 North America Floating Liquefied Natural Gas (FLNG) Market by CAPEX Type, 2022-2032 (USD Million, AGR (%))
Figure 31 North America Floating Liquefied Natural Gas (FLNG) Market by Country, 2022-2032 (USD Mn, AGR (%))
Figure 32 North America Floating Liquefied Natural Gas (FLNG) Market by Country, 2022-2032 (Units, AGR (%))
Figure 33 US Floating Liquefied Natural Gas (FLNG) Market Forecast, 2022-2032 (USD Mn, AGR (%))
Figure 34 US Floating Liquefied Natural Gas (FLNG) Market Forecast, 2022-2032 (Units, AGR (%))
Figure 35 Canada Floating Liquefied Natural Gas (FLNG) Market Forecast, 2022-2032 (USD Mn, AGR (%))
Figure 36 Canada Floating Liquefied Natural Gas (FLNG) Market Forecast, 2022-2032 (Units, AGR (%))
Figure 37 Europe Floating Liquefied Natural Gas (FLNG) Market Forecast, 2022-2032 (USD Mn, AGR (%))
Figure 38 Europe Floating Liquefied Natural Gas (FLNG) Market Forecast, 2022-2032 (USD Mn, AGR (%))
Figure 39 Europe Floating Liquefied Natural Gas (FLNG) Market Forecast by Number of Vessels, 2022-2032 (Units, AGR (%))
Figure 40 Europe Floating Liquefied Natural Gas (FLNG) Market Forecast by Type, 2022-2032 (Units, AGR (%))
Figure 41 Europe Floating Liquefied Natural Gas (FLNG) Market by OPEX Type, 2022-2032 (USD Million, AGR (%))
Figure 42 Europe Floating Liquefied Natural Gas (FLNG) Market by CAPEX Type, 2022-2032 (USD Million, AGR (%))
Figure 43 Europe Floating Liquefied Natural Gas (FLNG) Market by Country, 2022-2032 (USD Mn, AGR (%))
Figure 44 Europe Floating Liquefied Natural Gas (FLNG) Market by Country, 2022-2032 (Units, AGR (%))
Figure 45 Germany Floating Liquefied Natural Gas (FLNG) Market Forecast, 2022-2032 (USD Mn, AGR (%))
Figure 46 Germany Floating Liquefied Natural Gas (FLNG) Market Forecast, 2022-2032 (Units, AGR (%))
Figure 47 UK Floating Liquefied Natural Gas (FLNG) Market Forecast, 2022-2032 (USD Mn, AGR (%))
Figure 48 UK Floating Liquefied Natural Gas (FLNG) Market Forecast, 2022-2032 (Units, AGR (%))
Figure 49 Italy Floating Liquefied Natural Gas (FLNG) Market Forecast, 2022-2032 (USD Mn, AGR (%))
Figure 50 Italy Floating Liquefied Natural Gas (FLNG) Market Forecast, 2022-2032 (Units, AGR (%))
Figure 51 Norway Floating Liquefied Natural Gas (FLNG) Market Forecast, 2022-2032 (USD Mn, AGR (%))
Figure 52 Norway Floating Liquefied Natural Gas (FLNG) Market Forecast, 2022-2032 (Units, AGR (%))
Figure 53 Russia Floating Liquefied Natural Gas (FLNG) Market Forecast, 2022-2032 (USD Mn, AGR (%))
Figure 54 Russia Floating Liquefied Natural Gas (FLNG) Market Forecast, 2022-2032 (Units, AGR (%))
Figure 55 Rest of Europe Floating Liquefied Natural Gas (FLNG) Market Forecast, 2022-2032 (USD Mn, AGR (%))
Figure 56 Rest of Europe Floating Liquefied Natural Gas (FLNG) Market Forecast, 2022-2032 (Units, AGR (%))
Figure 57 Asia-Pacific Floating Liquefied Natural Gas (FLNG) Market Forecast, 2022-2032 (USD Mn, AGR (%))
Figure 58 Asia-Pacific Floating Liquefied Natural Gas (FLNG) Market Forecast, 2022-2032 (USD Mn, AGR (%))
Figure 59 Asia-Pacific Floating Liquefied Natural Gas (FLNG) Market Forecast by Number of Vessels, 2022-2032 (Units, AGR (%))
Figure 60 Asia-Pacific Floating Liquefied Natural Gas (FLNG) Market Forecast by Type, 2022-2032 (Units, AGR (%))
Figure 61 Asia-Pacific Floating Liquefied Natural Gas (FLNG) Market by OPEX Type, 2022-2032 (USD Million, AGR (%))
Figure 62 Asia-Pacific Floating Liquefied Natural Gas (FLNG) Market by CAPEX Type, 2022-2032 (USD Million, AGR (%))
Figure 63 Asia-Pacific Floating Liquefied Natural Gas (FLNG) Market by Country, 2022-2032 (USD Mn, AGR (%))
Figure 64 Asia-Pacific Floating Liquefied Natural Gas (FLNG) Market by Country, 2022-2032 (Units, AGR (%))
Figure 65 China Floating Liquefied Natural Gas (FLNG) Market Forecast, 2022-2032 (USD Mn, AGR (%))
Figure 66 China Floating Liquefied Natural Gas (FLNG) Market Forecast, 2022-2032 (Units, AGR (%))
Figure 67 India Floating Liquefied Natural Gas (FLNG) Market Forecast, 2022-2032 (USD Mn, AGR (%))
Figure 68 India Floating Liquefied Natural Gas (FLNG) Market Forecast, 2022-2032 (Units, AGR (%))
Figure 69 Indonesia Floating Liquefied Natural Gas (FLNG) Market Forecast, 2022-2032 (USD Mn, AGR (%))
Figure 70 Indonesia Floating Liquefied Natural Gas (FLNG) Market Forecast, 2022-2032 (Units, AGR (%))
Figure 71 Rest of Asia-Pacific Floating Liquefied Natural Gas (FLNG) Market Forecast, 2022-2032 (USD Mn, AGR (%))
Figure 72 Rest of Asia-Pacific Floating Liquefied Natural Gas (FLNG) Market Forecast, 2022-2032 (Units, AGR (%))
Figure 73 Latin America Floating Liquefied Natural Gas (FLNG) Market Forecast, 2022-2032 (USD Mn, AGR (%))
Figure 74 Latin America Floating Liquefied Natural Gas (FLNG) Market Forecast, 2022-2032 (USD Mn, AGR (%))
Figure 75 Latin America Floating Liquefied Natural Gas (FLNG) Market Forecast by Number of Vessels, 2022-2032 (Units, AGR (%))
Figure 76 Latin America Floating Liquefied Natural Gas (FLNG) Market Forecast by Type, 2022-2032 (Units, AGR (%))
Figure 77 Latin America Floating Liquefied Natural Gas (FLNG) Market by OPEX Type, 2022-2032 (USD Million, AGR (%))
Figure 78 Latin America Floating Liquefied Natural Gas (FLNG) Market by CAPEX Type, 2022-2032 (USD Million, AGR (%))
Figure 79 Latin America Floating Liquefied Natural Gas (FLNG) Market by Country, 2022-2032 (USD Mn, AGR (%))
Figure 80 Latin America Floating Liquefied Natural Gas (FLNG) Market by Country, 2022-2032 (Units, AGR (%))
Figure 81 Brazil Floating Liquefied Natural Gas (FLNG) Market Forecast, 2022-2032 (USD Mn, AGR (%))
Figure 82 Brazil Floating Liquefied Natural Gas (FLNG) Market Forecast, 2022-2032 (Units, AGR (%))
Figure 83 Rest of Latin America Floating Liquefied Natural Gas (FLNG) Market Forecast, 2022-2032 (USD Mn, AGR (%))
Figure 84 Rest of Latin America Floating Liquefied Natural Gas (FLNG) Market Forecast, 2022-2032 (Units, AGR (%))
Figure 85 Middle East & Africa Floating Liquefied Natural Gas (FLNG) Market Forecast, 2022-2032 (USD Mn, AGR (%))
Figure 86 Middle East & Africa Floating Liquefied Natural Gas (FLNG) Market Forecast, 2022-2032 (USD Mn, AGR (%))
Figure 87 Middle East & Africa Floating Liquefied Natural Gas (FLNG) Market Forecast by Number of Vessels, 2022-2032 (Units, AGR (%))
Figure 88 Middle East & Africa Floating Liquefied Natural Gas (FLNG) Market Forecast by Type, 2022-2032 (Units, AGR (%))
Figure 89 Middle East & Africa Floating Liquefied Natural Gas (FLNG) Market by OPEX Type, 2022-2032 (USD Million, AGR (%))
Figure 90 Middle East & Africa Floating Liquefied Natural Gas (FLNG) Market by CAPEX Type, 2022-2032 (USD Million, AGR (%))
Figure 91 Middle East & Africa Floating Liquefied Natural Gas (FLNG) Market by Country, 2022-2032 (USD Mn, AGR (%))
Figure 92 Middle East & Africa Floating Liquefied Natural Gas (FLNG) Market by Country, 2022-2032 (Units, AGR (%))
Figure 93 Iran Floating Liquefied Natural Gas (FLNG) Market Forecast, 2022-2032 (USD Mn, AGR (%))
Figure 94 Iran Floating Liquefied Natural Gas (FLNG) Market Forecast, 2022-2032 (Units, AGR (%))
Figure 95 Angola Floating Liquefied Natural Gas (FLNG) Market Forecast, 2022-2032 (USD Mn, AGR (%))
Figure 96 Angola Floating Liquefied Natural Gas (FLNG) Market Forecast, 2022-2032 (Units, AGR (%))
Figure 97 Nigeria Floating Liquefied Natural Gas (FLNG) Market Forecast, 2022-2032 (USD Mn, AGR (%))
Figure 98 Nigeria Floating Liquefied Natural Gas (FLNG) Market Forecast, 2022-2032 (Units, AGR (%))
Figure 99 Ghana Floating Liquefied Natural Gas (FLNG) Market Forecast, 2022-2032 (USD Mn, AGR (%))
Figure 100 Ghana Floating Liquefied Natural Gas (FLNG) Market Forecast, 2022-2032 (Units, AGR (%))
Figure 101 Mauritania Floating Liquefied Natural Gas (FLNG) Market Forecast, 2022-2032 (USD Mn, AGR (%))
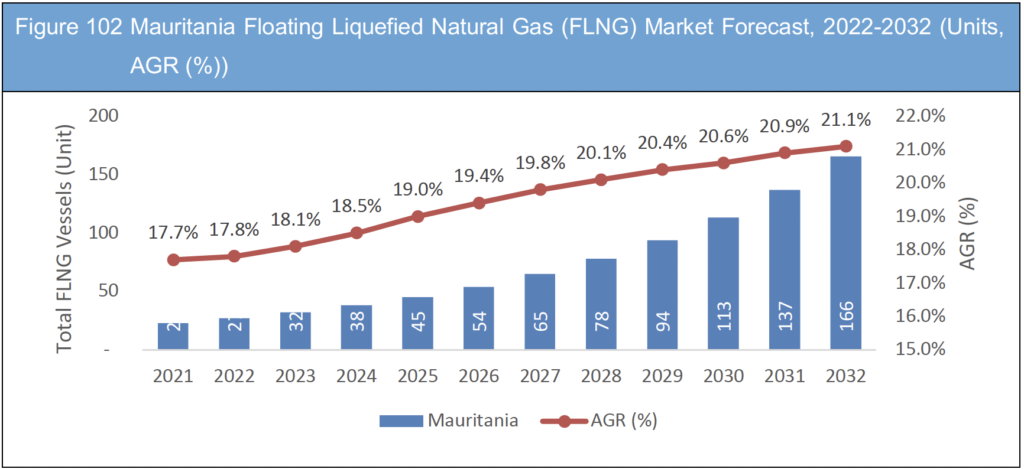
Figure 102 Mauritania Floating Liquefied Natural Gas (FLNG) Market Forecast, 2022-2032 (Units, AGR (%))
Figure 103 Rest of MEA Floating Liquefied Natural Gas (FLNG) Market Forecast, 2022-2032 (USD Mn, AGR (%))
Figure 104 Rest of MEA Floating Liquefied Natural Gas (FLNG) Market Forecast, 2022-2032 (Units, AGR (%))
Figure 105 Hyundai Heavy Industries Holdings Co Ltd.: Company Revenue 2017-2021 (US$Mn, AGR %)
Figure 106 Hyundai Heavy Industries Holdings Co Ltd: Company Operating Income 2017-2021 (US$Mn, AGR %)
Figure 107 Hyundai Heavy Industries Holdings Co Ltd: Company Net Income 2017-2021 (US$Mn, AGR %)
Figure 108 Hyundai Heavy Industries Holdings Co Ltd: Company EBITDA 2017-2021 (US$Mn, AGR %)
Figure 109 Samsung Heavy Industries Co Ltd..: Company Revenue 2017-2021 (US$Mn, AGR %)
Figure 110 Samsung Heavy Industries Co Ltd..: Company Operating Income 2017-2021 (US$Mn, AGR %)
Figure 111 Samsung Heavy Industries Co Ltd..: Company Net Income 2016-2020 (US$Mn, AGR %)
Figure 112 Samsung Heavy Industries Co Ltd.: Company EBITDA 2016-2020 (US$Mn, AGR %)
Figure 113 Daewoo Shipbuilding & Marine Engineering Co., Ltd: Company Revenue 2017-2021 (US$Mn, AGR %)
Figure 114 Daewoo Shipbuilding & Marine Engineering Co., Ltd: Company Operating Income 2017-2021 (US$Mn, AGR %)
Figure 115 Daewoo Shipbuilding & Marine Engineering Co., Ltd: Company Net Income 2017-2021 (US$Mn, AGR %)
Figure 116 Daewoo Shipbuilding & Marine Engineering Co., Ltd: Company EBITDA 2017-2021 (US$Mn, AGR %)
Figure 117 Petroleo Brasileiro S.A.: Company Revenue 2017-2021(US$Mn, AGR %)
Figure 118 Petroleo Brasileiro S.A.: Company Operating Income 2017-2021(US$Mn, AGR %)
Figure 119 Petroleo Brasileiro S.A.: Company Net Income 2017-2021(US$Mn, AGR %)
Figure 120 Petroleo Brasileiro S.A.: Company EBITDA 2017-2021(US$Mn, AGR %)
Figure 121 Royal Dutch Shell: Company Revenue 2017-20210(US$Mn, AGR %)
Figure 122 Royal Dutch Shell: Company Operating Income 2017-2021(US$Mn, AGR %)
Figure 123 Royal Dutch Shell: Company Net Income 2017-2021(US$Mn, AGR %)
Figure 124 Royal Dutch Shell: Company EBITDA 2017-2021(US$Mn, AGR %)
Figure 125 Hoegh LNG Partners LP: Company Revenue 2017-2021 (US$Mn, AGR %)
Figure 126 Hoegh LNG Partners LP: Company Operating Income 2017-2021 (US$Mn, AGR %)
Figure 127 Hoegh LNG Partners LP : Company Net Income 2017-2021 (US$Mn, AGR %)
Figure 128 Hoegh LNG Partners LP: Company EBITDA 2017-2021 (US$Mn, AGR %)
Figure 129 Golar LNG.: Company Revenue 2017-2021 (US$Mn, AGR %)
Figure 130 Golar LNG: Company Operating Income 2017-2021 (US$Mn, AGR %)
Figure 131 Golar LNG: Company Net Income 2017-2021 (US$Mn, AGR %)
Figure 132 Golar LNG: Company EBITDA 2017-2021 (US$Mn, AGR %)
Figure 133 Exxon Mobil Corporation.: Company Revenue 2017-2021(US$Mn, AGR %)
Figure 134 Exxon Mobil Corporation.: Company Operating Income 2017-2021(US$Mn, AGR %)
Figure 135 Exxon Mobil Corporation.: Company Net Income 2017-2021(US$Mn, AGR %)
Figure 136 Exxon Mobil Corporation.: Company EBITDA 2017-2021(US$Mn, AGR %)
Figure 137 Total SE.: Company Revenue 2017-2021 (US$Mn, AGR %)
Figure 138 Total SE.: Company Operating Income 2017-2021 (US$Mn, AGR %)
Figure 139 Total SE.: Company Net Income 2017-2021 (US$Mn, AGR %)
Figure 140 Total SE.: Company EBITDA 2017-2021 (US$Mn, AGR %)
Figure 141 Chevron Corporation.: Company Revenue 2017-2021(US$Mn, AGR %)
Figure 142 Chevron Corporation.: Company Operating Income 2017-2021(US$Mn, AGR %)
Figure 143 Chevron Corporation.: Company Net Income 2017-2021(US$Mn, AGR %)
Figure 144 Chevron Corporation: Company EBITDA 2017-2021(US$Mn, AGR %)
Figure 145 Equinor ASA.: Company Revenue 2017-2021 (US$Mn, AGR %)
Figure 146 Equinor ASA.: Company Operating Income 2017-2021 (US$Mn, AGR %)
Figure 147 Equinor ASA.: Company Net Income 2017-2021 (US$Mn, AGR %)
Figure 148 Equinor ASA.: Company EBITDA 2017-2021 (US$Mn, AGR %)
Figure 149 Exmar NV: Revenue 2017-2021 (US$Mn, AGR %)
Figure 150 Exmar NV: Operating Income 2017-2021 (US$Mn, AGR %)
Figure 151 Exmar NV: Net Income 2017-2021 (US$Mn, AGR %)
Figure 152 Exmar NV: EBITDA 2017-2021 (US$Mn, AGR %)
Figure 153 Woodside Petroleum Ltd: Company Revenue 2017-2021 (US$Mn, AGR %)
Figure 154 Woodside Petroleum Ltd: Company Operating Income 2017-2021 (US$Mn, AGR %)
Figure 155 Woodside Petroleum Ltd : Company Net Income 2017-2021 (US$Mn, AGR %)
Figure 156 Woodside Petroleum Ltd: Company EBITDA 2017-2021 (US$Mn, AGR %)
Figure 157 TechnipFMC Plc.: Company Revenue 2017-2021 (US$Mn, AGR %)
Figure 158 TechnipFMC Plc.: Company Operating Income 2017-2021 (US$Mn, AGR %)
Figure 159 TechnipFMC Plc.: Company Net Income 2017-2021 (US$Mn, AGR %)
Figure 160 TechnipFMC Plc.: Company EBITDA 2017-2021 (US$Mn, AGR %)
List of Companies Profiled in the report
Chevron Corporation
Daewoo Shipbuilding & Marine Engineering Co., Ltd
Equinor ASA
Excelerate Energy L.P.
Exmar NV
Exxon Mobil Corporation
Golar LNG
Hoegh LNG Partners LP
Hyundai Heavy Industries Holdings Co Ltd
Lloyds Energy
Petroleo Brasileiro S.A
Royal Dutch Shell
Samsung Heavy Industries Co Ltd.
TechnipFMC Plc
Total SE
Woodside Petroleum Ltd
List of Other Companies Mentioned in the report
AB Klaipedos Nafta
Abyss Aqua
AET
Air Products and Chemicals Inc
Aker Floating Production
Altagas
AMI International
AMSEC LLC
Anadarko
Asis Boats
Austal
Austal Fassmer Pty Ltd
Avner Oil & Gas Exploration
BAE Systems
Bangkok Dock Company
BC LNG
BCGP
Berlian Laju
BG Group Plc
BGT Limited
BHP Billiton
Black and Veatch
Blue Sky Langsa
BMT Defence Services Ltd
Bollinger Shipyards LLC
Bolognesi
BP
Browse Joint Venture
Brunswick Commercial & Government Products
Bumi Armada
BW Group
BW Maritime
BW Offshore
CACT
Canada Stewart Energy
CB&I Lummus
Chevron
China Shipbuilding Industry Corporation (CSIC)
CNOOC (China National Offshore Oil Corporation)
Colbún SA
Connor Industries
ConocoPhillips
Cotecmar
Cove Energy
Cove Point LNG
Cuu Long JOC
Daewoo Mangalia Heavy Industries (DMHI)
Daewoo Shipbuilding & Marine Engineering Co., Ltd
Daewoo Shipbuilding and Marine Engineering (DSME)
Damen Shipyards Group
Dana
DCEP Gas Management Ltd.
Delek Drilling
Delphin LNG
Department of Energy
DetNorske
Doris Engineering
Douglas Channel Energy Consortium (DCEC)
Douglas Channel Energy Partnership (DCEP)
Douglas Channel LNG Assets Partnership
Drydocks World
EDF (Électricité de France)
EDF Trading
Egas
Energy World International
ENI Group
ENI Partners
EnQuest
Excelerate Energy
Excelerate Liquefaction Solutions
Exmar
ExxonMobil
Fairwood Group
FassmerGmbh&Co.
FB Design
Fincantieri – Cantieri NavaliItaliani S.p.A.
FLEX LNG
FMC Technologies
Fr Lurssen Werft GmbH & Co.KG
Fr. Maritime Partner ASKG
Frontline
Garden Reach Shipbuilders & Engineers Ltd
Gas Sayago
Gastrade
Gazprom
Gazprom Marketing and Trading
GDF Suez
GE Oil & Gas
General Dynamics Bath Iron Works
General Dynamics Corporation
Goa Shipyard Limited
Golar LNG
Golar LNG Partners
Granherne
Grassy Point Projects
Gulf Coast Shipyard Group, Inc.
Haisla Nation
Hess
Höegh LNG
Höegh LNG Holdings Ltd.
Hudong Zhonghua
Huntington Ingalls Industries Inc.
Husky
Hyundai Heavy Industries (HHI)
Hyundai Heavy Industries Co., Ltd.
ICBC
Idemitsu Kosan
IHI Shipbuilding (IHI)
Indonesian government
INPEX Corporation (INPEX)
Irving Shipbuilding of Canada
Isramco Negev 2 Limited Partnership
JGC Corporation
KBR
Keppel Offshore and Marine (Keppel)
Kinsault Energy
Kogas
Leif Höegh & Co
Leviathan Partners
Linde Engineering
Linde Group
Linde Process Plants Inc.
LNG Partners
LOMOcean Design Ltd.
Lonestar FLNG
LTL Group (Lanka Transformer Ltd Group)
M3nergy
Maersk O&G
Marine Alutech
Maritime Partner AS
Meridian Holdings Co.
MIMI - Mitsubishi and Mitsui's Japan Australia LNG joint venture
MISC
Mitsubishi
Mitsui Japan Australia LNG
Mitsui O.S.K. Lines (MOL)
MODEC Inc.
MOL
Murphy Oil
Navantia SA
Noble Energy
Oil and Natural Gas Corp. Ltd (ONGC)
OLT Offshore
Ophir Energy Plc
Orca LNG
Osaka Gas
Pangea LNG
Peninsula Group
Perenco Cameroon
Perisai
Petrobras
Petromin LNG
Petronas
PNG FLNG
Port Meridian Energy Ltd.
Premier Oil
Quadrant
Reliance Industries Limited
Rosneft
Royal Dutch Shell
Rubicon
RWE Group
SAFE Boats International (SBI)
Saipem
Samsung
Samsung Heavy Industries (SHI)
Samwoo Heavy Industries Co., Ltd
Santos
SBM Offshore
Sembawang
Sevan Marine
Shebah Exploration and Production
Shinhan Heavy Industries Co., Ltd
SNH
Sonangol
South Boats IOW Ltd.
Star Energy
Sunbird Yacht Co., Ltd
Suncor Energy
Swan Energy
Swiftships
Tamar Partnership
Technip
Teekay Corporation
Tokyo Gas
Toyo Engineering
Vietsopetro
Willard Marine, Inc.
Wison Group
Wison Offshore and Marine
Woodside Petroleum
Yantai Port Group Ltd
List of Associations Mentioned in the Report
American Bureau of Shipping (ABS)
Ceylon Electricity Board (CEB)
China Ship Research & Development Institute
Comité Maritime International (CMI)
European Maritime Safety Agency
Institute of Marine Engineering, Science & Technology (IMarEST)
Israel Electricity Corporation
Japanese Ministry of Land, Infrastructure, Transportation and Tourism
Jordan Ministry of Energy
Marine Design Research Institute of China (MARIC)
Monohakobi Technology Institute
Norwegian Forum for Autonomous Ships (NFAS)
Norwegian Maritime Authority (NMA)
One Sea
Pertamina – State Oil Company of Indonesia
Petrobangla – National Oil Company of Bangladesh
PetroSA
Petrovietnam
PGN (Perusahaan Gas Negara PGN)
PTTEP (Exploration and Production Division of the National Oil Company of Thailand)
Shanghai Marine Diesel Engine Research Institute
Shanghai Merchant Ship Design and Research Institute (SDARI)
Statoil (Equinor)
Tokyo University of Marine Science and Technology
Unmanned Cargo Ship Development Alliance
World BankChina Classification Society
Wuhan University of Technology
Zhuhai government
 Market Report 2022-2032")