• The COVID-19 shutdown put on hold all seven geothermal projects in Turkey for the production of electricity
• Supply chain interruptions due to the coronavirus pandemic brought seven projects of 100 MW in total to a halt.
How to break through the COVID-19 bottleneck? This report analyses four recovery pathways and helps you to make decision based on our analysis.
To access the data contained in this document please email contactus@visiongain.com
Geothermal Power Market–our new study reveals trends, R&D progress, and predicted revenues
• The rapid growth in investments in renewable power generation capacities is a major driver for the geothermal power market during the forecast period.
• Economic development globally boosted manufacturing activity, thereby increasing the demand for electricity.
• Low operating costs associated with geothermal electricity generation is expected to drive the market in future.
If you read only 1 geothermal report this year – this is the report you need to read. Take a look at our report on geothermal power. It’ll give you an idea of what activities are in the global market and how you can leverage your products and services to generate revenue.
Key questions answered in this exclusive report are:
• What are the implication to contract prices of geothermal power projects taking place now and over the next 10 years?
• Where is the geothermal power market heading? And how can you ensure you are at the forefront of the market?
You need to discover how this will impact the geothermal power market today, and over the next 10 years:
• Our 441-page report provides 311 tables and 254 charts/graphs exclusively to you.
• The report highlights key lucrative areas in the industry so you can target them – NOW.
• Contains in-depth analyse of global, regional and national sales and growth
• Highlights for you the key successful trends, changes and revenue projections made by your competitors
This report tells you TODAY how the Geothermal Power market will develop in the next 10 years, and in-line with the variations in COVID-19 economic recession and bounce. This market is more critical now than at any point over the last 10 years.
Forecasts to 2031 and other analyses reveal the commercial prospects
• In addition to revenue forecasting to 2031, our new study provides you with recent results, growth rates, and market shares.
• You find original analyses, with business outlooks and developments.
• Discover qualitative analyses (including market dynamics, drivers, opportunities, restraints and challenges), cost structure, impact of COVID on geothermal project profiles and recent developments.
This report includes data analysis and invaluable insight into how COVID-19 will affect your industry. Four COVID-19 recovery patterns and their impact, namely, V, L, W and U are discussed in this report.
Global Geothermal Power Market by Resource Type (COVID Impact Analysis)
• Convective Hydrothermal
• Sedimentary Basin
• Geo-pressured
• Radiogenic
• Solidified Hot Dry Rock
• Part Still Molten Magma
Global Geothermal Power Market By Technology (COVID Impact Analysis)
• Ground Source Heat Pumps
• Direct-Use Geothermal
• Deep Geothermal Systems
• Enhanced Geothermal Systems
Global Geothermal Power Market By Power Station Type (COVID Impact Analysis)
• Flash Steam Power Stations
• Dry Steam Power Stations
• Binary Cycle Power Stations
Global Geothermal Power Market By End-Use (COVID Impact Analysis)
• Residential
• Commercial
• Industrial
• Other End-User

In addition to the revenue predictions for the overall world market and segments, you will also find revenue forecasts for 4 regional and 20 leading national markets:
• Americas Geothermal Power Market, 2021 to 2031 Market Outlook
– U.S. Geothermal Power Market, 2021 to 2031 Market Forecast & COVID Impact Analysis
– Mexico Geothermal Power Market, 2021 to 2031 Market Forecast & COVID Impact Analysis
– Costa Rica Geothermal Power Market, 2021 to 2031 Market Forecast & COVID Impact Analysis
– El Salvador Geothermal Power Market, 2021 to 2031 Market Forecast & COVID Impact Analysis
– Nicaragua Geothermal Power Market, 2021 to 2031 Market Forecast & COVID Impact Analysis
– Guatemala Geothermal Power Market, 2021 to 2031 Market Forecast & COVID Impact Analysis
– Rest of Americas Geothermal Power Market, 2021 to 2031 Market Forecast & COVID Impact Analysis
• Europe Geothermal Power Market, 2021 to 2031 Market Outlook
– Italy Geothermal Power Market, 2021 to 2031 Market Forecast & COVID Impact Analysis
– Russia Geothermal Power Market, 2021 to 2031 Market Forecast & COVID Impact Analysis
– Iceland Geothermal Power Market, 2021 to 2031 Market Forecast & COVID Impact Analysis
– Germany Geothermal Power Market, 2021 to 2031 Market Forecast & COVID Impact Analysis
– France Geothermal Power Market, 2021 to 2031 Market Forecast & COVID Impact Analysis
– Rest of Europe Geothermal Power Market, 2021 to 2031 Market Forecast & COVID Impact Analysis
• Asia Pacific Geothermal Power Market, 2021 to 2031 Market Outlook
– China Geothermal Power Market, 2021 to 2031 Market Forecast & COVID Impact Analysis
– Indonesia Geothermal Power Market, 2021 to 2031 Market Forecast & COVID Impact Analysis
– Philippines Geothermal Power Market, 2021 to 2031 Market Forecast & COVID Impact Analysis
– New Zealand Geothermal Power Market, 2021 to 2031 Market Forecast & COVID Impact Analysis
– Japan Geothermal Power Market, 2021 to 2031 Market Forecast & COVID Impact Analysis
– Rest of Asia Pacific Geothermal Power Market, 2021 to 2031 Market Forecast & COVID Impact Analysis
• LAMEA Geothermal Power Market, 2021 to 2031 Market Outlook
– Turkey Geothermal Power Market, 2021 to 2031 Market Forecast & COVID Impact Analysis
– Kenya Geothermal Power Market, 2021 to 2031 Market Forecast & COVID Impact Analysis
– Ethiopia mal Power Market, 2021 to 2031 Market Forecast & COVID Impact Analysis
– Rest of World Geothermal Power Market, 2021 to 2031 Market Forecast & COVID Impact Analysis
Need industry data? Please contact us today.
The report also includes profiles and for some of the leading companies in the Geothermal Power Market, 2021 to 2031 Market, with a focus on this segment of these companies’ operations.
Leading companies and the potential for market growth
• Kenya Electricity Generating Company Limited
• Electra Therm Inc.
• Ormat Technologies, Inc.
• Ansaldo Energia
• General Electric Company
• Toshiba Corporation
• Fuji Electric Co., Ltd.
• Halliburton Company
• Enel SpA
• John Wood Group PLC
• Calpine Corporation
• Terra-Gen Company
• Berkshire Hathaway Energy
• Mitsubishi Heavy Industries Limited
• Chevron Corporation
• PT Pertamina Geothermal Energy
• Innergex Renewable Energy Inc.
Overall world revenue for Geothermal Power Market, 2021 to 2031 Market will surpass 15.9 GWe in 2020, our work calculates. We predict strong revenue growth through to 2031. Our work identifies which organizations hold the greatest potential. Discover their capabilities, progress, and commercial prospects, helping you stay ahead.
How the Geothermal Power Market, 2021 to 2031 Market report helps you?
In summary, our 440+ page report provides you with the following knowledge:
• Revenue forecasts to 2031 for Geothermal Power Market, 2021 to 2031 Market, with forecasts for Resource Type, Technology, End-Use, Power Station Type each forecasted at a global and regional level– discover the industry’s prospects, finding the most lucrative places for investments and revenues
• Revenue forecasts to 2031 for 5 regional and 20 key national markets – See forecasts for the Geothermal Power Market, 2021 to 2031 market in Americas, Europe, Asia-Pacific and LAMEA. Also forecasted is the market in the US, Mexico, Cost Rica, Germany, France, UK, Italy, Spain, China, Philippines, Indonesia, Japan, and New Zealand among other prominent economies.
• Prospects for established firms and those seeking to enter the market– including company profiles for 15 of the major companies involved in the Geothermal Power Market, 2021 to 2031 Market.
Find quantitative and qualitative analyses with independent predictions. Receive information that only our report contains, staying informed with this invaluable business intelligence.
Information found nowhere else
With our newly report title, you are less likely to fall behind in knowledge or miss out on opportunities. See how our work could benefit your research, analyses, and decisions.
Visiongain’s study is for everybody needing commercial analyses for the Geothermal Power Market, 2021 to 2031 Market and leading companies. You will find data, trends and predictions.
To access the data contained in this document please email contactus@visiongain.com
Buy our report today Geothermal Power Market Report 2021-2031: Forecasts by Resource Type (Convective Hydrothermal, Sedimentary Basin, Geo-pressured, Radiogenic, Solidified Hot Dry Rock, Part Still Molten Magma, Other Resource Type), by Technology (Ground Source Heat Pumps, Direct-Use Geothermal, Deep Geothermal Systems, Enhanced Geothermal Systems), by End-use (Residential, Commercial, Industrial, Other End-User), by Power Station Type (Flash Steam Power Stations, Dry Steam Power Stations, Binary Cycle Power Stations) AND Regional and Leading National Market Analysis PLUS Analysis of Leading Geothermal Power Companies AND COVID-19 Recovery Scenarios. Avoid missing out by staying informed – order our report now.
Visiongain is a trading partner with the US Federal Government
CCR Ref number: KD4R6
Do you have any custom requirements we can help you with? Any need for a specific country, geo region, market segment or specific company information? Contact us today, we can discuss your needs and see how we can help: sara.peerun@visiongain.com
1 Report Overview
1.1 Why You Should Buy This Report
1.2 How This Report Delivers
1.3 Key Questions Answered by This Analytical Report Include:
1.4 Who is This Report For?
1.5 Methodology
1.5.1 Primary Research
1.5.2 Secondary Research
1.6 Market Evaluation & Forecasting Methodology
1.7 COIVD-19 Impact Recovery Pattern Analysis
1.7.1 V-Shaped Recovery
1.7.2 U-Shaped Recovery
1.7.3 W-Shaped Recovery
1.7.4 L-Shaped Recovery
1.8 Frequently Asked Questions (FAQ)
1.9 Associated Visiongain Reports
1.10 About Visiongain
2 Executive Summary
2.1 Key Takeaways
3 Geothermal Power Generation Industry Overview
3.1 Description of Geothermal Resource Categories
3.2 Hydrothermal
3.3 Deep Geothermal Systems
3.4 Basic Geothermal Technology
3.5 Direct Use
3.6 Geothermal Heat Pumps
3.7 Geo-pressured Resources
3.8 Co-Produced Geothermal Fluids
3.9 Process Used
3.10 Value Chain
3.11 Distribution Channels for Electricity Generated Geothermally
3.12 Investment Cost for Geothermal Power Plants
3.12.1 Development Strategy
3.12.2 Capacity Factor
3.12.3 Cost Parameters
4 Market Dynamics
4.1 What’s Driving the Global Geothermal Power Market?
4.1.1 Increasing Investments in RenewablePowerGeneration
4.1.2 Rising Energy Demand
4.1.3 Low Operating Costs
4.1.4 Economic Growth
4.1.5 Technological Developments
4.2 Restraints on the Market
4.2.1 Environmental Concerns
4.2.2 High Initial Investment Costs
4.2.3 Geological Requirements
4.2.4 Increasing Trade Protectionism
4.2.5 Sustainability Issues
4.2.6 Environmental Issues
4.3 Market Development
4.4 SWOT Analysis of Geothermal Power Market
4.4.1 Strengths of Geothermal Power Generation Market
4.4.2 Weaknesses of Geothermal Power Generation Market
4.4.3 Opportunities in the Geothermal Power Generation Market
4.4.4 Threats in the Geothermal Power Generation Market
4.5 Porter’s Five Forces Analysis
4.5.1 Implications of Porter Five Forces on geothermal companies
4.5.2 Threats of New Entrants (Moderate)
4.6 Bargaining Power of Suppliers (High)
4.7 Bargaining Power of Buyers (Low)
4.8 Threats of Substitute Products or Services (High)
4.9 Rivalry among the Existing Competitors (Moderate)
4.10 PESTLE Analysis of Geothermal Power Market
4.10.1 Political Factors Affecting Geothermal Market
4.10.2 Economic Factors Affecting Geothermal Market
4.10.3 Social Factors Affecting Geothermal Market
4.10.4 Technical Factors Affecting Geothermal Market
4.10.5 Legal Factors Affecting Geothermal Market
4.10.6 Environmental Factors Affecting Geothermal Market
5 Global Geothermal Power Market Analysis
5.1 Global Market Analysis by Generation Capacity (V, W, U, and L Shaped COVID Recovery Analysis)
5.2 Global Market Analysis by Region (V, W, U, and L Shaped COVID Recovery Analysis)
5.3 Global Market Analysis by Resource Type (V, W, U, and L Shaped COVID Recovery Analysis)
5.4 Global Market Analysis by Technology (V, W, U, and L Shaped COVID Recovery Analysis)
5.5 Global Market Analysis by End-User (V, W, U, and L Shaped COVID Recovery Analysis)
5.6 Global Market Analysis by Power Station Type (V, W, U, and L Shaped COVID Recovery Analysis)
6 Americas Geothermal Power Market Analysis
6.1 Americas Market Analysis by Power Generation Capacity (V, W, U, L-Shaped COVID Recovery Analysis)
6.2 Americas Market Analysis by Country (V, W, U, L-Shaped COVID Recovery Analysis)
6.2.1 U.S.A. Geothermal Power Market Overview
6.2.2 Mexico Geothermal Power Market Overview
6.2.3 Costa Rica Geothermal Power Market Overview
6.2.4 El Salvador Geothermal Power Market Overview
6.2.5 Nicaragua Geothermal Power Market Overview
6.2.6 Guatemala Geothermal Power Market Overview
6.2.7 Rest of Americas Geothermal Power Market Overview
6.3 Americas Market Analysis by Resource Type (V, W, U, L-Shaped COVID Recovery Analysis)
6.4 Americas Market Analysis by Technology (V, W, U, L-Shaped COVID Recovery Analysis)
6.5 Americas Market Analysis by End-User (V, W, U, L-Shaped COVID Recovery Analysis)
6.6 Americas Market Analysis by Power Station Type (V, W, U, L-Shaped COVID Recovery Analysis)
7 Europe Geothermal Power Market Analysis
7.1 Europe Market Analysis by Power Generation Capacity (V, W, U, L-Shaped COVID Recovery Analysis)
7.2 Europe Market Analysis by Country (V, W, U, L-Shaped COVID Recovery Analysis)
7.2.1 Italy Geothermal Power Market Overview
7.2.2 Iceland Geothermal Power Market Overview
7.2.3 Russia Geothermal Power Market Overview
7.2.4 Germany Geothermal Power Market Overview
7.2.5 France Geothermal Power Market Overview
7.2.6 Rest of Europe Geothermal Power Market Overview
7.3 Europe Market Analysis by Resource Type (V, W, U, L-Shaped COVID Recovery Analysis)
7.4 Europe Market Analysis by Technology (V, W, U, L-Shaped COVID Recovery Analysis
7.5 Europe Market Analysis by End-Use (V, W, U, L-Shaped COVID Recovery Analysis)
7.6 Europe Market Analysis by Power Station Type (V, W, U, L-Shaped COVID Recovery Analysis)
8 Asia-Pacific Geothermal Power Market Analysis
8.1 Asia-Pacific Market Analysis by Power Generation Capacity (V, W, U, L-Shaped COVID Recovery Analysis)
8.2 Asia-Pacific Market Analysis by Country (V, W, U, L-Shaped COVID Recovery Analysis)
8.2.1 Indonesia Geothermal Power Market Overview
8.2.2 Philippines Geothermal Power Market Overview
8.2.3 New Zealand Geothermal Power Market Overview
8.2.4 Japan Geothermal Power Market Overview
8.2.5 China Geothermal Power Market Overview
8.2.6 Rest of Asia-Pacific Geothermal Power Market
8.3 Asia-Pacific Market Analysis by Resource Type (V, W, U, L-Shaped COVID Recovery Analysis)
8.4 Asia-Pacific Market Analysis by Technology (V, W, U, L-Shaped COVID Recovery Analysis)
8.5 Asia-Pacific Market Analysis by End-User (V, W, U, L-Shaped COVID Recovery Analysis)
8.6 Asia-Pacific Market Analysis by Power Station Type (V, W, U, L-Shaped COVID Recovery Analysis)
9 Rest of World Geothermal Power Market Analysis
9.1 Rest of World Market Analysis by Power Generation Capacity (V, W, U, L-Shaped COVID Recovery Analysis)
9.2 Rest of World Market Analysis by Country (V, W, U, L-Shaped COVID Recovery Analysis)
9.2.1 Turkey Geothermal Power Market Overview
9.2.2 Kenya Geothermal Power Market Overview
9.2.3 Ethiopia Geothermal Power Market Overview
9.2.4 Rest of the World Geothermal Power Market Overview
9.3 Rest of World Market Analysis by Resource Type (V, W, U, L-Shaped COVID Recovery Analysis)
9.4 Rest of World Market Analysis by Technology (V, W, U, L-Shaped COVID Recovery Analysis)
9.5 Rest of World Market Analysis by End-User (V, W, U, L-Shaped COVID Recovery Analysis)
9.6 Rest of World Market Analysis by Power Station Type (V, W, U, L-Shaped COVID Recovery Analysis)
10 Leading Company Profiles
10.1 Atlas Copco Group Company
10.1.1 Company Information
10.1.2 Company Overview
10.1.3 Company Financial Profile
10.1.4 Company Product Offerings
10.1.5 Company Recent Developments
10.2 Kenya Electricity Generating Company Company
10.2.1 Company Information
10.2.2 Company Overview
10.2.3 Company Financial Profile
10.2.4 Company Product Offerings
10.2.5 Company Recent Developments
10.3 Electra therm, Inc. Company
10.3.1 Company Information
10.3.2 Company Overview
10.3.3 Company Product Offerings
10.3.4 Company Recent Developments
10.4 Ormat Technologies, Inc. Company
10.4.1 Company Information
10.4.2 Company Overview
10.4.3 Company Financial Profile
10.4.4 Company Product Offerings
10.4.5 Company Recent Developments
10.5 Ansaldo Energia Company
10.5.1 Company Information
10.5.2 Company Overview
10.5.3 Company Product Offerings
10.6 General Electric Company
10.6.1 Company Information
10.6.2 Company Overview
10.6.3 Company Financial Profile
10.6.4 Company Product Offerings
10.6.5 Company Recent Developments
10.7 Toshiba Corporation Company
10.7.1 Company Information
10.7.2 Company Overview
10.7.3 Company Financial Profile
10.7.4 Company Product Offerings
10.7.5 Company Recent Developments
10.8 Fuji Electric Co. Ltd Company
10.8.1 Company Information
10.8.2 Company Overview
10.8.3 Company Financial Profile
10.8.4 Company Product Offerings
10.8.5 Company Recent Developments
10.9 Halliburton Company Company
10.9.1 Company Information
10.9.2 Company Overview
10.9.3 Company Financial Profile
10.9.4 Company Product Offerings
10.9.5 Company Recent Developments
10.10 Enel S.P.A Company
10.10.1 Company Information
10.10.2 Company Overview
10.10.3 Company Financial Profile
10.10.4 Company Product Offerings
10.10.5 Company Recent Developments
10.11 Ethos Energy Group (John Wood Group Company)
10.11.1 Company Information
10.11.2 Company Overview
10.11.3 Company Financial Profile
10.11.4 Company Product Offerings
10.11.5 Company Recent Developments
10.12 Calpine Corporation Company
10.12.1 Company Information
10.12.2 Company Overview
10.12.3 Company Product Offerings
10.12.4 Company Recent Developments
10.13 Terra-Gen LLC Company
10.13.1 Company Information
10.13.2 Company Overview
10.13.3 Company Product Offerings
10.14 Berkshire Hathaway Energy: Company
10.14.1 Company Information
10.14.2 Company Overview
10.14.3 Company Financial Profile
10.14.4 Company Product Offerings
10.14.5 Company Recent Developments
10.15 Mitsubishi Heavy Industries Limited Company
10.15.1 Company Information
10.15.2 Company Overview
10.15.3 Company Financial Profile
10.15.4 Company Product Offerings
10.15.5 Company Recent Developments
10.16 Chevron Corporation Company
10.16.1 Company Information
10.16.2 Company Overview
10.16.3 Company Financial Profile
10.16.4 Company Product Offerings
10.16.5 Company Recent Developments
10.17 PT Pertamina Geothermal Energy Company
10.17.1 Company Information
10.17.2 Company Overview
10.17.3 Company Product Offerings
10.17.4 Company Recent Developments
10.18 Innergex Renewable Energy Inc Company
10.18.1 Company Information
10.18.2 Company Overview
10.18.3 Company Financial Profile
10.18.4 Company Product Offerings
10.18.5 Company Recent Developments
11 Conclusion
12 Glossary
List of Figure
Figure 1.1 Global Geothermal Power Market by Generation Capacity Forecast 2021-2031 (Gigawatt Electrical, AGR %)
Figure 3.1 llustration of a hydrothermal reservoir, showing the natural recharge, fractures, and heat source
Figure 3.2 A Schematic Of A Typical Binary Geothermal Power Plant, Including The Pathways Of The Fluids.
Figure 3.3 Sample cost per kW of geothermal energy developmental stages (typical 50 MW plant)
Figure 5.1 Global Geothermal Power Market by Generation Capacity Forecast 2021-2031 (Gigawatt Electrical, AGR %)
Figure 5.2 Global Geothermal Power Market by Generation Capacity Forecast 2021-2031 (Gigawatt Electrical, AGR %) (V-Shaped Recovery)
Figure 5.3 Global Geothermal Power Market by Generation Capacity Forecast 2021-2031 (Gigawatt Electrical, AGR %) (W-Shaped Recovery)
Figure 5.4 Global Geothermal Power Market by Generation Capacity Forecast 2021-2031 (Gigawatt Electrical, AGR %) (U-Shaped Recovery)
Figure 5.5 Global Geothermal Power Market by Generation Capacity Forecast 2021-2031 (Gigawatt Electrical, AGR %) (L-Shaped Recovery)
Figure 5.6 Global Geothermal Power Market by Region Forecast 2021-2031 (Gigawatt Electrical, AGR %)
Figure 5.7 Global Geothermal Power Market by Region Forecast 2021-2031 (Gigawatt Electrical, AGR %) (V-Shaped Recovery)
Figure 5.8 Global Geothermal Power Market by Region Forecast 2021-2031 (Gigawatt Electrical, AGR %) (W-Shaped Recovery)
Figure 5.9 Global Geothermal Power Market by Region Forecast 2021-2031 (Gigawatt Electrical, AGR %) (U-Shaped Recovery)
Figure 5.10 Global Geothermal Power Market by Region Forecast 2021-2031 (Gigawatt Electrical, AGR %) (L-Shaped Recovery)
Figure 5.11 Global Geothermal Power Market by Resource Type Forecast 2021-2031 (Gigawatt Electrical, AGR %)
Figure 5.12 Global Geothermal Power Market by Resource Type Forecast 2021-2031 (Gigawatt Electrical, AGR %) (V-Shaped Recovery)
Figure 5.13 Global Geothermal Power Market by Resource Type Forecast 2021-2031 (Gigawatt Electrical, AGR %) (W-Shaped Recovery)
Figure 5.14 Global Geothermal Power Market by Resource Type Forecast 2021-2031 (Gigawatt Electrical, AGR %) (U-Shaped Recovery)
Figure 5.15 Global Geothermal Power Market by Resource Type Forecast 2021-2031 (Gigawatt Electrical, AGR %) (L-Shaped Recovery)
Figure 5.16 Global Geothermal Power Market by Technology Forecast 2021-2031 (Gigawatt Electrical, AGR %)
Figure 5.17 Global Geothermal Power Market by Technology Forecast 2021-2031 (Gigawatt Electrical, AGR %) (V-Shaped Recovery)
Figure 5.18 Global Geothermal Power Market by Technology Forecast 2021-2031 (Gigawatt Electrical, AGR %) (W-Shaped Recovery)
Figure 5.19 Global Geothermal Power Market by Technology Forecast 2021-2031 (Gigawatt Electrical, AGR %) (U-Shaped Recovery)
Figure 5.20 Global Geothermal Power Market by Technology Forecast 2021-2031 (Gigawatt Electrical, AGR %) (L-Shaped Recovery)
Figure 5.21 Global Geothermal Power Market by End-User Forecast 2021-2031 (Gigawatt Electrical, AGR %)
Figure 5.22 Global Geothermal Power Market by End-User Forecast 2021-2031 (Gigawatt Electrical, AGR %) (V-Shaped Recovery)
Figure 5.23 Global Geothermal Power Market by End-User Forecast 2021-2031 (Gigawatt Electrical, AGR %) (W-Shaped Recovery)
Figure 5.24 Global Geothermal Power Market by End-User Forecast 2021-2031 (Gigawatt Electrical, AGR %) (U-Shaped Recovery)
Figure 5.25 Global Geothermal Power Market by End-User Forecast 2021-2031 (Gigawatt Electrical, AGR %) (L-Shaped Recovery)
Figure 5.26 Global Geothermal Power Market by Power Station Type Forecast 2021-2031 (Gigawatt Electrical, AGR %)
Figure 5.27 Global Geothermal Power Market by Power Station Type Forecast 2021-2031 (Gigawatt Electrical, AGR %) (V-Shaped Recovery)
Figure 5.28 Global Geothermal Power Market by Power Station Type Forecast 2021-2031 (Gigawatt Electrical, AGR %) (W-Shaped Recovery)
Figure 5.29 Global Geothermal Power Market by Power Station Type Forecast 2021-2031 (Gigawatt Electrical, AGR %) (U-Shaped Recovery)
Figure 5.30 Global Geothermal Power Market by Power Station Type Forecast 2021-2031 (Gigawatt Electrical, AGR %) (L-Shaped Recovery)
Figure 6.1 Americas Geothermal Power Market by Generation Capacity Forecast 2021-2031 (Gigawatt Electrical, AGR %)
Figure 6.2 Americas Geothermal Power Market by Generation Capacity Forecast 2021-2031 (Gigawatt Electrical, AGR %) (V-Shaped Recovery)
Figure 6.3 Americas Geothermal Power Market by Generation Capacity Forecast 2021-2031 (Gigawatt Electrical, AGR %) (W-Shaped Recovery)
Figure 6.4 Americas Geothermal Power Market by Generation Capacity Forecast 2021-2031 (Gigawatt Electrical, AGR %) (U-Shaped Recovery)
Figure 6.5 Americas Geothermal Power Market by Generation Capacity Forecast 2021-2031 (Gigawatt Electrical, AGR %) (L-Shaped Recovery)
Figure 6.6 Americas Geothermal Power Market by Country Forecast 2021-2031 (Gigawatt Electrical, AGR %)
Figure 6.7 Americas Geothermal Power Market by Country Forecast 2021-2031 (Gigawatt Electrical, AGR %) (V-Shaped Recovery)
Figure 6.8 Americas Geothermal Power Market by Country Forecast 2021-2031 (Gigawatt Electrical, AGR %) (W-Shaped Recovery)
Figure 6.9 Americas Geothermal Power Market by Country Forecast 2021-2031 (Gigawatt Electrical, AGR %) (U-Shaped Recovery)
Figure 6.10 Americas Geothermal Power Market by Country Forecast 2021-2031 (Gigawatt Electrical, AGR %) (L-Shaped Recovery)
Figure 6.11 US Geothermal Power Market by Generation Capacity Forecast 2021-2031 (Gigawatt Electrical, AGR %)
Figure 6.12 US Geothermal Power Market by Generation Capacity Forecast 2021-2031 (Gigawatt Electrical, AGR %) (V-Shaped Recovery)
Figure 6.13 US Geothermal Power Market by Generation Capacity Forecast 2021-2031 (Gigawatt Electrical, AGR %) (W-Shaped Recovery)
Figure 6.14 US Geothermal Power Market by Generation Capacity Forecast 2021-2031 (Gigawatt Electrical, AGR %) (U-Shaped Recovery)
Figure 6.15 US Geothermal Power Market by Generation Capacity Forecast 2021-2031 (Gigawatt Electrical, AGR %) (L-Shaped Recovery)
Figure 6.16 Mexico Geothermal Power Market by Generation Capacity Forecast 2021-2031 (Gigawatt Electrical, AGR %)
Figure 6.17 Mexico Geothermal Power Market by Generation Capacity Forecast 2021-2031 (Gigawatt Electrical, AGR %) (V-Shaped Recovery)
Figure 6.18 Mexico Geothermal Power Market by Generation Capacity Forecast 2021-2031 (Gigawatt Electrical, AGR %) (W-Shaped Recovery)
Figure 6.19 Mexico Geothermal Power Market by Generation Capacity Forecast 2021-2031 (Gigawatt Electrical, AGR %) (U-Shaped Recovery)
Figure 6.20 Mexico Geothermal Power Market by Generation Capacity Forecast 2021-2031 (Gigawatt Electrical, AGR %) (L-Shaped Recovery)
Figure 6.21 Costa Rica Geothermal Power Market by Generation Capacity Forecast 2021-2031 (Gigawatt Electrical, AGR %)
Figure 6.22 Costa Rica Geothermal Power Market by Generation Capacity Forecast 2021-2031 (Gigawatt Electrical, AGR %) (V-Shaped Recovery)
Figure 6.23 Costa Rica Geothermal Power Market by Generation Capacity Forecast 2021-2031 (Gigawatt Electrical, AGR %) (W-Shaped Recovery)
Figure 6.24 Costa Rica Geothermal Power Market by Generation Capacity Forecast 2021-2031 (Gigawatt Electrical, AGR %) (U-Shaped Recovery)
Figure 6.25 Costa Rica Geothermal Power Market by Generation Capacity Forecast 2021-2031 (Gigawatt Electrical, AGR %) (L-Shaped Recovery)
Figure 6.26 El Salvador Geothermal Power Market by Generation Capacity Forecast 2021-2031 (Gigawatt Electrical, AGR %)
Figure 6.27 El Salvador Geothermal Power Market by Generation Capacity Forecast 2021-2031 (Gigawatt Electrical, AGR %) (V-Shaped Recovery)
Figure 6.28 El Salvador Geothermal Power Market by Generation Capacity Forecast 2021-2031 (Gigawatt Electrical, AGR %) (W-Shaped Recovery)
Figure 6.29 El Salvador Geothermal Power Market by Generation Capacity Forecast 2021-2031 (Gigawatt Electrical, AGR %) (U-Shaped Recovery)
Figure 6.30 El Salvador Geothermal Power Market by Generation Capacity Forecast 2021-2031 (Gigawatt Electrical, AGR %) (L-Shaped Recovery)
Figure 6.31 Nicaragua Geothermal Power Market by Generation Capacity Forecast 2021-2031 (Gigawatt Electrical, AGR %)
Figure 6.32 Nicaragua Geothermal Power Market by Generation Capacity Forecast 2021-2031 (Gigawatt Electrical, AGR %) (V-Shaped Recovery)
Figure 6.33 Nicaragua Geothermal Power Market by Generation Capacity Forecast 2021-2031 (Gigawatt Electrical, AGR %) (W-Shaped Recovery)
Figure 6.34 Nicaragua Geothermal Power Market by Generation Capacity Forecast 2021-2031 (Gigawatt Electrical, AGR %) (U-Shaped Recovery)
Figure 6.35 Nicaragua Geothermal Power Market by Generation Capacity Forecast 2021-2031 (Gigawatt Electrical, AGR %) (L-Shaped Recovery)
Figure 6.36 Guatemala Geothermal Power Market by Generation Capacity Forecast 2021-2031 (Gigawatt Electrical, AGR %)
Figure 6.37 Guatemala Geothermal Power Market by Generation Capacity Forecast 2021-2031 (Gigawatt Electrical, AGR %) (V-Shaped Recovery)
Figure 6.38 Guatemala Geothermal Power Market by Generation Capacity Forecast 2021-2031 (Gigawatt Electrical, AGR %) (W-Shaped Recovery)
Figure 6.39 Guatemala Geothermal Power Market by Generation Capacity Forecast 2021-2031 (Gigawatt Electrical, AGR %) (U-Shaped Recovery)
Figure 6.40 Guatemala Geothermal Power Market by Generation Capacity Forecast 2021-2031 (Gigawatt Electrical, AGR %) (L-Shaped Recovery)
Figure 6.41 Rest of Americas Geothermal Power Market by Generation Capacity Forecast 2021-2031 (Gigawatt Electrical, AGR %)
Figure 6.42 Rest of Americas Geothermal Power Market by Generation Capacity Forecast 2021-2031 (Gigawatt Electrical, AGR %) (V-Shaped Recovery)
Figure 6.43 Rest of Americas Geothermal Power Market by Generation Capacity Forecast 2021-2031 (Gigawatt Electrical, AGR %) (W-Shaped Recovery)
Figure 6.44 Rest of Americas Geothermal Power Market by Generation Capacity Forecast 2021-2031 (Gigawatt Electrical, AGR %) (U-Shaped Recovery)
Figure 6.45 Rest of Americas Geothermal Power Market by Generation Capacity Forecast 2021-2031 (Gigawatt Electrical, AGR %) (L-Shaped Recovery)
Figure 6.46 Americas Geothermal Power Market by Resource Type Forecast 2021-2031 (Gigawatt Electrical, AGR %)
Figure 6.47 Americas Geothermal Power Market by Resource Type Forecast 2021-2031 (Gigawatt Electrical, AGR %) (V-Shaped Recovery)
Figure 6.48 Americas Geothermal Power Market by Resource Type Forecast 2021-2031 (Gigawatt Electrical, AGR %) (W-Shaped Recovery)
Figure 6.49 Americas Geothermal Power Market by Resource Type Forecast 2021-2031 (Gigawatt Electrical, AGR %) (U-Shaped Recovery)
Figure 6.50 Americas Geothermal Power Market by Resource Type Forecast 2021-2031 (Gigawatt Electrical, AGR %) (L-Shaped Recovery)
Figure 6.51 Americas Geothermal Power Market by Technology Forecast 2021-2031 (Gigawatt Electrical, AGR %)
Figure 6.52 Americas Geothermal Power Market by Technology Forecast 2021-2031 (Gigawatt Electrical, AGR %) (V-Shaped Recovery)
Figure 6.53 Americas Geothermal Power Market by Technology Forecast 2021-2031 (Gigawatt Electrical, AGR %) (W-Shaped Recovery)
Figure 6.54 Americas Geothermal Power Market by Technology Forecast 2021-2031 (Gigawatt Electrical, AGR %) (U-Shaped Recovery)
Figure 6.55 Americas Geothermal Power Market by Technology Forecast 2021-2031 (Gigawatt Electrical, AGR %) (L-Shaped Recovery)
Figure 6.56 Americas Geothermal Power Market by End-User Forecast 2021-2031 (Gigawatt Electrical, AGR %)
Figure 6.57 Americas Geothermal Power Market by End-User Forecast 2021-2031 (Gigawatt Electrical, AGR %) (V-Shaped Recovery)
Figure 6.58 Americas Geothermal Power Market by End-User Forecast 2021-2031 (Gigawatt Electrical, AGR %) (W-Shaped Recovery)
Figure 6.59 Americas Geothermal Power Market by End-User Forecast 2021-2031 (Gigawatt Electrical, AGR %) (U-Shaped Recovery)
Figure 6.60 Americas Geothermal Power Market by End-User Forecast 2021-2031 (Gigawatt Electrical, AGR %) (L-Shaped Recovery)
Figure 6.61 Americas Geothermal Power Market by Power Station Type Forecast 2021-2031 (Gigawatt Electrical, AGR %)
Figure 6.62 Americas Geothermal Power Market by Power Station Type Forecast 2021-2031 (Gigawatt Electrical, AGR %) (V-Shaped Recovery)
Figure 6.63 Americas Geothermal Power Market by Power Station Type Forecast 2021-2031 (Gigawatt Electrical, AGR %) (W-Shaped Recovery)
Figure 6.64 Americas Geothermal Power Market by Power Station Type Forecast 2021-2031 (Gigawatt Electrical, AGR %) (U-Shaped Recovery)
Figure 6.65 Americas Geothermal Power Market by Power Station Type Forecast 2021-2031 (Gigawatt Electrical, AGR %) (L-Shaped Recovery)
Figure 7.1 Europe Geothermal Power Market by Generation Capacity Forecast 2021-2031 (Gigawatt Electrical, AGR %)
Figure 7.2 Europe Geothermal Power Market by Generation Capacity Forecast 2021-2031 (Gigawatt Electrical, AGR %) (V-Shaped Recovery)
Figure 7.3 Europe Geothermal Power Market by Generation Capacity Forecast 2021-2031 (Gigawatt Electrical, AGR %) (W-Shaped Recovery)
Figure 7.4 Europe Geothermal Power Market by Generation Capacity Forecast 2021-2031 (Gigawatt Electrical, AGR %) (U-Shaped Recovery)
Figure 7.5 Europe Geothermal Power Market by Generation Capacity Forecast 2021-2031 (Gigawatt Electrical, AGR %) (L-Shaped Recovery)
Figure 7.6 Europe Geothermal Power Market by Country Forecast 2021-2031 (Gigawatt Electrical, AGR %)
Figure 7.7 Europe Geothermal Power Market by Country Forecast 2021-2031 (Gigawatt Electrical, AGR %) (V-Shaped Recovery)
Figure 7.8 Europe Geothermal Power Market by Country Forecast 2021-2031 (Gigawatt Electrical, AGR %) (W-Shaped Recovery)
Figure 7.9 Europe Geothermal Power Market by Country Forecast 2021-2031 (Gigawatt Electrical, AGR %) (U-Shaped Recovery)
Figure 7.10 Europe Geothermal Power Market by Country Forecast 2021-2031 (Gigawatt Electrical, AGR %) (L-Shaped Recovery)
Figure 7.11 Italy Geothermal Power Market by Generation Capacity Forecast 2021-2031 (Gigawatt Electrical, AGR %)
Figure 7.12 Italy Geothermal Power Market by Generation Capacity Forecast 2021-2031 (Gigawatt Electrical, AGR %) (V-Shaped Recovery)
Figure 7.13 Italy Geothermal Power Market by Generation Capacity Forecast 2021-2031 (Gigawatt Electrical, AGR %) (W-Shaped Recovery)
Figure 7.14 Italy Geothermal Power Market by Generation Capacity Forecast 2021-2031 (Gigawatt Electrical, AGR %) (U-Shaped Recovery)
Figure 7.15 Italy Geothermal Power Market by Generation Capacity Forecast 2021-2031 (Gigawatt Electrical, AGR %) (L-Shaped Recovery)
Figure 7.16 Iceland Geothermal Power Market by Generation Capacity Forecast 2021-2031 (Gigawatt Electrical, AGR %)
Figure 7.17 Iceland Geothermal Power Market by Generation Capacity Forecast 2021-2031 (Gigawatt Electrical, AGR %) (V-Shaped Recovery)
Figure 7.18 Iceland Geothermal Power Market by Generation Capacity Forecast 2021-2031 (Gigawatt Electrical, AGR %) (W-Shaped Recovery)
Figure 7.19 Iceland Geothermal Power Market by Generation Capacity Forecast 2021-2031 (Gigawatt Electrical, AGR %) (U-Shaped Recovery)
Figure 7.20 Iceland Geothermal Power Market by Generation Capacity Forecast 2021-2031 (Gigawatt Electrical, AGR %) (L-Shaped Recovery)
Figure 7.21 Russia Geothermal Power Market by Generation Capacity Forecast 2021-2031 (Gigawatt Electrical, AGR %)
Figure 7.22 Russia Geothermal Power Market by Generation Capacity Forecast 2021-2031 (Gigawatt Electrical, AGR %) (V-Shaped Recovery)
Figure 7.23 Russia Geothermal Power Market by Generation Capacity Forecast 2021-2031 (Gigawatt Electrical, AGR %) (W-Shaped Recovery)
Figure 7.24 Russia Geothermal Power Market by Generation Capacity Forecast 2021-2031 (Gigawatt Electrical, AGR %) (U-Shaped Recovery)
Figure 7.25 Russia Geothermal Power Market by Generation Capacity Forecast 2021-2031 (Gigawatt Electrical, AGR %) (L-Shaped Recovery)
Figure 7.26 Germany Geothermal Power Market by Generation Capacity Forecast 2021-2031 (Gigawatt Electrical, AGR %)
Figure 7.27 Germany Geothermal Power Market by Generation Capacity Forecast 2021-2031 (Gigawatt Electrical, AGR %) (V-Shaped Recovery)
Figure 7.28 Germany Geothermal Power Market by Generation Capacity Forecast 2021-2031 (Gigawatt Electrical, AGR %) (W-Shaped Recovery)
Figure 7.29 Germany Geothermal Power Market by Generation Capacity Forecast 2021-2031 (Gigawatt Electrical, AGR %) (U-Shaped Recovery)
Figure 7.30 Germany Geothermal Power Market by Generation Capacity Forecast 2021-2031 (Gigawatt Electrical, AGR %) (L-Shaped Recovery)
Figure 7.31 France Geothermal Power Market by Generation Capacity Forecast 2021-2031 (Gigawatt Electrical, AGR %)
Figure 7.32 France Geothermal Power Market by Generation Capacity Forecast 2021-2031 (Gigawatt Electrical, AGR %) (V-Shaped Recovery)
Figure 7.33 France Geothermal Power Market by Generation Capacity Forecast 2021-2031 (Gigawatt Electrical, AGR %) (W-Shaped Recovery)
Figure 7.34 France Geothermal Power Market by Generation Capacity Forecast 2021-2031 (Gigawatt Electrical, AGR %) (U-Shaped Recovery)
Figure 7.35 France Geothermal Power Market by Generation Capacity Forecast 2021-2031 (Gigawatt Electrical, AGR %) (L-Shaped Recovery)
Figure 7.36 Rest of Europe Geothermal Power Market by Generation Capacity Forecast 2021-2031 (Gigawatt Electrical, AGR %)
Figure 7.37 Rest of Europe Geothermal Power Market by Generation Capacity Forecast 2021-2031 (Gigawatt Electrical, AGR %) (V-Shaped Recovery)
Figure 7.38 Rest of Europe Geothermal Power Market by Generation Capacity Forecast 2021-2031 (Gigawatt Electrical, AGR %) (W-Shaped Recovery)
Figure 7.39 Rest of Europe Geothermal Power Market by Generation Capacity Forecast 2021-2031 (Gigawatt Electrical, AGR %) (U-Shaped Recovery)
Figure 7.40 Rest of Europe Geothermal Power Market by Generation Capacity Forecast 2021-2031 (Gigawatt Electrical, AGR %) (L-Shaped Recovery)
Figure 7.41 Europe Geothermal Power Market by Resource Type Forecast 2021-2031 (Gigawatt Electrical, AGR %)
Figure 7.42 Europe Geothermal Power Market by Resource Type Forecast 2021-2031 (Gigawatt Electrical, AGR %) (V-Shaped Recovery)
Figure 7.43 Europe Geothermal Power Market by Resource Type Forecast 2021-2031 (Gigawatt Electrical, AGR %) (W-Shaped Recovery)
Figure 7.44 Europe Geothermal Power Market by Resource Type Forecast 2021-2031 (Gigawatt Electrical, AGR %) (U-Shaped Recovery)
Figure 7.45 Europe Geothermal Power Market by Resource Type Forecast 2021-2031 (Gigawatt Electrical, AGR %) (L-Shaped Recovery)
Figure 7.46 Europe Geothermal Power Market by Technology Forecast 2021-2031 (Gigawatt Electrical, AGR %)
Figure 7.47 Europe Geothermal Power Market by Technology Forecast 2021-2031 (Gigawatt Electrical, AGR %) (V-Shaped Recovery)
Figure 7.48 Europe Geothermal Power Market by Technology Forecast 2021-2031 (Gigawatt Electrical, AGR %) (W-Shaped Recovery)
Figure 7.49 Europe Geothermal Power Market by Technology Forecast 2021-2031 (Gigawatt Electrical, AGR %) (U-Shaped Recovery)
Figure 7.50 Europe Geothermal Power Market by Technology Forecast 2021-2031 (Gigawatt Electrical, AGR %) (L-Shaped Recovery)
Figure 7.51 Europe Geothermal Power Market by End-User Forecast 2021-2031 (Gigawatt Electrical, AGR %)
Figure 7.52 Europe Geothermal Power Market by End-User Forecast 2021-2031 (Gigawatt Electrical, AGR %) (V-Shaped Recovery)
Figure 7.53 Europe Geothermal Power Market by End-User Forecast 2021-2031 (Gigawatt Electrical, AGR %) (W-Shaped Recovery)
Figure 7.54 Europe Geothermal Power Market by End-User Forecast 2021-2031 (Gigawatt Electrical, AGR %) (U-Shaped Recovery)
Figure 7.55 Europe Geothermal Power Market by End-User Forecast 2021-2031 (Gigawatt Electrical, AGR %) (L-Shaped Recovery)
Figure 7.56 Europe Geothermal Power Market by Power Station Type Forecast 2021-2031 (Gigawatt Electrical, AGR %)
Figure 7.57 Europe Geothermal Power Market by Power Station Type Forecast 2021-2031 (Gigawatt Electrical, AGR %) (V-Shaped Recovery)
Figure 7.58 Europe Geothermal Power Market by Power Station Type Forecast 2021-2031 (Gigawatt Electrical, AGR %) (W-Shaped Recovery)
Figure 7.59 Europe Geothermal Power Market by Power Station Type Forecast 2021-2031 (Gigawatt Electrical, AGR %) (U-Shaped Recovery)
Figure 7.60 Europe Geothermal Power Market by Power Station Type Forecast 2021-2031 (Gigawatt Electrical, AGR %) (L-Shaped Recovery)
Figure 8.1 Asia-Pacific Geothermal Power Market by Generation Capacity Forecast 2021-2031 (Gigawatt Electrical, AGR %)
Figure 8.2 Asia-Pacific Geothermal Power Market by Generation Capacity Forecast 2021-2031 (Gigawatt Electrical, AGR %) (V-Shaped Recovery)
Figure 8.3 Asia-Pacific Geothermal Power Market by Generation Capacity Forecast 2021-2031 (Gigawatt Electrical, AGR %) (W-Shaped Recovery)
Figure 8.4 Asia-Pacific Geothermal Power Market by Generation Capacity Forecast 2021-2031 (Gigawatt Electrical, AGR %) (U-Shaped Recovery)
Figure 8.5 Asia-Pacific Geothermal Power Market by Generation Capacity Forecast 2021-2031 (Gigawatt Electrical, AGR %) (L-Shaped Recovery)
Figure 8.6 Asia-Pacific Geothermal Power Market by Country Forecast 2021-2031 (Gigawatt Electrical, AGR %)
Figure 8.7 Asia-Pacific Geothermal Power Market by Country Forecast 2021-2031 (Gigawatt Electrical, AGR %) (V-Shaped Recovery)
Figure 8.8 Asia-Pacific Geothermal Power Market by Country Forecast 2021-2031 (Gigawatt Electrical, AGR %) (W-Shaped Recovery)
Figure 8.9 Asia-Pacific Geothermal Power Market by Country Forecast 2021-2031 (Gigawatt Electrical, AGR %) (U-Shaped Recovery)
Figure 8.10 Asia-Pacific Geothermal Power Market by Country Forecast 2021-2031 (Gigawatt Electrical, AGR %) (L-Shaped Recovery)
Figure 8.11 Indonesia Geothermal Power Market by Generation Capacity Forecast 2021-2031 (Gigawatt Electrical, AGR %)
Figure 8.12 Indonesia Geothermal Power Market by Generation Capacity Forecast 2021-2031 (Gigawatt Electrical, AGR %) (V-Shaped Recovery)
Figure 8.13 Indonesia Geothermal Power Market by Generation Capacity Forecast 2021-2031 (Gigawatt Electrical, AGR %) (W-Shaped Recovery)
Figure 8.14 Indonesia Geothermal Power Market by Generation Capacity Forecast 2021-2031 (Gigawatt Electrical, AGR %) (U-Shaped Recovery)
Figure 8.15 Indonesia Geothermal Power Market by Generation Capacity Forecast 2021-2031 (Gigawatt Electrical, AGR %) (L-Shaped Recovery)
Figure 8.16 Philippines Geothermal Power Market by Generation Capacity Forecast 2021-2031 (Gigawatt Electrical, AGR %)
Figure 8.17 Philippines Geothermal Power Market by Generation Capacity Forecast 2021-2031 (Gigawatt Electrical, AGR %) (V-Shaped Recovery)
Figure 8.18 Philippines Geothermal Power Market by Generation Capacity Forecast 2021-2031 (Gigawatt Electrical, AGR %) (W-Shaped Recovery)
Figure 8.19 Philippines Geothermal Power Market by Generation Capacity Forecast 2021-2031 (Gigawatt Electrical, AGR %) (U-Shaped Recovery)
Figure 8.20 Philippines Geothermal Power Market by Generation Capacity Forecast 2021-2031 (Gigawatt Electrical, AGR %) (L-Shaped Recovery)
Figure 8.21 New Zealand Geothermal Power Market by Generation Capacity Forecast 2021-2031 (Gigawatt Electrical, AGR %)
Figure 8.22 New Zealand Geothermal Power Market by Generation Capacity Forecast 2021-2031 (Gigawatt Electrical, AGR %) (V-Shaped Recovery)
Figure 8.23 New Zealand Geothermal Power Market by Generation Capacity Forecast 2021-2031 (Gigawatt Electrical, AGR %) (W-Shaped Recovery)
Figure 8.24 New Zealand Geothermal Power Market by Generation Capacity Forecast 2021-2031 (Gigawatt Electrical, AGR %) (U-Shaped Recovery)
Figure 8.25 New Zealand Geothermal Power Market by Generation Capacity Forecast 2021-2031 (Gigawatt Electrical, AGR %) (L-Shaped Recovery)
Figure 8.26 Japan Geothermal Power Market by Generation Capacity Forecast 2021-2031 (Gigawatt Electrical, AGR %)
Figure 8.27 Japan Geothermal Power Market by Generation Capacity Forecast 2021-2031 (Gigawatt Electrical, AGR %) (V-Shaped Recovery)
Figure 8.28 Japan Geothermal Power Market by Generation Capacity Forecast 2021-2031 (Gigawatt Electrical, AGR %) (W-Shaped Recovery)
Figure 8.29 Japan Geothermal Power Market by Generation Capacity Forecast 2021-2031 (Gigawatt Electrical, AGR %) (U-Shaped Recovery)
Figure 8.30 Japan Geothermal Power Market by Generation Capacity Forecast 2021-2031 (Gigawatt Electrical, AGR %) (L-Shaped Recovery)
Figure 8.31 China Geothermal Power Market by Generation Capacity Forecast 2021-2031 (Gigawatt Electrical, AGR %)
Figure 8.32 China Geothermal Power Market by Generation Capacity Forecast 2021-2031 (Gigawatt Electrical, AGR %) (V-Shaped Recovery)
Figure 8.33 China Geothermal Power Market by Generation Capacity Forecast 2021-2031 (Gigawatt Electrical, AGR %) (W-Shaped Recovery)
Figure 8.34 China Geothermal Power Market by Generation Capacity Forecast 2021-2031 (Gigawatt Electrical, AGR %) (U-Shaped Recovery)
Figure 8.35 China Geothermal Power Market by Generation Capacity Forecast 2021-2031 (Gigawatt Electrical, AGR %) (L-Shaped Recovery)
Figure 8.36 Rest of Asia-Pacific Geothermal Power Market by Generation Capacity Forecast 2021-2031 (Gigawatt Electrical, AGR %)
Figure 8.37 Rest of Asia-Pacific Geothermal Power Market by Generation Capacity Forecast 2021-2031 (Gigawatt Electrical, AGR %) (V-Shaped Recovery)
Figure 8.38 Rest of Asia-Pacific Geothermal Power Market by Generation Capacity Forecast 2021-2031 (Gigawatt Electrical, AGR %) (W-Shaped Recovery)
Figure 8.39 Rest of Asia-Pacific Geothermal Power Market by Generation Capacity Forecast 2021-2031 (Gigawatt Electrical, AGR %) (U-Shaped Recovery)
Figure 8.40 Rest of Asia-Pacific Geothermal Power Market by Generation Capacity Forecast 2021-2031 (Gigawatt Electrical, AGR %) (L-Shaped Recovery)
Figure 8.41 Asia-Pacific Geothermal Power Market by Resource Type Forecast 2021-2031 (Gigawatt Electrical, AGR %)
Figure 8.42 Asia-Pacific Geothermal Power Market by Resource Type Forecast 2021-2031 (Gigawatt Electrical, AGR %) (V-Shaped Recovery)
Figure 8.43 Asia-Pacific Geothermal Power Market by Resource Type Forecast 2021-2031 (Gigawatt Electrical, AGR %) (W-Shaped Recovery)
Figure 8.44 Asia-Pacific Geothermal Power Market by Resource Type Forecast 2021-2031 (Gigawatt Electrical, AGR %) (U-Shaped Recovery)
Figure 8.45 Asia-Pacific Geothermal Power Market by Resource Type Forecast 2021-2031 (Gigawatt Electrical, AGR %) (L-Shaped Recovery)
Figure 8.46 Asia-Pacific Geothermal Power Market by Technology Forecast 2021-2031 (Gigawatt Electrical, AGR %)
Figure 8.47 Asia-Pacific Geothermal Power Market by Technology Forecast 2021-2031 (Gigawatt Electrical, AGR %) (V-Shaped Recovery)
Figure 8.48 Asia-Pacific Geothermal Power Market by Technology Forecast 2021-2031 (Gigawatt Electrical, AGR %) (W-Shaped Recovery)
Figure 8.49 Asia-Pacific Geothermal Power Market by Technology Forecast 2021-2031 (Gigawatt Electrical, AGR %) (U-Shaped Recovery)
Figure 8.50 Asia-Pacific Geothermal Power Market by Technology Forecast 2021-2031 (Gigawatt Electrical, AGR %) (L-Shaped Recovery)
Figure 8.51 Asia-Pacific Geothermal Power Market by End-User Forecast 2021-2031 (Gigawatt Electrical, AGR %)
Figure 8.52 Asia-Pacific Geothermal Power Market by End-User Forecast 2021-2031 (Gigawatt Electrical, AGR %) (V-Shaped Recovery)
Figure 8.53 Asia-Pacific Geothermal Power Market by End-User Forecast 2021-2031 (Gigawatt Electrical, AGR %) (W-Shaped Recovery)
Figure 8.54 Asia-Pacific Geothermal Power Market by End-User Forecast 2021-2031 (Gigawatt Electrical, AGR %) (U-Shaped Recovery)
Figure 8.55 Asia-Pacific Geothermal Power Market by End-User Forecast 2021-2031 (Gigawatt Electrical, AGR %) (L-Shaped Recovery)
Figure 8.56 Asia-Pacific Geothermal Power Market by Power Station Type Forecast 2021-2031 (Gigawatt Electrical, AGR %)
Figure 8.57 Asia-Pacific Geothermal Power Market by Power Station Type Forecast 2021-2031 (Gigawatt Electrical, AGR %) (V-Shaped Recovery)
Figure 8.58 Asia-Pacific Geothermal Power Market by Power Station Type Forecast 2021-2031 (Gigawatt Electrical, AGR %) (W-Shaped Recovery)
Figure 8.59 Asia-Pacific Geothermal Power Market by Power Station Type Forecast 2021-2031 (Gigawatt Electrical, AGR %) (U-Shaped Recovery)
Figure 8.60 Asia-Pacific Geothermal Power Market by Power Station Type Forecast 2021-2031 (Gigawatt Electrical, AGR %) (L-Shaped Recovery)
Figure 9.1 Rest of World Geothermal Power Market by Generation Capacity Forecast 2021-2031 (Gigawatt Electrical, AGR %)
Figure 9.2 Rest of World Geothermal Power Market by Generation Capacity Forecast 2021-2031 (Gigawatt Electrical, AGR %) (V-Shaped Recovery)
Figure 9.3 Rest of World Geothermal Power Market by Generation Capacity Forecast 2021-2031 (Gigawatt Electrical, AGR %) (W-Shaped Recovery)
Figure 9.4 Rest of World Geothermal Power Market by Generation Capacity Forecast 2021-2031 (Gigawatt Electrical, AGR %) (U-Shaped Recovery)
Figure 9.5 Rest of World Geothermal Power Market by Generation Capacity Forecast 2021-2031 (Gigawatt Electrical, AGR %) (L-Shaped Recovery)
Figure 9.6 Rest of World Geothermal Power Market by Country Forecast 2021-2031 (Gigawatt Electrical, AGR %)
Figure 9.7 Rest of World Geothermal Power Market by Country Forecast 2021-2031 (Gigawatt Electrical, AGR %) (V-Shaped Recovery)
Figure 9.8 Rest of World Geothermal Power Market by Country Forecast 2021-2031 (Gigawatt Electrical, AGR %) (W-Shaped Recovery)
Figure 9.9 Rest of World Geothermal Power Market by Country Forecast 2021-2031 (Gigawatt Electrical, AGR %) (U-Shaped Recovery)
Figure 9.10 Rest of World Geothermal Power Market by Country Forecast 2021-2031 (Gigawatt Electrical, AGR %) (L-Shaped Recovery)
Figure 9.11 Turkey Geothermal Power Market by Generation Capacity Forecast 2021-2031 (Gigawatt Electrical, AGR %)
Figure 9.12 Turkey Geothermal Power Market by Generation Capacity Forecast 2021-2031 (Gigawatt Electrical, AGR %) (V-Shaped Recovery)
Figure 9.13 Turkey Geothermal Power Market by Generation Capacity Forecast 2021-2031 (Gigawatt Electrical, AGR %) (W-Shaped Recovery)
Figure 9.14 Turkey Geothermal Power Market by Generation Capacity Forecast 2021-2031 (Gigawatt Electrical, AGR %) (U-Shaped Recovery)
Figure 9.15 Turkey Geothermal Power Market by Generation Capacity Forecast 2021-2031 (Gigawatt Electrical, AGR %) (L-Shaped Recovery)
Figure 9.16 Kenya Geothermal Power Market by Generation Capacity Forecast 2021-2031 (Gigawatt Electrical, AGR %)
Figure 9.17 Kenya Geothermal Power Market by Generation Capacity Forecast 2021-2031 (Gigawatt Electrical, AGR %) (V-Shaped Recovery)
Figure 9.18 Kenya Geothermal Power Market by Generation Capacity Forecast 2021-2031 (Gigawatt Electrical, AGR %) (W-Shaped Recovery)
Figure 9.19 Kenya Geothermal Power Market by Generation Capacity Forecast 2021-2031 (Gigawatt Electrical, AGR %) (U-Shaped Recovery)
Figure 9.20 Kenya Geothermal Power Market by Generation Capacity Forecast 2021-2031 (Gigawatt Electrical, AGR %) (L-Shaped Recovery)
Figure 9.21 Ethiopia Geothermal Power Market by Generation Capacity Forecast 2021-2031 (Gigawatt Electrical, AGR %)
Figure 9.22 Ethiopia Geothermal Power Market by Generation Capacity Forecast 2021-2031 (Gigawatt Electrical, AGR %) (V-Shaped Recovery)
Figure 9.23 Ethiopia Geothermal Power Market by Generation Capacity Forecast 2021-2031 (Gigawatt Electrical, AGR %) (W-Shaped Recovery)
Figure 9.24 Ethiopia Geothermal Power Market by Generation Capacity Forecast 2021-2031 (Gigawatt Electrical, AGR %) (U-Shaped Recovery)
Figure 9.25 Ethiopia Geothermal Power Market by Generation Capacity Forecast 2021-2031 (Gigawatt Electrical, AGR %) (L-Shaped Recovery)
Figure 9.26 Rest of Rest of World Geothermal Power Market by Generation Capacity Forecast 2021-2031 (Gigawatt Electrical, AGR %)
Figure 9.27 Rest of Rest of World Geothermal Power Market by Generation Capacity Forecast 2021-2031 (Gigawatt Electrical, AGR %) (V-Shaped Recovery)
Figure 9.28 Rest of Rest of World Geothermal Power Market by Generation Capacity Forecast 2021-2031 (Gigawatt Electrical, AGR %) (W-Shaped Recovery)
Figure 9.29 Rest of Rest of World Geothermal Power Market by Generation Capacity Forecast 2021-2031 (Gigawatt Electrical, AGR %) (U-Shaped Recovery)
Figure 9.30 Rest of Rest of World Geothermal Power Market by Generation Capacity Forecast 2021-2031 (Gigawatt Electrical, AGR %) (L-Shaped Recovery)
Figure 9.31 Rest of World Geothermal Power Market by Resource Type Forecast 2021-2031 (Gigawatt Electrical, AGR %)
Figure 9.32 Rest of World Geothermal Power Market by Resource Type Forecast 2021-2031 (Gigawatt Electrical, AGR %) (V-Shaped Recovery)
Figure 9.33 Rest of World Geothermal Power Market by Resource Type Forecast 2021-2031 (Gigawatt Electrical, AGR %) (W-Shaped Recovery)
Figure 9.34 Rest of World Geothermal Power Market by Resource Type Forecast 2021-2031 (Gigawatt Electrical, AGR %) (U-Shaped Recovery)
Figure 9.35 Rest of World Geothermal Power Market by Resource Type Forecast 2021-2031 (Gigawatt Electrical, AGR %) (L-Shaped Recovery)
Figure 9.36 Rest of World Geothermal Power Market by Technology Forecast 2021-2031 (Gigawatt Electrical, AGR %)
Figure 9.37 Rest of World Geothermal Power Market by Technology Forecast 2021-2031 (Gigawatt Electrical, AGR %) (V-Shaped Recovery)
Figure 9.38 Rest of World Geothermal Power Market by Technology Forecast 2021-2031 (Gigawatt Electrical, AGR %) (W-Shaped Recovery)
Figure 9.39 Rest of World Geothermal Power Market by Technology Forecast 2021-2031 (Gigawatt Electrical, AGR %) (U-Shaped Recovery)
Figure 9.40 Rest of World Geothermal Power Market by Technology Forecast 2021-2031 (Gigawatt Electrical, AGR %) (L-Shaped Recovery)
Figure 9.41 Rest of World Geothermal Power Market by End-User Forecast 2021-2031 (Gigawatt Electrical, AGR %)
Figure 9.42 Rest of World Geothermal Power Market by End-User Forecast 2021-2031 (Gigawatt Electrical, AGR %) (V-Shaped Recovery)
Figure 9.43 Rest of World Geothermal Power Market by End-User Forecast 2021-2031 (Gigawatt Electrical, AGR %) (W-Shaped Recovery)
Figure 9.44 Rest of World Geothermal Power Market by End-User Forecast 2021-2031 (Gigawatt Electrical, AGR %) (U-Shaped Recovery)
Figure 9.45 Rest of World Geothermal Power Market by End-User Forecast 2021-2031 (Gigawatt Electrical, AGR %) (L-Shaped Recovery)
Figure 9.46 Rest of World Geothermal Power Market by Power Station Type Forecast 2021-2031 (Gigawatt Electrical, AGR %)
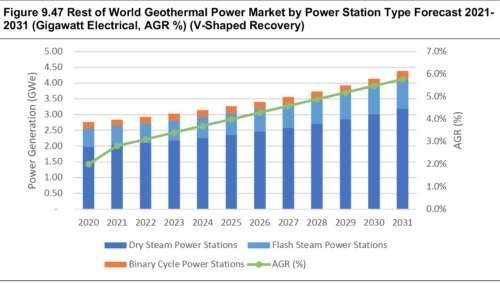
Figure 9.47 Rest of World Geothermal Power Market by Power Station Type Forecast 2021-2031 (Gigawatt Electrical, AGR %) (V-Shaped Recovery)
Figure 9.48 Rest of World Geothermal Power Market by Power Station Type Forecast 2021-2031 (Gigawatt Electrical, AGR %) (W-Shaped Recovery)
Figure 9.49 Rest of World Geothermal Power Market by Power Station Type Forecast 2021-2031 (Gigawatt Electrical, AGR %) (U-Shaped Recovery)
Figure 9.50 Rest of World Geothermal Power Market by Power Station Type Forecast 2021-2031 (Gigawatt Electrical, AGR %) (L-Shaped Recovery)
Figure 10.1 Atlas Copco Group Company: Company Revenue 2015-2019 (US$Mn, AGR %)
Figure 10.2 Atlas Copco Group Company: Company Operating Income 2015-2019 (US$Mn)
Figure 10.3 Atlas Copco Group Company: Company EBITDA 2015-2019 (US$Mn)
Figure 10.4 Atlas Copco Group Company: Company Net Income/Loss 2015-2019 (US$Mn)
Figure 10.5 Kenya Electricity Generating Company: Company Revenue 2015-2019 (US$Mn, AGR %)
Figure 10.6 Kenya Electricity Generating Company: Company Operating Income 2015-2019 (US$Mn)
Figure 10.7 Kenya Electricity Generating Company: Company EBITDA 2015-2019 (US$Mn)
Figure 10.8 Kenya Electricity Generating Company: Company Net Income/Loss 2015-2019 (US$Mn)
Figure 10.9 Ormat Technologies, Inc Company: Company Revenue 2015-2019 (US$Mn, AGR %)
Figure 10.10 Ormat Technologies, Inc Company: Company Operating Income 2015-2019 (US$Mn)
Figure 10.11 Ormat Technologies, Inc Company: Company EBITDA 2015-2019 (US$Mn)
Figure 10.12 Ormat Technologies, Inc Company: Company Net Income/Loss 2015-2019 (US$Mn)
Figure 10.13 General Electric Company: Company Revenue 2015-2019 (US$Mn, AGR %)
Figure 10.14 General Electric Company: Company Operating Income 2015-2019 (US$Mn)
Figure 10.15 General Electric Company: Company EBITDA 2015-2019 (US$Mn)
Figure 10.16 General Electric Company: Company Net Income/Loss 2015-2019 (US$Mn)
Figure 10.17 Toshiba Corporation Company: Company Revenue 2015-2019 (US$Mn, AGR %)
Figure 2.1 Toshiba Corporation Company: Company Operating Income 2015-2019 (US$Mn)
Figure 10.19 Toshiba Corporation Company: Company EBITDA 2015-2019 (US$Mn)
Figure 10.20 Toshiba Corporation Company: Company Net Income/Loss 2015-2019 (US$Mn)
Figure 10.21 Terra-Gen Company: Company Revenue 2015-2019 (US$Mn, AGR %)
Figure 10.22 Fuji Electric Co. Ltd Company: Company Operating Income 2015-2019 (US$Mn)
Figure 10.23 Fuji Electric Co. Ltd Company: Company EBITDA 2015-2019 (US$Mn)
Figure 10.24 Fuji Electric Co. Ltd Company: Company Net Income/Loss 2015-2019 (US$Mn)
Figure 10.25 Halliburton Company: Company Revenue 2015-2019 (US$Mn, AGR %)
Figure 10.26 Halliburton Company: Company Operating Income 2015-2019 (US$Mn)
Figure 10.27 Halliburton Company: Company EBITDA 2015-2019 (US$Mn)
Figure 10.28 Halliburton Company: Company Net Income/Loss 2015-2019 (US$Mn)
Figure 10.29 Enel SpA Company: Company Revenue 2015-2019 (US$Mn, AGR %)
Figure 10.30 Enel SpA Company: Company Operating Income 2015-2019 (US$Mn)
Figure 10.31 Enel SpA Company: Company EBITDA 2015-2019 (US$Mn)
Figure 10.32 Enel SpA Company: Company Net Income/Loss 2015-2019 (US$Mn)
Figure 10.33 John Wood Group PLC Company: Company Revenue 2015-2019 (US$Mn, AGR %)
Figure 10.34 John Wood Group PLC Company: Company Operating Income 2015-2019 (US$Mn)
Figure 10.35 John Wood Group PLC Company: Company EBITDA 2015-2019 (US$Mn)
Figure 10.36 John Wood Group PLC Company: Company Net Income/Loss 2015-2019 (US$Mn)
Figure 10.37 Berkshire Hathaway Energy Company: Company Revenue 2015-2019 (US$Mn, AGR %)
Figure 2.1 Berkshire Hathaway Energy Company: Company Operating Income 2015-2019 (US$Mn)
Figure 10.39 Berkshire Hathaway Energy Company: Company EBITDA 2015-2019 (US$Mn)
Figure 10.40 Berkshire Hathaway Energy Company: Company Net Income/Loss 2015-2019 (US$Mn)
Figure 10.41 Mitsubishi Heavy Industries Limited Company: Company Revenue 2015-2019 (US$Mn, AGR %)
Figure 10.42 Mitsubishi Heavy Industries Limited Company: Company Operating Income 2015-2019 (US$Mn)
Figure 10.43 Mitsubishi Heavy Industries Limited Company: Company EBITDA 2015-2019 (US$Mn)
Figure 10.44 Mitsubishi Heavy Industries Limited Company: Company Net Income/Loss 2015-2019 (US$Mn)
Figure 10.45 Chevron Corporation Company: Company Revenue 2015-2019 (US$Mn, AGR %)
Figure 2.1 Chevron Corporation Company: Company Operating Income 2015-2019 (US$Mn)
Figure 10.47 Chevron Corporation Company: Company EBITDA 2015-2019 (US$Mn)
Figure 10.48 Chevron Corporation Company: Company Net Income/Loss 2015-2019 (US$Mn)
Figure 10.49 Innergex Renewable Energy Inc Company: Company Revenue 2015-2019 (US$Mn, AGR %)
Figure 10.50 Innergex Renewable Energy Inc Company: Company Operating Income 2015-2019 (US$Mn)
Figure 10.51 Innergex Renewable Energy Inc Company: Company EBITDA 2015-2019 (US$Mn)
Figure 10.52 Innergex Renewable Energy Inc Company: Company Net Income/Loss 2015-2019 (US$Mn)
List of Table
Table 1.1 Global Geothermal Power Market by Generation Capacity Forecast 2021-2031 (Gigawatt Electrical, AGR %, CAGR %)
Table 2.1 Global Geothermal Power Market Summary Table
Table 5.1 Global Geothermal Power Market by Generation Capacity Forecast 2021-2031 (Gigawatt Electrical, AGR %, CAGR %)
Table 5.2 Global Geothermal Power Market by Generation Capacity Forecast 2021-2031 (Gigawatt Electrical, AGR %, CAGR %) (V-Shaped Recovery)
Table 5.3 Global Geothermal Power Market by Generation Capacity Forecast 2021-2031 (Gigawatt Electrical, AGR %, CAGR %) (W-Shaped Recovery)
Table 5.4 Global Geothermal Power Market by Generation Capacity Forecast 2021-2031 (Gigawatt Electrical, AGR %, CAGR %) (U-Shaped Recovery)
Table 5.5 Global Geothermal Power Market by Generation Capacity Forecast 2021-2031 (Gigawatt Electrical, AGR %, CAGR %) (L-Shaped Recovery)
Table 5.6 Global Geothermal Power Market by Region Forecast 2021-2031 (Gigawatt Electrical, AGR %, CAGR %)
Table 5.7 Global Geothermal Power Market by Region Forecast 2021-2031 (Gigawatt Electrical, AGR %, CAGR %) (V-Shaped Recovery)
Table 5.8 Global Geothermal Power Market by Region Forecast 2021-2031 (Gigawatt Electrical, AGR %, CAGR %) (W-Shaped Recovery)
Table 5.9 Global Geothermal Power Market by Region Forecast 2021-2031 (Gigawatt Electrical, AGR %, CAGR %) (U-Shaped Recovery)
Table 5.10 Global Geothermal Power Market by Region Forecast 2021-2031 (Gigawatt Electrical, AGR %, CAGR %) (L-Shaped Recovery)
Table 5.11 Global Geothermal Power Market by Resource Type Forecast 2021-2031 (Gigawatt Electrical, AGR %, CAGR %)
Table 5.12 Global Geothermal Power Market by Resource Type Forecast 2021-2031 (Gigawatt Electrical, AGR %, CAGR %) (V-Shaped Recovery)
Table 5.13 Global Geothermal Power Market by Resource Type Forecast 2021-2031 (Gigawatt Electrical, AGR %, CAGR %) (W-Shaped Recovery)
Table 5.14 Global Geothermal Power Market by Resource Type Forecast 2021-2031 (Gigawatt Electrical, AGR %, CAGR %) (U-Shaped Recovery)
Table 5.15 Global Geothermal Power Market by Resource Type Forecast 2021-2031 (Gigawatt Electrical, AGR %, CAGR %) (L-Shaped Recovery)
Table 5.16 Global Geothermal Power Market by Technology Forecast 2021-2031 (Gigawatt Electrical, AGR %, CAGR %)
Table 5.17 Global Geothermal Power Market by Technology Forecast 2021-2031 (Gigawatt Electrical, AGR %, CAGR %) (V-Shaped Recovery)
Table 5.18 Global Geothermal Power Market by Technology Forecast 2021-2031 (Gigawatt Electrical, AGR %, CAGR %) (W-Shaped Recovery)
Table 5.19 Global Geothermal Power Market by Technology Forecast 2021-2031 (Gigawatt Electrical, AGR %, CAGR %) (U-Shaped Recovery)
Table 5.20 Global Geothermal Power Market by Technology Forecast 2021-2031 (Gigawatt Electrical, AGR %, CAGR %) (L-Shaped Recovery)
Table 5.21 Global Geothermal Power Market by End-User Forecast 2021-2031 (Gigawatt Electrical, AGR %, CAGR %)
Table 5.22 Global Geothermal Power Market by End-User Forecast 2021-2031 (Gigawatt Electrical, AGR %, CAGR %) (V-Shaped Recovery)
Table 5.23 Global Geothermal Power Market by End-User Forecast 2021-2031 (Gigawatt Electrical, AGR %, CAGR %) (W-Shaped Recovery)
Table 5.24 Global Geothermal Power Market by End-User Forecast 2021-2031 (Gigawatt Electrical, AGR %, CAGR %) (U-Shaped Recovery)
Table 5.25 Global Geothermal Power Market by End-User Forecast 2021-2031 (Gigawatt Electrical, AGR %, CAGR %) (L-Shaped Recovery)
Table 5.26 Global Geothermal Power Market by Power Station Type Forecast 2021-2031 (Gigawatt Electrical, AGR %, CAGR %)
Table 5.27 Global Geothermal Power Market by Power Station Type Forecast 2021-2031 (Gigawatt Electrical, AGR %, CAGR %) (V-Shaped Recovery)
Table 5.28 Global Geothermal Power Market by Power Station Type Forecast 2021-2031 (Gigawatt Electrical, AGR %, CAGR %) (W-Shaped Recovery)
Table 5.29 Global Geothermal Power Market by Power Station Type Forecast 2021-2031 (Gigawatt Electrical, AGR %, CAGR %) (U-Shaped Recovery)
Table 5.30 Global Geothermal Power Market by Power Station Type Forecast 2021-2031 (Gigawatt Electrical, AGR %, CAGR %) (L-Shaped Recovery)
Table 6.1 Americas Geothermal Power Market by Generation Capacity Forecast 2021-2031 (Gigawatt Electrical, AGR %, CAGR %)
Table 6.2 Americas Geothermal Power Market by Generation Capacity Forecast 2021-2031 (Gigawatt Electrical, AGR %, CAGR %) (V-Shaped Recovery)
Table 6.3 Americas Geothermal Power Market by Generation Capacity Forecast 2021-2031 (Gigawatt Electrical, AGR %, CAGR %) (W-Shaped Recovery)
Table 6.4 Americas Geothermal Power Market by Generation Capacity Forecast 2021-2031 (Gigawatt Electrical, AGR %, CAGR %) (U-Shaped Recovery)
Table 6.5 Americas Geothermal Power Market by Generation Capacity Forecast 2021-2031 (Gigawatt Electrical, AGR %, CAGR %) (L-Shaped Recovery)
Table 6.6 US Geothermal Power Market by Generation Capacity Forecast 2021-2031 (Gigawatt Electrical, AGR %, CAGR %)
Table 6.7 US Geothermal Power Market by Generation Capacity Forecast 2021-2031 (Gigawatt Electrical, AGR %, CAGR %) (V-Shaped Recovery)
Table 6.8 US Geothermal Power Market by Generation Capacity Forecast 2021-2031 (Gigawatt Electrical, AGR %, CAGR %) (W-Shaped Recovery)
Table 6.9 US Geothermal Power Market by Generation Capacity Forecast 2021-2031 (Gigawatt Electrical, AGR %, CAGR %) (U-Shaped Recovery)
Table 6.10 US Geothermal Power Market by Generation Capacity Forecast 2021-2031 (Gigawatt Electrical, AGR %, CAGR %) (L-Shaped Recovery)
Table 6.11 Mexico Geothermal Power Market by Generation Capacity Forecast 2021-2031 (Gigawatt Electrical, AGR %, CAGR %)
Table 6.12 Mexico Geothermal Power Market by Generation Capacity Forecast 2021-2031 (Gigawatt Electrical, AGR %, CAGR %) (V-Shaped Recovery)
Table 6.13 Mexico Geothermal Power Market by Generation Capacity Forecast 2021-2031 (Gigawatt Electrical, AGR %, CAGR %) (W-Shaped Recovery)
Table 6.14 Mexico Geothermal Power Market by Generation Capacity Forecast 2021-2031 (Gigawatt Electrical, AGR %, CAGR %) (U-Shaped Recovery)
Table 6.15 Mexico Geothermal Power Market by Generation Capacity Forecast 2021-2031 (Gigawatt Electrical, AGR %, CAGR %) (L-Shaped Recovery)
Table 6.17 Costa Rica Geothermal Power Market by Generation Capacity Forecast 2021-2031 (Gigawatt Electrical, AGR %, CAGR %)
Table 6.17 Costa Rica Geothermal Power Market by Generation Capacity Forecast 2021-2031 (Gigawatt Electrical, AGR %, CAGR %) (V-Shaped Recovery)
Table 6.18 Costa Rica Geothermal Power Market by Generation Capacity Forecast 2021-2031 (Gigawatt Electrical, AGR %, CAGR %) (W-Shaped Recovery)
Table 6.19 Costa Rica Geothermal Power Market by Generation Capacity Forecast 2021-2031 (Gigawatt Electrical, AGR %, CAGR %) (U-Shaped Recovery)
Table 6.20 Costa Rica Geothermal Power Market by Generation Capacity Forecast 2021-2031 (Gigawatt Electrical, AGR %, CAGR %) (L-Shaped Recovery)
Table 6.21 El Salvador Geothermal Power Market by Generation Capacity Forecast 2021-2031 (Gigawatt Electrical, AGR %, CAGR %)
Table 6.22 El Salvador Geothermal Power Market by Generation Capacity Forecast 2021-2031 (Gigawatt Electrical, AGR %, CAGR %) (V-Shaped Recovery)
Table 6.23 El Salvador Geothermal Power Market by Generation Capacity Forecast 2021-2031 (Gigawatt Electrical, AGR %, CAGR %) (W-Shaped Recovery)
Table 6.24 El Salvador Geothermal Power Market by Generation Capacity Forecast 2021-2031 (Gigawatt Electrical, AGR %, CAGR %) (U-Shaped Recovery)
Table 6.25 El Salvador Geothermal Power Market by Generation Capacity Forecast 2021-2031 (Gigawatt Electrical, AGR %, CAGR %) (L-Shaped Recovery)
Table 6.26 Nicaragua Geothermal Power Market by Generation Capacity Forecast 2021-2031 (Gigawatt Electrical, AGR %, CAGR %)
Table 6.27 Nicaragua Geothermal Power Market by Generation Capacity Forecast 2021-2031 (Gigawatt Electrical, AGR %, CAGR %) (V-Shaped Recovery)
Table 6.28 Nicaragua Geothermal Power Market by Generation Capacity Forecast 2021-2031 (Gigawatt Electrical, AGR %, CAGR %) (W-Shaped Recovery)
Table 6.29 Nicaragua Geothermal Power Market by Generation Capacity Forecast 2021-2031 (Gigawatt Electrical, AGR %, CAGR %) (U-Shaped Recovery)
Table 6.30 Nicaragua Geothermal Power Market by Generation Capacity Forecast 2021-2031 (Gigawatt Electrical, AGR %, CAGR %) (L-Shaped Recovery)
Table 6.31 Guatemala Geothermal Power Market by Generation Capacity Forecast 2021-2031 (Gigawatt Electrical, AGR %, CAGR %)
Table 6.32 Guatemala Geothermal Power Market by Generation Capacity Forecast 2021-2031 (Gigawatt Electrical, AGR %, CAGR %) (V-Shaped Recovery)
Table 6.33 Guatemala Geothermal Power Market by Generation Capacity Forecast 2021-2031 (Gigawatt Electrical, AGR %, CAGR %) (W-Shaped Recovery)
Table 6.34 Guatemala Geothermal Power Market by Generation Capacity Forecast 2021-2031 (Gigawatt Electrical, AGR %, CAGR %) (U-Shaped Recovery)
Table 6.35 Guatemala Geothermal Power Market by Generation Capacity Forecast 2021-2031 (Gigawatt Electrical, AGR %, CAGR %) (L-Shaped Recovery)
Table 6.36 Rest of Americas Geothermal Power Market by Generation Capacity Forecast 2021-2031 (Gigawatt Electrical, AGR %, CAGR %)
Table 6.37 Rest of Americas Geothermal Power Market by Generation Capacity Forecast 2021-2031 (Gigawatt Electrical, AGR %, CAGR %) (V-Shaped Recovery)
Table 6.38 Rest of Americas Geothermal Power Market by Generation Capacity Forecast 2021-2031 (Gigawatt Electrical, AGR %, CAGR %) (W-Shaped Recovery)
Table 6.39 Rest of Americas Geothermal Power Market by Generation Capacity Forecast 2021-2031 (Gigawatt Electrical, AGR %, CAGR %) (U-Shaped Recovery)
Table 6.40 Rest of Americas Geothermal Power Market by Generation Capacity Forecast 2021-2031 (Gigawatt Electrical, AGR %, CAGR %) (L-Shaped Recovery)
Table 6.41 Americas Geothermal Power Market by Resource Type Forecast 2021-2031 (Gigawatt Electrical, AGR %, CAGR %)
Table 6.42 Americas Geothermal Power Market by Resource Type Forecast 2021-2031 (Gigawatt Electrical, AGR %, CAGR %) (V-Shaped Recovery)
Table 6.43 Americas Geothermal Power Market by Resource Type Forecast 2021-2031 (Gigawatt Electrical, AGR %, CAGR %) (W-Shaped Recovery)
Table 6.44 Americas Geothermal Power Market by Resource Type Forecast 2021-2031 (Gigawatt Electrical, AGR %, CAGR %) (U-Shaped Recovery)
Table 6.45 Americas Geothermal Power Market by Resource Type Forecast 2021-2031 (Gigawatt Electrical, AGR %, CAGR %) (L-Shaped Recovery)
Table 6.46 Americas Geothermal Power Market by Technology Forecast 2021-2031 (Gigawatt Electrical, AGR %, CAGR %)
Table 6.47 Americas Geothermal Power Market by Technology Forecast 2021-2031 (Gigawatt Electrical, AGR %, CAGR %) (V-Shaped Recovery)
Table 6.48 Americas Geothermal Power Market by Technology Forecast 2021-2031 (Gigawatt Electrical, AGR %, CAGR %) (W-Shaped Recovery)
Table 6.49 Americas Geothermal Power Market by Technology Forecast 2021-2031 (Gigawatt Electrical, AGR %, CAGR %) (U-Shaped Recovery)
Table 6.50 Americas Geothermal Power Market by Technology Forecast 2021-2031 (Gigawatt Electrical, AGR %, CAGR %) (L-Shaped Recovery)
Table 6.51 Americas Geothermal Power Market by End-User Forecast 2021-2031 (Gigawatt Electrical, AGR %, CAGR %)
Table 6.52 Americas Geothermal Power Market by End-User Forecast 2021-2031 (Gigawatt Electrical, AGR %, CAGR %) (V-Shaped Recovery)
Table 6.53 Americas Geothermal Power Market by End-User Forecast 2021-2031 (Gigawatt Electrical, AGR %, CAGR %) (W-Shaped Recovery)
Table 6.54 Americas Geothermal Power Market by End-User Forecast 2021-2031 (Gigawatt Electrical, AGR %, CAGR %) (U-Shaped Recovery)
Table 6.55 Americas Geothermal Power Market by End-User Forecast 2021-2031 (Gigawatt Electrical, AGR %, CAGR %) (L-Shaped Recovery)
Table 6.56 Americas Geothermal Power Market by Power Station Type Forecast 2021-2031 (Gigawatt Electrical, AGR %, CAGR %)
Table 6.57 Americas Geothermal Power Market by Power Station Type Forecast 2021-2031 (Gigawatt Electrical, AGR %, CAGR %) (V-Shaped Recovery)
Table 6.58 Americas Geothermal Power Market by Power Station Type Forecast 2021-2031 (Gigawatt Electrical, AGR %, CAGR %) (W-Shaped Recovery)
Table 6.59 Americas Geothermal Power Market by Power Station Type Forecast 2021-2031 (Gigawatt Electrical, AGR %, CAGR %) (U-Shaped Recovery)
Table 6.60 Americas Geothermal Power Market by Power Station Type Forecast 2021-2031 (Gigawatt Electrical, AGR %, CAGR %) (L-Shaped Recovery)
Table 7.1 Europe Geothermal Power Market by Generation Capacity Forecast 2021-2031 (Gigawatt Electrical, AGR %, CAGR %)
Table 7.2 Europe Geothermal Power Market by Generation Capacity Forecast 2021-2031 (Gigawatt Electrical, AGR %, CAGR %) (V-Shaped Recovery)
Table 7.3 Europe Geothermal Power Market by Generation Capacity Forecast 2021-2031 (Gigawatt Electrical, AGR %, CAGR %) (W-Shaped Recovery)
Table 7.4 Europe Geothermal Power Market by Generation Capacity Forecast 2021-2031 (Gigawatt Electrical, AGR %, CAGR %) (U-Shaped Recovery)
Table 7.5 Europe Geothermal Power Market by Generation Capacity Forecast 2021-2031 (Gigawatt Electrical, AGR %, CAGR %) (L-Shaped Recovery)
Table 7.6 Italy Geothermal Power Market by Generation Capacity Forecast 2021-2031 (Gigawatt Electrical, AGR %, CAGR %)
Table 7.7 Italy Geothermal Power Market by Generation Capacity Forecast 2021-2031 (Gigawatt Electrical, AGR %, CAGR %) (V-Shaped Recovery)
Table 7.8 Italy Geothermal Power Market by Generation Capacity Forecast 2021-2031 (Gigawatt Electrical, AGR %, CAGR %) (W-Shaped Recovery)
Table 7.9 Italy Geothermal Power Market by Generation Capacity Forecast 2021-2031 (Gigawatt Electrical, AGR %, CAGR %) (U-Shaped Recovery)
Table 7.10 Italy Geothermal Power Market by Generation Capacity Forecast 2021-2031 (Gigawatt Electrical, AGR %, CAGR %) (L-Shaped Recovery)
Table 7.11 Iceland Geothermal Power Market by Generation Capacity Forecast 2021-2031 (Gigawatt Electrical, AGR %, CAGR %)
Table 7.12 Iceland Geothermal Power Market by Generation Capacity Forecast 2021-2031 (Gigawatt Electrical, AGR %, CAGR %) (V-Shaped Recovery)
Table 7.13 Iceland Geothermal Power Market by Generation Capacity Forecast 2021-2031 (Gigawatt Electrical, AGR %, CAGR %) (W-Shaped Recovery)
Table 7.14 Iceland Geothermal Power Market by Generation Capacity Forecast 2021-2031 (Gigawatt Electrical, AGR %, CAGR %) (U-Shaped Recovery)
Table 7.15 Iceland Geothermal Power Market by Generation Capacity Forecast 2021-2031 (Gigawatt Electrical, AGR %, CAGR %) (L-Shaped Recovery)
Table 7.16 Russia Geothermal Power Market by Generation Capacity Forecast 2021-2031 (Gigawatt Electrical, AGR %, CAGR %)
Table 7.17 Russia Geothermal Power Market by Generation Capacity Forecast 2021-2031 (Gigawatt Electrical, AGR %, CAGR %) (V-Shaped Recovery)
Table 7.18 Russia Geothermal Power Market by Generation Capacity Forecast 2021-2031 (Gigawatt Electrical, AGR %, CAGR %) (W-Shaped Recovery)
Table 7.19 Russia Geothermal Power Market by Generation Capacity Forecast 2021-2031 (Gigawatt Electrical, AGR %, CAGR %) (U-Shaped Recovery)
Table 7.20 Russia Geothermal Power Market by Generation Capacity Forecast 2021-2031 (Gigawatt Electrical, AGR %, CAGR %) (L-Shaped Recovery)
Table 7.21 Germany Geothermal Power Market by Generation Capacity Forecast 2021-2031 (Gigawatt Electrical, AGR %, CAGR %)
Table 7.22 Germany Geothermal Power Market by Generation Capacity Forecast 2021-2031 (Gigawatt Electrical, AGR %, CAGR %) (V-Shaped Recovery)
Table 7.23 Germany Geothermal Power Market by Generation Capacity Forecast 2021-2031 (Gigawatt Electrical, AGR %, CAGR %) (W-Shaped Recovery)
Table 7.24 Germany Geothermal Power Market by Generation Capacity Forecast 2021-2031 (Gigawatt Electrical, AGR %, CAGR %) (U-Shaped Recovery)
Table 7.25 Germany Geothermal Power Market by Generation Capacity Forecast 2021-2031 (Gigawatt Electrical, AGR %, CAGR %) (L-Shaped Recovery)
Table 7.26 France Geothermal Power Market by Generation Capacity Forecast 2021-2031 (Gigawatt Electrical, AGR %, CAGR %)
Table 7.27 France Geothermal Power Market by Generation Capacity Forecast 2021-2031 (Gigawatt Electrical, AGR %, CAGR %) (V-Shaped Recovery)
Table 7.28 France Geothermal Power Market by Generation Capacity Forecast 2021-2031 (Gigawatt Electrical, AGR %, CAGR %) (W-Shaped Recovery)
Table 7.29 France Geothermal Power Market by Generation Capacity Forecast 2021-2031 (Gigawatt Electrical, AGR %, CAGR %) (U-Shaped Recovery)
Table 7.30 France Geothermal Power Market by Generation Capacity Forecast 2021-2031 (Gigawatt Electrical, AGR %, CAGR %) (L-Shaped Recovery)
Table 7.31 Rest of Europe Geothermal Power Market by Generation Capacity Forecast 2021-2031 (Gigawatt Electrical, AGR %, CAGR %)
Table 7.32 Rest of Europe Geothermal Power Market by Generation Capacity Forecast 2021-2031 (Gigawatt Electrical, AGR %, CAGR %) (V-Shaped Recovery)
Table 7.33 Rest of Europe Geothermal Power Market by Generation Capacity Forecast 2021-2031 (Gigawatt Electrical, AGR %, CAGR %) (W-Shaped Recovery)
Table 7.34 Rest of Europe Geothermal Power Market by Generation Capacity Forecast 2021-2031 (Gigawatt Electrical, AGR %, CAGR %) (U-Shaped Recovery)
Table 7.35 Rest of Europe Geothermal Power Market by Generation Capacity Forecast 2021-2031 (Gigawatt Electrical, AGR %, CAGR %) (L-Shaped Recovery)
Table 7.36 Europe Geothermal Power Market by Resource Type Forecast 2021-2031 (Gigawatt Electrical, AGR %, CAGR %)
Table 7.37 Europe Geothermal Power Market by Resource Type Forecast 2021-2031 (Gigawatt Electrical, AGR %, CAGR %) (V-Shaped Recovery)
Table 7.38 Europe Geothermal Power Market by Resource Type Forecast 2021-2031 (Gigawatt Electrical, AGR %, CAGR %) (W-Shaped Recovery)
Table 7.39 Europe Geothermal Power Market by Resource Type Forecast 2021-2031 (Gigawatt Electrical, AGR %, CAGR %) (U-Shaped Recovery)
Table 7.40 Europe Geothermal Power Market by Resource Type Forecast 2021-2031 (Gigawatt Electrical, AGR %, CAGR %) (L-Shaped Recovery)
Table 7.41 Europe Geothermal Power Market by Technology Forecast 2021-2031 (Gigawatt Electrical, AGR %, CAGR %)
Table 7.42 Europe Geothermal Power Market by Technology Forecast 2021-2031 (Gigawatt Electrical, AGR %, CAGR %) (V-Shaped Recovery)
Table 7.43 Europe Geothermal Power Market by Technology Forecast 2021-2031 (Gigawatt Electrical, AGR %, CAGR %) (W-Shaped Recovery)
Table 7.44 Europe Geothermal Power Market by Technology Forecast 2021-2031 (Gigawatt Electrical, AGR %, CAGR %) (U-Shaped Recovery)
Table 7.45 Europe Geothermal Power Market by Technology Forecast 2021-2031 (Gigawatt Electrical, AGR %, CAGR %) (L-Shaped Recovery)
Table 7.46 Europe Geothermal Power Market by End-User Forecast 2021-2031 (Gigawatt Electrical, AGR %, CAGR %)
Table 7.47 Europe Geothermal Power Market by End-User Forecast 2021-2031 (Gigawatt Electrical, AGR %, CAGR %) (V-Shaped Recovery)
Table 7.48 Europe Geothermal Power Market by End-User Forecast 2021-2031 (Gigawatt Electrical, AGR %, CAGR %) (W-Shaped Recovery)
Table 7.49 Europe Geothermal Power Market by End-User Forecast 2021-2031 (Gigawatt Electrical, AGR %, CAGR %) (U-Shaped Recovery)
Table 7.50 Europe Geothermal Power Market by End-User Forecast 2021-2031 (Gigawatt Electrical, AGR %, CAGR %) (L-Shaped Recovery)
Table 7.51 Europe Geothermal Power Market by Power Station Type Forecast 2021-2031 (Gigawatt Electrical, AGR %, CAGR %)
Table 7.52 Europe Geothermal Power Market by Power Station Type Forecast 2021-2031 (Gigawatt Electrical, AGR %, CAGR %) (V-Shaped Recovery)
Table 7.53 Europe Geothermal Power Market by Power Station Type Forecast 2021-2031 (Gigawatt Electrical, AGR %, CAGR %) (W-Shaped Recovery)
Table 7.54 Europe Geothermal Power Market by Power Station Type Forecast 2021-2031 (Gigawatt Electrical, AGR %, CAGR %) (U-Shaped Recovery)
Table 7.55 Europe Geothermal Power Market by Power Station Type Forecast 2021-2031 (Gigawatt Electrical, AGR %, CAGR %) (L-Shaped Recovery)
Table 8.1 Asia-Pacific Geothermal Power Market by Generation Capacity Forecast 2021-2031 (Gigawatt Electrical, AGR %, CAGR %)
Table 8.2 Asia-Pacific Geothermal Power Market by Generation Capacity Forecast 2021-2031 (Gigawatt Electrical, AGR %, CAGR %) (V-Shaped Recovery)
Table 8.3 Asia-Pacific Geothermal Power Market by Generation Capacity Forecast 2021-2031 (Gigawatt Electrical, AGR %, CAGR %) (W-Shaped Recovery)
Table 8.4 Asia-Pacific Geothermal Power Market by Generation Capacity Forecast 2021-2031 (Gigawatt Electrical, AGR %, CAGR %) (U-Shaped Recovery)
Table 8.5 Asia-Pacific Geothermal Power Market by Generation Capacity Forecast 2021-2031 (Gigawatt Electrical, AGR %, CAGR %) (L-Shaped Recovery)
Table 8.6 Indonesia Geothermal Power Market by Generation Capacity Forecast 2021-2031 (Gigawatt Electrical, AGR %, CAGR %)
Table 8.7 Indonesia Geothermal Power Market by Generation Capacity Forecast 2021-2031 (Gigawatt Electrical, AGR %, CAGR %) (V-Shaped Recovery)
Table 8.8 Indonesia Geothermal Power Market by Generation Capacity Forecast 2021-2031 (Gigawatt Electrical, AGR %, CAGR %) (W-Shaped Recovery)
Table 8.9 Indonesia Geothermal Power Market by Generation Capacity Forecast 2021-2031 (Gigawatt Electrical, AGR %, CAGR %) (U-Shaped Recovery)
Table 8.10 Indonesia Geothermal Power Market by Generation Capacity Forecast 2021-2031 (Gigawatt Electrical, AGR %, CAGR %) (L-Shaped Recovery)
Table 8.11 Philippines Geothermal Power Market by Generation Capacity Forecast 2021-2031 (Gigawatt Electrical, AGR %, CAGR %)
Table 8.12 Philippines Geothermal Power Market by Generation Capacity Forecast 2021-2031 (Gigawatt Electrical, AGR %, CAGR %) (V-Shaped Recovery)
Table 8.13 Philippines Geothermal Power Market by Generation Capacity Forecast 2021-2031 (Gigawatt Electrical, AGR %, CAGR %) (W-Shaped Recovery)
Table 8.14 Philippines Geothermal Power Market by Generation Capacity Forecast 2021-2031 (Gigawatt Electrical, AGR %, CAGR %) (U-Shaped Recovery)
Table 8.15 Philippines Geothermal Power Market by Generation Capacity Forecast 2021-2031 (Gigawatt Electrical, AGR %, CAGR %) (L-Shaped Recovery)
Table 8.16 New Zealand Geothermal Power Market by Generation Capacity Forecast 2021-2031 (Gigawatt Electrical, AGR %, CAGR %)
Table 8.17 New Zealand Geothermal Power Market by Generation Capacity Forecast 2021-2031 (Gigawatt Electrical, AGR %, CAGR %) (V-Shaped Recovery)
Table 8.18 New Zealand Geothermal Power Market by Generation Capacity Forecast 2021-2031 (Gigawatt Electrical, AGR %, CAGR %) (W-Shaped Recovery)
Table 8.19 New Zealand Geothermal Power Market by Generation Capacity Forecast 2021-2031 (Gigawatt Electrical, AGR %, CAGR %) (U-Shaped Recovery)
Table 8.20 New Zealand Geothermal Power Market by Generation Capacity Forecast 2021-2031 (Gigawatt Electrical, AGR %, CAGR %) (L-Shaped Recovery)
Table 8.21 Japan Geothermal Power Market by Generation Capacity Forecast 2021-2031 (Gigawatt Electrical, AGR %, CAGR %)
Table 8.22 Japan Geothermal Power Market by Generation Capacity Forecast 2021-2031 (Gigawatt Electrical, AGR %, CAGR %) (V-Shaped Recovery)
Table 8.23 Japan Geothermal Power Market by Generation Capacity Forecast 2021-2031 (Gigawatt Electrical, AGR %, CAGR %) (W-Shaped Recovery)
Table 8.24 Japan Geothermal Power Market by Generation Capacity Forecast 2021-2031 (Gigawatt Electrical, AGR %, CAGR %) (U-Shaped Recovery)
Table 8.25 Japan Geothermal Power Market by Generation Capacity Forecast 2021-2031 (Gigawatt Electrical, AGR %, CAGR %) (L-Shaped Recovery)
Table 8.26 China Geothermal Power Market by Generation Capacity Forecast 2021-2031 (Gigawatt Electrical, AGR %, CAGR %)
Table 8.27 China Geothermal Power Market by Generation Capacity Forecast 2021-2031 (Gigawatt Electrical, AGR %, CAGR %) (V-Shaped Recovery)
Table 8.28 China Geothermal Power Market by Generation Capacity Forecast 2021-2031 (Gigawatt Electrical, AGR %, CAGR %) (W-Shaped Recovery)
Table 8.29 China Geothermal Power Market by Generation Capacity Forecast 2021-2031 (Gigawatt Electrical, AGR %, CAGR %) (U-Shaped Recovery)
Table 8.30 China Geothermal Power Market by Generation Capacity Forecast 2021-2031 (Gigawatt Electrical, AGR %, CAGR %) (L-Shaped Recovery)
Table 8.31 Rest of Asia-Pacific Geothermal Power Market by Generation Capacity Forecast 2021-2031 (Gigawatt Electrical, AGR %, CAGR %)
Table 8.32 Rest of Asia-Pacific Geothermal Power Market by Generation Capacity Forecast 2021-2031 (Gigawatt Electrical, AGR %, CAGR %) (V-Shaped Recovery)
Table 8.33 Rest of Asia-Pacific Geothermal Power Market by Generation Capacity Forecast 2021-2031 (Gigawatt Electrical, AGR %, CAGR %) (W-Shaped Recovery)
Table 8.34 Rest of Asia-Pacific Geothermal Power Market by Generation Capacity Forecast 2021-2031 (Gigawatt Electrical, AGR %, CAGR %) (U-Shaped Recovery)
Table 8.35 Rest of Asia-Pacific Geothermal Power Market by Generation Capacity Forecast 2021-2031 (Gigawatt Electrical, AGR %, CAGR %) (L-Shaped Recovery)
Table 8.36 Asia-Pacific Geothermal Power Market by Resource Type Forecast 2021-2031 (Gigawatt Electrical, AGR %, CAGR %)
Table 8.37 Asia-Pacific Geothermal Power Market by Resource Type Forecast 2021-2031 (Gigawatt Electrical, AGR %, CAGR %) (V-Shaped Recovery)
Table 8.38 Asia-Pacific Geothermal Power Market by Resource Type Forecast 2021-2031 (Gigawatt Electrical, AGR %, CAGR %) (W-Shaped Recovery)
Table 8.39 Asia-Pacific Geothermal Power Market by Resource Type Forecast 2021-2031 (Gigawatt Electrical, AGR %, CAGR %) (U-Shaped Recovery)
Table 8.40 Asia-Pacific Geothermal Power Market by Resource Type Forecast 2021-2031 (Gigawatt Electrical, AGR %, CAGR %) (L-Shaped Recovery)
Table 8.41 Asia-Pacific Geothermal Power Market by Technology Forecast 2021-2031 (Gigawatt Electrical, AGR %, CAGR %)
Table 8.42 Asia-Pacific Geothermal Power Market by Technology Forecast 2021-2031 (Gigawatt Electrical, AGR %, CAGR %) (V-Shaped Recovery)
Table 8.43 Asia-Pacific Geothermal Power Market by Technology Forecast 2021-2031 (Gigawatt Electrical, AGR %, CAGR %) (W-Shaped Recovery)
Table 8.44 Asia-Pacific Geothermal Power Market by Technology Forecast 2021-2031 (Gigawatt Electrical, AGR %, CAGR %) (U-Shaped Recovery)
Table 8.45 Asia-Pacific Geothermal Power Market by Technology Forecast 2021-2031 (Gigawatt Electrical, AGR %, CAGR %) (L-Shaped Recovery)
Table 8.46 Asia-Pacific Geothermal Power Market by End-User Forecast 2021-2031 (Gigawatt Electrical, AGR %, CAGR %)
Table 8.47 Asia-Pacific Geothermal Power Market by End-User Forecast 2021-2031 (Gigawatt Electrical, AGR %, CAGR %) (V-Shaped Recovery)
Table 8.48 Asia-Pacific Geothermal Power Market by End-User Forecast 2021-2031 (Gigawatt Electrical, AGR %, CAGR %) (W-Shaped Recovery)
Table 8.49 Asia-Pacific Geothermal Power Market by End-User Forecast 2021-2031 (Gigawatt Electrical, AGR %, CAGR %) (U-Shaped Recovery)
Table 8.50 Asia-Pacific Geothermal Power Market by End-User Forecast 2021-2031 (Gigawatt Electrical, AGR %, CAGR %) (L-Shaped Recovery)
Table 8.51 Asia-Pacific Geothermal Power Market by Power Station Type Forecast 2021-2031 (Gigawatt Electrical, AGR %, CAGR %)
Table 8.52 Asia-Pacific Geothermal Power Market by Power Station Type Forecast 2021-2031 (Gigawatt Electrical, AGR %, CAGR %) (V-Shaped Recovery)
Table 8.53 Asia-Pacific Geothermal Power Market by Power Station Type Forecast 2021-2031 (Gigawatt Electrical, AGR %, CAGR %) (W-Shaped Recovery)
Table 8.54 Asia-Pacific Geothermal Power Market by Power Station Type Forecast 2021-2031 (Gigawatt Electrical, AGR %, CAGR %) (U-Shaped Recovery)
Table 8.55 Asia-Pacific Geothermal Power Market by Power Station Type Forecast 2021-2031 (Gigawatt Electrical, AGR %, CAGR %) (L-Shaped Recovery)
Table 9.1 Rest of World Geothermal Power Market by Generation Capacity Forecast 2021-2031 (Gigawatt Electrical, AGR %, CAGR %)
Table 9.2 Rest of World Geothermal Power Market by Generation Capacity Forecast 2021-2031 (Gigawatt Electrical, AGR %, CAGR %) (V-Shaped Recovery)
Table 9.3 Rest of World Geothermal Power Market by Generation Capacity Forecast 2021-2031 (Gigawatt Electrical, AGR %, CAGR %) (W-Shaped Recovery)
Table 9.4 Rest of World Geothermal Power Market by Generation Capacity Forecast 2021-2031 (Gigawatt Electrical, AGR %, CAGR %) (U-Shaped Recovery)
Table 9.5 Rest of World Geothermal Power Market by Generation Capacity Forecast 2021-2031 (Gigawatt Electrical, AGR %, CAGR %) (L-Shaped Recovery)
Table 9.6 Turkey Geothermal Power Market by Generation Capacity Forecast 2021-2031 (Gigawatt Electrical, AGR %, CAGR %)
Table 9.7 Turkey Geothermal Power Market by Generation Capacity Forecast 2021-2031 (Gigawatt Electrical, AGR %, CAGR %) (V-Shaped Recovery)
Table 9.8 Turkey Geothermal Power Market by Generation Capacity Forecast 2021-2031 (Gigawatt Electrical, AGR %, CAGR %) (W-Shaped Recovery)
Table 9.9 Turkey Geothermal Power Market by Generation Capacity Forecast 2021-2031 (Gigawatt Electrical, AGR %, CAGR %) (U-Shaped Recovery)
Table 9.10 Turkey Geothermal Power Market by Generation Capacity Forecast 2021-2031 (Gigawatt Electrical, AGR %, CAGR %) (L-Shaped Recovery)
Table 9.11 Kenya Geothermal Power Market by Generation Capacity Forecast 2021-2031 (Gigawatt Electrical, AGR %, CAGR %)
Table 9.12 Kenya Geothermal Power Market by Generation Capacity Forecast 2021-2031 (Gigawatt Electrical, AGR %, CAGR %) (V-Shaped Recovery)
Table 9.13 Kenya Geothermal Power Market by Generation Capacity Forecast 2021-2031 (Gigawatt Electrical, AGR %, CAGR %) (W-Shaped Recovery)
Table 9.14 Kenya Geothermal Power Market by Generation Capacity Forecast 2021-2031 (Gigawatt Electrical, AGR %, CAGR %) (U-Shaped Recovery)
Table 9.15 Kenya Geothermal Power Market by Generation Capacity Forecast 2021-2031 (Gigawatt Electrical, AGR %, CAGR %) (L-Shaped Recovery)
Table 9.16 Ethiopia Geothermal Power Market by Generation Capacity Forecast 2021-2031 (Gigawatt Electrical, AGR %, CAGR %)
Table 9.17 Ethiopia Geothermal Power Market by Generation Capacity Forecast 2021-2031 (Gigawatt Electrical, AGR %, CAGR %) (V-Shaped Recovery)
Table 9.18 Ethiopia Geothermal Power Market by Generation Capacity Forecast 2021-2031 (Gigawatt Electrical, AGR %, CAGR %) (W-Shaped Recovery)
Table 9.19 Ethiopia Geothermal Power Market by Generation Capacity Forecast 2021-2031 (Gigawatt Electrical, AGR %, CAGR %) (U-Shaped Recovery)
Table 9.20 Ethiopia Geothermal Power Market by Generation Capacity Forecast 2021-2031 (Gigawatt Electrical, AGR %, CAGR %) (L-Shaped Recovery)
Table 9.21 Rest of Rest of World Geothermal Power Market by Generation Capacity Forecast 2021-2031 (Gigawatt Electrical, AGR %, CAGR %)
Table 10.1 Atlas Copco Group: Company Information
Table 10.2 Atlas Copco Group Company: Company Revenue 2015-2019 (US$Mn, AGR %)
Table 10.3 Atlas Copco Group: Company Product and Service Offerings
Table 10.4 Atlas Copco Group: Company Recent Developments till July,2020
Table 10.5 Kenya Electricity Generating: Company Information
Table 10.6 Kenya Electricity Generating Company: Company Revenue 2015-2019 (US$Mn, AGR %)
Table 10.7 Kenya Electricity Generating: Company Product and Service Offerings
Table 10.8 Kenya Electricity Generating: Company Recent Developments till July,2020
Table 10.9 Electra Therm Inc: Company Information
Table 10.10 Electra Therm Inc: Company Product and Service Offerings
Table 10.11 Electra Therm Inc: Company Recent Developments till July,2020
Table 10.12 Ormat Technologies, Inc.: Company Information
Table 10.13 Ormat Technologies, Inc Company: Company Revenue 2015-2019 (US$Mn, AGR %)
Table 10.14 Ormat Technologies, Inc: Company Product and Service Offerings
Table 10.15 Ormat Technologies, Inc: Company Recent Developments till July,2020
Table 10.1 Ansaldo Energia: Company Information
Table 10.17 Ansaldo Energia: Company Product and Service Offerings
Table 10.18 General Electric: Company Information
Table 10.19 General Electric Company: Company Revenue 2015-2019 (US$Mn, AGR %)
Table 10.20 General Electric: Company Product and Service Offerings
Table 10.21 General Electric: Company Recent Developments till July,2020
Table 10.22 Toshiba Corporation: Company Information
Table 10.23 Toshiba Corporation Company: Company Revenue 2015-2019 (US$Mn, AGR %)
Table 10.24 Toshiba Corporation: Company Product and Service Offerings
Table 10.25 Toshiba Corporation: Company Recent Developments till July,2020
Table 10.26 Fuji Electric Co., Ltd: Company Information
Table 10.27 Fuji Electric Co. Ltd Company: Company Revenue 2015-2019 (US$Mn, AGR %)
Table 10.28 Fuji Electric Co. Ltd: Company Product and Service Offerings
Table 10.29 Fuji Electric Co. Ltd: Company Recent Developments till July,2020
Table 10.30 Halliburton: Company Information
Table 10.31 Halliburton Company: Company Revenue 2015-2019 (US$Mn, AGR %)
Table 10.32 Halliburton: Company Product and Service Offerings
Table 10.33 Halliburton: Company Recent Developments till July,2020
Table 10.34 Enel SpA: Company Information
Table 10.35 Enel SpA Company: Company Revenue 2015-2019 (US$Mn, AGR %)
Table 10.36 Enel SpA : Company Product and Service Offerings
Table 10.37 Enel SpA : Company Recent Developments till July,2020
Table 10.38 John Wood Group: Company Information
Table 10.39 John Wood Group PLC Company: Company Revenue 2015-2019 (US$Mn, AGR %)
Table 10.40 John Wood Group PLC : Company Product and Service Offerings
Table 10.41 John Wood Group PLC : Company Recent Developments till July,2020
Table 10.42 Calpine Corporation: Company Information
Table 10.43 Calpine Corporation: Company Product and Service Offerings
Table 10.44 Terra-Gen: Company Information
Table 10.45 Terra-Gen: Company Product and Service Offerings
Table 10.46 Berkshire Hathaway Energy: Company Information
Table 10.47 Berkshire Hathaway Energy Company: Company Revenue 2015-2019 (US$Mn, AGR %)
Table 10.48 Berkshire Hathaway Energy: Company Product and Service Offerings
Table 10.49 Mitsubishi Heavy Industries Limited: Company Information
Table 10.50 Mitsubishi Heavy Industries Limited Company: Company Revenue 2015-2019 (US$Mn, AGR %)
Table 10.51 Mitsubishi Heavy Industries Limited: Company Product and Service Offerings
Table 10.52 Terra-Gen: Company Product and Service Offerings
Table 10.53 Chevron Corporation: Company Information
Table 10.54 Chevron Corporation Company: Company Revenue 2015-2019 (US$Mn, AGR %)
Table 10.55 Chevron Corporation: Company Product and Service Offerings
Table 10.56 Chevron Corporation: Company Product and Service Offerings
Table 10.57 PT Pertamina Geothermal Energy: Company Information
Table 10.58 PT Pertamina Geothermal Energy: Company Product and Service Offerings
Table 10.59 Innergex Renewable Energy Inc: Company Information
Table 10.60 Innergex Renewable Energy Inc Company: Company Revenue 2015-2019 (US$Mn, AGR %)
Table 10.61 Innergex Renewable Energy Inc: Company Product and Service Offerings
Table 10.62 Innergex Renewable Energy Inc: Company Product and Service Offerings
List of Companies Profiled in the report
Ansaldo Energia
Atlas Copco AB
Berkshire Hathaway Energy
Calpine Corporation
Chevron Corporation
Electra Therm Inc.
Enel SpA
Fuji Electric Co., Ltd.
General Electric Company
Halliburton Company
Innergex Renewable Energy Inc.
John Wood Group PLC
Kenya Electricity Generating Company Limited
Mitsubishi Heavy Industries Limited
Ormat Technologies, Inc.
PT Pertamina Geothermal Energy
Terra-Gen Company
Toshiba Corporation
List of Other Companies Mentioned in the report
Akita Geothermal Energy Co
Alstom
Alternative Earth Resources, Inc.
Amedee Geothermal Venture
Ansaldo Energia
Beowawe Power LLC
Berkshire Hathaway
Bflat
Biliran Geothermal Incorporated
BM Enerji
BM Holdings
Bottle Rock Power PLC
BPPT
CalEnergy Generation
Calpine Corporation
CELIKLER
CFG Services
Chena Hot Springs
Chevron Energy
Chevron Geothermal India
Chevron Geothermal Philippines Holdings
Chuo Electric Power Co
Compania Federal de Electricidad
Constellation Energy
Contact Energy
Corbetti Geothermal
Coso Operating Co.
Costa Rican Electricity Institute (ICE)
Daldrup & Sohne AG
ElectraTherm, Inc.
Electric Power Development Co
Electric Power Tibet
Électricité de France Développement Environnement
Emerging Power Incorporated (EPI)
Empresa de Generacion de Energia Electrica del INDE
Empresa Nicaraguense de Electricidad (ENEL)
Empresa Transmisora de El Salvador (ETESAL)
ENAP
ENDA Enerji
Endesa Chile
Enel Green Power
Enel North America
Energy Development Corporation
Enex
Ergon Energy
Ethiopian Electric Power Corporation
European EGS Interest Group
Fuji Electric Co. Ltd.
General Electric
Geodipa
Geodynamics
Geonext Corporation
Geothermal Development Company
Global Geothermal Limited
Gradient Resources
Green Energy
Güris Holding
Halliburton
Hitachi Ltd
HL Power Company
Hokkaido Electric Power Co.
Home Stretch Geothermal
Hudson Ranch Energy Services
Iceland Drilling company
Idemitsu Kosan Co., Ltd.
Idemitsu Oita Geothermal
Instituto Costaricense de Electricidad
Japex Geothermal Kyushu Co
JV PetroEnergy
Kamchatskburgeotermiya
KenGen
Kokushokankokai
Kujyu Kanko Hotel
Kyushu Electric Power
LaGeo SA de CV
Landsvirkjun
Lihir Gold
Lt. Scandinavia Corporation
Magma Energy (US) Corp
Maibarara Geothermal Inc.
Maren Enerji
McGinness Hills
Menderes A.S.
Menderes Geothermal
Mighty River Power
Mitsubishi Heavy Industries Limited (MHI)
Mitsubishi Materials Co
National Power Company of Iceland
Nitetsu Kagoshima Geothermal Co
Northern California Power Agency
Orchid Business Group
Oriental Mindoro Electric Cooperative (Ormeco)
Orkuveita Reykjavikur
Ormat
Ormat Technologies Inc
Orpower Twenty Two
Oserian Development Company
PacificCorp Energy
PLN
PLTP
PNOC Renewables
PT Dizamatra Powerindo
PT Pertamina
PT Pertamina Geothermal Energy
PT PLN (Persero)
PT Rekayasa Industri
PT. Geo Dipa Energy
Ram Power Company
Raser Technologies
Reykjavik Emera Inc
Reykjavik Energy
Reykjavik Geothermal
Rican Electricity
SC Geoterm
Sejahtera Alam Energy
Sosian Energy
Southern California Edison
Stadtwerke Muenchen
Star Energy Ltd
Suginoi Hotel
Sumitomo Corporation
Surprise Valley Electric Corp.
Technologies, Inc.
Terra-Gen LLC
Tohoku Electric Power Co. Group
Tohoku Electric Power Co., Inc.
Tohoku Hydropower
Tokyo Electric Power
Top Energy
Toshiba Corporation
Tuaropaki Power Company
Turcas BM Kuyucak Jeotermal Elektrik
Turcas Energy Holding
U.S. Geothermal Inc.
Viridity Energy
Wasabi
Wayang Windu
Yuzawa Geothermal Power Corp
Zorlu Energy Group
List of Associations
Australia Geothermal Energy Association
Geothermal Direct-Use and Small Power Generation Projects
Geothermal Education Office
Geothermal Electrical Power Generation
Geothermal Energy Association
Geothermal Heat Pump Consortium
Geothermal Resources Council
Geothermal Technical Data and Information
Geysers Geothermal Association
International Ground Source Heat Pump Association
National Geothermal Collaborative
The International Geothermal Association (IGA)
US Geothermal Power Association
Worldwide Geothermal Resources