Visiongain has calculated that the global Thermal Energy Storage (TES) Market will see a capital expenditure (CAPEX) of $2,482 mn in 2017.Read on to discover the potential business opportunities available.
Due to a growing concern for depletion of conventional resources and the negative impact of fossil fuels on the environment, the need for a search for alternative and renewable energy sources has intensified. Renewable sources of energy have gained a wider acceptance for power generation due to their environmental benefits as well as abundance in nature. However, their intermittent nature is a topic of concern. Intermittent nature of renewable energy sources has created interest for energy storage technologies
Thermal Energy Storage Technology allows renewable energy to be stored for later use. It also allows renewable energy facilities to be designed to optimize the electricity load profile according to market needs. With the gradual shift from traditional fossil fuel based energy sources to the renewable energy, storage systems are becoming vitally important.
Thermal Energy Storage involves the storage of energy obtained from different energy sources for later use. It allows excess thermal energy to be stored and used hours, days, or even months later. It has applications in balancing the energy demand between daytime and night-time, storing summer heat for winter heating, or winter cold for summer air conditioning. There are mainly three forms of TES systems available and are being used today; they are Sensible heat storage, Latent heat storage and Thermo-Chemical Storage.
Thermal Energy Storage Technology enables storage of renewable energy and reduces greenhouse gases and delays or eliminates the need for more fossil fuel power plants. International agreements on climate change, such as the recent Paris Climate Agreement (2015), will continue to impact and support the deployment of TES, as stringent targets force emissions down.
The development of TES projects across the world is still largely dependent on power production and the investment in the field. Governments across the countries are increasing their renewable energy share, and the support of the projects which have storage facility is likely to drive the market
Visiongain’s global Thermal Energy Storage (TES) market report can keep you informed and up to date with the developments in the market, across four different regions: North America, Europe, Africa, Asia Pacific and Rest of the World.
With reference to this report, it details the key investments trend in the global market, subdivided by technology, Capital Expenditure, Material and Application. Through extensive secondary research and interviews with industry experts, Visiongain has identified a series of market trends that will impact the TES market over the forecast timeframe.
The report will answer questions such as:
– How is the thermal energy storage market evolving?
– What is driving and restraining the thermal energy storage market dynamics?
– What are the market shares of the submarkets of the thermal energy storage market in 2017?
– How will each thermal energy storage market segment grow over the forecast period and how much revenue will these submarkets account for in 2027?
– Which thermal energy storage market space will be the main driver for the overall market from 2017 to 2027?
– How will political and regulatory factors influence the market spaces and submarkets?
– How will the market shares of each market space change by 2027 and which geographical region will lead the market in 2027?
– Who are the leading players and what are their prospects over the forecast period?
Five Reasons Why You Must Order and Read This Report Today:
1) The report provides forecasts for the global Thermal Energy Storage (TES), as well as for 3 Technology submarkets, for the period 2017-2027
– Sensible Heat Storage CAPEX 2017-2027
– Latent Heat Storage CAPEX 2017-2027
– Thermo-Chemical Storage CAPEX 2017-2027
2) The report also forecasts and analyses the Thermal Energy Storage (TES) market by Material from 2017-2027
– Molten Salt CAPEX 2017-2027
– Water CAPEX 2017-2027
– Others CAPEX 2017-2027
3) The report forecasts and analyses the Thermal Energy Storage (TES) market by Application from 2017-2027
– Power Production CAPEX 2017-2027
– District & Process Heating and Cooling CAPEX 2017-2027
4) The report reveals where and how companies are investing in Thermal Energy Storage (TES). We show you the prospects for the following regions, as well as by national markets:
– North America Thermal Energy Storage CAPEX 2017-2027
– Europe Thermal Energy Storage CAPEX 2017-2027
– Asia Pacific Thermal Energy Storage CAPEX 2017-2027
– Rest of the World Thermal Energy Storage CAPEX 2017-2027
– US Thermal Energy Storage CAPEX 2017-2027
– China Thermal Energy CAPEX 2017-2027
– India Thermal Energy Storage CAPEX 2017-2027
– Australia Thermal Energy Storage CAPEX 2017-2027
– South Africa Thermal Energy Storage CAPEX 2017-2027
– Saudi Arabia Thermal Energy Storage CAPEX 2017-2027
– Chile Thermal Energy Storage CAPEX 2017-2027
– Morocco Thermal Energy Storage CAPEX 2017-2027
– Denmark Thermal Energy Storage CAPEX 2017-2027
– Israel Thermal Energy Storage CAPEX 2017-2027
– Rest of World Thermal Energy Storage CAPEX 2017-2027
5) The report provides detailed profiles of the leading companies operating within the TES market:
– SolarReserve
– Calmac Inc.
– Abengoa Solar
– BrightSource Energy
– Ice Energy
– Brenmiller Energy Ltd.
– Terrafore Technologies LLC
– Aalborg CSP A/S
– Cristopia Energy Systems
– SunCan Co. Ltd.
– SaltX Technology Holding AB
– Cryogel
This independent 144-page report guarantees you will remain better informed than your competitors. With 137 tables and figures examining the TES market space, the report gives you a direct, detailed breakdown of the market. PLUS, Capital expenditure BY Technology, Materials and Application submarkets, as well as in-Depth analysis of Contracts, Projects and Programmes from 2017-2027 that will keep your knowledge that one step ahead of your rivals.
This report is essential reading for you or anyone in the Energy sector. Purchasing this report today will help you to recognise those important market opportunities and understand the possibilities there. I look forward to receiving your order.
Visiongain is a trading partner with the US Federal Government
CCR Ref number: KD4R6
1. Report Overview
1.1 Global Thermal Energy Storage Market Overview
1.2 Thermal Storage Market Segmentation
1.3 Methodology
1.4 How This Report Delivers
1.5 Key Questions Answered by This Analytical Report Include:
1.6 Why You Should Read This Report
1.7 Frequently Asked Questions
1.8 Associated Visiongain Reports
1.9 About Visiongain
2. Introduction to the Thermal Energy Storage Market
2.1 Sensible Heat Storage
2.2 Latent Heat Storage
2.3 Thermo-Chemical Storage
3. Global Thermal Energy Storage Market Forecast 2017-2027
3.1 The Global Thermal Energy Storage (TES) Market Forecast 2017-2027
3.2 Drivers & Restraints in the Global Thermal Energy Storage (TES) Market 2017-2027
4. Thermal Energy Storage (TES) Technology Submarket Forecasts 2017-2027
4.1 Global Thermal Energy Storage Technology Submarket Forecast 2017-2027
4.2 Sensible Heat Storage Submarket Forecast 2017-2027
4.3 Latent Heat Storage Submarket Forecast 2017-2027
4.4 Thermo-Chemical Storage Submarket Forecast 2017-2027
5. Thermal Energy Storage (TES) Material Submarket Forecasts 2017-2027
5.1 Global Thermal Energy Storage Material Submarket Forecast 2017-2027
5.2 Molten Salt TES Submarket Forecast 2017-2027
5.3 Water TES Submarket Forecast 2017-2027
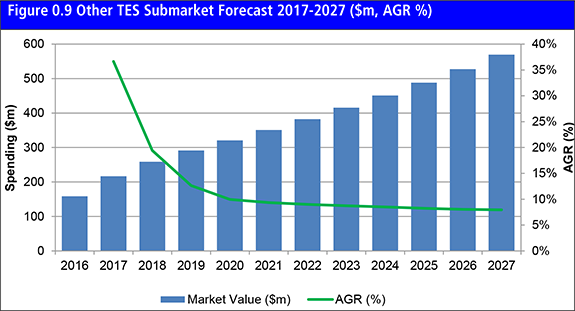
5.4 Other TES Submarket Forecast 2017-2027
6. Thermal Energy Storage (TES) Application Submarket Forecasts 2017-2027
6.1 Global Thermal Energy Storage Application Submarket Forecast 2017-2027
6.2 Power Production Submarket Forecast 2017-2027
6.3 District & Process Heating and Cooling Submarket Forecast 2017-2027
7. Thermal Energy Storage Regional Market Forecast 2017-2027
7.1 North America Thermal Energy Storage Market Forecast 2017 -2027
7.1.1 North America Thermal Energy Storage Market Analysis 2017 -2027
7.2 Europe Thermal Energy Storage Market Forecast 2017 -2027
7.2.1 Europe Thermal Energy Storage Market Analysis 2017 -2027
7.3 Asia Pacific Thermal Energy Storage Market Forecast 2017 -2027
7.3.1 Asia Pacific Thermal Energy Storage Market Analysis 2017 -2027
7.4 Rest of the World Thermal Energy Storage Market Forecast 2017 -2027
7.4.1 Rest of the World Thermal Energy Storage Market Analysis 2017 -2027
8. Leading National Thermal Energy Storage Market Forecast 2017-2027
8.1 The US Thermal Energy Storage Market Forecast 2017-2027
8.1.1 The US Thermal Energy Storage Market Analysis
8.1.2 US Thermal Energy Storage Projects
8.2 The China Thermal Energy Storage Market Forecast 2017-2027
8.2.1 The China Thermal Energy Storage Market Analysis
8.2.2 The China Thermal Energy Storage Projects
8.3 The India Thermal Energy Storage Market Forecast 2017-2027
8.3.1 The India Thermal Energy Storage Market Analysis
8.3.2 The India Thermal Energy Storage Projects
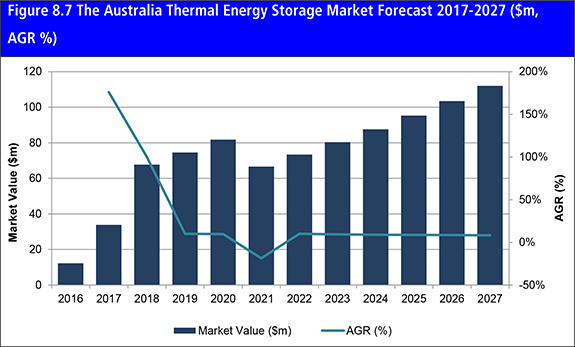
8.4 Australia Thermal Energy Storage Market Forecast 2017-2027
8.4.1 The Australia Thermal Energy Storage Market Analysis
8.4.2 The Australia Thermal Energy Storage Projects
8.5 South Africa Thermal Energy Storage Market Forecast 2017-2027
8.5.1 The South Africa Thermal Energy Storage Market Analysis
8.5.2 The South African Thermal Energy Storage Projects
8.6 Saudi Arabia Thermal Energy Storage Market Forecast 2017-2027
8.6.1 The Saudi Arabia Thermal Energy Storage Market Analysis
8.6.2 The Saudi Arabia Thermal Energy Storage Projects
8.7 Chile Thermal Energy Storage Market Forecast 2017-2027
8.7.1 The Chile Thermal Energy Storage Market Analysis
8.7.2 The Chile Thermal Energy Storage Projects
8.8 Morocco Thermal Energy Storage Market Forecast 2017-2027
8.8.1 The Morocco Thermal Energy Storage Market Analysis
8.8.2 The Morocco Thermal Energy Storage Projects
8.9 Denmark Thermal Energy Storage Market Forecast 2017-2027
8.9.1 The Denmark Thermal Energy Storage Market Analysis
8.9.2 The Denmark Thermal Energy Storage Projects
8.10 Israel Thermal Energy Storage Market Forecast 2017-2027
8.10.1 The Israel Thermal Energy Storage Market Analysis
8.10.2 The Israel Thermal Energy Storage Projects
8.11 Rest of World Thermal Energy Storage Market Forecast 2017-2027
8.11.1 The Rest of World Thermal Energy Storage Market Analysis
8.11.2 The Rest of World Thermal Energy Storage Projects
9. PEST Analysis of the Thermal Energy Storage Market
9.1 Political
9.2 Economic
9.3 Social
9.4 Technological
10. Leading Companies in the Thermal Energy Storage (TES) Market
10.1 SolarReserve
10.1.1 SolarReserve TES Technology
10.2 Calmac Inc.
10.2.1 Calmac TES Technology
10.3 Abengoa Solar
10.3.1 Abengoa Solar TES Technology
10.4 BrightSource Energy
10.4.1 BrightSource Energy TES Technology
10.5 Ice Energy
10.5.1 Ice Energy TES Technology
10.6 Brenmiller Energy Ltd.
10.6.1 Brenmiller Energy Ltd. TES Technology
10.7 Terrafore Technologies LLC
10.7.1 Terrafore Technologies TES Technology
10.8 Aalborg CSP A/S
10.8.1 Aalborg CSP A/S TES Technology
10.9 Cristopia Energy Systems
10.9.1 Cristopia Energy Systems TES Technology
10.10 SunCan Co. Ltd.
10.10.1 SunCan TES Technology
10.11 SaltX Technology Holding AB
10.11.1 SaltX Technology TES Technology
10.12 Cryogel
10.12.1 Cryogel TES Technology
10.13 Other Leading Companies
11. Conclusions and Recommendations
11.1 Key Findings
11.2 Recommendations
12. Glossary
Appendix
Associated Visiongain Reports
Visiongain Report Sales Order Form
Appendix A
Appendix B
Visiongain Report Evaluation Form
List of Tables
Table 2.1 Properties of Different Materials in the TES Market
Table 3.1 Global Thermal Energy Storage Market Forecast 2017-2027 ($m, AGR %, CAGR %, Cumulative)
Table 3.2 National GHG Emissions Reduction Targets for Leading National Markets
Table 4.1 Global Thermal Energy Storage Technology Submarkets Forecast 2017-2027 ($m, AGR %, Cumulative)
Table 4.2 Sensible Heat Storage Submarket Forecast 2017-2027 ($m, AGR %, CAGR %, Cumulative)
Table 4.3 Latent Heat Storage Submarket Forecast 2017-2027 ($m, AGR %, CAGR %, Cumulative)
Table 4.4 Thermo-Chemical Heat Storage Submarket Forecast 2017-2027 ($m, AGR %, CAGR %, Cumulative)
Table 5.1 Global Thermal Energy Storage Material Submarkets Forecast 2017-2027 ($m, AGR %, Cumulative)
Table 5.2 Molten Salt TES Submarket Forecast 2017-2027 ($m, AGR %, CAGR %, Cumulative)
Table 5.3 Water TES Submarket Forecast 2017-2027 ($m, AGR %, CAGR %, Cumulative)
Table 5.4 Other TES Submarket Forecast 2017-2027 ($m, AGR %, CAGR %, Cumulative)
Table 6.1 Global Thermal Energy Storage Application Submarkets Forecast 2017-2027 ($m, AGR %, Cumulative)
Table 6.2 Power Production Submarket Forecast 2017-2027 ($m, AGR %, CAGR %, Cumulative)
Table 6.3 District & Process Heating and Cooling Submarket Forecast 2017-2027 ($m, AGR %, CAGR %, Cumulative)
Table 7.1 Thermal Energy Storage Regional Market Forecast 2017-2027 ($m, AGR %, CAGR %, Cumulative)
Table 7.2 North America Thermal Energy Storage Market Forecast 2017-2027 ($m, AGR %, CAGR %, Cumulative)
Table 7.3 Europe Thermal Energy Storage Market Forecast 2017-2027 ($m, AGR %, CAGR %, Cumulative)
Table 7.4 Asia Pacific Thermal Energy Storage Market Forecast 2017-2027 ($m, AGR %, CAGR %, Cumulative)
Table 7.5 Rest of the World Thermal Energy Storage Market Forecast 2017-2027 ($m, AGR %, CAGR %, Cumulative)
Table 8.1 The US Thermal Energy Storage Market Forecast 2017-2027 ($m, AGR %, CAGR %, Cumulative)
Table 8.2 US Thermal Energy Storage Projects (Name, Location, Capacity, Company, Status)
Table 8.3 The China Thermal Energy Storage Market Forecast 2017-2027 ($m, AGR %, CAGR %, Cumulative)
Table 8.4 China Thermal Energy Storage Projects (Name, Location, Capacity, Company, Status)
Table 8.5 The India Thermal Energy Storage Market Forecast 2017-2027 ($m, AGR %, CAGR %, Cumulative)
Table 8.6 The India Thermal Energy Storage Projects (Name, Location, Capacity, Company, Status)
Table 8.7 The Australia Thermal Energy Storage Market Forecast 2017-2027 ($m, AGR %, CAGR %, Cumulative)
Table 8.8 The Australian Thermal Energy Storage Projects (Name, Location, Capacity, Company, Status)
Table 8.9 The South Africa Thermal Energy Storage Market Forecast 2017-2027 ($m, AGR %, CAGR %, Cumulative)
Table 8.10 The South African Thermal Energy Storage Projects (Name, Location, Capacity, Company, Status)
Table 8.11 The Saudi Arabia Thermal Energy Storage Market Forecast 2017-2027 ($m, AGR %, CAGR %, Cumulative)
Table 8.12 The Saudi Arabia Thermal Energy Storage Projects (Name, Location, Capacity, Company, Status)
Table 8.13 The Chile Thermal Energy Storage Market Forecast 2017-2027 ($m, AGR %, CAGR %, Cumulative)
Table 8.14 The South African Thermal Energy Storage Projects (Name, Location, Capacity, Company, Status)
Table 8.15 The Morocco Thermal Energy Storage Market Forecast 2017-2027 ($m, AGR %, CAGR %, Cumulative)
Table 8.17 The Denmark Thermal Energy Storage Market Forecast 2017-2027 ($m, AGR %, CAGR %, Cumulative)
Table 8.18 The Denmark Thermal Energy Storage Projects (Name, Location, Capacity, Company, Status)
Table 8.19 The Israel Thermal Energy Storage Market Forecast 2017-2027 ($m, AGR %, CAGR %, Cumulative)
Table 8.20 The Israel Thermal Energy Storage Projects (Name, Location, Capacity, Company, Status)
Table 8.21 The Rest of the World Thermal Energy Storage Market Forecast 2017-2027 ($m, AGR %, CAGR %, Cumulative)
Table 8.22 The Israel Thermal Energy Storage Projects (Name, Location, Capacity, Company, Status)
Table 10.1 SolarReserve Overview 2016 (Headquarter, CEO, Website)
Table 10.2 SolarReserve Thermal Energy Projects (Project, Country, Capacity, Details)
Table 10.3 Calmac Overview 2016 (Headquarter, CEO, Website)
Table 10.4 Calmac Thermal Energy Projects (Project, Country, Capacity, Details)
Table 10.5 Abengoa Solar Overview 2016 (Number of Employees, CEO, HQ, Ticker, Website)
Table 10.6 Abengoa Thermal Energy Projects (Project, Country, Capacity, Details)
Table 10.7 Abengoa Solar (Company Division, % of Revenue, Product and Services)
Table 10.8 BrightSource Energy Overview 2016 (Headquarter, CEO, Website)
Table 10.9 BrightSolar Energy Thermal Energy Projects (Project, Country, Capacity, Details)
Table 10.10 Ice Energy Overview 2016 (Number of Employees, HQ, CEO, Website)
Table 10.11 Ice Energy Thermal Energy Projects (Project, Country, Capacity, Details)
Table 10.12 Brenmiller Energy Ltd. Overview 2016 (Number of Employees, HQ, CEO, Website)
Table 10.13 Brenmiller Energy Ltd. Thermal Energy Projects (Project, Country, Capacity, Details)
Table 10.14 Terrafore Technologies Overview 2016 (Number of Employees, HQ, CEO, Website)
Table 10.15 Terrafore Technologies Thermal Energy Projects (Project, Country, Capacity, Details)
Table 10.16 Aalborg CSP A/S Overview 2016 (Number of Employees, HQ, CEO, Website)
Table 10.17 Aalborg CSP A/S Thermal Energy Projects (Project, Country, Capacity, Details)
Table 10.18 Aalborg CSP A/S (Company Division, Product and Services)
Table 10.19 Cristopia Energy Systems Overview 2016 (Headquarter, Website)
Table 10.20 CRISTOPIA Energy Systems Thermal Energy Projects (Project, Country, Capacity, Details)
Table 10.21 SunCan Overview 2016 (Headquarter, CEO, Website)
Table 10.20 SunCan Projects (Project, Country, Capacity, Details)
Table 10.23 SunCan Company Division, Product and Services)
Table 10.24 SaltX Technology Holding Overview 2016 (Headquarter, CEO, Website)
Table 10.25 SaltX Technology Company Division (Company Division, Product and Services)
Table 10.26 Cryogel Overview 2016 (Headquarters, CEO, Website)
Table 10.27 Cryogel Thermal Energy Projects (Project, Country, Capacity, Details)
Table 10.28 Other Leading Companies in the Thermal Energy Storage Market in 2017
Table 11.1 Global Thermal Energy Storage Market Forecast 2017-2027 ($m, AGR %, CAGR %, Cumulative)
Table 11.2 Regional Thermal Energy Storage Market Forecasts 2017-2027 ($m, AGR %, Cumulative)
Table 11.3 Thermal Energy Storage Technology Submarket Forecasts 2017-2027 ($m, AGR %, Cumulative)
List of Figures
Figure 1.1 Global Thermal Energy Storage Market Segmentation Overview
Figure 3.1 Global Thermal Energy Storage Market Forecast 2017-2027 ($m, AGR %)
Figure 4.1 Global Thermal Energy Storage Technology Submarkets Forecast 2017-2027 ($m)
Figure 4.2 Global Thermal Energy Storage Technology Submarkets Forecast (CAGR %, 2017-2027, 2017-2022 and 2022-2027)
Figure 4.3 Global Thermal Energy Storage Technology Submarkets Share 2017 (%)
Figure 4.4 Global Thermal Energy Storage Technology Submarkets Share 2022 (%)
Figure 4.5 Global Thermal Energy Storage Technology Submarkets Share 2027 (%)
Figure 4.6 Sensible Heat Storage Submarket Forecast 2017-2027 ($m, AGR %)
Figure 4.7 Sensible Heat Storage Submarket Share Forecast 2017, 2022, 2027 (%)
Figure 4.8 Latent Heat Storage Submarket Forecast 2017-2027 ($m, AGR %)
Figure 4.9 Latent Heat Storage Submarket Share Forecast 2017, 2022, 2027 (%)
Figure 4.10 Thermo-Chemical Heat Storage Submarket Forecast 2017-2027 ($m, AGR %)
Figure 4.11 Thermo-Chemical Heat Storage Submarket Share Forecast 2017, 2022, 2027 (%)
Figure 5.1 Global Thermal Energy Storage Material Submarkets Forecast 2017-2027 ($m)
Figure 5.2 Global Thermal Energy Storage Material Submarkets Share 2017 (%)
Figure 5.3 Global Thermal Energy Storage Material Submarkets Share 2022 (%)
Figure 5.4 Global Thermal Energy Storage Material Submarkets Share 2027 (%)
Figure 5.5 Molten Salt TES Submarket Forecast 2017-2027 ($m, AGR %)
Figure 5.6 Molten Salt TES Submarket Share Forecast 2017, 2022, 2027 (%)
Figure 5.7 Water TES Submarket Forecast 2017-2027 ($m, AGR %)
Figure 5.8 Water TES Submarket Share Forecast 2017, 2022, 2027 (%)
Figure 5.9 Other TES Submarket Forecast 2017-2027 ($m, AGR %)
Figure 5.10 Other TES Submarket Share Forecast 2017, 2022, 2027 (%)
Figure 6.1 Global Thermal Energy Storage Application Submarkets Forecast 2017-2027 ($m)
Figure 6.2 Global Thermal Energy Storage Application Submarkets Share 2017 (%)
Figure 6.3 Global Thermal Energy Storage Application Submarkets Share 2022 (%)
Figure 6.4 Global Thermal Energy Storage Application Submarkets Share 2027 (%)
Figure 6.5 Power Production Submarket Forecast 2017-2027 ($m, AGR %)
Figure 6.6 Power Production Submarket Share Forecast 2017, 2022, 2027 (%)
Figure 6.7 District & Process Heating and Cooling Submarket Forecast 2017-2027 ($m, AGR %)
Figure 6.8 District & Process Heating and Cooling Submarket Share Forecast 2017, 2022, 2027 (%)
Figure 7.1 Thermal Energy Storage Regional Market Forecast 2017-2027 ($m, AGR %)
Figure 7.2 Thermal Energy Storage Regional Market Share 2017 (%)
Figure 7.3 Thermal Energy Storage Regional Market Share 2022 (%)
Figure 7.4 Thermal Energy Storage Regional Market Share 2027 (%)
Figure 7.5 North America Thermal Energy Storage Market Forecast 2017-2027 ($m, AGR %)
Figure 7.6 North America Thermal Energy Storage Market Share Forecast 2017, 2022, 2027 (%)
Figure 7.7 Europe Thermal Energy Storage Market Forecast 2017-2027 ($m, AGR %)
Figure 7.8 Europe Thermal Energy Storage Market Share Forecast 2017, 2022, 2027 (%)
Figure 7.9 Asia Pacific Thermal Energy Storage Market Forecast 2017-2027 ($m, AGR %)
Figure 7.10 Asia Pacific Thermal Energy Storage Market Share Forecast 2017, 2022, 2027 (%)
Figure 7.11 Rest of the World Thermal Energy Storage Market Forecast 2017-2027 ($m, AGR %)
Figure 7.12 Rest of the World Thermal Energy Storage Market Share Forecast 2017, 2022, 2027 (%)
Figure 8.1 The US Thermal Energy Storage Market Forecast 2017-2027 ($m, AGR %)
Figure 8.2 The US Thermal Energy Storage Market Share Forecast 2017, 2022 and 2027 (% Share)
Figure 8.3 The China Thermal Energy Storage Market Forecast 2017-2027 ($m, AGR %)
Figure 8.4 The China Thermal Energy Storage Market Share Forecast 2017, 2022 and 2027 (% Share)
Figure 8.5 The India Thermal Energy Storage Market Forecast 2017-2027 ($m, AGR %)
Figure 8.6 The India Thermal Energy Storage Market Share Forecast 2017, 2022 and 2027 (% Share)
Figure 8.7 The Australia Thermal Energy Storage Market Forecast 2017-2027 ($m, AGR %)
Figure 8.8 The Australia Thermal Energy Storage Market Share Forecast 2017, 2022 and 2027 (% Share)
Figure 8.9 The South Africa Thermal Energy Storage Market Forecast 2017-2027 ($m, AGR %)
Figure 8.10 The South Africa Thermal Energy Storage Market Share Forecast 2017, 2022 and 2027 (% Share)
Figure 8.11 The Saudi Arabia Thermal Energy Storage Market Forecast 2017-2027 ($m, AGR %)
Figure 8.12 The Saudi Arabia Thermal Energy Storage Market Share Forecast 2017, 2022 and 2027 (% Share)
Figure 8.13 The Chile Thermal Energy Storage Market Forecast 2017-2027 ($m, AGR %)
Figure 8.14 The Chile Thermal Energy Storage Market Share Forecast 2017, 2022 and 2027 (% Share)
Figure 8.15 The Morocco Thermal Energy Storage Market Forecast 2017-2027 ($m, AGR %)
Figure 8.16 The Morocco Thermal Energy Storage Market Share Forecast 2017, 2022 and 2027 (% Share)
Table 8.16 The Morocco Thermal Energy Storage Projects (Name, Location, Capacity, Company, Status)
Figure 8.17 The Denmark Thermal Energy Storage Market Forecast 2017-2027 ($m, AGR %)
Figure 8.18 The Denmark Thermal Energy Storage Market Share Forecast 2017, 2022 and 2027 (% Share)
Figure 8.19 The Israel Thermal Energy Storage Market Forecast 2017-2027 ($m, AGR %)
Figure 8.20 The Israel Thermal Energy Storage Market Share Forecast 2017, 2022 and 2027 (% Share)
Figure 8.21 The Rest of the World Thermal Energy Storage Market Forecast 2017-2027 ($m, AGR %)
Figure 8.22 The Rest of the World Thermal Energy Storage Market Share Forecast 2017, 2022 and 2027 (% Share)