1. Report Overview
1.1 Global PHS Market Overview
1.2 Why You Should Read This Report
1.3 Benefits of This Report
1.4 Structure of This Report
1.5 Key Questions Answered by This Analytical Report Include:
1.6 Who is This Report For?
1.7 Market Definition
1.8 Methodology
1.9 Frequently Asked Questions (FAQ)
1.10 Associated Visiongain Reports
1.11 About Visiongain
2. Introduction to the PHS Market
2.1 The History and Characteristics of Pumped Hydro Storage
2.2 The Technology Variants in the PHS Sector
2.3 The Main Applications of Pumped Hydro Storage
2.4 Evolution of Installed Capacity
3. Global PHS Market Forecast 2017-2027
3.1 The Drivers and Restraints of the Global PHS Market
3.1.1 The Factors Driving the Global PHS Market
3.1.1.1 How Rising Energy Prices Indirectly Incentivise EST
3.1.1.2 The Importance of Renewable Energy Integration
3.1.1.3 GHG and Decarbonisation Targets
3.1.1.4 Fluctuations in the Nuclear Generation Portfolio
3.1.1.5 The Maturity and Cost-Effectiveness of the Technology Relative to Other ESTs
3.1.1.6 The Niche Set of Applications of PHS and Rival EST Technologies
3.1.1.7 Growing Electricity Demand
3.1.1.8 Market Structure and the Regulatory Environment
3.1.1.9 The Potential of Deregulation of Electric Utility Markets
3.1.1.10 Hydropower Infrastructure and Development
3.1.1.11 Political Reasons for Supporting PHS
3.1.2 The Factors Restraining the PHS Market
3.1.2.1 Topographical Restraints and Remaining Technically Deployable Capacity
3.1.2.2 The High Capital Costs of PHS
3.1.2.3 The Potential Environmental and Social Impacts of PHS Projects and the Regulatory Framework Overseeing These
3.1.2.4 Alternatives to Energy Storage in the Grid
3.1.2.5 Low Natural Gas and Oil Prices
3.1.2.6 The Required Storage Capacity
3.2 Barriers to Entry Analysis
4. Global Pumped Hydro Storage Submarket Forecasts 2017-2027
4.1 Market Segmentation
4.2 Analysis of Existing Capacity
4.3 Which Submarkets Will Provide the Strongest Growth?
4.3.1 Open-Loop PHS Submarket
4.3.1.1 Background
4.3.1.2 CAPEX and Capacity Forecasts
4.3.1.3 Drivers and Restraints
4.3.2 Closed Loop PHS Submarket
4.3.2.1 Background
4.3.2.2 CAPEX and Capacity Forecasts
4.3.2.3 Drivers and Restraints
4.3.3 Innovative PHS Submarket
4.3.3.1 Background
4.3.3.2 CAPEX and Capacity Forecasts
4.3.3.3 Drivers and Restraints
5. Leading Pumped Hydro Storage (PHS) National Market Forecast 2017-2027
5.1 The Japanese Pumped Hydro Storage Market
5.1.1 Background and Evolution of Installed Capacity in the Japanese PHS Market
5.1.2 How Can the Japanese PHS Market be Expected to Evolve in the Period 2017-2027?
5.1.3 The Drivers and Restraints of the Japanese PHS Market
5.2 The United States Pumped Hydro Storage Market
5.2.1 Background and Evolution of Installed Capacity in the US PHS Market
5.2.2 How Can the US PHS Market be Expected to Evolve in the Period 2017-2027?
5.2.3 The Drivers and Restraints of the US PHS Market
5.3 The Chinese Pumped Hydro Storage Market
5.3.1 Background and Evolution of Installed Capacity in the Chinese PHS Market
5.3.2 How Can the Chinese PHS Market be Expected to Evolve in the Period 2017-2027?
5.3.3 The Drivers and Restraints of the Chinese PHS Market
5.4 The Italy Pumped Hydro Storage Market
5.4.1 Background and Evolution of Installed Capacity in the Italian PHS Market
5.4.2 How Can the Italian PHS Market be Expected to Evolve in the Period 2017-2027?
5.4.3 The Drivers and Restraints of the Italian PHS Market
5.5 France Pumped Hydro Storage Market
5.5.1 Background and Evolution of Installed Capacity in French PHS Market
5.5.2 How Can the French PHS Market be Expected to Evolve in the Period 2017-2027?
5.5.3 The Drivers and Restraints of French PHS Market
5.6 Germany Pumped Hydro Storage Market
5.6.1 Background and Evolution of Installed Capacity in the German PHS Market
5.6.2 How Can the German PHS Market be Expected to Evolve in the Period 2017-2027?
5.6.3 The Drivers and Restraints of the German PHS Market
5.7 Spain Pumped Hydro Storage Market
5.7.1 Background and Evolution of Installed Capacity in the Spanish PHS Market
5.7.2 How Can the Spanish PHS Market be Expected to Evolve in the Period 2017-2027?
5.7.3 The Drivers and Restraints of the Spanish PHS Market
5.8 The Austria Pumped Hydro Storage Market
5.8.1 Background and Evolution of Installed Capacity in the Austrian PHS Market
5.8.2 How Can the Austrian PHS Market be Expected to Evolve in the Period 2017-2027?
5.8.3 The Drivers and Restraints of the Austrian PHS Market
5.9 The South Korea Pumped Hydro Storage Market
5.9.1 Background and Evolution of Installed Capacity in the South Korean PHS Market
5.9.2 How Can the South Korean PHS Market be Expected to Evolve in the Period 2017-2027?
5.9.3 The Drivers and Restraints of the South Korean PHS Market
5.10 The UK Pumped Hydro Storage Market
5.10.1 Background and Evolution of Installed Capacity in the UK PHS Market
5.10.2 How Can the UK PHS Market be Expected to Evolve in the Period 2017-2027?
5.10.3 The Drivers and Restraints of the UK PHS Market
5.11 The Switzerland Pumped Hydro Storage Market
5.11.1 Background and Evolution of Installed Capacity in the Switzerland PHS Market
5.11.2 How Can the Switzerland PHS Market be Expected to Evolve in the Period 2017-2027?
5.11.3 The Drivers and Restraints of the Switzerland PHS Market
5.12 The Portugal Pumped Hydro Storage Market
5.12.1 Background and Evolution of Installed Capacity in the Portuguese PHS Market
5.12.2 How Can the Portuguese PHS Market be Expected to Evolve in the Period 2017-2027?
5.12.3 The Drivers and Restraints of the Portuguese PHS Market
5.13 The Greece Pumped Hydro Storage Market
5.13.1 Background and Evolution of Installed Capacity in the Greek PHS Market
5.13.2 How Can the Greek PHS Market be Expected to Evolve in the Period 2017-2027?
5.13.3 The Drivers and Restraints of the Greek PHS Market
5.14 Indonesia Pumped Hydro Storage Market
5.14.1 Background and Evolution of Installed Capacity in the Indonesian PHS Market
5.14.2 How Can the Indonesian PHS Market be Expected to Evolve in the Period 2017-2027?
5.14.3 The Drivers and Restraints of the Indonesian PHS Market
5.15 The Rest of the World Pumped Hydro Storage Market
5.15.1 Background and Evolution of Installed Capacity in the RoW PHS Market
5.15.2 How Can the RoW PHS Market be Expected to Evolve in the Period 2017-2027?
5.15.3 The Drivers and Restraints of the RoW PHS Market
6. Patterns of Innovation in the Pumped Hydro Storage Sector
6.1 Seawater Pumped Hydro Storage
6.1.1 The History and Outlook of Seawater PHS
6.1.2 Drivers and Restraints of Seawater PHS
6.2 Underground PHS
6.2.1 The History and Outlook of Underground PHS and Installations Using Abandoned Mines or Quarries
6.2.2 Drivers and Restraints of Underground PHS and Projects which use Abandoned Mines and Quarries
6.3 Small-Scale PHS and RES-PHS Hybrid Projects
6.3.1 The History and Outlook of Small Scale PHS and PHS-RES Hybrids
6.3.2 Drivers and Restraints of Small-Scale PHS and RES-PHS Hybrid Projects
7. PEST Analysis of the PHS Market 2017-2027
8. Expert Opinion
8.1 Expert Interview with CEZ
8.1.1 Latest Developments at CEZ
8.1.2 The Main Applications of PHS
8.1.3 Pumped Hydro Storage in a Regulatory Context
8.1.4 The Outlook of the Sector in Europe
8.1.5 Pumped Hydro Storage in the Context of Other Energy Storage Technologies
8.1.6 Innovations in the PHS Sector
8.2 Expert Interview with RusHydro
8.2.1 Latest Developments in RusHydro
8.2.2 What are the Most Important Applications of PHS?
8.2.3 Is the Current Regulatory Environment Supportive of PHS Installations?
8.2.4 Which Region has the Strongest Outlook for New PSH Installations?
8.2.5 To What Extent are Topographical Requirements Becoming a Constraint on the Development of New PHS Installations?
8.2.6 The Key Innovations and Developments in the Sector
8.2.7 The Outlook of the PHS Sector
9. The Global Landscape of the PHS Sector
9.1 Market Maturity
9.1.1 The Maturity of Different National Markets
9.1.2 The Maturity of the Three PHS Submarkets
9.2 Variations in Construction Characteristics between National Markets and Submarkets (Construction Times, Costs and Duration)
9.2.1 The Variation in Construction Patterns in National Markets
9.2.2 The Variation in Construction Costs, Times and Sizes Between PHS Submarkets
9.3 The Top 20 Largest Installations Globally
10. Leading Companies in the PHS Market
10.1 Voith Group
10.1.1 Key Projects and Company Outlook
10.1.2 Voith Group Total Company Sales 2015-2016
10.1.3 Voith Group Sales in Pumped Hydro Storage Market 2015-2016
10.2 Dongfang Electric Corporation
10.2.1 Dongfang Electric Corporation Total Company Sales 2011-2013
10.2.2 Dongfang Electric Corporation Sales in Pumped Hydro Storage Market 2011-2013
10.3 Alstom
10.3.1 Key Projects
10.3.2 Alstom Total Company Sales 2012-2017
10.4 Toshiba Corporation
10.4.1 Key Projects and Company Outlook
10.4.2 Toshiba Corporation Total Company Sales 2011-2016
10.4.3 Toshiba Corporation Sales in Pumped Hydro Storage Market 2012-2016
10.5 Statkraft
10.5.1 Statkraft Total Company Sales 2011-2016
10.5.2 Statkraft Sales in Pumped Hydro Storage Market 2012-2016
10.6 Andritz Group
10.6.1 Andritz Group Total Company Sales 2011-2016
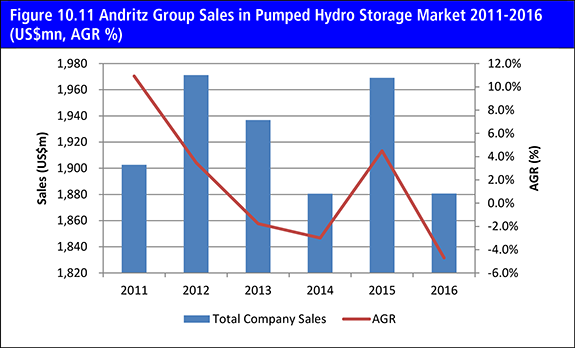
10.6.2 Andritz Group Sales in Pumped Hydro Storage Market 2011-2016
10.7 ABB Group
10.7.1 ABB Group Total Company Sales 2011-2016
10.7.2 ABB Group Sales in the Pumped Hydro Storage Market 2015-2016
10.8 General Electric
10.8.1 General Electric Total Company Sales 2012-2016
10.8.2 General Electric Sales in the Pumped Hydro Storage Market 2012-2016
10.9 Hitachi Ltd
10.9.1 Hitachi Ltd Total Company Sales 2011-2016
10.9.2 Hitachi Ltd Sales in the Pumped Hydro Storage Market 2015-2016
10.10 Enel SpA
10.10.1 Enel SpA Total Company Sales 2011-2016
10.11 Other Companies Involved in the Pumped Hydro Storage Market
11. Conclusions and Recommendations
11.1 PHS Market Outlook
11.2 Global PHS Market Drivers & Restraints
11.3 Global and Submarket PHS Forecasts 2017-2027
11.4 Leading National Market Forecasts 2017-2027
12. Glossary
Appendix
Associated Visiongain Reports
Visiongain Report Sales Order Form
Appendix A
Appendix B
Visiongain Report Evaluation Form
Tables
Table 1.1 Example Forecast: CAPEX ($m) and AGR (%) for Global PHS Market 2017-2027
Table 2.1 PHS Main Characteristics (Capacity MW, Output MWh, Discharge, Efficiency %, Cycles, Cost kW & kWh)
Table 2.2 The Main Applications of Energy Storage Technologies
Table 3.1 Global PHS Market Forecast 2017-2027 ($mil, AGR %, CAGR %, Cumulative)
Table 3.2 Global PHS Installed Capacity Forecast 2017-2027 (GW, AGR %, Cumulative)
Table 3.3 Global PHS Submarket Forecast 2017,2022,2027 ($mil, CAGR %)
Table 3.4 Global PHS Market Drivers and Restraints
Table 3.5 Comparison of PHS, CAES, Thermal Storage, Flywheels and Ultracapacitors (Capacity MW, Output MWh, Discharge, Efficiency %, Cycles, Cost kW & kWh)
Table 4.1 PHS Submarket Forecasts 2017-2027 ($mn, AGR %)
Table 4.2 Open-Loop PHS Submarket Forecast 2017-2027 ($mn, AGR %, CAGR %, Cumulative)
Table 4.3 Open-Loop PHS Installed Capacity Forecast 2017-2027 (GW, AGR %, Cumulative)
Table 4.4 List of all Planned Open-loop Pumped Hydro Installations (Name, Location, Capacity MW, Type, Commissioning)
Table 4.5 Drivers and Restraints in the Open Loop PHS Submarket
Table 4.6 List of all Operating Closed-Loop Pumped Hydro Installations (Name, Location, Capacity MW, Type, Commissioning)
Table 4.7 Closed-Loop PHS Submarket Forecast 2017-2027 ($mn, AGR%, CAGR%, Cumulative)
Table 4.8 Closed Loop PHS Installed Capacity Forecast 2017-2027 (GW, AGR %, Cumulative)
Table 4.9 List of all Planned Closed-loop Pumped Hydro Installations (Name, Location, Capacity MW, Type, Commissioning)
Table 4.10 Drivers and Restraints in the Closed Loop PHS Submarket
Table 4.11 List of all Operating Innovative Pumped Hydro Installations (Name, Location, Capacity MW, Type, Commissioning)
Table 4.12 Innovative PHS Submarket Forecast 2017-2027 ($mn, AGR%, CAGR%, Cumulative)
Table 4.13 Innovative PHS Installed Capacity Forecast 2017-2027 (GW, AGR %, Cumulative)
Table 4.14 List of all Planned Innovative Pumped Hydro Installations (Name, Location, Capacity MW, Type, Commissioning)
Table 4.15 Drivers and Restraints in the Innovative PHS Submarket
Table 5.1 Leading PHS National Market Forecasts 2017-2027 ($mn, AGR %)
Table 5.2 Leading PHS National Markets Installed Capacity Forecast 2017-2027 (GW, AGR %)
Table 5.3 Leading PHS National Markets Installed Capacity Forecast 2017-2027 (GW, AGR %)
Table 5.4 Existing PHS projects in Japan (Project Name, Location, MW Capacity, Type, Status and Commissioning Date)
Table 5.5 The Japanese PHS Market Forecast 2017-2027 ($mn, AGR %, CAGR %, Cumulative)
Table 5.6 Installed Capacity Forecast for the Japanese PHS Market 2017-2027 (GW, AGR %, Cumulative)
Table 5.7 PHS Projects Planned in Japan (Project Name, MW Capacity, Type, Status, Expected Commissioning)
Table 5.8 Japanese PHS Market Drivers and Restraints
Table 5.9 Existing PHS projects in the US (Project Name, Location, MW Capacity, Type, Status and Commissioning Date)
Table 5.10 The US PHS Market Forecast 2017-2027 ($mn, AGR %, CAGR %, Cumulative)
Table 5.11 Installed Capacity Forecast for the US PHS Market 2017-2027 (GW, AGR %, Cumulative)
Table 5.12 PHS Projects Planned in the US (Project Name, MW Capacity, Type, Status, Expected Commissioning)
Table 5.13 US PHS Market Drivers and Restraints
Table 5.14 Existing PHS projects in China (Project Name, Location, MW Capacity, Type, Status and Commissioning Date)
Table 5.15 The Chinese PHS Market Forecast 2017-2027 ($mn, AGR %, CAGR %, Cumulative)
Table 5.16 Installed Capacity Forecast for the Chinese PHS Market 2017-2027 (GW, AGR %, Cumulative)
Table 5.17 PHS Projects Planned in China (Project Name, MW Capacity, Type, Status, Expected Commissioning)
Table 5.18 Chinese PHS Market Drivers and Restraints
Table 5.19 Existing PHS projects in Italy (Project Name, Location, MW Capacity, Type, Status and Commissioning Date)
Table 5.20 The Italian PHS Market Forecast 2017-2027 ($mn, AGR %, CAGR %, Cumulative)
Table 5.21 Installed Capacity Forecast for the Italian PHS Market 2017-2027 (GW, AGR %, Cumulative)
Table 5.22 PHS Projects Planned in Italy (Project Name, MW Capacity, Type, Status, Expected Commissioning)
Table 5.23 Italian PHS Market Drivers and Restraints
Table 5.24 Existing PHS projects in France (Project Name, Location, MW Capacity, Type, Status and Commissioning Date)
Table 5.25 French PHS Market Drivers and Restraints
Table 5.26 Existing PHS projects in Germany (Project Name, Location, MW Capacity, Type, Status and Commissioning Date)
Table 5.27 The German PHS Market Forecast 2017-2027 ($mn, AGR %, CAGR %, Cumulative)
Table 5.28 Installed Capacity Forecast for the German PHS Market 2017-2027 (GW, AGR %, Cumulative)
Table 5.29 PHS Projects Planned in Germany (Project Name, MW Capacity, Type, Status, Expected Commissioning)
Table 5.30 German PHS Market Drivers and Restraints
Table 5.31 Existing PHS projects in Spain (Project Name, Location, MW Capacity, Type, Status and Commissioning Date)
Table 5.32 The Spanish PHS Market Forecast 2017-2027 ($mn, AGR %, CAGR %, Cumulative)
Table 5.33 Installed Capacity Forecast for the Spanish PHS Market 2017-2027 (GW, AGR %, Cumulative)
Table 5.34 PHS Projects Planned in Spain (Project Name, MW Capacity, Type, Status, Expected Commissioning)
Table 5.35 Spain PHS Market Drivers and Restraints
Table 5.36 Existing PHS projects in Austria (Project Name, Location, MW Capacity, Type, Status and Commissioning Date)
Table 5.37 The Austrian PHS Market Forecast 2017-2027 ($mn, AGR %, CAGR %, Cumulative)
Table 5.38 Installed Capacity Forecast for the Austrian PHS Market 2017-2027 (GW, AGR %, Cumulative)
Table 5.39 PHS Projects Planned in Austria (Project Name, MW Capacity, Type, Status, Expected Commissioning)
Table 5.40 Austrian PHS Market Drivers and Restraints
Table 5.41 Existing PHS projects in South Korea (Project Name, Location, MW Capacity, Type, Status and Commissioning Date)
Table 5.42 South Korean PHS Market Drivers and Restraints
Table 5.43 Existing PHS projects in the UK (Project Name, Location, MW Capacity, Type, Status and Commissioning Date)
Table 5.44 The UK PHS Market Forecast 2017-2027 ($mn, AGR %, CAGR %, Cumulative)
Table 5.45 Installed Capacity Forecast for the UK PHS Market 2017-2027 (GW, AGR %, Cumulative)
Table 5.46 PHS Projects Planned in the UK PHS Market in the Period 2017-2027 (Project Name, MW Capacity, Type, Status, Expected Commissioning)
Table 5.47 The UK PHS Market Drivers and Restraints
Table 5.48 Existing PHS projects in Switzerland (Project Name, Location, MW Capacity, Type, Status and Commissioning Date)
Table 5.49 The Switzerland PHS Market Forecast 2017-2027 ($mn, AGR %, CAGR %, Cumulative)
Table 5.50 Installed Capacity Forecast for the Switzerland PHS Market 2017-2027 (GW, Cumulative)
Table 5.51 PHS Projects Planned in the Switzerland PHS Market in the Period 2017-2027 (Project Name, MW Capacity, Type, Status, Expected Commissioning)
Table 5.52 Switzerland PHS Market Drivers and Restraints
Table 5.53 Existing PHS projects in Portugal (Project Name, Location, MW Capacity, Type, Status and Commissioning Date)
Table 5.54 The Portuguese PHS Market Forecast 2017-2027 ($mn, AGR %, CAGR %, Cumulative)
Table 5.55 Installed Capacity Forecast for the Portuguese l PHS Market 2017-2027 (GW, AGR %, Cumulative)
Table 5.56 PHS Projects Planned in Portugal (Project Name, MW Capacity, Type, Status, Expected Commissioning)
Table 5.57 Portuguese l PHS Market Drivers and Restraints
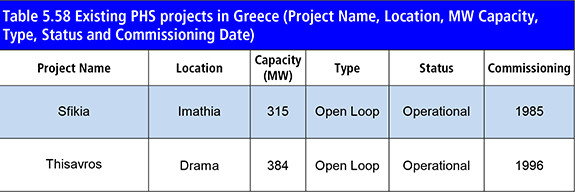
Table 5.58 Existing PHS projects in Greece (Project Name, Location, MW Capacity, Type, Status and Commissioning Date)
Table 5.59 The Greek PHS Market Forecast 2017-2027 ($mn, AGR %, CAGR %, Cumulative)
Table 5.60 Installed Capacity Forecast for the Greek PHS Market 2017-2027 (GW, AGR %, Cumulative)
Table 5.61 PHS Projects Planned in Greece (Project Name, MW Capacity, Type, Status, Expected Commissioning)
Table 5.62 Greece PHS Market Drivers and Restraints
Table 5.63 The Indonesian PHS Market Forecast 2017-2027 ($mn, AGR %, CAGR %, Cumulative)
Table 5.64 Installed Capacity Forecast for the Indonesia PHS Market 2017-2027 (GW, Cumulative)
Table 5.65 PHS Projects Planned in Indonesia (Project Name, MW Capacity, Type, Status, Expected Commissioning)
Table 5.66 Indonesia PHS Market Drivers and Restraints
Table 5.67 Existing PHS projects in the RoW (Project Name, Location, MW Capacity, Type, Status and Commissioning Date)
Table 5.68 The RoW PHS Market Forecast 2017-2027 ($mn, AGR %, CAGR %, Cumulative)
Table 5.69 Installed Capacity Forecast for the RoW PHS Market 2017-2027 (GW, AGR %, Cumulative)
Table 5.70 PHS Projects Planned in the RoW (Project Name, MW Capacity, Type, Status, Expected Commissioning)
Table 5.71 The RoW PHS Market Drivers and Restraints
Table 6.1 Existing PHS projects in Japan (Project Name, Location, MW Capacity, Type, Status and Commissioning Date)
Table 6.2 Drivers & Restraints of Seawater PHS
Table 6.3 Existing Underground PHS Projects (Project Name, Location, MW Capacity, Type, Status and Commissioning Date)
Table 6.4 Planned Underground PHS Projects (Project Name, Location, MW Capacity, Type, Status and Commissioning Date)
Table 6.5 Drivers & Restraints of Underground PHS and Installations Using Mines and Quarries
Table 6.6 Drivers & Restraints of Small Scale PHS and RES-PHS Hybrid Installations
Table 9.1 The 20 Oldest Still-Operational PHS Installations in the World (Project Name, Location, MW Capacity, Type, Status, Commissioning Date)
Table 9.2 The Oldest Still-Operational PHS Installations in Each PHS Submarket (Project Name, Location, MW Capacity, Type, Status, Commissioning Date)
Table 9.3 An Overview of the 20 Largest PHS Installations in the World (MW)
Table 10.1 Voith Group Profile (CEO, Total Company Sales US$mn, Sales in the Market (US$mn), Sales From Company Division That Includes PHS(US$m), Share of Total Company Sales From Company Division That Includes PHS (%), Net Income / Loss US$mn, Net Capital Expenditure US$mn, Strongest Business Region, Business Segment in the Market, HQ, Founded, No. of Employees, IR Contact, Ticker, Website)
Table 10.2 Selection of Voith Hydro’s Recent Projects in the PHS Sector (Project Name, Location, Nature of Involvement, Status)
Table 10.3 Voith Group Total Company Sales 2014-2016 (US$mn, AGR %)
Table 10.4 Voith Group Sales in Pumped Hydro Storage Market 2014-2016 (US$mn, AGR %)
Table 10.5 Dongfang Electric Corporation Profile 2013 (CEO, Total Company Sales US$mn, Sales in the Market (US$mn), Sales From Company Division That Includes PHS(US$m), Share of Total Company Sales From Company Division That Includes PHS (%), Net Income / Loss US$mn, Net Capital Expenditure US$mn, Strongest Business Region, Business Segment in the Market, HQ, Founded, No. of Employees, IR Contact, Ticker, Website)
Table 10.6 Selection of Dongfang’s Recent Projects in the PHS Sector (Project Name, Location, Nature of Involvement, Status)
Table 10.7 Dongfang Electric Corporation Total Company Sales 2010-2013 (US$mn, AGR %)
Table 10.8 Dongfang Electric Corporation Sales in Pumped Hydro Storage Market 2010-2013 (US$mn, AGR %)
Table 10.9 Alstom Profile 2016 (CEO, Total Company Sales US$mn, Sales in the Market (US$mn), Sales From Company Division That Includes PHS(US$m), Share of Total Company Sales From Company Division That Includes PHS (%), Net Income / Loss US$mn, Net Capital Expenditure US$mn, Strongest Business Region, Business Segment in the Market, HQ, Founded, No. of Employees, IR Contact, Ticker, Website)
Table 10.10 Selection of Alstom’s Recent Projects in the PHS Sector (Project Name, Location, Nature of Involvement, Status)
Table 10.11 Alstom Total Company Sales 2011-2017 (US$mn, AGR %)
Table 10.12 Toshiba Corporation Profile 2016 (CEO, Total Company Sales US$mn, Sales in the Market (US$mn), Sales From Company Division That Includes PHS(US$m), Share of Total Company Sales From Company Division That Includes PHS (%), Net Income / Loss US$mn, Net Capital Expenditure US$mn, Strongest Business Region, Business Segment in the Market, HQ, Founded, No. of Employees, IR Contact, Ticker, Website)
Table 10.13 Selection of Toshiba’s Recent Projects in the PHS Sector (Project Name, Location, Nature of Involvement, Status)
Table 10.14 Toshiba Corporation Total Company Sales 2010-2016 (US$mn, AGR %)
Table 10.15 Toshiba Corporation Sales in Pumped Hydro Storage Market 2011-2016 (US$mn, AGR %)
Table 10.16 Statkraft Profile 2016 (CEO, Total Company Sales US$mn, Sales in the Market (US$mn), Sales From Company Division That Includes PHS(US$m), Share of Total Company Sales From Company Division That Includes PHS (%), Net Income / Loss US$mn, Net Capital Expenditure US$mn, Strongest Business Region, Business Segment in the Market, HQ, Founded, No. of Employees, IR Contact, Ticker, Website)
Table 10.17 Statkraft Total Company Sales 2010-2016 (US$mn, AGR %)
Table 10.18 Statkraft Sales in Pumped Hydro Storage Market 2011-2016 (US$mn, AGR %)
Table 10.19 Andritz Group Profile 2016 (CEO, Total Company Sales US$mn, Sales in the Market (US$mn), Sales From Company Division That Includes PHS(US$m), Share of Total Company Sales From Company Division That Includes PHS (%), Net Income / Loss US$mn, Net Capital Expenditure US$mn, Strongest Business Region, Business Segment in the Market, HQ, Founded, No. of Employees, IR Contact, Ticker, Website)
Table 10.20 Andritz Group Total Company Sales 2010-2016 (US$mn, AGR %)
Table 10.21 Andritz Group Sales in Pumped Hydro Storage Market 2010-2016 (US$mn, AGR %)
Table 10.22 ABB Group Profile 2016 (CEO, Total Company Sales US$mn, Sales in the Market (US$mn), Sales From Company Division That Includes PHS(US$m), Share of Total Company Sales From Company Division That Includes PHS (%), Net Income / Loss US$mn, Net Capital Expenditure US$mn, Strongest Business Region, Business Segment in the Market, HQ, Founded, No. of Employees, IR Contact, Ticker, Website)
Table 10.23 ABB Group Total Company Sales 2010-2016 (US$mn, AGR %)
Table 10.24 ABB Group Sales in the Pumped Hydro Storage Market 2014-2016 (US$mn, AGR %)
Table 10.25 General Electric Profile 2016 (CEO, Total Company Sales US$mn, Sales in the Market (US$mn), Sales From Company Division That Includes PHS(US$m), Share of Total Company Sales From Company Division That Includes PHS (%), Net Income / Loss US$mn, Net Capital Expenditure US$mn, Strongest Business Region, Business Segment in the Market, HQ, Founded, No. of Employees, IR Contact, Ticker, Website)
Table 10.26 General Electric Total Company Sales 2011-2016 (US$mn, AGR %)
Table 10.27 General Electric Sales in the Pumped Hydro Storage Market 2011-2016 (US$mn, AGR %)
Table 10.28 Hitachi Ltd Profile 2016 (CEO, Total Company Sales US$mn, Sales in the Market (US$mn), Sales From Company Division That Includes PHS(US$m), Share of Total Company Sales From Company Division That Includes PHS (%), Net Income / Loss US$mn, Net Capital Expenditure US$mn, Strongest Business Region, Business Segment in the Market, HQ, Founded, No. of Employees, IR Contact, Ticker, Website)
Table 10.29 Hitachi Ltd Total Company Sales 2010-2016 (US$mn, AGR %)
Table 10.30 Hitachi Ltd. Sales in the Pumped Hydro Storage Market 2014-2016 (US$mn, AGR %)
Table 10.31 Enel SpA Profile 2016 (CEO, Total Company Sales US$mn, Net Income / Loss US$mn, Net Capital Expenditure US$mn, Strongest Business Region, Business Segment in the Market, HQ, Founded, No. of Employees, IR Contact, Ticker, Website)
Table 10.32 Enel SpA Total Company Sales 2010-2016 (US$mn, AGR %)
Table 11.1 Global PHS Market Drivers and Restraints
Table 11.2 Global PHS Submarket Forecast 2017,2022,2027 ($mn, CAGR%)
Table 11.3 National PHS Market Forecasts Summary 2017, 2022, 2027 ($mn, CAGR %)
Table 11.4 Leading PHS National Markets Installed Capacity Forecast 2017-2027 (GW)
Figures
Figure 2.1 Main Types of PHS Installations
Figure 2.2 Breakdown of Global Installed PHS Capacity by Installation Type – open- loop, closed-loop and innovative PHS (Cumulative Capacity as of 2015, GW)
Figure 2.3 Main Patterns of Innovation in the Global PHS Sector
Figure 2.4 Electricity Storage Matrix: Characteristics and Requirements of Key Energy Storage Applications
Figure 2.5 Main Types of PHS Applications
Figure 2.6 Global Installed PHS Capacity 1960-2015 (GW)
Figure 2.7 Regional Breakdown of Installed PHS Capacity 1960-2012 (GW)
Figure 2.8 Country Breakdown of Installed PHS Capacity for Asia & Oceania 1980-2012 (GW)
Figure 2.9 Country Breakdown of Installed PHS Capacity for North America 1990-2012 (GW)
Figure 2.10 Country Breakdown of Installed PHS Capacity for Europe 1960-2012 (GW)
Figure 3.1 Global PHS Market Forecast 2017-2027 ($mil, AGR %)
Figure 3.2 Global PHS Installed Capacity Forecast 2017-2027 (GW)
Figure 3.3 PHS Submarket CAPEX Share Forecast 2017, 2022 and 2027 (%)
Figure 3.4 Evolution of CAPEX by PHS Technology Submarket 2017-2027 ($mn)
Figure 3.5 Industrial Electricity Prices for Medium-Sized Industries in European Countries 2014-2016 (EUR/kWh)
Figure 3.6 Industrial Electricity Prices for Medium Sized Industries in Germany, Spain, France and the United Kingdom 2004-2014 (EUR/kWh)
Figure 3.7 Global Cumulative Installed Wind and Solar Capacity 2004-2014 (GW)
Figure 3.8 Electricity Storage Matrix: Characteristics and Requirements of Key ESTs
Figure 3.9 Alternative Means for Achieving Stability and Flexibility of the Power System
Figure 3.10 Total Installed PHS Capacity in the Leading National Markets (2015, MW)
Figure 4.1 Main Types of PHS Installations
Figure 4.2 Evolution of Installed Capacity in the Open-Loop, Closed-Loop and Innovative PHS Submarkets (1926 – 2015, MW)
Figure 4.3 Existing Global PHS Capacity by Submarket (number of projects, GW)
Figure 4.4 Existing Global PHS Capacity by Submarket in the 15 Leading National Markets (MW)
Figure 4.5 PHS Submarket Forecasts 2017-2027 ($mn, AGR %)
Figure 4.6 PHS Submarket CAPEX Share Forecast 2017 (%)
Figure 4.7 PHS Submarket CAPEX Share Forecast 2022 (%)
Figure 4.8 PHS Submarket CAPEX Share Forecast 2027 (%)
Figure 4.9 The Evolution of CAPEX in the Main PHS Submarkets 2017-2027 ($mn)
Figure 4.10 Evolution of Installed Capacity in the Open Loop Submarket 1926 - 2015
Figure 4.11 Open Loop PHS Submarket CAPEX Forecast 2017-2027 ($mn)
Figure 4.12 Share of the Open-Loop PHS Submarket in Total CAPEX 2017-2027 (%)
Figure 4.13: Open-loop PHS Installed Capacity Forecast 2017-2027 (GW)
Figure 4.14 Evolution of Installed Capacity in the Closed-Loop Submarket 1963 - 2015 (MW)
Figure 4.15 Closed Loop PHS Submarket CAPEX Forecast 2017-2027 ($mn)
Figure 4.16 Share of the Closed Loop PHS Submarket in Total CAPEX 2017-2027 (%)
Figure 4.17 Closed loop PHS Installed Capacity Forecast 2017-2027 (GW)
Figure 4.18 Main Types of Innovative PHS installations
Figure 4.19 Evolution of Installed Capacity in the Innovative Submarket 1963 - 2015 (MW)
Figure 4.20 Innovative PHS Submarket CAPEX Forecast 2017-2027 ($mn)
Figure 4.21 Share of the Innovative PHS Submarket in Total CAPEX 2017-2027 (%)
Figure 4.22 Innovative PHS Installed Capacity Forecast 2017-2027 (GW)
Figure 5.1 Leading PHS National Market Forecasts 2017-2027 ($mn)
Figure 5.2 Leading PHS National Markets Share Forecast 2017 (%)
Figure 5.3 Leading PHS National Markets Share Forecast 2022 (%)
Figure 5.4 Leading PHS National Markets Share Forecast 2027 (%)
Figure 5.5 Total CAPEX by National Markets in the Period 2017-2027 ($mn)
Figure 5.6 Total CAPEX per National PHS Market 2017-2027 ($mn)
Figure 5.7 Leading PHS National Markets Installed Capacity Forecast 2017-2027 (GW)
Figure 5.8 Leading PHS National Markets Installed Capacity Forecast 2017-2027 (GW)
Figure 5.9 Evolution of Installed PHS Capacity in Japan 1961-2015 (MW)
Figure 5.10 The Share of Different Submarkets in the Japanese PHS Market (2015, MW)
Figure 5.11 The Japanese PHS Market Forecast 2017-2027 ($mn, AGR %)
Figure 5.12 Japanese PHS Market Share Forecast 2017, 2022 and 2027 (% Share)
Figure 5.13 Installed Capacity Forecast for the Japanese PHS Market 2017-2027 (GW)
Figure 5.14 Key Factors Affecting the Japanese PHS Market
Figure 5.15 Evolution of Installed PHS Capacity in the United States 1929-2015 (MW)
Figure 5.16 The Share of Different Submarkets in the US PHS Market (2015, MW)
Figure 5.17 The US PHS Market Forecast 2017-2027 ($mn, AGR %)
Figure 5.18 The US PHS Market Share Forecast 2017, 2022 and 2027 (% Share)
Figure 5.19 Installed Capacity Forecast for the US PHS Market 2017-2027 (GW)
Figure 5.20 Key Factors Affecting the US PHS Market
Figure 5.21 Evolution of Installed PHS Capacity in China 1968-2015 (MW)
Figure 5.22 The Share of Different Submarkets in the Chinese PHS Market (2015, MW)
Figure 5.23 The Chinese PHS Market Forecast 2017-2027 ($mn, AGR %)
Figure 5.24 Chinese PHS Market Share Forecast 2017, 2022 and 2027 (% Share)
Figure 5.25 Installed Capacity Forecast for the Chinese PHS Market 2017-2027 (GW)
Figure 5.26 Key Factors Affecting the Chinese PHS Market
Figure 5.27 Evolution of Installed PHS Capacity in Italy 1905-2015 (MW)
Figure 5.28 The Share of Different Submarkets in the Italian PHS market (2015, MW)
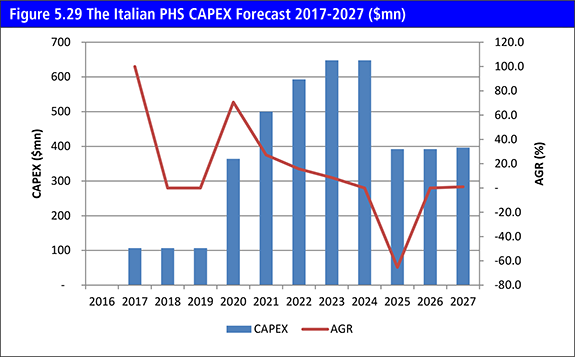
Figure 5.29 The Italian PHS CAPEX Forecast 2017-2027 ($mn)
Figure 5.30 Italian PHS Market Share Forecast 2017, 2022 and 2027 (% Share)
Figure 5.31 Installed Capacity Forecast for the Italian PHS Market 2017-2027 (GW)
Figure 5.32 Key Factors Affecting the Italian PHS Market
Figure 5.33 Evolution of Installed PHS Capacity in France 1950-2015 (MW)
Figure 5.34 The Share of Different Submarkets in French PHS Market (2015, MW)
Figure 5.35 Key Factors Affecting France PHS Market
Figure 5.36 Evolution of Installed PHS Capacity in Germany 1926-2015 (MW)
Figure 5.37 The Share of Different Submarkets in the German PHS Market (2015, MW)
Figure 5.38 The German PHS Market Forecast 2017-2027 ($mn, AGR %)
Figure 5.39 German PHS Market Share Forecast 2017, 2022 and 2027 (% Share)
Figure 5.40 Installed Capacity Forecast for the German PHS Market 2017-2027 (GW)
Figure 5.41 Evolution of Electricity Prices for Medium-Size Households in Germany and EU 28 (EUR/kWh)
Figure 5.42 Evolution of Electricity Prices for Medium-Size Industries in Germany and EU 28 (EUR/kWh)
Figure 5.43 Key Factors Affecting the German PHS Market
Figure 5.44 Evolution of Installed PHS Capacity in Spain 1929-2015 (MW)
Figure 5.45 The Share of Different Submarkets in the Spanish PHS Market (2015, MW)
Figure 5.46 The Spanish PHS Market Forecast 2017-2027 ($m, AGR %)
Figure 5.47 Spanish PHS Market Share Forecast 2017, 2022 and 2027 (% Share)
Figure 5.48 Installed Capacity Forecast for the Spanish PHS Market 2017-2027 (GW)
Figure 5.49 Key Factors Affecting the Spanish PHS Market
Figure 5.50 Evolution of Installed PHS Capacity in Austria 1943-2015 (MW)
Figure 5.51 The Share of Different Submarkets in the Austrian PHS Market (2015, MW)
Figure 5.52 The Austrian PHS Market Forecast 2017-2027 ($mn, AGR %)
Figure 5.53 Austrian PHS Market Share Forecast 2017, 2022 and 2027 (% Share)
Figure 5.54 Installed Capacity Forecast for the Austrian PHS Market 2017-2027 (GW)
Figure 5.55 Key Factors Affecting the Austrian PHS Market
Figure 5.56 Evolution of Installed PHS Capacity in South Korea 1979-2015 (MW)
Figure 5.57 The Share of Different Submarkets in the South Korean PHS Market (2015, MW)
Figure 5.58 Key Factors Affecting the South Korean PHS Market
Figure 5.59 Evolution of Installed PHS Capacity in the United Kingdom 1963-2015 (MW)
Figure 5.60 The Share of Different Submarkets in the UK PHS Market (2015, MW)
Figure 5.61 The UK PHS Market Forecast 2017-2027 ($mn, AGR %)
Figure 5.62 The UK PHS Market Share Forecast 2017, 2022 and 2027 (% Share)
Figure 5.63 Installed Capacity Forecast for the UK PHS Market 2017-2027 (GW)
Figure 5.64 Key Factors Affecting the UK PHS Market
Figure 5.65 Evolution of Installed PHS Capacity in Switzerland 1937-2015 (MW)
Figure 5.65 The Share of Different Submarkets in the Switzerland PHS Market (2015, MW)
Figure 5.66 Switzerland PHS Market Forecast 2017-2027 ($mn, AGR %)
Figure 5.67 Switzerland PHS Market Share Forecast 2017, 2022 and 2027 (% Share)
Figure 5.68 Installed Capacity Forecast for the Switzerland PHS Market 2017-2027 (GW)
Figure 5.69 Installed Capacity: Switzerland in a European Context (2015, MW)
Figure 5.70 Key Factors Affecting the Switzerland PHS Market
Figure 5.71 Evolution of Installed PHS Capacity in Portugal 1964 – 2015 (MW)
Figure 5.72 The Share of Different Submarkets in the Portuguese PHS Market (2015, MW)
Figure 5.73 The Portuguese PHS Market Forecast 2017-2027 ($mn, AGR %)
Figure 5.74 Portuguese PHS Market Share Forecast 2017, 2022 and 2027 (% Share)
Figure 5.75 Installed Capacity Forecast for the Portuguese PHS Market 2017-2027 (GW)
Figure 5.76 Key Factors Affecting the Portuguese PHS Market
Figure 5.77 Evolution of Installed PHS Capacity in Greece 1984-2015 (MW)
Figure 5.78 The Share of Different Submarkets in the Greek PHS Market (2015, MW)
Figure 5.79 The Greek PHS Market Forecast 2017-2027 ($mn, AGR %)
Figure 5.80 Greek PHS Market Share Forecast 2017, 2022 and 2027 (% Share)
Figure 5.81 Installed Capacity Forecast for the Greek PHS Market 2017-2027 (GW)
Figure 5.82 Key Factors Affecting the Greek PHS Market
Figure 5.83 The Indonesian PHS Market Forecast 2017-2027 ($mn, AGR %)
Figure 5.84 Indonesian PHS Market Share Forecast 2017, 2022 and 2027 (% Share)
Figure 5.85 Installed Capacity Forecast for the Indonesian PHS Market 2017-2027 (GW)
Figure 5.86 Key Factors Affecting Indonesia PHS Market
Figure 5.87 Evolution of Installed PHS Capacity in the RoW 1937-2015 (MW)
Figure 5.88 The Share of Different Countries in the RoW PHS Capacity (2015, MW)
Figure 5.89 The Share of Different Submarkets in the RoW PHS Market (2015, MW)
Figure 5.90 The RoW PHS Market Forecast 2017-2027 ($mn, AGR %)
Figure 5.91 RoW PHS Market Share Forecast 2017, 2022 and 2027 (% Share)
Figure 5.92 Installed Capacity Forecast for the RoW PHS Market 2017-2027 (GW)
Figure 5.93 Key Factors Affecting the RoW PHS Market
Figure 6.1 Main Patterns of Innovation in the Global PHS Sector
Figure 7.1 PEST Analysis of the PHS Market 2017-2027
Figure 9.1 The Commissioning Date of the Earliest Still-Operating PHS Installation by National Market
Figure 9.2: Overview of the 20 Oldest Still-Operational PHS Installations in the World
Figure 9.3 The Commissioning Date of the First Still-Operational PHS Installation by Submarket
Figure 9.4 Size of Average Operational PHS Installation (National Market, MW)
Figure 9.5 Average Construction Period for PHS Installations (National Market, Years)
Figure 9.6 Average Size of PHS Installations Planned for the Period 2017-2027 by National Markets (MW)
Figure 9.7 Average Size of Existing and Planned PHS Installations (National Markets, MW)
Figure 9.8 Average Expected Construction Time of PHS Installations Planned for the Period 2017-2027 by National Markets (Years)
Figure 9.9 Average Construction Period of Existing and Planned PHS Installations (National Markets, Years)
Figure 9.10 Average Construction Cost of PHS Installations Planned for the Period 2017-2027 (National Markets, $mn/project)
Figure 9.11 Average Capacity of PHS Installations (Submarket, MW)
Figure 9.12 Average Construction Period for PHS Installations (Submarket, Years)
Figure 9.13 Average Capacity of PHS Installations Planned for the Period 2017-2027 (MW)
Figure 9.14 Average Capacity of Existing and Planned PHS Installations (Submarkets, MW)
Figure 9.15 Average Expected Construction Time of PHS Installations Planned for the Period 2017-2027 (Submarkets. Years)
Figure 9.16 Average Construction Time of Existing and Planned PHS Installations (Submarkets, Years)
Figure 9.17 Average Expected Construction Cost of PHS Installations Planned for the Period 2017-2027 ($mn/project)
Figure 9.18 An Overview of the 20 Largest PHS Installations in the World (MW)
Figure 10.1 Voith Group Total Company Sales 2015-2016 (US$mn, AGR %)
Figure 10.2 Voith Group Sales in Pumped Hydro Storage Market 2015-2016 (US$mn, AGR %)
Figure 10.3 Dongfang Electric Corporation Company Sales 2011-2013 (US$mn, AGR %)
Figure 10.4 Dongfang Electric Corporation Sales in Pumped Hydro Storage Market 2011-2013 (US$mn, AGR %)
Figure 10.5 Alstom Total Company Sales 2012-2017 (US$mn, AGR %)
Figure 10.6 Toshiba Corporation Company Sales 2011-2016 (US$mn, AGR %)
Figure 10.7 Toshiba Corporation Sales in Pumped Hydro Storage Market 2012-2016 (US$mn, AGR %)
Figure 10.8 Statkraft Total Company Sales 2011-2016 (US$mn, AGR %)
Figure 10.9 Statkraft Sales in Pumped Hydro Storage Market 2012-2016 (US$mn, AGR %)
Figure 10.10 Andritz Group Total Company Sales 2011-2016 (US$mn, AGR %)
Figure 10.11 Andritz Group Sales in Pumped Hydro Storage Market 2011-2016 (US$mn, AGR %)
Figure 10.12 ABB Group Total Company Sales 2011-2016 (US$mn, AGR %)
Figure 10.13 ABB Group Sales in the Pumped Hydro Storage Market 2015-2016 (US$mn, AGR %)
Figure 10.14 General Electric Total Company Sales 2012-2016 (US$mn, AGR %)
Figure 10.15 General Electric Sales in the Pumped Hydro Storage Market 2012-2016 (US$mn, AGR %)
Figure 10.16 Hitachi Ltd Total Company Sales 2011-2016 (US$mn, AGR %)
Figure 10.17 Hitachi Ltd. Sales in the Pumped Hydro Storage Market 2015-2016 (US$mn, AGR %)
Figure 10.18 Enel SpA Total Company Sales 2011-2016 (US$mn, AGR %)
Figure 11.1 Global PHS Submarket CAPEX Forecast, 2017-2027 ($mn)
Figure 11.2 PHS CAPEX Share per National Market 2017-2027 ($mn, %)
Figure 11.3 Cumulative Share of PHS Spending 2017-2027 ($mn, %)
Figure 11.4 Cumulative PHS CAPEX Forecast for National Markets 2017-2027 ($mn)
Figure 11.5 PHS Installed Capacity per National Market 2017-2027 (GW)
Figure 11.6 Cumulative PHS Capacity Additions for National Markets 2017-2027 (GW)