The Coal Combustion Products Market Report 2022-2032: This report will prove invaluable to leading firms striving for new revenue pockets if they wish to better understand the industry and its underlying dynamics. It will be useful for companies that would like to expand into different industries or to expand their existing operations in a new region.
There are many beneficial uses for coal combustion products that actually benefit the world
Products of coal combustion (CCPs) fall under the heading of secondary materials. Fly ash, bottom ash, boiler slag, flue gas desulfurization sludge, and fluidized bed combustion ash are a few examples of CCPs. Some might even contend that using CO2 for enhanced oil recovery satisfies the definition and is an example of a useful use. There are many beneficial uses for coal combustion products that actually benefit the world, despite the fact that coal ash can be an environmental risk if it is not properly managed. Many useful applications have been around for years, but useful new applications are being created, and some are beginning to enter the market. It’s common to think of coal combustion residuals as a burdensome waste product that coal-fired power plants struggle to manage. Disposal management techniques have been extensively studied, and annual spending on monitoring and landfills is substantial. But frequently, beneficial use of the material could save money and lower liability, making disposal a poor choice.
Economic Issues Related To The Production Of Products From Coal Combustion
The amount of revenue generated from the sale of by-products for coal-fired electric utilities is frequently negligible in comparison to the revenue stream provided by the sale of electricity. Simply put, the prices received for by-products are too low to support a significant investment in by-product marketing. Utilities have little financial incentive to allocate personnel and capital expenses for creating a by-product management strategy. By-product sales frequently only happen if they can be made with little work and financial investment.
What Questions Should You Ask before Buying a Market Research Report?
• How is the coal combustion products market evolving?
• What is driving and restraining the coal combustion products market?
• How will each coal combustion products submarket segment grow over the forecast period and how much revenue will these submarkets account for in 2032?
• How will the market shares for each coal combustion products submarket develop from 2022 to 2032?
• What will be the main driver for the overall market from 2022 to 2032?
• Will leading coal combustion products markets broadly follow the macroeconomic dynamics, or will individual national markets outperform others?
• How will the market shares of the national markets change by 2032 and which geographical region will lead the market in 2032?
• Who are the leading players and what are their prospects over the forecast period?
• What are the coal combustion products projects for these leading companies?
• How will the industry evolve during the period between 2020 and 2032? What are the implications of coal combustion products projects taking place now and over the next 10 years?
• Is there a greater need for product commercialisation to further scale the coal combustion products market?
• Where is the coal combustion products market heading and how can you ensure you are at the forefront of the market?
• What are the best investment options for new product and service lines?
• What are the key prospects for moving companies into a new growth path and C-suite?
You need to discover how this will impact the coal combustion products market today, and over the next 10 years:
• Our 285-page report provides 133 tables and 137 charts/graphs exclusively to you.
• The report highlights key lucrative areas in the industry so you can target them – NOW.
• It contains in-depth analysis of global, regional and national sales and growth.
• It highlights for you the key successful trends, changes and revenue projections made by your competitors.
This report tells you TODAY how the coal combustion products market will develop in the next 10 years, and in line with the variations in COVID-19 economic recession and bounce. This market is more critical now than at any point over the last 10 years.
The report delivers exclusive COVID-19 variations and economic data specific to your market.
To access the data contained in this document please email contactus@visiongain.com
Forecasts to 2032 and other analyses reveal commercial prospects
• In addition to revenue forecasting to 2032, our new study provides you with recent results, growth rates, and market shares.
• You will find original analyses, with business outlooks and developments.
• Discover qualitative analyses (including market dynamics, drivers, opportunities, restraints and challenges), cost structure, impact of rising coal combustion products prices and recent developments.
This report includes data analysis and invaluable insight into how COVID-19 will affect the industry and your company. Four COVID-19 recovery patterns and their impact, namely, “V”, “L”, “W” and “U” are discussed in this report.
Segments Covered in the Report
Market Segment by Volume
• Utilised Volume
• Unutilised Volume
Market Segment by By-Product Type
• Fly Ash
• Flue Gas Desulfurization Material
• Bottom Ash
• Boiler Slag
• Other By-Products
Market Segment by Application
• Ponds/Landfills
• Concrete/Cement Products
• Land Reclamation
• Wallboard
• Road Construction
• Other Applications

In addition to the revenue predictions for the overall world market and segments, you will also find revenue forecasts for five regional and leading national markets:
North America
• U.S.
• Canada
Europe
• Germany
• Russia
• United Kingdom
• France
• Italy
• Rest of Europe
Asia Pacific
• China
• Japan
• India
• Australia
• South Korea
• Rest of Asia Pacific
Middle East & Africa
• Turkey
• Saudi Arabia
• South Africa
• Rest of Middle East & Africa
South America
• Brazil
• Mexico
• Rest of South America
Need industry data? Please contact us today.
The report also includes profiles and for some of the leading companies in the Coal Combustion Products Market, 2022 to 2032, with a focus on this segment of these companies’ operations.
Leading companies and the potential for market growth
• Ameren Missouri
• American Electric Power
• AshTech
• CEMEX S.A.B. de C.V.
• Charah Solutions
• Coal Ash Solutions
• Duke Energy Corporation
• FirstEnergy Corp
• Lancester Products
• Minerals Technologies Inc.
• Salt River Materials Group
• Seperation Technologies LLC
• Stanwell Corporation Ltd
• Talen Energy
• WM Intellectual Property Holdings L.L.C.
Overall world revenue for Coal Combustion Products Market, 2022 to 2032 in terms of value the market will surpass US$116.36 million in 2022, our work calculates. We predict strong revenue growth through to 2032. Our work identifies which organizations hold the greatest potential. Discover their capabilities, progress, and commercial prospects, helping you stay ahead.
How will the Coal Combustion Products Market, 2022 to 2032 report help you?
In summary, our 285-page report provides you with the following knowledge:
• Revenue forecasts to 2032 for Coal Combustion Products Market, 2022 to 2032 Market, with forecasts for volume, product type, application and company size, each forecast at a global and regional level – discover the industry’s prospects, finding the most lucrative places for investments and revenues.
• Revenue forecasts to 2032 for four regional and 20 key national markets – See forecasts for the Coal Combustion Products Market, 2022 to 2032 market in North America, Europe, Asia-Pacific and LAMEA. Also forecasted is the market in the US, Canada, Russia, Brazil, Germany, France, UK, Italy, China, India, Japan, and Australia among other prominent economies.
• Prospects for established firms and those seeking to enter the market – including company profiles for 10 of the major companies involved in the Coal Combustion Products Market, 2022 to 2032.
Find quantitative and qualitative analyses with independent predictions. Receive information that only our report contains, staying informed with invaluable business intelligence.
Information found nowhere else
With our new report, you are less likely to fall behind in knowledge or miss out on opportunities. See how our work could benefit your research, analyses, and decisions. Visiongain’s study is for everybody needing commercial analyses for the Coal Combustion Products Market, 2022 to 2032, market-leading companies. You will find data, trends and predictions.
To access the data contained in this document please email contactus@visiongain.com
Buy our report today Coal Combustion Products (CCP) Market Report 2022-2032: Forecasts by Volume (Utilised Volume, Unutilised Volume), by By-Product Type (Fly Ash, Flue Gas Desulfurization Material, Bottom Ash, Boiler Slag, Other), by Application (Ponds/Landfills, Concrete/Cement Products, Land Reclamation, Wallboard, Road Construction, Other) AND Regional and Leading National Market Analysis PLUS Analysis of Leading Companies AND COVID-19 Impact and Recovery Pattern Analysis. Avoid missing out by staying informed – order our report now.
Visiongain is a trading partner with the US Federal Government
CCR Ref number: KD4R6
Do you have any custom requirements we can help you with? Any need for a specific country, geo region, market segment or specific company information? Contact us today, we can discuss your needs and see how we can help: contactus@visiongain.com
1. Report Overview
1.1 Objectives of the Study
1.2 Introduction to Coal Combustion Products Market
1.3 What This Report Delivers
1.4 Why You Should Read This Report
1.5 Key Questions Answered by This Analytical Report Include:
1.6 Who is This Report for?
1.7 Methodology
1.7.1 Market Definitions
1.7.2 Market Evaluation & Forecasting Methodology
1.7.3 Data Validation
1.8 Frequently Asked Questions (FAQs)
1.9 Associated Visiongain Reports
1.10 About Visiongain
2 Executive Summary
3 Premium Insights
3.1 Geographical Snapshot: Global Coal Combustion Products Market
3.2 Product Segment: Market Attractiveness Index
3.3 Applications Segment: Market Attractiveness Index
4 Market Overview
4.1 Key Findings
4.2 Market Dynamics
4.2.1 Market Driving Factors
4.2.2 Market Restraining Factors
4.2.3 Market Opportunities
4.3 COVID-19 Impact Analysis
4.4 Porter’s Five Forces Analysis
4.4.1 Supplier Power
4.4.2 Buyer Power
4.4.3 Competitive Rivalry
4.4.4 Threat from Substitutes
4.4.5 Threat of New Entrants
4.5 PESTLE Analysis
4.5.1 Political Factors
4.5.2 Economic Factors
4.5.3 Social Factors
4.5.4 Technological Factors
4.5.5 Environmental Factors
4.5.6 Legal Factors
5 Global Coal Combustion Products Market Analysis
5.1 Key Findings
5.2 Global Coal Combustion Products Market Forecast
5.3 Global Coal Combustion Products Market Forecast by Region
5.4 Global Coal Combustion Products Market Forecast by Volume
5.5 Global Coal Combustion Products Market Forecast by Product Type
5.6 Global Coal Combustion Products Market Forecast by Application
6 Global Coal Combustion Products Market Analysis by Volume
6.1 Global Utilised Volume Market Forecast Analysis
6.2 Global Utilised Volume Market Forecast Analysis by Region
6.3 Global Unutilised Volume Market Forecast Analysis
6.4 Global Unutilised Volume Market Forecast Analysis by Region
7 Global Coal Combustion Products Market Analysis by Product
7.1 Global Fly Ash Market Forecast
7.2 Global Fly Ash Market Forecast by Region
7.3 Global Flue Gas Desulfurization Material Market Forecast
7.4 Global Flue Gas Desulfurization Material Market Forecast by Region
7.5 Global Bottom Ash Market Forecast
7.6 Global Bottom Ash Market Forecast by Region
7.7 Global Boiler Slag Market Forecast
7.8 Global Boiler Slag Market Forecast by Region
7.9 Global Other By-Products Market Forecast
7.10 Global Other By-Products Market Forecast by Region
8 Global Coal Combustion Products Market Analysis by Application
8.1 Global Ponds/ Landfills Market Forecast
8.2 Global Ponds/ Landfills Market Forecast by Region
8.3 Global Concrete/Cement Products Market Forecast
8.4 Global Concrete/Cement Products Market Forecast by Region
8.5 Global Land Reclamation Market Forecast
8.6 Global Land Reclamation Market Forecast by Region
8.7 Global Wallboard Market Forecast
8.8 Global Wallboard Market Forecast by Region
8.9 Global Road Construction Market Forecast
8.10 Global Road Construction Market Forecast by Region
8.11 Global Other Applications Market Forecast
8.12 Global Other Applications Market Forecast by Region
9 Global Coal Combustion Products Market Analysis by Region
9.1 Key Findings
9.2 Global Coal Combustion Products Market Forecast
9.3 Global Coal Combustion Products Market Forecast by Region
9.4 Global Coal Combustion Products Market Forecast by Volume
9.5 Global Coal Combustion Products Market Forecast by Product Type
9.6 Global Coal Combustion Products Market Forecast by Application
10 North America Coal Combustion Products Market Analysis
10.1 In Some Quantity, Fly Ash Is Used As A Replacement For Traditional Cement In More Than Half Of The Concrete Produced In The United States.
10.2 The American Coal Ash Association's Promotion Of The Use Of CCPS
10.3 North America Coal Combustion Products Market Attractiveness Index
10.4 North America Coal Combustion Products (CCP) Market by Value
10.5 North America Coal Combustion Products (CCP) Market by Country
10.6 North America Coal Combustion Products (CCP) Market by Volume
10.7 North America Coal Combustion Products (CCP) Market by Product Type
10.8 North America Coal Combustion Products (CCP) Market by Application
10.9 U.S.
10.9.1 Dakota Gasification Co., A Subsidiary, Is Having Success Marketing And Selling Goods Made At Its Great Plains Synfuels Plant.
10.9.2 The Largest Coal Ash Beneficial Use Project in The US Will Be Displayed at Plant Bowen.
10.9.3 US Coal Combustion Products (CCP) Market by Value
10.10 Canada
10.10.1 The Association of Canadian Industries Is Encouraging the Use of CCPs And Recycling Coal Ash.
10.10.2 'Green' Fly Ash Might Be A Practical Substitute For Development.
10.10.3 Canada Coal Combustion Products (CCP) Market by Value
11 Europe Coal Combustion Products Market Analysis
11.1 Coal Fly Ash, not CFCs, is the Primary Ozone Depleting Substance
11.2 The creation of a global market for net zero concrete is the goal of the global initiative Concrete Zero
11.3 Europe Coal Combustion Products Market Attractiveness Index
11.4 Europe Coal Combustion Products (CCP) Market by Value
11.5 Europe Coal Combustion Products (CCP) Market by Country
11.6 Europe Coal Combustion Products (CCP) Market by Volume
11.7 Europe Coal Combustion Products (CCP) Market by Product Type
11.8 Europe Coal Combustion Products (CCP) Market by Application
11.9 Germany
11.9.1 Problems with Concrete Decarbonization
11.9.2 Starting the Industry's Journey Toward Net Zero
11.9.3 Germany Coal Combustion Products (CCP) Market by Value
11.10 UK
11.10.1 Enva Opens Ash Recycling Facility Officially
11.10.2 Businesses Promise To Use Green, Net-Zero Concrete In New Construction.
11.10.3 UK Coal Combustion Products (CCP) Market by Value
11.11 France
11.11.1 Making Compressed Earth Blocks with Dredged Sediment
11.11.2 Low Coal Ash Recycling Rate Due To Changes In Production And Use
11.11.3 France Coal Combustion Products (CCP) Market by Value
11.12 Italy
11.12.1 Italy's wise use of coal includes recycling it.
11.12.2 There Are Several Uses For Non-Recyclable By-Products
11.12.3 Italy Coal Combustion Products (CCP) Market by Value
11.13 Russia
11.13.1 Risks Associated with Maintaining the Current Model of Product Utilization from Coal Combustion in Russian Thermal Power Plants
11.13.2 Coal-fired thermal power plants have a history of breaking waste management regulations in Russian practice.
11.13.3 Russia Coal Combustion Products (CCP) Market by Value
11.14 Rest of Europe
11.14.1 A report on establishing BAT by the Organization for Economic Co-operation and Development (OECD) describes activities in various regions of the world.
11.14.2 Rest of Europe Coal Combustion Products (CCP) Market by Value
12 Asia Pacific Coal Combustion Products Market Analysis
12.1 Growing Waste Sources in Asia-Pacific Developing Nations
12.2 Utilization of By-Products of Coal Combustion for Economic Purposes
12.3 Asia Pacific Coal Combustion Products Market Attractiveness Index
12.4 Asia-Pacific Coal Combustion Products (CCP) Market by Value
12.5 Asia-Pacific Coal Combustion Products (CCP) Market by Country
12.6 Asia-Pacific Coal Combustion Products (CCP) Market by Volume
12.7 Asia-Pacific Coal Combustion Products (CCP) Market by Product Type
12.8 Asia-Pacific Coal Combustion Products (CCP) Market by Application
12.9 China
12.9.1 The purchases of Boral Resources and Green Cement by Eco Material are complete.
12.9.2 Fly Ash Management From Municipal Solid Waste Incineration In A Sustainable Way
12.9.3 China Coal Combustion Products (CCP) Market by Value
12.10 India
12.10.1 Fly Ash Use at Signarama Thermal Plant Wins Award
12.10.2 Fly ash is delivered in its first consignment by Vedanta Aluminum to ACC Cement.
12.10.3 India Coal Combustion Products (CCP) Market by Value
12.11 Japan
12.11.1 The quantity of coal-fired power generation and CCPs are related.
12.11.2 Japan's Emerging Market Conditions
12.11.3 Japan Coal Combustion Products (CCP) Market by Value
12.12 South Korea
12.12.1 Opportunities For Various Applications Of Coal Combustion Products
12.12.2 Seoul Ends Its Voluntary Coal Curbs.
12.12.3 South Korea Coal Combustion Products (CCP) Market by Value
12.13 Australia
12.13.1 As the North American Fly Ash Sale is finished, Boral's half-year earnings decline.
12.13.2 Promoting The Use Of Sustainable Construction Materials And Resource Efficiency.
12.13.3 Australia Coal Combustion Products (CCP) Market by Value
12.14 Rest of Asia Pacific
12.14.1 A number of initiatives have been put in place by the Carbon Neutrality and Green Growth Commission in an effort to gradually transition to complete carbon neutrality.
12.14.2 Rare Earth Elements and Gold Concentrations in Power Plant Coal Combustion Products Could Be Economic
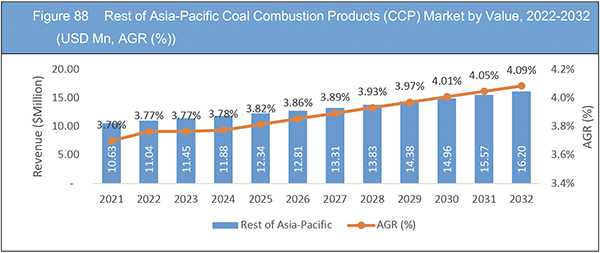
12.14.3 Rest of Asia-Pacific Coal Combustion Products (CCP) Market by Value
13 Middle East & Africa Coal Combustion Products Market Analysis
13.1 Utilizing The By-Products As Cheaply As Possible
13.2 A Strategy Is Needed To Increase The Use Of Fly-Ash Bricks.
13.3 Middle East & Africa Coal Combustion Products Market Attractiveness Index
13.4 Middle East & Africa Coal Combustion Products (CCP) Market by Value
13.5 Middle East & Africa Coal Combustion Products (CCP) Market by Country
13.6 Middle East & Africa Coal Combustion Products (CCP) Market by Volume
13.7 Middle East & Africa Coal Combustion Products (CCP) Market by Product Type
13.8 Middle East & Africa Coal Combustion Products (CCP) Market by Application
13.9 South Africa
13.9.1 High Production of Products from Coal Combustion in Developing Nations
13.9.2 Fly and Bottom Ash's Chemical Makeup Differs Considerably; Analysis Is Required Before Recycling
13.9.3 South Africa Coal Combustion Products (CCP) Market by Value
13.10 Saudi Arabia
13.10.1 Applications For Coal Combustion Products In Mining
13.10.2 Saudi Arabia Coal Combustion Products (CCP) Market by Value
13.11 Turkey
13.11.1 Advantages Of Coal Combustion Products For The Environment
13.11.2 There Are Some Action Areas That Must Be Addressed In Turkey In Order To Successfully Implement A Circular Economy.
13.11.3 Turkey Coal Combustion Products (CCP) Market by Value
13.12 Rest of Middle East & Africa
13.12.1 Authorities in South Africa make the use of ash a strategic priority.
13.12.2 Eskom's top priority right now is to use more ash in existing applications (bricks, cement, etc.)
13.12.3 Rest of Middle East & Africa Coal Combustion Products (CCP) Market by Value
14 South America Coal Combustion Products Market Analysis
14.1 Georgia Power Will Begin The Nation's Single-Largest Project For Using Coal Ash For Beneficial Purposes.
14.2 The project at Plant Bowen will be managed by Eco Material Technologies.
14.3 South America Coal Combustion Products Market Attractiveness Index
14.4 South America Coal Combustion Products (CCP) Market by Value
14.5 South America Coal Combustion Products (CCP) Market by Country
14.6 South America Coal Combustion Products (CCP) Market by Volume
14.7 South America Coal Combustion Products (CCP) Market by Product Type
14.8 South America Coal Combustion Products (CCP) Market by Application
14.9 Brazil
14.9.1 Brazilian Figueira Coal Power Plant Ashes and Coal Have Radioactive Properties
14.9.2 Modifications That Can Be Made To The Figueira Power Plant's Coal to Lessen Its Radioactive Nature
14.9.3 Brazil Coal Combustion Products (CCP) Market by Value
14.10 Mexico
14.10.1 Major construction companies collaborate to remove the carbon from concrete
14.10.2 Testbed For Sustainable Coal Products Opens In Wyoming
14.10.3 Mexico Coal Combustion Products (CCP) Market by Value
14.11 Rest of South America
14.11.1 Uses of Fly-Ash for a Wide Range of Situations
14.11.2 The Government Is Providing Assistance
14.11.3 Rest of South America Coal Combustion Products (CCP) Market by Value
15 Competitive Landscape
15.1 Company Positioning Analysis
15.2 Key Business Strategy Analysis
16 Company Profiles
16.1 American Electric Power (AEP)
16.1.1 Company Snapshot
16.1.2 Company Overview
16.1.3 Financial Analysis
16.1.4 Product Benchmarking
16.1.5 Strategic Outlook
16.2 Charah Solutions
16.2.1 Company Snapshot
16.2.2 Company Overview
16.2.3 Financial Analysis
16.2.4 Product Benchmarking
16.2.5 Strategic Outlook
16.3 CEMEX S.A.B. de C.V.
16.3.1 Company Snapshot
16.3.2 Company Overview
16.3.3 Financial Analysis
16.3.4 Product Benchmarking
16.3.5 Strategic Outlook
16.4 Stanwell Corporation Limited
16.4.1 Company Snapshot
16.4.2 Company Overview
16.4.3 Product Benchmarking
16.4.4 Strategic Outlook
16.5 WM Intellectual Property Holdings, L.L.C
16.5.1 Company Snapshot
16.5.2 Company Overview
16.5.3 Financial Analysis
16.5.4 Product Benchmarking
16.5.5 Strategic Outlook
16.6 Ameren Missouri
16.6.1 Company Snapshot
16.6.2 Company Overview
16.6.3 Financial Analysis
16.6.4 Product Benchmarking
16.6.5 Strategic Outlook
16.7 Coal Ash Solutions (CAS)
16.7.1 Company Snapshot
16.7.2 Company Overview
16.7.3 Product Benchmarking
16.8 Duke Energy Corporation
16.8.1 Company Snapshot
16.8.2 Company Overview
16.8.3 Financial Analysis
16.8.4 Product Benchmarking
16.8.5 Strategic Outlook
16.9 Lancaster Products
16.9.1 Company Snapshot
16.9.2 Company Overview
16.9.3 Product Benchmarking
16.10 AshTech
16.10.1 Company Snapshot
16.10.2 Company Overview
16.10.3 Product Benchmarking
16.11 Salt River Materials Group
16.11.1 Company Snapshot
16.11.2 Company Overview
16.11.3 Product Benchmarking
16.12 Talen Energy
16.12.1 Company Snapshot
16.12.2 Company Overview
16.12.3 Product Benchmarking
16.12.4 Strategic Outlook
16.13 FirstEnergy Corp
16.13.1 Company Snapshot
16.13.2 Company Overview
16.13.3 Financial Analysis
16.13.4 Product Benchmarking
16.13.5 Strategic Outlook
16.14 Separation technologies LLC
16.14.1 Company Snapshot
16.14.2 Company Overview
16.14.3 Product Benchmarking
16.14.4 Strategic Outlook
16.15 Minerals Technologies Inc.
16.15.1 Company Snapshot
16.15.2 Company Overview
16.15.3 Financial Analysis
16.15.4 Product Benchmarking
16.15.5 Strategic Outlook
17 Conclusion and Recommendations
17.1 Concluding Remarks from Visiongain
17.2 Recommendations for Market Players
List of Tables
Table 1 Global Coal Combustion Products Market Snapshot, 2022 & 2032 (US$million, CAGR %)
Table 2 Global Coal Combustion Products (CCP) Market Forecast, 2022-2032 (USD Mn, AGR (%), CAGR(%)) (V-Shaped Recovery Scenario)
Table 3 Global Coal Combustion Products (CCP) Market by Region, 2022-2032 (USD Mn, AGR (%), CAGR(%)) (V-Shaped Recovery Scenario)
Table 4 Global Coal Combustion Products (CCP) Market Forecast, 2022-2032 (USD Mn, AGR (%), CAGR(%)) (W-Shaped Recovery Scenario)
Table 5 Global Coal Combustion Products (CCP) Market by Region, 2022-2032 (USD Mn, AGR (%), CAGR(%)) (W-Shaped Recovery Scenario)
Table 6 Global Coal Combustion Products (CCP) Market Forecast, 2022-2032 (USD Mn, AGR (%), CAGR(%)) (U-Shaped Recovery Scenario)
Table 7 Global Coal Combustion Products (CCP) Market by Region, 2022-2032 (USD Mn, AGR (%), CAGR(%)) (U-Shaped Recovery Scenario)
Table 8 Global Coal Combustion Products (CCP) Market Forecast, 2022-2032 (USD Mn, AGR (%), CAGR(%)) (L-Shaped Recovery Scenario)
Table 9 Global Coal Combustion Products (CCP) Market by Region, 2022-2032 (USD Mn, AGR (%), CAGR(%)) (L-Shaped Recovery Scenario)
Table 10 Global Coal Combustion Products (CCP) Market Forecast, 2022-2032 (USD Mn, AGR (%), CAGR(%))
Table 11 Global Coal Combustion Products (CCP) Market by Region, 2022-2032 (USD Mn, AGR (%), CAGR(%))
Table 12 Global Coal Combustion Products (CCP) Market Volume by Region, 2022-2032 (Kilo Ton, AGR (%), CAGR(%))
Table 13 Global Coal Combustion Products (CCP) Market by Volume, 2022-2032 (USD Mn, AGR (%), CAGR(%))
Table 14 Global Coal Combustion Products (CCP) Market by By-Product Type, 2022-2032 (USD Mn, AGR (%), CAGR(%))
Table 15 Global Coal Combustion Products (CCP) Market by Application, 2022-2032 (USD Mn, AGR (%), CAGR(%))
Table 16 Global Coal Combustion Products (CCP) Market by Volume, 2022-2032 (Kilo Ton, AGR (%), CAGR(%))
Table 17 Global Utilized Volume Market Forecast, 2022-2032 (Kilo Ton, AGR (%), CAGR (%))
Table 18 Global Utilized Volume Market by Region, 2022-2032 (Kilo Ton, AGR (%), CAGR (%))
Table 19 Global Unutilized Volume Market Forecast, 2022-2032 (Kilo Ton, AGR (%), CAGR (%))
Table 20 Global Unutilized Volume Market by Region, 2022-2032 (Kilo Ton, AGR (%), CAGR (%))
Table 21 Global Coal Combustion Products (CCP) Market by By-Product Type, 2022-2032 (USD Mn, AGR (%), CAGR(%))
Table 22 Global Fly Ash Market Forecast, 2022-2032 (USD Mn, AGR (%), CAGR (%))
Table 23 Global Fly Ash Market by Region, 2022-2032 (USD Mn, AGR (%), CAGR(%))
Table 24 Global Flue Gas Desulfurization Material Market Forecast, 2022-2032 (USD Mn, AGR (%), CAGR (%))
Table 25 Global Flue Gas Desulfurization Material Market by Region, 2022-2032 (USD Mn, AGR (%), CAGR(%))
Table 26 Global Bottom Ash Market Forecast, 2022-2032 (USD Mn, AGR (%), CAGR (%))
Table 27 Global Bottom Ash Market by Region, 2022-2032 (USD Mn, AGR (%), CAGR(%))
Table 28 Global Boiler Slag Market Forecast, 2022-2032 (USD Mn, AGR (%), CAGR (%))
Table 29 Global Boiler Slag Market by Region, 2022-2032 (USD Mn, AGR (%), CAGR(%))
Table 30 Global Other By-Products Market Forecast, 2022-2032 (USD Mn, AGR (%), CAGR (%))
Table 31 Global Other By-Products Market by Region, 2022-2032 (USD Mn, AGR (%), CAGR(%))
Table 32 Global Coal Combustion Products (CCP) Market by Application, 2022-2032 (USD Mn, AGR (%), CAGR(%))
Table 33 Global Ponds/ Landfills Market Forecast, 2022-2032 (USD Mn, AGR (%), CAGR (%))
Table 34 Global Ponds/ Landfills Market by Region, 2022-2032 (USD Mn, AGR (%), CAGR(%))
Table 35 Global Concrete/Cement Products Market Forecast, 2022-2032 (USD Mn, AGR (%), CAGR (%))
Table 36 Global Concrete/Cement Products Market by Region, 2022-2032 (USD Mn, AGR (%), CAGR(%))
Table 37 Global Land Reclamation Market Forecast, 2022-2032 (USD Mn, AGR (%), CAGR(%))
Table 38 Global Land Reclamation Market by Region, 2022-2032 (USD Mn, AGR (%), CAGR(%))
Table 39 Global Wallboard Market Forecast, 2022-2032 (USD Mn, AGR (%), CAGR (%))
Table 40 Global Wallboard Market by Region, 2022-2032 (USD Mn, AGR (%), CAGR(%))
Table 41 Global Road Construction Market Forecast, 2022-2032 (USD Mn, AGR (%), CAGR (%))
Table 42 Global Road Construction Market by Region, 2022-2032 (USD Mn, AGR (%), CAGR(%))
Table 43 Global Other Applications Market Forecast, 2022-2032 (USD Mn, AGR (%), CAGR (%))
Table 44 Global Other Applications Market by Region, 2022-2032 (USD Mn, AGR (%), CAGR(%))
Table 45 Global Coal Combustion Products (CCP) Market Forecast, 2022-2032 (USD Mn, AGR (%), CAGR(%))
Table 46 Global Coal Combustion Products (CCP) Market by Region, 2022-2032 (USD Mn, AGR (%), CAGR(%))
Table 47 Global Coal Combustion Products (CCP) Market Volume by Region, 2022-2032 (Kilo Ton, AGR (%), CAGR(%))
Table 48 Global Coal Combustion Products (CCP) Market by Volume, 2022-2032 (USD Mn, AGR (%), CAGR(%))
Table 49 Global Coal Combustion Products (CCP) Market by By-Product Type, 2022-2032 (USD Mn, AGR (%), CAGR(%))
Table 50 Global Coal Combustion Products (CCP) Market by Application, 2022-2032 (USD Mn, AGR (%), CAGR(%))
Table 51 North America Coal Combustion Products (CCP) Market by Value, 2022-2032 (USD Mn, AGR (%), CAGR(%))
Table 52 North America Coal Combustion Products (CCP) Market by Country, 2022-2032 (USD Mn, AGR (%), CAGR(%))
Table 53 North America Coal Combustion Products (CCP) Market by Volume, 2022-2032 (Kilo Ton, AGR (%), CAGR(%))
Table 54 North America Coal Combustion Products (CCP) Market by By-Product Type, 2022-2032 (USD Mn, AGR (%), CAGR(%))
Table 55 North America Coal Combustion Products (CCP) Market by Application, 2022-2032 (USD Mn, AGR (%), CAGR(%))
Table 56 US Coal Combustion Products (CCP) Market by Value, 2022-2032 (USD Mn, AGR (%), CAGR(%))
Table 57 Canada Coal Combustion Products (CCP) Market by Value, 2022-2032 (USD Mn, AGR (%), CAGR(%))
Table 58 Europe Coal Combustion Products (CCP) Market by Value, 2022-2032 (USD Mn, AGR (%), CAGR(%))
Table 59 Europe Coal Combustion Products (CCP) Market by Country, 2022-2032 (USD Mn, AGR (%), CAGR(%))
Table 60 Europe Coal Combustion Products (CCP) Market by Volume, 2022-2032 (Kilo Ton, AGR (%), CAGR(%))
Table 61 Europe Coal Combustion Products (CCP) Market by By-Product Type, 2022-2032 (USD Mn, AGR (%), CAGR(%))
Table 62 Europe Coal Combustion Products (CCP) Market by Application, 2022-2032 (USD Mn, AGR (%), CAGR(%))
Table 63 Germany Coal Combustion Products (CCP) Market by Value, 2022-2032 (USD Mn, AGR (%), CAGR(%))
Table 64 UK Coal Combustion Products (CCP) Market by Value, 2022-2032 (USD Mn, AGR (%), CAGR(%))
Table 65 France Coal Combustion Products (CCP) Market by Value, 2022-2032 (USD Mn, AGR (%), CAGR(%))
Table 66 Italy Coal Combustion Products (CCP) Market by Value, 2022-2032 (USD Mn, AGR (%), CAGR(%))
Table 67 Russia Coal Combustion Products (CCP) Market by Value, 2022-2032 (USD Mn, AGR (%), CAGR (%))
Table 68 Rest of Europe Coal Combustion Products (CCP) Market by Value, 2022-2032 (USD Mn, AGR (%), CAGR (%))
Table 69 Asia-Pacific Coal Combustion Products (CCP) Market by Value, 2022-2032 (USD Mn, AGR (%), CAGR(%))
Table 70 Asia-Pacific Coal Combustion Products (CCP) Market by Country, 2022-2032 (USD Mn, AGR (%), CAGR(%))
Table 71 Asia-Pacific Coal Combustion Products (CCP) Market by Volume, 2022-2032 (Kilo Ton, AGR (%), CAGR(%))
Table 72 Asia-Pacific Coal Combustion Products (CCP) Market by By-Product Type, 2022-2032 (USD Mn, AGR (%), CAGR(%))
Table 73 Asia-Pacific Coal Combustion Products (CCP) Market by Application, 2022-2032 (USD Mn, AGR (%), CAGR(%))
Table 74 China Coal Combustion Products (CCP) Market by Value, 2022-2032 (USD Mn, AGR (%), CAGR(%))
Table 75 India Coal Combustion Products (CCP) Market by Value, 2022-2032 (USD Mn, AGR (%), CAGR(%))
Table 76 Japan Coal Combustion Products (CCP) Market by Value, 2022-2032 (USD Mn, AGR (%), CAGR(%))
Table 77 South Korea Coal Combustion Products (CCP) Market by Value, 2022-2032 (USD Mn, AGR (%), CAGR(%))
Table 78 Australia Coal Combustion Products (CCP) Market by Value, 2022-2032 (USD Mn, AGR (%), CAGR(%))
Table 79 Rest of Asia-Pacific Coal Combustion Products (CCP) Market by Value, 2022-2032 (USD Mn, AGR (%), CAGR (%))
Table 80 Middle East & Africa Coal Combustion Products (CCP) Market by Value, 2022-2032 (USD Mn, AGR (%), CAGR(%))
Table 81 Middle East & Africa Coal Combustion Products (CCP) Market by Country, 2022-2032 (USD Mn, AGR (%), CAGR(%))
Table 82 Middle East & Africa Coal Combustion Products (CCP) Market by Volume, 2022-2032 (Kilo Ton, AGR (%), CAGR(%))
Table 83 Middle East & Africa Coal Combustion Products (CCP) Market by By-Product Type, 2022-2032 (USD Mn, AGR (%), CAGR(%))
Table 84 Middle East & Africa Coal Combustion Products (CCP) Market by Application, 2022-2032 (USD Mn, AGR (%), CAGR(%))
Table 85 South Africa Coal Combustion Products (CCP) Market by Value, 2022-2032 (USD Mn, AGR (%), CAGR(%))
Table 86 Saudi Arabia Coal Combustion Products (CCP) Market by Value, 2022-2032 (USD Mn, AGR (%), CAGR(%))
Table 87 Turkey Coal Combustion Products (CCP) Market by Value, 2022-2032 (USD Mn, AGR (%), CAGR(%))
Table 88 Rest of Middle East & Africa Coal Combustion Products (CCP) Market by Value, 2022-2032 (USD Mn, AGR (%), CAGR (%))
Table 89 South America Coal Combustion Products (CCP) Market by Value, 2022-2032 (USD Mn, AGR (%), CAGR(%))
Table 90 South America Coal Combustion Products (CCP) Market by Country, 2022-2032 (USD Mn, AGR (%), CAGR(%))
Table 91 South America Coal Combustion Products (CCP) Market by Volume, 2022-2032 (Kilo Ton, AGR (%), CAGR(%))
Table 92 South America Coal Combustion Products (CCP) Market by By-Product Type, 2022-2032 (USD Mn, AGR (%), CAGR(%))
Table 93 South America Coal Combustion Products (CCP) Market by Application, 2022-2032 (USD Mn, AGR (%), CAGR(%))
Table 94 Brazil Coal Combustion Products (CCP) Market by Value, 2022-2032 (USD Mn, AGR (%), CAGR(%))
Table 95 Mexico Coal Combustion Products (CCP) Market by Value, 2022-2032 (USD Mn, AGR (%), CAGR(%))
Table 96 Rest of South America Coal Combustion Products (CCP) Market by Value, 2022-2032 (USD Mn, AGR (%), CAGR (%))
Table 97 Global Coal Combustion Products Market: Company Revenue Analysis, 2021
Table 98 Key Business Strategies Adopted by Key Players in Global Coal Combustion Products Market
Table 99 AEP: Key Details, (CEO, HQ, Revenue, Founded, No. of Employees, Company Type, Website, Business Segment)
Table 100 AEP: Product Benchmarking
Table 101 AEP: Strategic Outlook
Table 102 Charah Solutions Inc.: Key Details, (CEO, HQ, Revenue, Founded, No. of Employees, Company Type, Website, Business Segment)
Table 103 Charah Solutions Inc.: Product Benchmarking
Table 104 Charah Solutions Inc.: Strategic Outlook
Table 105 CEMEX SAB: Key Details, (CEO, HQ, Revenue, Founded, No. of Employees, Company Type, Website, Business Segment)
Table 106 CEMEX SAB: Product Benchmarking
Table 107 CEMEX SAB: Strategic Outlook
Table 108 Stanwell Energy: Key Details, (CEO, HQ, Revenue, Founded, No. of Employees, Company Type, Website, Business Segment)
Table 109 Stanwell Energy: Product Benchmarking
Table 110 Stanwell Energy: Strategic Outlook
Table 111 WM: Key Details, (CEO, HQ, Revenue, Founded, No. of Employees, Company Type, Website, Business Segment)
Table 112 WM: Product Benchmarking
Table 113 WM: Strategic Outlook
Table 114 Ameren Corp: Key Details, (CEO, HQ, Revenue, Founded, No. of Employees, Company Type, Website, Business Segment)
Table 115 Ameren Corp: Product Benchmarking
Table 116 Ameren Corp: Strategic Outlook
Table 117 CAS: Key Details, (CEO, HQ, Revenue, Founded, No. of Employees, Company Type, Website, Business Segment)
Table 118 CAS: Product Benchmarking
Table 119 Duke Energy: Key Details, (CEO, HQ, Revenue, Founded, No. of Employees, Company Type, Website, Business Segment)
Table 120 Duke Energy: Product Benchmarking
Table 121 Duke Energy: Strategic Outlook
Table 122 Lancaster Products: Key Details, (CEO, HQ, Revenue, Founded, No. of Employees, Company Type, Website, Business Segment)
Table 123 Lancaster Products: Product Benchmarking
Table 124 Ashtech: Key Details, (CEO, HQ, Revenue, Founded, No. of Employees, Company Type, Website, Business Segment)
Table 125 Ashtech: Product Benchmarking
Table 126 Salt River Materials Group: Key Details, (CEO, HQ, Revenue, Founded, No. of Employees, Company Type, Website, Business Segment)
Table 127 Salt River Materials Group: Product Benchmarking
Table 128 Talen Energy: Key Details, (CEO, HQ, Revenue, Founded, No. of Employees, Company Type, Website, Business Segment)
Table 129 Talen Energy: Product Benchmarking
Table 130 Talen Energy: Strategic Outlook
Table 131 FirstEnergy: Key Details, (CEO, HQ, Revenue, Founded, No. of Employees, Company Type, Website, Business Segment)
Table 132 FirstEnergy: Product Benchmarking
Table 133 FirstEnergy: Strategic Outlook
Table 134 Separation Technologies Inc: Key Details, (CEO, HQ, Revenue, Founded, No. of Employees, Company Type, Website, Business Segment)
Table 135 Separation Technologies Inc: Product Benchmarking
Table 136 Separation Technologies Inc: Strategic Outlook
Table 137 Minerals Technologies Inc: Key Details, (CEO, HQ, Revenue, Founded, No. of Employees, Company Type, Website, Business Segment)
Table 138 Minerals Technologies Inc: Product Benchmarking
Table 139 Minerals Technologies Inc: Strategic Outlook
List of Figures
Figure 1 Global Coal Combustion Products Market Segmentation
Figure 2 Global Coal Combustion Products Market Forecast by Region: Market Attractiveness Index
Figure 3 Global Coal Combustion Products Market by Technology: Market Attractiveness Index
Figure 4 Global Coal Combustion Products Market by End-users: Market Attractiveness Index
Figure 5 Global Coal Combustion Products Market: Market Dynamics
Figure 14 Global Coal Combustion Products Market: Porter’s Five Forces Analysis
Figure 15 Global Coal Combustion Products Market: PESTLE Analysis
Figure 57 North America Coal Combustion Products Market Attractiveness Index
Figure 65 Europe Coal Combustion Products Market Attractiveness Index
Figure 75 Russia Coal Combustion Products (CCP) Market by Value, 2022-2032 (USD Mn, AGR (%))
Figure 76 Rest of Europe Coal Combustion Products (CCP) Market by Value, 2022-2032 (USD Mn, AGR (%))
Figure 77 Asia Pacific Coal Combustion Products Market Attractiveness Index
Figure 78 Asia-Pacific Coal Combustion Products (CCP) Market by Value, 2022-2032 (USD Mn, AGR (%))
Figure 79 Asia-Pacific Coal Combustion Products (CCP) Market by Country, 2022-2032 (USD Mn, AGR (%))
Figure 80 Asia-Pacific Coal Combustion Products (CCP) Market by Volume, 2022-2032 (Kilo Ton, AGR (%))
Figure 81 Asia-Pacific Coal Combustion Products (CCP) Market by By-Product Type, 2022-2032 (USD Mn, AGR (%))
Figure 82 Asia-Pacific Coal Combustion Products (CCP) Market by Application, 2022-2032 (USD Mn, AGR (%))
Figure 89 Middle East & Africa Coal Combustion Products Market Attractiveness Index
Figure 95 South Africa Coal Combustion Products (CCP) Market by Value, 2022-2032 (USD Mn, AGR (%))
Figure 96 Saudi Arabia Coal Combustion Products (CCP) Market by Value, 2022-2032 (USD Mn, AGR (%))
Figure 97 Turkey Coal Combustion Products (CCP) Market by Value, 2022-2032 (USD Mn, AGR (%))
Figure 98 Rest of Middle East & Africa Coal Combustion Products (CCP) Market by Value, 2022-2032 (USD Mn, AGR (%))
Figure 99 South America Coal Combustion Products Market Attractiveness Index
Figure 100 South America Coal Combustion Products (CCP) Market by Value, 2022-2032 (USD Mn, AGR (%))
Figure 101 South America Coal Combustion Products (CCP) Market by Country, 2022-2032 (USD Mn, AGR (%))
Figure 102 South America Coal Combustion Products (CCP) Market by Volume, 2022-2032 (Kilo Ton, AGR (%))
Figure 103 South America Coal Combustion Products (CCP) Market by By-Product Type, 2022-2032 (USD Mn, AGR (%))
Figure 104 South America Coal Combustion Products (CCP) Market by Application, 2022-2032 (USD Mn, AGR (%))
Figure 105 Brazil Coal Combustion Products (CCP) Market by Value, 2022-2032 (USD Mn, AGR (%))
Figure 106 Mexico Coal Combustion Products (CCP) Market by Value, 2022-2032 (USD Mn, AGR (%))
Figure 107 Rest of South America Coal Combustion Products (CCP) Market by Value, 2022-2032 (USD Mn, AGR (%))
Figure 108 AEP: Net Revenue, 2017-2021 (US$ million, AGR%)
Figure 109 AEP: Gross Profit, 2017-2021 (US$ million, AGR%)
Figure 110 AEP: Net Profit 2017-2021 (US$ million, AGR%)
Figure 111 AEP: EBITDA, 2017-2021 (US$ million, AGR%)
Figure 112 Charah Solutions Inc.: Net Revenue, 2017-2021 (US$ million, AGR%)
Figure 113 Charah Solutions Inc.: Gross Profit, 2017-2021 (US$ million, AGR%)
Figure 114 Charah Solutions Inc.: Net Profit 2017-2021 (US$ million, AGR%)
Figure 115 Charah Solutions Inc.: EBITDA, 2017-2021 (US$ million, AGR%)
Figure 116 CEMEX SAB: Net Revenue, 2017-2021 (US$ million, AGR%)
Figure 117 CEMEX SAB: Gross Profit, 2017-2021 (US$ million, AGR%)
Figure 118 CEMEX SAB: Net Profit 2017-2021 (US$ million, AGR%)
Figure 119 CEMEX SAB: EBITDA, 2017-2021 (US$ million, AGR%)
Figure 120 WM: Net Revenue, 2017-2021 (US$ million, AGR%)
Figure 121 WM: Gross Profit, 2017-2021 (US$ million, AGR%)
Figure 122 WM: Net Profit 2017-2021 (US$ million, AGR%)
Figure 123 WM: EBITDA, 2017-2021 (US$ million, AGR%)
Figure 124 Ameren Corp: Net Revenue, 2017-2021 (US$ million, AGR%)
Figure 125 Ameren Corp: Gross Profit, 2017-2021 (US$ million, AGR%)
Figure 126 Ameren Corp: Net Profit 2017-2021 (US$ million, AGR%)
Figure 127 Ameren Corp: EBITDA, 2017-2021 (US$ million, AGR%)
Figure 128 Duke Energy: Net Revenue, 2017-2021 (US$ million, AGR%)
Figure 129 Duke Energy: Gross Profit, 2017-2021 (US$ million, AGR%)
Figure 130 Duke Energy: Net Profit 2017-2021 (US$ million, AGR%)
Figure 131 Duke Energy: EBITDA, 2017-2021 (US$ million, AGR%)
Figure 132 FirstEnergy: Net Revenue, 2017-2021 (US$ million, AGR%)
Figure 133 FirstEnergy: Gross Profit, 2017-2021 (US$ million, AGR%)
Figure 134 FirstEnergy: Net Profit 2017-2021 (US$ million, AGR%)
Figure 135 FirstEnergy: EBITDA, 2017-2021 (US$ million, AGR%)
Figure 136 Minerals Technologies Inc: Net Revenue, 2017-2021 (US$ million, AGR%)
Figure 137 Minerals Technologies Inc: Gross Profit, 2017-2021 (US$ million, AGR%)
Figure 138 Minerals Technologies Inc: Net Profit 2017-2021 (US$ million, AGR%)
Figure 139 Minerals Technologies Inc: EBITDA, 2017-2021 (US$ million, AGR%)
List of Companies Profiled in the report
Ameren Missouri
American Electric Power
AshTech
CEMEX S.A.B. de C.V.
Charah Solutions
Coal Ash Solutions
Duke Energy Corporation
FirstEnergy Corp
Lancester Products
Minerals Technologies Inc.
Salt River Materials Group
Seperation Technologies LLC
Stanwell Corporation Ltd
Talen Energy
WM Intellectual Property Holdings L.L.C.
List of Other Companies Mentioned in the report
Ameren Missouri
American Electric Power (AEP)
Aurora Energy, LLC
Colorado Springs Utilities
Colstrip Energy Limited Partnership
Dairyland Power Cooperative
DTE Energy
Duke Energy Corporation
FirstEnergy Corp
Great River Energy
Indianapolis Power & Light (AES)
Kansas City Board of Public Utilities
LG&E and KU Services Company
Muscatine Power & Water
Nebraska Public Power District
Southern Company
Talen Energy
Tennessee Valley Authority
WEC Business Services LLC
List of Associations Mentioned in the Report
American Council for an Energy-Efficient Economy
Australian Coal Association
Centre for Climate Change Economics and Policy
China Coal Transport and Distribution Association (CCTD)
China's National Development and Reform Commission (NDRC)
Congressional Research Services (CRS)
Co-operative Research Centre for Greenhouse Gas Technologies (CO2CRC)
Department of Climate Change and Energy Efficiency (Australia)
Department of Energy & Climate Change (DECC) (UK)
Department of Energy (DOE)
Energy Information Administration (EIA)
Environmental Protection Agency (EPA)
European Association of Coal & Lignite (Euracoal)
European Union (EU)
Global Energy Observatory
Health & Safety Executive (HSE)
International Atomic Energy Agency (IAEA)
International Energy Agency (IEA)
Ministry of Knowledge Economy (South Korea)
National Energy Board (Canada)
National Energy Technology Laboratory (US)
Organisation for Economic Cooperation and Development (OECD)
World Bank
World Coal Association
 Market Report 2022-2032")