The Carbon Capture & Storage (CCS) Market Report 2023-2033: This report will prove invaluable to leading firms striving for new revenue pockets if they wish to better understand the industry and its underlying dynamics. It will be useful for companies that would like to expand into different industries or to expand their existing operations in a new region.
Improvement in the Carbon Capture Technologies
Technological advancements have revolutionized the field of carbon capture and storage (CCS), leading to the development of more efficient and cost-effective CO2 capture techniques. Notably, solvent-based capture technologies, such as amine-based systems, have been widely utilized in CCS applications.
Ongoing research endeavours focus on enhancing the efficiency and reducing the energy requirements of these systems. An example of recent progress in the field is the launch of the XLR8 CCS project by C-Capture in June 2022. This national project aims to capture CO2 emissions from hard-to-decarbonize industries using a low-cost, post-combustion collection approach.
The project leverages a novel class of capture solvents that are devoid of amines and nitrogen, enabling inexpensive large-scale manufacturing. Furthermore, this innovative technology offers the potential for producing biomethane, a renewable fuel, alongside CO2 capture. These technological advancements in CO2 capture techniques hold immense promise for advancing the CCS market, making the process more viable and contributing to the reduction of greenhouse gas emissions.
High Deployment Costs Likely to Hamper Market Growth
The cost of carbon capture and storage (CCS) can vary significantly depending on the source of CO2 and the specific application. Industrial processes with concentrated CO2 streams, such as ethanol production, can have capture costs ranging from USD 15-25 per ton of CO2. However, processes with dilute gas streams like cement production and power generation can have higher capture costs, ranging from USD 40-120 per ton of CO2. The cost of transport and storage also varies depending on factors such as CO2 volumes, distances, and storage conditions.
Onshore pipeline transport costs in the United States range from USD 2-14 per ton of CO2, while storage costs can vary widely. In some cases, storage costs can even be negative if the CO2 is injected into oilfields to enhance production and generate additional revenue. The total cost of CCS can vary depending on the specific project, but it is generally estimated to be between $30 and $200 per tonne of CO2 avoided. This is significantly more expensive than other emissions reduction technologies, such as renewable energy. As a result, CCS is not likely to be widely deployed unless there are significant government incentives or carbon pricing mechanisms in place.
What Questions Should You Ask before Buying a Market Research Report?
• How is the carbon capture & storage (CCS) market evolving?
• What is driving and restraining the carbon capture & storage (CCS) market?
• How will each carbon capture & storage (CCS) submarket segment grow over the forecast period and how much revenue will these submarkets account for in 2033?
• How will the market shares for each carbon capture & storage (CCS) submarket develop from 2023 to 2033?
• What will be the main driver for the overall market from 2023 to 2033?
• Will leading carbon capture & storage (CCS) markets broadly follow the macroeconomic dynamics, or will individual national markets outperform others?
• How will the market shares of the national markets change by 2033 and which geographical region will lead the market in 2033?
• Who are the leading players and what are their prospects over the forecast period?
• What is the carbon capture & storage (CCS) projects for these leading companies?
• How will the industry evolve during the period between 2023 and 2033? What are the implications of carbon capture & storage (CCS) projects taking place now and over the next 10 years?
• Is there a greater need for product commercialisation to further scale the carbon capture & storage (CCS) market?
• Where is the carbon capture & storage (CCS) market heading and how can you ensure you are at the forefront of the market?
• What are the best investment options for new product and service lines?
• What are the key prospects for moving companies into a new growth path and C-suite?
You need to discover how this will impact the carbon capture & storage (CCS) market today, and over the next 10 years:
• Our 375-page report provides 100 tables and 175 charts/graphs exclusively to you.
• The report highlights key lucrative areas in the industry so you can target them – NOW.
• It contains in-depth analysis of global, regional, and national sales and growth.
• It highlights for you the key successful trends, changes and revenue projections made by your competitors.
This report tells you TODAY how the Carbon Capture & Storage (CCS) market will develop in the next 10 years, and in line with the variations in COVID-19 economic recession and bounce. This market is more critical now than at any point over the last 10 years.
Forecasts to 2033 and other analyses reveal commercial prospects
• In addition to revenue forecasting to 2033, our new study provides you with recent results, growth rates, and market shares.
• You will find original analyses, with business outlooks and developments.
• Discover qualitative analyses (including market dynamics, drivers, opportunities, restraints, and challenges), cost structure, impact of rising carbon capture & storage (CCS) prices and recent developments.
This report includes data analysis and invaluable insight into how COVID-19 will affect the industry and your company. Four COVID-19 recovery patterns and their impact, namely, “V”, “L”, “W” and “U” are discussed in this report.
Segments Covered in the Report
CCS Type Outlook
• CCS Technology
• CCS Services
CCS Technology Outlook
• Industrial Separation Capture Technology
• Inherent Separation Technology
• OXY-Fuel Combustion Capture Technology
• Post-Combustion Capture Technology
• Pre-Combustion Capture Technology
• Other
CCS Services Outlook
• Carbon Capture Services
• Carbon Storage Services
• Carbon Capture Transportation Services
• Others
Application Outlook
• Power Generation
• Industrial Sector
• Transport Sector
• Construction Sector
• Other

In addition to the revenue predictions for the overall world market and segments, you will also find revenue forecasts for five regional and 21 leading national markets:
North America
• U.S.
• Canada
Europe
• Germany
• UK
• France
• Spain
• Italy
• Rest of Europe
Asia Pacific
• China
• Japan
• India
• Australia
• South Korea
• Rest of Asia Pacific
Latin America
• Brazil
• Mexico
• Rest of Latin America
MEA
• GCC
• South Africa
• Rest of MEA
Need industry data? Please contact us today.
The report also includes profiles and for some of the leading companies in the Carbon Capture & Storage (CCS) Market, 2023 to 2033, with a focus on this segment of these companies’ operations.
Leading companies and the potential for market growth
• Air Liquide
• Aker Solutions
• Baker Hughes Company
• Chevron Corporation
• Exxon Mobil Corporation
• General Electric Corporation
• Halliburton Company
• Linde AG.
• Mitsubishi Heavy Industries, Ltd.
• NRG Energy Inc.
• Occidental Petroleum Corporation
• Schlumberger Limited.
• Shell
• Siemens Energy
• Sulzer Ltd
Overall world revenue for Carbon Capture & Storage (CCS) Market, 2023 to 2033 in terms of value the market will surpass US$11.8 billion in 2023, our work calculates. We predict strong revenue growth through to 2033. Our work identifies which organizations hold the greatest potential. Discover their capabilities, progress, and commercial prospects, helping you stay ahead.
How will the Carbon Capture & Storage (CCS) Market, 2023 to 2033 report help you?
In summary, our 370+ page report provides you with the following knowledge:
• Revenue forecasts to 2033 for Carbon Capture & Storage (CCS) Market, 2023 to 2033 Market, with forecasts for type, technology, services, and application, each forecast at a global and regional level – discover the industry’s prospects, finding the most lucrative places for investments and revenues.
• Revenue forecasts to 2033 for five regional and 21 key national markets – See forecasts for the Carbon Capture & Storage (CCS) Market, 2023 to 2033 market in North America, Europe, Asia-Pacific, Latin America, and MEA. Also forecasted is the market in the US, Canada, Mexico, Brazil, Germany, France, UK, Italy, China, India, Japan, and Australia among other prominent economies.
• Prospects for established firms and those seeking to enter the market – including company profiles for 15 of the major companies involved in the Carbon Capture & Storage (CCS) Market, 2023 to 2033.
Find quantitative and qualitative analyses with independent predictions. Receive information that only our report contains, staying informed with invaluable business intelligence.
Information found nowhere else
With our new report, you are less likely to fall behind in knowledge or miss out on opportunities. See how our work could benefit your research, analyses, and decisions. Visiongain’s study is for everybody needing commercial analyses for the Carbon Capture & Storage (CCS) Market, 2023 to 2033, market-leading companies. You will find data, trends and predictions.
To access the data contained in this document please email contactus@visiongain.com
Buy our report today Carbon Capture & Storage (CCS) Market Report 2023-2033: Forecasts by Type (CCS Technology (Industrial Separation Capture Technology, Inherent Separation Technology, OXY-Fuel Combustion Capture Technology, Post-Combustion Capture Technology, Pre-Combustion Capture Technology, Other), CCS Services (Carbon Capture Services, Carbon Storage Services, Carbon Capture Transportation Services, Others)), by Application (Power Generation, Industrial Sector, Transport Sector, Construction Sector, Other) AND Regional and Leading National Market Analysis PLUS Analysis of Leading Companies AND COVID-19 Impact and Recovery Pattern Analysis. Avoid missing out by staying informed – order our report now.
Visiongain is a trading partner with the US Federal Government
CCR Ref number: KD4R6
Do you have any custom requirements we can help you with? Any need for a specific country, geo region, market segment or specific company information? Contact us today, we can discuss your needs and see how we can help: contactus@visiongain.com
1 Report Overview
1.1 Objectives of the Study
1.2 Introduction to Carbon Capture & Storage (CCS) Market
1.3 What This Report Delivers
1.4 Why You Should Read This Report
1.5 Key Questions Answered by This Analytical Report
1.6 Who is This Report for?
1.7 Methodology
1.7.1 Market Definitions
1.7.2 Market Evaluation & Forecasting Methodology
1.7.3 Data Validation
1.7.3.1 Primary Research
1.7.3.2 Secondary Research
1.8 Frequently Asked Questions (FAQs)
1.9 Associated Visiongain Reports
1.10 About Visiongain
2 Executive Summary
3 Market Overview
3.1 Key Findings
3.2 Market Dynamics
3.2.1 Market Driving Factors
3.2.1.1 Government Regulations and Policies to Fuel CCS Market Growth
3.2.1.2 Technological Developments to Fuel CCS Market Growth
3.2.1.3 International Cooperation and Partnerships are Expected to Drive Market Growth
3.2.2 Market Restraining Factors
3.2.2.1 High Deployment Costs Likely to Hamper Market Growth
3.2.2.2 CO2 Leakage Issues
3.2.2.3 Limited Infrastructure and Storage Capacity
3.2.3 Market Opportunities
3.2.3.1 Hydrogen Production and CCS Integration Present a Significant Opportunity
3.2.3.2 Carbon Capture Technologies are Essential for Achieving Climate Goals
3.2.3.3 Meeting Climate Goals Necessitates the Development of a Highly Adaptable Electricity System
3.2.3.4 Aid in the Reduction of Emissions from Major Industrial Operations
3.2.4 Market Challenges
3.2.4.1 Competing Technologies and Decarbonization Options Might Limit Market Growth
3.2.4.2 Carbon Capture Retrofit Challenges
3.2.4.3 Constant CO2 Storage Restrictions are Unlikely to be Consistent with Climate Objectives in 2060
3.2.4.4 Limited Carbon Pricing and Market Incentives are a Significant Challenge for the Market
3.3 COVID-19 Impact Analysis
3.4 SWOT Analysis
3.4.1 Strengths:
3.4.2 Weaknesses:
3.4.3 Opportunities:
3.4.4 Threats:
3.5 Porter’s Five Forces Analysis
3.5.1 Bargaining Power of Suppliers
3.5.2 Bargaining Power of Buyers
3.5.3 Competitive Rivalry
3.5.4 Threat from Substitutes
3.5.5 Threat of New Entrants
3.6 PEST Analysis
4 Carbon Capture & Storage (CCS) Market Analysis by Type
4.1 Key Findings
4.2 Type Segment: Market Attractiveness Index
4.3 Carbon Capture & Storage (CCS) Market Size Estimation and Forecast by Type
4.4 CCS Technology
4.4.1 Market Size by Region, 2023-2033 (US$ Million)
4.4.2 Market Share by Region, 2023 & 2033 (%)
4.5 CCS Services
4.5.1 Market Size by Region, 2023-2033 (US$ Million)
4.5.2 Market Share by Region, 2023 & 2033 (%)
5 Carbon Capture & Storage (CCS) Market Analysis by Technology
5.1 Key Findings
5.2 Technology Segment: Market Attractiveness Index
5.3 Carbon Capture & Storage (CCS) Market Size Estimation and Forecast by Technology
5.4 Industrial Separation Capture Technology
5.4.1 Market Size by Region, 2023-2033 (US$ Million)
5.4.2 Market Share by Region, 2023 & 2033 (%)
5.5 Inherent Separation Technology
5.5.1 Market Size by Region, 2023-2033 (US$ Million)
5.5.2 Market Share by Region, 2023 & 2033 (%)
5.6 OXY-Fuel Combustion Capture Technology
5.6.1 Market Size by Region, 2023-2033 (US$ Million)
5.6.2 Market Share by Region, 2023 & 2033 (%)
5.7 Post-Combustion Capture Technology
5.7.1 Market Size by Region, 2023-2033 (US$ Million)
5.7.2 Market Share by Region, 2023 & 2033 (%)
5.8 Pre-Combustion Capture Technology
5.8.1 Market Size by Region, 2023-2033 (US$ Million)
5.8.2 Market Share by Region, 2023 & 2033 (%)
5.9 Other
5.9.1 Market Size by Region, 2023-2033 (US$ Million)
5.9.2 Market Share by Region, 2023 & 2033 (%)
6 Carbon Capture & Storage (CCS) Market Analysis by Services
6.1 Key Findings
6.2 Services Segment: Market Attractiveness Index
6.3 Carbon Capture & Storage (CCS) Market Size Estimation and Forecast by Services
6.4 Carbon Capture Services
6.4.1 Market Size by Region, 2023-2033 (US$ Million)
6.4.2 Market Share by Region, 2023 & 2033 (%)
6.5 Carbon Storage Services
6.5.1 Market Size by Region, 2023-2033 (US$ Million)
6.5.2 Market Share by Region, 2023 & 2033 (%)
6.6 Carbon Capture Transportation Services
6.6.1 Market Size by Region, 2023-2033 (US$ Million)
6.6.2 Market Share by Region, 2023 & 2033 (%)
6.7 Others
6.7.1 Market Size by Region, 2023-2033 (US$ Million)
6.7.2 Market Share by Region, 2023 & 2033 (%)
7 Carbon Capture & Storage (CCS) Market Analysis by Application
7.1 Key Findings
7.2 Application Segment: Market Attractiveness Index
7.3 Carbon Capture & Storage (CCS) Market Size Estimation and Forecast by Application
7.4 Power Generation
7.4.1 Market Size by Region, 2023-2033 (US$ Million)
7.4.2 Market Share by Region, 2023 & 2033 (%)
7.5 Industrial Sector
7.5.1 Market Size by Region, 2023-2033 (US$ Million)
7.5.2 Market Share by Region, 2023 & 2033 (%)
7.6 Transport Sector
7.6.1 Market Size by Region, 2023-2033 (US$ Million)
7.6.2 Market Share by Region, 2023 & 2033 (%)
7.7 Construction Sector
7.7.1 Market Size by Region, 2023-2033 (US$ Million)
7.7.2 Market Share by Region, 2023 & 2033 (%)
7.8 Other
7.8.1 Market Size by Region, 2023-2033 (US$ Million)
7.8.2 Market Share by Region, 2023 & 2033 (%)
8 Carbon Capture & Storage (CCS) Market Analysis by Region
8.1 Key Findings
8.2 Regional Market Size Estimation and Forecast (Value)
8.3 Regional Market Size Estimation and Forecast (Volume)
9 North America Carbon Capture & Storage (CCS) Market Analysis
9.1 Key Findings
9.2 North America Carbon Capture & Storage (CCS) Market Attractiveness Index
9.3 North America Carbon Capture & Storage (CCS) Market by Country, 2023, 2028 & 2033 (US$ Million)
9.4 North America Carbon Capture & Storage (CCS) Market Size Estimation and Forecast by Country (Value)
9.5 North America Carbon Capture & Storage (CCS) Market Size Estimation and Forecast by Country (Volume)
9.6 North America Carbon Capture & Storage (CCS) Market Size Estimation and Forecast by Type
9.7 North America Carbon Capture & Storage (CCS) Market Size Estimation and Forecast by Technology
9.8 North America Carbon Capture & Storage (CCS) Market Size Estimation and Forecast by Application
9.9 North America Carbon Capture & Storage (CCS) Market Size Estimation and Forecast by Service
9.10 U.S. Carbon Capture & Storage (CCS) Market Analysis
9.11 Canada Carbon Capture & Storage (CCS) Market Analysis
10 Europe Carbon Capture & Storage (CCS) Market Analysis
10.1 Key Findings
10.2 Europe Carbon Capture & Storage (CCS) Market Attractiveness Index
10.3 Europe Carbon Capture & Storage (CCS) Market by Country, 2023, 2028 & 2033 (US$ Million)
10.4 Europe Carbon Capture & Storage (CCS) Market Size Estimation and Forecast by Country (Value)
10.5 Europe Carbon Capture & Storage (CCS) Market Size Estimation and Forecast by Country (Volume)
10.6 Europe Carbon Capture & Storage (CCS) Market Size Estimation and Forecast by Type
10.7 Europe Carbon Capture & Storage (CCS) Market Size Estimation and Forecast by Technology
10.8 Europe Carbon Capture & Storage (CCS) Market Size Estimation and Forecast by Application
10.9 Europe Carbon Capture & Storage (CCS) Market Size Estimation and Forecast by Services
10.10 Germany Carbon Capture & Storage (CCS) Market Analysis
10.11 UK Carbon Capture & Storage (CCS) Market Analysis
10.12 France Carbon Capture & Storage (CCS) Market Analysis
10.13 Italy Carbon Capture & Storage (CCS) Market Analysis
10.14 Spain Carbon Capture & Storage (CCS) Market Analysis
10.15 Rest of Europe Carbon Capture & Storage (CCS) Market Analysis
11 Asia Pacific Carbon Capture & Storage (CCS) Market Analysis
11.1 Key Findings
11.2 Asia Pacific Carbon Capture & Storage (CCS) Market Attractiveness Index
11.3 Asia Pacific Carbon Capture & Storage (CCS) Market by Country, 2023, 2028 & 2033 (US$ Million)
11.4 Asia Pacific Carbon Capture & Storage (CCS) Market Size Estimation and Forecast by Country (Value)
11.5 Asia Pacific Carbon Capture & Storage (CCS) Market Size Estimation and Forecast by Country (Volume)
11.6 Asia Pacific Carbon Capture & Storage (CCS) Market Size Estimation and Forecast by Type
11.7 Asia Pacific Carbon Capture & Storage (CCS) Market Size Estimation and Forecast by Technology
11.8 Asia Pacific Carbon Capture & Storage (CCS) Market Size Estimation and Forecast by Application
11.9 Asia Pacific Carbon Capture & Storage (CCS) Market Size Estimation and Forecast by Services
11.10 China Carbon Capture & Storage (CCS) Market Analysis
11.11 India Carbon Capture & Storage (CCS) Market Analysis
11.12 Japan Carbon Capture & Storage (CCS) Market Analysis
11.13 South Korea Carbon Capture & Storage (CCS) Market Analysis
11.14 Australia Carbon Capture & Storage (CCS) Market Analysis
11.15 Rest of Asia Pacific Carbon Capture & Storage (CCS) Market Analysis
12 Latin America Carbon Capture & Storage (CCS) Market Analysis
12.1 Key Findings
12.2 Latin America Carbon Capture & Storage (CCS) Market Attractiveness Index
12.3 Latin America Carbon Capture & Storage (CCS) Market by Country, 2023, 2028 & 2033 (US$ Million)
12.4 Latin America Carbon Capture & Storage (CCS) Market Size Estimation and Forecast by Country (Value)
12.5 Latin America Carbon Capture & Storage (CCS) Market Size Estimation and Forecast by Country (Volume)
12.6 Latin America Carbon Capture & Storage (CCS) Market Size Estimation and Forecast by Type
12.7 Latin America Carbon Capture & Storage (CCS) Market Size Estimation and Forecast by Technology
12.8 Latin America Carbon Capture & Storage (CCS) Market Size Estimation and Forecast by Application
12.9 Latin America Carbon Capture & Storage (CCS) Market Size Estimation and Forecast by Service
12.10 Brazil Carbon Capture & Storage (CCS) Market Analysis
12.11 Mexico Carbon Capture & Storage (CCS) Market Analysis
12.12 Rest of Latin America Carbon Capture & Storage (CCS) Market Analysis
13 Middle East & Africa Carbon Capture & Storage (CCS) Market Analysis
13.1 Key Findings
13.2 Middle East & Africa Carbon Capture & Storage (CCS) Market Attractiveness Index
13.3 Middle East & Africa Carbon Capture & Storage (CCS) Market by Country, 2023, 2028 & 2033 (US$ Million)
13.4 Middle East & Africa Carbon Capture & Storage (CCS) Market Size Estimation and Forecast by Country (Value)
13.5 Middle East & Africa Carbon Capture & Storage (CCS) Market Size Estimation and Forecast by Country (Volume)
13.6 Middle East & Africa Carbon Capture & Storage (CCS) Market Size Estimation and Forecast by Type
13.7 Middle East & Africa Carbon Capture & Storage (CCS) Market Size Estimation and Forecast by Technology
13.8 Middle East & Africa Carbon Capture & Storage (CCS) Market Size Estimation and Forecast by Services
13.9 Middle East & Africa Carbon Capture & Storage (CCS) Market Size Estimation and Forecast by Application
13.10 GCC Carbon Capture & Storage (CCS) Market Analysis
13.11 South Africa Carbon Capture & Storage (CCS) Market Analysis
13.12 Rest of Middle East & Africa Carbon Capture & Storage (CCS) Market Analysis
14 Company Profiles
14.1 Competitive Landscape, 2023
14.2 Strategic Outlook
14.3 Exxon Mobil Corporation
14.3.1 Company Snapshot
14.3.2 Company Overview
14.3.3 Financial Analysis
14.3.3.1 Net Revenue, 2017-2022
14.3.3.2 R&D, 2017-2022
14.3.4 Product Benchmarking
14.3.5 Strategic Outlook
14.4 Aker Solutions
14.4.1 Company Snapshot
14.4.2 Company Overview
14.4.3 Financial Analysis
14.4.3.1 Net Revenue, 2017-2022
14.4.3.2 R&D, 2017-2022
14.4.3.3 Regional Market Shares, 2022
14.4.4 Product Benchmarking
14.4.5 Strategic Outlook
14.5 Shell
14.5.1 Company Snapshot
14.5.2 Company Overview
14.5.3 Financial Analysis
14.5.3.1 Net Revenue, 2017-2022
14.5.3.2 R&D, 2017-2022
14.5.3.3 Regional Market Shares, 2022
14.5.4 Product Benchmarking
14.5.5 Strategic Outlook
14.6 Mitsubishi Heavy Industries, Ltd.
14.6.1 Company Snapshot
14.6.2 Company Overview
14.6.3 Financial Analysis
14.6.3.1 Net Revenue, 2017-2022
14.6.3.2 R&D, 2017-2022
14.6.3.3 Regional Market Shares, 2022
14.6.4 Product Benchmarking
14.6.5 Strategic Outlook
14.7 Baker Hughes Company
14.7.1 Company Snapshot
14.7.2 Company Overview
14.7.3 Financial Analysis
14.7.3.1 Net Revenue, 2017-2022
14.7.3.2 R&D, 2017-2022
14.7.3.3 Regional Market Shares, 2022
14.7.4 Product Benchmarking
14.7.5 Strategic Outlook
14.8 Occidental Petroleum Corporation
14.8.1 Company Snapshot
14.8.2 Company Overview
14.8.3 Financial Analysis
14.8.3.1 Net Revenue, 2017-2022
14.8.3.2 R&D, 2017-2022
14.8.3.3 Regional Market Shares, 2022
14.8.4 Product Benchmarking
14.8.5 Strategic Outlook
14.9 Halliburton Company
14.9.1 Company Snapshot
14.9.2 Company Overview
14.9.3 Financial Analysis
14.9.3.1 Net Revenue, 2017-2022
14.9.3.2 R&D, 2017-2022
14.9.3.3 Regional Market Shares, 2022
14.9.4 Product Benchmarking
14.9.5 Strategic Outlook
14.10 General Electric Corporation
14.10.1 Company Snapshot
14.10.2 Company Overview
14.10.3 Financial Analysis
14.10.3.1 Net Revenue, 2017-2022
14.10.3.2 R&D, 2017-2022
14.10.3.3 Regional Market Shares, 2022
14.10.4 Product Benchmarking
14.10.5 Strategic Outlook
14.11 Air Liquide
14.11.1 Company Snapshot
14.11.2 Company Overview
14.11.3 Financial Analysis
14.11.3.1 Net Revenue, 2017-2022
14.11.3.2 Regional Market Shares, 2022
14.11.4 Product Benchmarking
14.11.5 Strategic Outlook
14.12 Sulzer Ltd
14.12.1 Company Snapshot
14.12.2 Company Overview
14.12.3 Financial Analysis
14.12.3.1 Net Revenue, 2017-2022
14.12.3.2 Regional Market Shares, 2022
14.12.4 Product Benchmarking
14.12.5 Strategic Outlook
14.13 Siemens Energy
14.13.1 Company Snapshot
14.13.2 Company Overview
14.13.3 Financial Analysis
14.13.3.1 Net Revenue, 2017-2022
14.13.3.2 R&D, 2017-2022
14.13.3.3 Regional Market Shares, 2022
14.13.4 Product Benchmarking
14.13.5 Strategic Outlook
14.14 Chevron Corporation
14.14.1 Company Snapshot
14.14.2 Company Overview
14.14.3 Financial Analysis
14.14.3.1 Net Revenue, 2017-2022
14.14.3.2 R&D, 2017-2022
14.14.4 Product Benchmarking
14.14.5 Strategic Outlook
14.15 Schlumberger Limited.
14.15.1 Company Snapshot
14.15.2 Company Overview
14.15.3 Financial Analysis
14.15.3.1 Net Revenue, 2017-2022
14.15.3.2 R&D, 2017-2022
14.15.3.3 Regional Market Shares, 2022
14.15.4 Product Benchmarking
14.15.5 Strategic Outlook
14.16 Linde AG.
14.16.1 Company Snapshot
14.16.2 Company Overview
14.16.3 Financial Analysis
14.16.3.1 Net Revenue, 2017-2022
14.16.3.2 R&D, 2017-2022
14.16.3.3 Regional Market Shares, 2022 (%)
14.16.4 Product Benchmarking
14.16.5 Strategic Outlook
14.17 NRG Energy Inc.
14.17.1 Company Snapshot
14.17.2 Company Overview
14.17.3 Financial Analysis
14.17.3.1 Net Revenue, 2017-2022
14.17.4 Product Benchmarking
14.17.5 Strategic Outlook
15 Conclusion and Recommendations
15.1 Concluding Remarks from Visiongain
15.2 Recommendation
List of Tables
Table 1 Carbon Capture & Storage (CCS) Market Snapshot, 2023 & 2033 (US$ Million, CAGR %)
Table 2 Carbon Capture & Storage (CCS) Market Forecast by Region, 2023-2033 (US$ Million, AGR%, CAGR%): “V” Shaped Recovery
Table 3 Carbon Capture & Storage (CCS) Market Forecast by Region, 2023-2033 (US$ Million, AGR%, CAGR%): “U” Shaped Recovery
Table 4 Carbon Capture & Storage (CCS) Market Forecast by Region, 2023-2033 (US$ Million, AGR%, CAGR%): “W” Shaped Recovery
Table 5 Carbon Capture & Storage (CCS) Market Forecast by Region, 2023-2033 (US$ Million, AGR%, CAGR%): “L” Shaped Recovery
Table 6 Carbon Capture & Storage (CCS) Market Forecast by Type, 2023-2033 (US$ Million, AGR%, CAGR%)
Table 7 CCS Technology Segment Market Forecast by Region, 2023-2033 (US$ Million, AGR%, CAGR%)
Table 8 CCS Services Segment Market Forecast by Region, 2023-2033 (US$ Million, AGR%, CAGR%)
Table 9 Carbon Capture & Storage (CCS) Market Forecast by Type, 2023-2033 (US$ Million, AGR%, CAGR%)
Table 10 Industrial Separation Capture Technology Segment Market Forecast by Region, 2023-2033 (US$ Million, AGR%, CAGR%)
Table 11 Inherent Separation Technology Segment Market Forecast by Region, 2023-2033 (US$ Million, AGR%, CAGR%)
Table 12 OXY-Fuel Combustion Capture Technology Segment Market Forecast by Region, 2023-2033 (US$ Million, AGR%, CAGR%)
Table 13 Post-combustion capture technology Segment Market Forecast by Region, 2023-2033 (US$ Million, AGR%, CAGR%)
Table 14 Pre-Combustion Capture Technology Segment Market Forecast by Region, 2023-2033 (US$ Million, AGR%, CAGR%)
Table 15 Other Segment Market Forecast by Region, 2023-2033 (US$ Million, AGR%, CAGR%)
Table 16 Carbon Capture & Storage (CCS) Market Forecast by Services, 2023-2033 (US$ Million, AGR%, CAGR%)
Table 17 Carbon Capture Services Segment Market Forecast by Region, 2023-2033 (US$ Million, AGR%, CAGR%)
Table 18 Carbon Storage Services Segment Market Forecast by Region, 2023-2033 (US$ Million, AGR%, CAGR%)
Table 19 Carbon Capture Transportation Services Segment Market Forecast by Region, 2023-2033 (US$ Million, AGR%, CAGR%)
Table 20 Others Segment Market Forecast by Region, 2023-2033 (US$ Million, AGR%, CAGR%)
Table 21 Carbon Capture & Storage (CCS) Market Forecast by Application, 2023-2033 (US$ Million, AGR%, CAGR%)
Table 22 Power Generation Segment Market Forecast by Region, 2023-2033 (US$ Million, AGR%, CAGR%)
Table 23 Industrial Sector Segment Market Forecast by Region, 2023-2033 (US$ Million, AGR%, CAGR%)
Table 24 Transport Sector Segment Market Forecast by Region, 2023-2033 (US$ Million, AGR%, CAGR%)
Table 25 Construction Sector Segment Market Forecast by Region, 2023-2033 (US$ Million, AGR%, CAGR%)
Table 26 Other Segment Market Forecast by Region, 2023-2033 (US$ Million, AGR%, CAGR%)
Table 27 Carbon Capture & Storage (CCS) Market Forecast by Region, 2023-2033 (US$ Million, AGR%, CAGR%)
Table 28 Carbon Capture & Storage (CCS) Market Forecast by Region, 2023-2033 (Million Tons, AGR%, CAGR%)
Table 29 North America Carbon Capture & Storage (CCS) Market Forecast by Country, 2023-2033 (US$ Million, AGR%, CAGR%)
Table 30 North America Carbon Capture & Storage (CCS) Market Forecast by Country, 2023-2033 (Million Tons, AGR%, CAGR%)
Table 31 North America Carbon Capture & Storage (CCS) Market Forecast by Type, 2023-2033 (US$ Million, AGR%, CAGR%)
Table 32 North America Carbon Capture & Storage (CCS) Market Forecast by Technology, 2023-2033 (US$ Million, AGR%, CAGR%)
Table 33 North America Carbon Capture & Storage (CCS) Market Forecast by Application, 2023-2033 (US$ Million, AGR%, CAGR%)
Table 34 North America Carbon Capture & Storage (CCS) Market Forecast by Services, 2023-2033 (US$ Million, AGR%, CAGR%)
Table 35 U.S. Carbon Capture & Storage (CCS) Market Forecast, 2023-2033 (US$ Million, AGR%, CAGR%)
Table 36 U.S. Carbon Capture & Storage (CCS) Market Forecast, 2023-2033 (Million Tons, AGR%, CAGR%)
Table 37 Canada Carbon Capture & Storage (CCS) Market Forecast, 2023-2033 (US$ Million, AGR%, CAGR%)
Table 38 Canada Carbon Capture & Storage (CCS) Market Forecast, 2023-2033 (Million Tons, AGR%, CAGR%)
Table 39 Europe Carbon Capture & Storage (CCS) Market Forecast by Country, 2023-2033 (US$ Million, AGR%, CAGR%)
Table 40 Europe Carbon Capture & Storage (CCS) Market Forecast by Country, 2023-2033 (Million Tons, AGR%, CAGR%)
Table 41 Europe Carbon Capture & Storage (CCS) Market Forecast by Type, 2023-2033 (US$ Million, AGR%, CAGR%)
Table 42 Europe Carbon Capture & Storage (CCS) Market Forecast by Technology, 2023-2033 (US$ Million, AGR%, CAGR%)
Table 43 Europe Carbon Capture & Storage (CCS) Market Forecast by Application, 2023-2033 (US$ Million, AGR%, CAGR%)
Table 44 Europe Carbon Capture & Storage (CCS) Market Forecast by Services, 2023-2033 (US$ Million, AGR%, CAGR%)
Table 45 Germany Carbon Capture & Storage (CCS) Market Forecast, 2023-2033 (US$ Million, AGR%, CAGR%)
Table 46 Germany Carbon Capture & Storage (CCS) Market Forecast, 2023-2033 (Million Tons, AGR%, CAGR%)
Table 47 UK Carbon Capture & Storage (CCS) Market Forecast, 2023-2033 (US$ Million, AGR%, CAGR%)
Table 48 UK Carbon Capture & Storage (CCS) Market Forecast, 2023-2033 (Million Tons, AGR%, CAGR%)
Table 49 France Carbon Capture & Storage (CCS) Market Forecast, 2023-2033 (US$ Million, AGR%, CAGR%)
Table 50 France Carbon Capture & Storage (CCS) Market Forecast, 2023-2033 (Million Tons, AGR%, CAGR%)
Table 51 Italy Carbon Capture & Storage (CCS) Market Forecast, 2023-2033 (US$ Million, AGR%, CAGR%)
Table 52 Italy Carbon Capture & Storage (CCS) Market Forecast, 2023-2033 (Million Tons, AGR%, CAGR%)
Table 53 Spain Carbon Capture & Storage (CCS) Market Forecast, 2023-2033 (US$ Million, AGR%, CAGR%)
Table 54 Spain Carbon Capture & Storage (CCS) Market Forecast, 2023-2033 (Million Tons, AGR%, CAGR%)
Table 55 Rest of Europe Carbon Capture & Storage (CCS) Market Forecast, 2023-2033 (US$ Million, AGR%, CAGR%)
Table 56 Rest of Europe Carbon Capture & Storage (CCS) Market Forecast, 2023-2033 (Million Tons, AGR%, CAGR%)
Table 57 Asia Pacific Carbon Capture & Storage (CCS) Market Forecast by Country, 2023-2033 (US$ Million, AGR%, CAGR%)
Table 58 Asia Pacific Carbon Capture & Storage (CCS) Market Forecast by Country, 2023-2033 (Million Tons, AGR%, CAGR%)
Table 59 Asia Pacific Carbon Capture & Storage (CCS) Market Forecast by Type, 2023-2033 (US$ Million, AGR%, CAGR%)
Table 60 Asia Pacific Carbon Capture & Storage (CCS) Market Forecast by Technology, 2023-2033 (US$ Million, AGR%, CAGR%)
Table 61 Asia Pacific Carbon Capture & Storage (CCS) Market Forecast by Application, 2023-2033 (US$ Million, AGR%, CAGR%)
Table 62 Asia Pacific Carbon Capture & Storage (CCS) Market Forecast by Services, 2023-2033 (US$ Million, AGR%, CAGR%)
Table 63 China Carbon Capture & Storage (CCS) Market Forecast, 2023-2033 (US$ Million, AGR%, CAGR%)
Table 64 China Carbon Capture & Storage (CCS) Market Forecast, 2023-2033 (Million Tons, AGR%, CAGR%)
Table 65 India Carbon Capture & Storage (CCS) Market Forecast, 2023-2033 (US$ Million, AGR%, CAGR%)
Table 66 India Carbon Capture & Storage (CCS) Market Forecast, 2023-2033 (Million Tons, AGR%, CAGR%)
Table 67 Japan Carbon Capture & Storage (CCS) Market Forecast, 2023-2033 (US$ Million, AGR%, CAGR%)
Table 68 Japan Carbon Capture & Storage (CCS) Market Forecast, 2023-2033 (Million Tons, AGR%, CAGR%)
Table 69 South Korea Carbon Capture & Storage (CCS) Market Forecast, 2023-2033 (US$ Million, AGR%, CAGR%)
Table 70 South Korea Carbon Capture & Storage (CCS) Market Forecast, 2023-2033 (Million Tons, AGR%, CAGR%)
Table 71 Australia Carbon Capture & Storage (CCS) Market Forecast, 2023-2033 (US$ Million, AGR%, CAGR%)
Table 72 Australia Carbon Capture & Storage (CCS) Market Forecast, 2023-2033 (Million Tons, AGR%, CAGR%)
Table 73 Rest of Asia Pacific Carbon Capture & Storage (CCS) Market Forecast, 2023-2033 (US$ Million, AGR%, CAGR%)
Table 74 Rest of Asia Pacific Carbon Capture & Storage (CCS) Market Forecast, 2023-2033 (Million Tons, AGR%, CAGR%)
Table 75 Latin America Carbon Capture & Storage (CCS) Market Forecast by Country, 2023-2033 (US$ Million, AGR%, CAGR%)
Table 76 Latin America Carbon Capture & Storage (CCS) Market Forecast by Country, 2023-2033 (Million Tons, AGR%, CAGR%)
Table 77 Latin America Carbon Capture & Storage (CCS) Market Forecast by Type, 2023-2033 (US$ Million, AGR%, CAGR%)
Table 78 Latin America Carbon Capture & Storage (CCS) Market Forecast by Technology, 2023-2033 (US$ Million, AGR%, CAGR%)
Table 79 Latin America Carbon Capture & Storage (CCS) Market Forecast by Application, 2023-2033 (US$ Million, AGR%, CAGR%)
Table 80 Latin America Carbon Capture & Storage (CCS) Market Forecast by Services, 2023-2033 (US$ Million, AGR%, CAGR%)
Table 81 Brazil Carbon Capture & Storage (CCS) Market Forecast, 2023-2033 (US$ Million, AGR%, CAGR%)
Table 82 Brazil Carbon Capture & Storage (CCS) Market Forecast, 2023-2033 (Million Tons, AGR%, CAGR%)
Table 83 Mexico Carbon Capture & Storage (CCS) Market Forecast, 2023-2033 (US$ Million, AGR%, CAGR%)
Table 84 Mexico Carbon Capture & Storage (CCS) Market Forecast, 2023-2033 (Million Tons, AGR%, CAGR%)
Table 85 Rest of Latin America Carbon Capture & Storage (CCS) Market Forecast, 2023-2033 (US$ Million, AGR%, CAGR%)
Table 86 Rest of Latin America Carbon Capture & Storage (CCS) Market Forecast, 2023-2033 (Million Tons, AGR%, CAGR%)
Table 87 Middle East & Africa Carbon Capture & Storage (CCS) Market Forecast by Country, 2023-2033 (US$ Million, AGR%, CAGR%)
Table 88 Middle East & Africa Carbon Capture & Storage (CCS) Market Forecast by Country, 2023-2033 (Million Tons, AGR%, CAGR%)
Table 89 Middle East & Africa Carbon Capture & Storage (CCS) Market Forecast by Type, 2023-2033 (US$ Million, AGR%, CAGR%)
Table 90 Middle East & Africa Carbon Capture & Storage (CCS) Market Forecast by Technology, 2023-2033 (US$ Million, AGR%, CAGR%)
Table 91 Middle East & Africa Carbon Capture & Storage (CCS) Market Forecast by Services, 2023-2033 (US$ Million, AGR%, CAGR%)
Table 92 Middle East & Africa Carbon Capture & Storage (CCS) Market Forecast by Application, 2023-2033 (US$ Million, AGR%, CAGR%)
Table 93 GCC Carbon Capture & Storage (CCS) Market Forecast, 2023-2033 (US$ Million, AGR%, CAGR%)
Table 94 GCC Carbon Capture & Storage (CCS) Market Forecast, 2023-2033 (Million Tons, AGR%, CAGR%)
Table 95 South Africa Carbon Capture & Storage (CCS) Market Forecast, 2023-2033 (US$ Million, AGR%, CAGR%)
Table 96 South Africa Carbon Capture & Storage (CCS) Market Forecast, 2023-2033 (Million Tons, AGR%, CAGR%)
Table 97 Rest of Middle East & Africa Carbon Capture & Storage (CCS) Market Forecast, 2023-2033 (US$ Million, AGR%, CAGR%)
Table 98 Rest of Middle East & Africa Carbon Capture & Storage (CCS) Market Forecast, 2023-2033 (Million Tons, AGR%, CAGR%)
Table 99 Strategic Outlook
List of Figures
Figure 1 Carbon Capture & Storage (CCS) Market Segmentation
Figure 2 Carbon Capture & Storage (CCS) Market by Type: Market Attractiveness Index
Figure 3 Carbon Capture & Storage (CCS) Market by Technology: Market Attractiveness Index
Figure 4 Carbon Capture & Storage (CCS) Market by Service: Market Attractiveness Index
Figure 5 Carbon Capture & Storage (CCS) Market by Application: Market Attractiveness Index
Figure 6 Carbon Capture & Storage (CCS) Market Attractiveness Index by Region
Figure 7 Carbon Capture & Storage (CCS) Market: Market Dynamics
Figure 8 Carbon Capture & Storage (CCS) Market by Region, 2023-2033 (US$ Million, AGR %): “V” Shaped Recovery
Figure 9 Carbon Capture & Storage (CCS) Market by Region, 2023-2033 (US$ Million, AGR %): “U” Shaped Recovery
Figure 10 Carbon Capture & Storage (CCS) Market by Region, 2023-2033 (US$ Million, AGR %): “W” Shaped Recovery
Figure 11 Carbon Capture & Storage (CCS) Market by Region, 2023-2033 (US$ Million, AGR %): “L” Shaped Recovery
Figure 12 SWOT Analysis
Figure 13 Carbon Capture & Storage (CCS) Market: Porter’s Five Forces Analysis
Figure 14 Carbon Capture & Storage (CCS) Market: PEST Analysis
Figure 15 Carbon Capture & Storage (CCS) Market by Type: Market Attractiveness Index
Figure 16 Carbon Capture & Storage (CCS) Market Forecast by Type, 2023-2033 (US$ Million, AGR %)
Figure 17 Carbon Capture & Storage (CCS) Market Share Forecast by Type, 2023, 2028, 2033 (%)
Figure 18 CCS Technology Segment Market Forecast by Region, 2023-2033 (US$ Million, AGR %)
Figure 19 CCS Technology Segment Market Share Forecast by Region, 2023 & 2033 (%)
Figure 20 CCS Service Segment Market Forecast by Region, 2023-2033 (US$ Million, AGR %)
Figure 21 CCS Service Segment Market Share Forecast by Region, 2023 & 2033 (%)
Figure 22 Carbon Capture & Storage (CCS) Market by Technology: Market Attractiveness Index
Figure 23 Carbon Capture & Storage (CCS) Market Forecast by Technology, 2023-2033 (US$ Million, AGR %)
Figure 24 Carbon Capture & Storage (CCS) Market Share Forecast by Technology, 2023, 2028, 2033 (%)
Figure 25 Industrial Separation Capture Segment Market Forecast by Region, 2023-2033 (US$ Million, AGR %)
Figure 26 Industrial Separation Capture Segment Market Share Forecast by Region, 2023 & 2033 (%)
Figure 27 Inherent Separation Technology Segment Market Forecast by Region, 2023-2033 (US$ Million, AGR %)
Figure 28 Inherent Separation Technology Segment Market Share Forecast by Region, 2023 & 2033 (%)
Figure 29 OXY-Fuel Combustion Capture Technology Segment Market Forecast by Region, 2023-2033 (US$ Million, AGR %)
Figure 30 OXY-Fuel Combustion Capture Technology Segment Market Share Forecast by Region, 2023 & 2033 (%)
Figure 31 Post-combustion capture technology Segment Market Forecast by Region, 2023-2033 (US$ Million, AGR %)
Figure 32 Post-combustion capture technology Segment Market Share Forecast by Region, 2023 & 2033 (%)
Figure 33 Pre-Combustion Capture Technology Segment Market Forecast by Region, 2023-2033 (US$ Million, AGR %)
Figure 34 Pre-Combustion Capture Technology Segment Market Share Forecast by Region, 2023 & 2033 (%)
Figure 35 Other Segment Market Forecast by Region, 2023-2033 (US$ Million, AGR %)
Figure 36 Other Segment Market Share Forecast by Region, 2023 & 2033 (%)
Figure 37 Carbon Capture & Storage (CCS) Market by Services: Market Attractiveness Index
Figure 38 Carbon Capture & Storage (CCS) Market Forecast by Services, 2023-2033 (US$ Million, AGR %)
Figure 39 Carbon Capture & Storage (CCS) Market Share Forecast by Services, 2023, 2028, 2033 (%)
Figure 40 Carbon Capture Services Segment Market Forecast by Region, 2023-2033 (US$ Million, AGR %)
Figure 41 Carbon Capture Services Segment Market Share Forecast by Region, 2023 & 2033 (%)
Figure 42 Carbon Storage Services Segment Market Forecast by Region, 2023-2033 (US$ Million, AGR %)
Figure 43 Carbon Storage Services Segment Market Share Forecast by Region, 2023 & 2033 (%)
Figure 44 Carbon Capture Transportation Services Segment Market Forecast by Region, 2023-2033 (US$ Million, AGR %)
Figure 45 Carbon Capture Transportation Services Segment Market Share Forecast by Region, 2023 & 2033 (%)
Figure 46 Others Segment Market Forecast by Region, 2023-2033 (US$ Million, AGR %)
Figure 47 Others Segment Market Share Forecast by Region, 2023 & 2033 (%)
Figure 48 Carbon Capture & Storage (CCS) Market by Application: Market Attractiveness Index
Figure 49 Carbon Capture & Storage (CCS) Market Forecast by Application, 2023-2033 (US$ Million, AGR %)
Figure 50 Carbon Capture & Storage (CCS) Market Share Forecast by Application, 2023, 2028, 2033 (%)
Figure 51 Power Generation Segment Market Forecast by Region, 2023-2033 (US$ Million, AGR %)
Figure 52 Power Generation Segment Market Share Forecast by Region, 2023 & 2033 (%)
Figure 53 Industrial Sector Segment Market Forecast by Region, 2023-2033 (US$ Million, AGR %)
Figure 54 Industrial Sector Segment Market Share Forecast by Region, 2023 & 2033 (%)
Figure 55 Transport Sector Segment Market Forecast by Region, 2023-2033 (US$ Million, AGR %)
Figure 56 Transport Sector Segment Market Share Forecast by Region, 2023 & 2033 (%)
Figure 57 Construction Sector Segment Market Forecast by Region, 2023-2033 (US$ Million, AGR %)
Figure 58 Construction Sector Segment Market Share Forecast by Region, 2023 & 2033 (%)
Figure 59 Other Segment Market Forecast by Region, 2023-2033 (US$ Million, AGR %)
Figure 60 Other Segment Market Share Forecast by Region, 2023 & 2033 (%)
Figure 61 Carbon Capture & Storage (CCS) Market Forecast by Region 2023 and 2033 (Revenue, CAGR%)
Figure 62 Carbon Capture & Storage (CCS) Market Share Forecast by Region 2023, 2028, 2033 (%)
Figure 63 Carbon Capture & Storage (CCS) Market by Region, 2023-2033 (US$ Million, AGR %)
Figure 64 Carbon Capture & Storage (CCS) Market by Region, 2023-2033 (Million Tons, AGR %)
Figure 65 North America Carbon Capture & Storage (CCS) Market Attractiveness Index
Figure 66 North America Carbon Capture & Storage (CCS) Market by Region, 2023, 2028 & 2033 (US$ Million)
Figure 67 North America Carbon Capture & Storage (CCS) Market Forecast by Country, 2023-2033 (US$ Million, AGR %)
Figure 68 North America Carbon Capture & Storage (CCS) Market Value Share Forecast by Country, 2023 & 2033 (%)
Figure 69 North America Carbon Capture & Storage (CCS) Market Forecast by Country, 2023-2033 (Million Tons, AGR %)
Figure 70 North America Carbon Capture & Storage (CCS) Market Volume Share Forecast by Country, 2023 & 2033 (%)
Figure 71 North America Carbon Capture & Storage (CCS) Market Forecast by Type, 2023-2033 (US$ Million, AGR %)
Figure 72 North America Carbon Capture & Storage (CCS) Market Share Forecast by Type, 2023 & 2033 (%)
Figure 73 North America Carbon Capture & Storage (CCS) Market Forecast by Technology, 2023-2033 (US$ Million, AGR %)
Figure 74 North America Carbon Capture & Storage (CCS) Market Share Forecast by Technology, 2023 & 2033 (%)
Figure 75 North America Carbon Capture & Storage (CCS) Market Forecast by Application, 2023-2033 (US$ Million, AGR %)
Figure 76 North America Carbon Capture & Storage (CCS) Market Share Forecast by Application, 2023 & 2033 (%)
Figure 77 North America Carbon Capture & Storage (CCS) Market Forecast by Services, 2023-2033 (US$ Million, AGR %)
Figure 78 North America Carbon Capture & Storage (CCS) Market Share Forecast by Services, 2023 & 2033 (%)
Figure 79 U.S. Carbon Capture & Storage (CCS) Market Forecast, 2023-2033 (US$ Million, AGR %)
Figure 80 U.S. Carbon Capture & Storage (CCS) Market Forecast, 2023-2033 (Million Tons, AGR %)
Figure 81 Canada Carbon Capture & Storage (CCS) Market Forecast, 2023-2033 (US$ Million, AGR %)
Figure 82 Canada Carbon Capture & Storage (CCS) Market Forecast, 2023-2033 (Million Tons, AGR %)
Figure 83 Europe Carbon Capture & Storage (CCS) Market Attractiveness Index
Figure 84 Europe Carbon Capture & Storage (CCS) Market by Country, 2023, 2028 & 2033 (US$ Million)
Figure 85 Europe Carbon Capture & Storage (CCS) Market Forecast by Country, 2023-2033 (US$ Million, AGR %)
Figure 86 Europe Carbon Capture & Storage (CCS) Market Value Share Forecast by Country, 2023 & 2033 (%)
Figure 87 Europe Carbon Capture & Storage (CCS) Market Forecast by Country, 2023-2033 (Million Tons, AGR %)
Figure 88 Europe Carbon Capture & Storage (CCS) Market Volume Share Forecast by Country, 2023 & 2033 (%)
Figure 89 Europe Carbon Capture & Storage (CCS) Market Forecast by Type, 2023-2033 (US$ Million, AGR %)
Figure 90 Europe Carbon Capture & Storage (CCS) Market Share Forecast by Type, 2023 & 2033 (%)
Figure 91 Europe Carbon Capture & Storage (CCS) Market Forecast by Technology, 2023-2033 (US$ Million, AGR %)
Figure 92 Europe Carbon Capture & Storage (CCS) Market Share Forecast by Technology, 2023 & 2033 (%)
Figure 93 Europe Carbon Capture & Storage (CCS) Market Forecast by Application, 2023-2033 (US$ Million, AGR %)
Figure 94 Europe Carbon Capture & Storage (CCS) Market Share Forecast by Application, 2023 & 2033 (%)
Figure 95 Europe Carbon Capture & Storage (CCS) Market Forecast by Services, 2023-2033 (US$ Million, AGR %)
Figure 96 Europe Carbon Capture & Storage (CCS) Market Share Forecast by Services, 2023 & 2033 (%)
Figure 97 Germany Carbon Capture & Storage (CCS) Market Forecast, 2023-2033 (US$ Million, AGR %)
Figure 98 Germany Carbon Capture & Storage (CCS) Market Forecast, 2023-2033 (Million Tons, AGR %)
Figure 99 UK Carbon Capture & Storage (CCS) Market Forecast, 2023-2033 (US$ Million, AGR %)
Figure 100 UK Carbon Capture & Storage (CCS) Market Forecast, 2023-2033 (Million Tons, AGR %)
Figure 101 France Carbon Capture & Storage (CCS) Market Forecast, 2023-2033 (US$ Million, AGR %)
Figure 102 France Carbon Capture & Storage (CCS) Market Forecast, 2023-2033 (Million Tons, AGR %)
Figure 103 Italy Carbon Capture & Storage (CCS) Market Forecast, 2023-2033 (US$ Million, AGR %)
Figure 104 Italy Carbon Capture & Storage (CCS) Market Forecast, 2023-2033 (Million Tons, AGR %)
Figure 105 Spain Carbon Capture & Storage (CCS) Market Forecast, 2023-2033 (US$ Million, AGR %)
Figure 106 Spain Carbon Capture & Storage (CCS) Market Forecast, 2023-2033 (Million Tons, AGR %)
Figure 107 Rest of Europe Carbon Capture & Storage (CCS) Market Forecast, 2023-2033 (US$ Million, AGR %)
Figure 108 Rest of Europe Carbon Capture & Storage (CCS) Market Forecast, 2023-2033 (Million Tons, AGR %)
Figure 109 Asia Pacific Carbon Capture & Storage (CCS) Market Attractiveness Index
Figure 110 Asia Pacific Carbon Capture & Storage (CCS) Market by Region, 2023, 2028 & 2033 (US$ Million)
Figure 111 Asia Pacific Carbon Capture & Storage (CCS) Market Forecast by Country, 2023-2033 (US$ Million, AGR %)
Figure 112 Asia Pacific Carbon Capture & Storage (CCS) Market Value Share Forecast by Country, 2023 & 2033 (%)
Figure 113 Asia Pacific Carbon Capture & Storage (CCS) Market Forecast by Country, 2023-2033 (Million Tons, AGR %)
Figure 114 Asia Pacific Carbon Capture & Storage (CCS) Market Volume Share Forecast by Country, 2023 & 2033 (%)
Figure 115 Asia Pacific Carbon Capture & Storage (CCS) Market Forecast by Type, 2023-2033 (US$ Million, AGR %)
Figure 116 Asia Pacific Carbon Capture & Storage (CCS) Market Share Forecast by Type, 2023 & 2033 (%)
Figure 117 Asia Pacific Carbon Capture & Storage (CCS) Market Forecast by Technology, 2023-2033 (US$ Million, AGR %)
Figure 118 Asia Pacific Carbon Capture & Storage (CCS) Market Share Forecast by Technology, 2023 & 2033 (%)
Figure 119 Asia Pacific Carbon Capture & Storage (CCS) Market Forecast by Application, 2023-2033 (US$ Million, AGR %)
Figure 120 Asia Pacific Carbon Capture & Storage (CCS) Market Share Forecast by Application, 2023 & 2033 (%)
Figure 121 Asia Pacific Carbon Capture & Storage (CCS) Market Forecast by Services, 2023-2033 (US$ Million, AGR %)
Figure 122 Asia Pacific Carbon Capture & Storage (CCS) Market Share Forecast by Services, 2023 & 2033 (%)
Figure 123 China Carbon Capture & Storage (CCS) Market Forecast, 2023-2033 (US$ Million, AGR %)
Figure 124 China Carbon Capture & Storage (CCS) Market Forecast, 2023-2033 (Million Tons, AGR %)
Figure 125 India Carbon Capture & Storage (CCS) Market Forecast, 2023-2033 (US$ Million, AGR %)
Figure 126 India Carbon Capture & Storage (CCS) Market Forecast, 2023-2033 (Million Tons, AGR %)
Figure 127 Japan Carbon Capture & Storage (CCS) Market Forecast, 2023-2033 (US$ Million, AGR %)
Figure 128 Japan Carbon Capture & Storage (CCS) Market Forecast, 2023-2033 (Million Tons, AGR %)
Figure 129 South Korea Carbon Capture & Storage (CCS) Market Forecast, 2023-2033 (US$ Million, AGR %)
Figure 130 South Korea Carbon Capture & Storage (CCS) Market Forecast, 2023-2033 (Million Tons, AGR %)
Figure 131 Australia Carbon Capture & Storage (CCS) Market Forecast, 2023-2033 (US$ Million, AGR %)
Figure 132 Australia Carbon Capture & Storage (CCS) Market Forecast, 2023-2033 (Million Tons, AGR %)
Figure 133 Rest of Asia Pacific Carbon Capture & Storage (CCS) Market Forecast, 2023-2033 (US$ Million, AGR %)
Figure 134 Australia Carbon Capture & Storage (CCS) Market Forecast, 2023-2033 (Million Tons, AGR %)
Figure 135 Latin America Carbon Capture & Storage (CCS) Market Attractiveness Index
Figure 136 Latin America Carbon Capture & Storage (CCS) Market by Region, 2023, 2028 & 2033 (US$ Million)
Figure 137 Latin America Carbon Capture & Storage (CCS) Market Forecast by Country, 2023-2033 (US$ Million, AGR %)
Figure 138 Latin America Carbon Capture & Storage (CCS) Market Value Share Forecast by Country, 2023 & 2033 (%)
Figure 139 Latin America Carbon Capture & Storage (CCS) Market Forecast by Country, 2023-2033 (Million Tons, AGR %)
Figure 140 Latin America Carbon Capture & Storage (CCS) Market Volume Share Forecast by Country, 2023 & 2033 (%)
Figure 141 Latin America Carbon Capture & Storage (CCS) Market Forecast by Type, 2023-2033 (US$ Million, AGR %)
Figure 142 Latin America Carbon Capture & Storage (CCS) Market Share Forecast by Type, 2023 & 2033 (%)
Figure 143 Latin America Carbon Capture & Storage (CCS) Market Forecast by Technology, 2023-2033 (US$ Million, AGR %)
Figure 144 Latin America Carbon Capture & Storage (CCS) Market Share Forecast by Technology, 2023 & 2033 (%)
Figure 145 Latin America Carbon Capture & Storage (CCS) Market Forecast by Application, 2023-2033 (US$ Million, AGR %)
Figure 146 Latin America Carbon Capture & Storage (CCS) Market Share Forecast by Application, 2023 & 2033 (%)
Figure 147 Latin America Carbon Capture & Storage (CCS) Market Forecast by Services, 2023-2033 (US$ Million, AGR %)
Figure 148 Latin America Carbon Capture & Storage (CCS) Market Share Forecast by Services, 2023 & 2033 (%)
Figure 149 Brazil Carbon Capture & Storage (CCS) Market Forecast, 2023-2033 (US$ Million, AGR %)
Figure 150 Brazil Carbon Capture & Storage (CCS) Market Forecast, 2023-2033 (Million Tons, AGR %)
Figure 151 Mexico Carbon Capture & Storage (CCS) Market Forecast, 2023-2033 (US$ Million, AGR %)
Figure 152 Mexico Carbon Capture & Storage (CCS) Market Forecast, 2023-2033 (Million Tons, AGR %)
Figure 153 Rest of Latin America Carbon Capture & Storage (CCS) Market Forecast, 2023-2033 (US$ Million, AGR %)
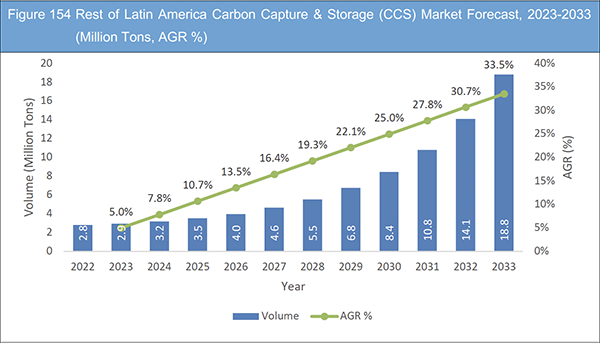
Figure 154 Rest of Latin America Carbon Capture & Storage (CCS) Market Forecast, 2023-2033 (Million Tons, AGR %)
Figure 155 Middle East & Africa Carbon Capture & Storage (CCS) Market Attractiveness Index
Figure 156 Middle East & Africa Carbon Capture & Storage (CCS) Market by Region, 2023, 2028 & 2033 (US$ Million)
Figure 157 Middle East & Africa Carbon Capture & Storage (CCS) Market Forecast by Country, 2023-2033 (US$ Million, AGR %)
Figure 158 Middle East & Africa Carbon Capture & Storage (CCS) Market Value Share Forecast by Country, 2023 & 2033 (%)
Figure 159 Middle East & Africa Carbon Capture & Storage (CCS) Market Forecast by Country, 2023-2033 (Million Tons, AGR %)
Figure 160 Middle East & Africa Carbon Capture & Storage (CCS) Market Volume Share Forecast by Country, 2023 & 2033 (%)
Figure 161 Middle East & Africa Carbon Capture & Storage (CCS) Market Forecast by Type, 2023-2033 (US$ Million, AGR %)
Figure 162 Middle East & Africa Carbon Capture & Storage (CCS) Market Share Forecast by Type, 2023 & 2033 (%)
Figure 163 Middle East & Africa Carbon Capture & Storage (CCS) Market Forecast by Technology, 2023-2033 (US$ Million, AGR %)
Figure 164 Middle East & Africa Carbon Capture & Storage (CCS) Market Share Forecast by Technology, 2023 & 2033 (%)
Figure 165 Middle East & Africa Carbon Capture & Storage (CCS) Market Forecast by Services, 2023-2033 (US$ Million, AGR %)
Figure 166 Middle East & Africa Carbon Capture & Storage (CCS) Market Share Forecast by Services, 2023 & 2033 (%)
Figure 167 Middle East & Africa Carbon Capture & Storage (CCS) Market Forecast by Application, 2023-2033 (US$ Million, AGR %)
Figure 168 Middle East & Africa Carbon Capture & Storage (CCS) Market Share Forecast by Application, 2023 & 2033 (%)
Figure 169 GCC Carbon Capture & Storage (CCS) Market Forecast, 2023-2033 (US$ Million, AGR %)
Figure 170 GCC Carbon Capture & Storage (CCS) Market Forecast, 2023-2033 (Million Tons, AGR %)
Figure 171 South Africa Carbon Capture & Storage (CCS) Market Forecast, 2023-2033 (US$ Million, AGR %)
Figure 172 South Africa Carbon Capture & Storage (CCS) Market Forecast, 2023-2033 (Million Tons, AGR %)
Figure 173 Rest of Middle East & Africa Carbon Capture & Storage (CCS) Market Forecast, 2023-2033 (US$ Million, AGR %)
Figure 174 Rest of Middle East & Africa Carbon Capture & Storage (CCS) Market Forecast, 2023-2033 (Million Tons, AGR %)
Figure 175 Carbon Capture & Storage (CCS) Market: Company Share, 2023 (%)
List of Companies Profiled in the Report
Air Liquide
Aker Solutions
Baker Hughes Company
Chevron Corporation
Exxon Mobil Corporation
General Electric Corporation
Halliburton Company
Linde AG.
Mitsubishi Heavy Industries, Ltd.
NRG Energy Inc.
Occidental Petroleum Corporation
Schlumberger Limited.
Shell
Siemens Energy
Sulzer Ltd
List of Other Companies Mentioned in the Report
BP plc.
Clean Energy Systems
CryocapTM carbon capture innovative technology
Global E&C Solutions
Halliburton Company
Heidelberg
Holcim
Horisont Energi AS
ITOCHU Corporation
Jera Co., Inc.
Kiewit
LafargeHolcim
Microsoft Clean Energy Systems
Northern Lights JV DA
Oxy Low Carbon Ventures (OLCV)
Pertamina
Saudi Aramco
Sinopec
SLB
Sogestran
Svante
Technip Energies
The Kansai Electric Power Co., Inc.
Western Midstream
List of Associations Mentioned in the Report
Asian Carbon Capture and Storage Network (ACCSN)
Brazilian Carbon Sequestration Association (ABCS)
Business, Energy, and Industrial Strategy (BEIS)
Carbon Capture and Storage Technology Development Association (CCSTDA)
Carbon Sequestration Leadership Forum
EPA Research and Assessment
European Space Agency
European Union (EU)
Geographical Information Systems (GIS)
Global Carbon capture and storage (CCS) Institute
Intergovernmental Panel on Climate Change (IPCC)
International CCS Knowledge Centre
International Energy Agency (IEA)
NETL Carbon Capture Program
National Carbon Capture Centre
New Energy and Industrial Technology Development Organization (NEDO)
South African National Energy Development Association
Spanish Research Council (CSIC)
The Carbon Capture & Storage Association (CCSA)
United Nations Intergovernmental Panel on Climate Change (IPCC)
U.S. Environmental Protection Agency (EPA) - Climate Change Science
 Market Report 2023-2033")