The Coal Gasification Market Report 2023-2033: This report will prove invaluable to leading firms striving for new revenue pockets if they wish to better understand the industry and its underlying dynamics. It will be useful for companies that would like to expand into different industries or to expand their existing operations in a new region.
The Growing Global Demand for Energy Is a Significant Driving Factor for the Coal Gasification Market
he growing global demand for energy is a significant driving factor for the coal gasification market. As countries seek to meet their energy needs, coal gasification offers a reliable and efficient method for converting coal into clean-burning syngas. Rapid industrialization in emerging economies like China and India has led to a surge in energy consumption. Coal gasification provides an opportunity to utilize abundant coal reserves to meet the rising energy demand.
Stricter Environmental Regulations and the Need to Reduce Greenhouse Gas Emissions
Stricter environmental regulations and the need to reduce greenhouse gas emissions are driving the adoption of cleaner energy sources. Coal gasification helps mitigate environmental concerns by enabling the capture and utilization of carbon dioxide (CO2) emissions. Countries like the United States and China have implemented regulations to curb emissions. Coal gasification technologies such as carbon capture and storage (CCS) or carbon capture, utilization, and storage (CCUS) can capture CO2 and reduce its impact on the environment.
What Questions Should You Ask before Buying a Market Research Report?
• How is the coal gasification market evolving?
• What is driving and restraining the coal gasification market?
• How will each coal gasification submarket segment grow over the forecast period and how much revenue will these submarkets account for in 2033?
• How will the market shares for each coal gasification submarket develop from 2023 to 2033?
• What will be the main driver for the overall market from 2023 to 2033?
• Will leading coal gasification markets broadly follow the macroeconomic dynamics, or will individual national markets outperform others?
• How will the market shares of the national markets change by 2033 and which geographical region will lead the market in 2033?
• Who are the leading players and what are their prospects over the forecast period?
• What are the coal gasification projects for these leading companies?
• How will the industry evolve during the period between 2023 and 2033? What are the implications of coal gasification projects taking place now and over the next 10 years?
• Is there a greater need for product commercialisation to further scale the coal gasification market?
• Where is the coal gasification market heading and how can you ensure you are at the forefront of the market?
• What are the best investment options for new product and service lines?
• What are the key prospects for moving companies into a new growth path and C-suite?
You need to discover how this will impact the coal gasification market today, and over the next 10 years:
• Our 333-page report provides 119 tables and 191 charts/graphs exclusively to you.
• The report highlights key lucrative areas in the industry so you can target them – NOW.
• It contains in-depth analysis of global, regional and national sales and growth.
• It highlights for you the key successful trends, changes and revenue projections made by your competitors.
This report tells you TODAY how the coal gasification market will develop in the next 10 years, and in line with the variations in COVID-19 economic recession and bounce. This market is more critical now than at any point over the last 10 years.
Forecasts to 2033 and other analyses reveal commercial prospects
• In addition to revenue forecasting to 2033, our new study provides you with recent results, growth rates, and market shares.
• You will find original analyses, with business outlooks and developments.
• Discover qualitative analyses (including market dynamics, drivers, opportunities, restraints and challenges), cost structure, impact of rising coal gasification prices and recent developments.
This report includes data analysis and invaluable insight into how COVID-19 will affect the industry and your company. Four COVID-19 recovery patterns and their impact, namely, “V”, “L”, “W” and “U” are discussed in this report.
Segments Covered in the Report
Market Segment by Gasifier Type
• Moving Bed Gasifier
• Fluidized Bed Gasifier
• Entrained Flow Gasifier
Market Segment by End-User
• Chemicals
• Power Generation
• Liquid Fuels
• Other End-User
Market Segment by Feedstock
• Bituminous Coal
• Sub-bituminous Coal
• Petroleum Coke
• Biomass
• Other Feedstock
Market Segment by Technology
• Integrated Gasification Combined Cycle (IGCC)
• Chemical Looping Gasification (CLG)
• Hydrogen from Coal Process (HyCO)
• Coal-to-Liquids (CTL)
• Polygeneration
• Other Technologies

In addition to the revenue predictions for the overall world market and segments, you will also find revenue forecasts for four regional and 20 leading national markets:
North America
• U.S.
• Canada
Europe
• Germany
• Russia
• United Kingdom
• France
• Italy
• Rest of Europe
Asia Pacific
• China
• Japan
• India
• Australia
• South Korea
• Rest of Asia Pacific
Latin America
• Brazil
• Mexico
• Rest of Latin America
Middle East & Africa
• GCC
• South Africa
• Rest of Middle East & Africa
Need industry data? Please contact us today.
The report also includes profiles and for some of the leading companies in the Coal Gasification Market, 2023 to 2033, with a focus on this segment of these companies’ operations.
Leading companies and the potential for market growth
• Air Liquide
• CTCI Corporation
• Foster Wheeler AG
• General Electric Company
• KBR, Inc.
• Linc Energy Ltd.
• Linde plc
• Mitsubishi Heavy Industries Ltd
• Royal Dutch Shell Plc.
• Sasol Limited
• Sedin Engineering Co Ltd
• Shanxi Lu’an Mining Group Co., Ltd.
• Siemens AG
• Wison Group
• Xinwen Mining Group Co. Ltd
Overall world revenue for Coal Gasification Market, 2023 to 2033 in terms of value the market will surpass US$11.08 billion in 2023, our work calculates. We predict strong revenue growth through to 2033. Our work identifies which organisations hold the greatest potential. Discover their capabilities, progress, and commercial prospects, helping you stay ahead.
How will the Coal Gasification Market, 2023 to 2033 report help you?
In summary, our 330+ page report provides you with the following knowledge:
• Revenue forecasts to 2033 for Coal Gasification Market, 2023 to 2033 Market, with forecasts for gasifier type, end-user, feedstock, and technology, each forecast at a global and regional level – discover the industry’s prospects, finding the most lucrative places for investments and revenues.
• Revenue forecasts to 2033 for four regional and 20 key national markets – See forecasts for the Coal Gasification Market, 2023 to 2033 market in North America, Europe, Asia-Pacific, Latin America and Middle East & Africa. Also forecasted is the market in the US, Canada, Brazil, Germany, France, UK, Italy, China, India, Japan, and Australia among other prominent economies.
• Prospects for established firms and those seeking to enter the market – including company profiles for 15 of the major companies involved in the Coal Gasification Market, 2023 to 2033.
Find quantitative and qualitative analyses with independent predictions. Receive information that only our report contains, staying informed with invaluable business intelligence.
Information found nowhere else
With our new report, you are less likely to fall behind in knowledge or miss out on opportunities. See how our work could benefit your research, analyses, and decisions. Visiongain’s study is for everybody needing commercial analyses for the Coal Gasification Market, 2023 to 2033, market-leading companies. You will find data, trends and predictions.
To access the data contained in this document please email contactus@visiongain.com
Buy our report today Coal Gasification Market Report 2023-2033: Forecasts by Gasifier Type (Moving Bed Gasifier, Fluidised Bed Gasifier, Entrained Flow Gasifier), by End-user (Chemicals, Power Generation, Liquid Fuels, Other), by Feedstock (Bituminous Coal, Sub-bituminous Coal, Petroleum Coke, Biomass, Other), by Technology (Integrated Gasification Combined Cycle (IGCC), Chemical Looping Gasification (CLG), Hydrogen from Coal Process (HyCO), Coal-to-Liquids (CTL), Polygeneration, Other) AND Regional and Leading National Market Analysis PLUS Analysis of Leading Companies AND COVID-19 Impact and Recovery Pattern Analysis. Avoid missing out by staying informed – order our report now.
Visiongain is a trading partner with the US Federal Government
CCR Ref number: KD4R6
Do you have any custom requirements we can help you with? Any need for a specific country, geo region, market segment or specific company information? Contact us today, we can discuss your needs and see how we can help: contactus@visiongain.com
1 Report Overview
1.1 Objectives of the Study
1.2 Introduction to Coal Gasification Market
1.3 What This Report Delivers
1.4 Why You Should Read This Report
1.5 Key Questions Answered by This Analytical Report
1.6 Who Is This Report for?
1.7 Methodology
1.7.1 Market Definitions
1.7.2 Market Evaluation & Forecasting Methodology
1.7.3 Data Validation
1.7.3.1 Primary Research
1.7.3.2 Secondary Research
1.8 Frequently Asked Questions (FAQs)
1.9 Associated Visiongain Reports
1.10 About Visiongain
2 Executive Summary
3 Market Overview
3.1 Key Findings
3.2 Market Dynamics
3.2.1 Market Driving Factors
3.2.1.1 High Demand for Clean Energy to Foster Gasification Market Growth
3.2.1.2 Expansion of the Coal Industry to Boost Growth
3.2.1.3 The Escalated Use of USG and the Flexibility of Feedstock Driving the Market Growth
3.2.2 Market Restraining Factors
3.2.2.1 High Installation Cost to Hinder Market Growth
3.2.2.2 The Negative Impact of Underground Drilling Activities of Coal Gasification on the Environment
3.2.2.3 A Strong Call for Oil from the Petrochemical Sector Is Predicted to Hamper the Expansion of Global Coal Gasification Market
3.2.3 Market Opportunities
3.2.3.1 The Utilization of Coal Gasification to Produce Hydrogen Gas Presents Promising Opportunities for the Coal Gasification Market
3.2.3.2 Retrofitting Existing Coal-Fired Power Plants with Gasification Technology Offers an Opportunity
3.2.3.3 Market Players Can Tap into the Growing Energy Demands of Emerging Economies by Establishing Coal Gasification Projects
3.3 Porter’s Five Forces Analysis
3.3.1 Bargaining Power of Suppliers (Low to Medium)
3.3.2 Bargaining Power of Buyers (Moderate to High)
3.3.3 Competitive Rivalry (Moderate to High)
3.3.4 Threat from Substitutes (High)
3.3.5 Threat of New Entrants (Low)
3.4 COVID-19 Impact Analysis
3.5 PEST Analysis
4 Coal Gasification Market Analysis by Gasifier Type
4.1 Key Findings
4.2 Gasifier Type Segment: Market Attractiveness Index
4.3 Coal Gasification Market Size Estimation and Forecast by Gasifier Type
4.4 Moving Bed Gasifier
4.4.1 Market Size by Region, 2023-2033 (US$ Billion)
4.4.2 Market Share by Region, 2023 & 2033 (%)
4.5 Fluidized Bed Gasifier
4.5.1 Market Size by Region, 2023-2033 (US$ Billion)
4.5.2 Market Share by Region, 2023 & 2033 (%)
4.6 Entrained Flow Gasifier
4.6.1 Market Size by Region, 2023-2033 (US$ Billion)
4.6.2 Market Share by Region, 2023 & 2033 (%)
5 Coal Gasification Market Analysis by End-User
5.1 Key Findings
5.2 End-User Segment: Market Attractiveness Index
5.3 Coal Gasification Market Size Estimation and Forecast by End-User
5.4 Chemicals
5.4.1 Market Size by Region, 2023-2033 (US$ Billion)
5.4.2 Market Share by Region, 2023 & 2033 (%)
5.5 Power Generation
5.5.1 Market Size by Region, 2023-2033 (US$ Billion)
5.5.2 Market Share by Region, 2023 & 2033 (%)
5.6 Liquid Fuels
5.6.1 Market Size by Region, 2023-2033 (US$ Billion)
5.6.2 Market Share by Region, 2023 & 2033 (%)
5.7 Other End-User
5.7.1 Market Size by Region, 2023-2033 (US$ Billion)
5.7.2 Market Share by Region, 2023 & 2033 (%)
6 Coal Gasification Market Analysis by Feedstock
6.1 Key Findings
6.2 Feedstock Segment: Market Attractiveness Index
6.3 Coal Gasification Market Size Estimation and Forecast by Feedstock
6.4 Bituminous Coal
6.4.1 Market Size by Region, 2023-2033 (US$ Billion)
6.4.2 Market Share by Region, 2023 & 2033 (%)
6.5 Sub-bituminous Coal
6.5.1 Market Size by Region, 2023-2033 (US$ Billion)
6.5.2 Market Share by Region, 2023 & 2033 (%)
6.6 Petroleum Coke
6.6.1 Market Size by Region, 2023-2033 (US$ Billion)
6.6.2 Market Share by Region, 2023 & 2033 (%)
6.7 Biomass
6.7.1 Market Size by Region, 2023-2033 (US$ Billion)
6.7.2 Market Share by Region, 2023 & 2033 (%)
6.8 Other Feedstock
6.8.1 Market Size by Region, 2023-2033 (US$ Billion)
6.8.2 Market Share by Region, 2023 & 2033 (%)
7 Coal Gasification Market Analysis by Technology
7.1 Key Findings
7.2 Technology Segment: Market Attractiveness Index
7.3 Coal Gasification Market Size Estimation and Forecast by Technology
7.4 Integrated Gasification Combined Cycle (IGCC)
7.4.1 Market Size by Region, 2023-2033 (US$ Billion)
7.4.2 Market Share by Region, 2023 & 2033 (%)
7.5 Chemical Looping Gasification (CLG)
7.5.1 Market Size by Region, 2023-2033 (US$ Billion)
7.5.2 Market Share by Region, 2023 & 2033 (%)
7.6 Hydrogen from Coal Process (HyCO)
7.6.1 Market Size by Region, 2023-2033 (US$ Billion)
7.6.2 Market Share by Region, 2023 & 2033 (%)
7.7 Coal-to-Liquids (CTL)
7.7.1 Market Size by Region, 2023-2033 (US$ Billion)
7.7.2 Market Share by Region, 2023 & 2033 (%)
7.8 Polygeneration
7.8.1 Market Size by Region, 2023-2033 (US$ Billion)
7.8.2 Market Share by Region, 2023 & 2033 (%)
7.9 Other Technologies
7.9.1 Market Size by Region, 2023-2033 (US$ Billion)
7.9.2 Market Share by Region, 2023 & 2033 (%)
8 Coal Gasification Market Analysis by Region
8.1 Key Findings
8.2 Regional Market Size Estimation and Forecast
9 North America Coal Gasification Market Analysis
9.1 Key Findings
9.2 North America Coal Gasification Market Attractiveness Index
9.3 North America Coal Gasification Market by Country, 2023, 2028 & 2033 (US$ Billion)
9.4 North America Coal Gasification Market Size Estimation and Forecast
9.5 North America Coal Gasification Market Size Estimation and Forecast by Country
9.6 North America Coal Gasification Market Size Estimation and Forecast by Gasifier Type
9.7 North America Coal Gasification Market Size Estimation and Forecast by End-User
9.8 North America Coal Gasification Market Size Estimation and Forecast by Feedstock
9.9 North America Coal Gasification Market Size Estimation and Forecast by Technology
9.10 U.S. Coal Gasification Market Analysis
9.11 Canada Coal Gasification Market Analysis
10 Europe Coal Gasification Market Analysis
10.1 Key Findings
10.2 Europe Coal Gasification Market Attractiveness Index
10.3 Europe Coal Gasification Market by Country, 2023, 2028 & 2033 (US$ Billion)
10.4 Europe Coal Gasification Market Size Estimation and Forecast
10.5 Europe Coal Gasification Market Size Estimation and Forecast by Country
10.6 Europe Coal Gasification Market Size Estimation and Forecast by Gasifier Type
10.7 Europe Coal Gasification Market Size Estimation and Forecast by End-User
10.8 Europe Coal Gasification Market Size Estimation and Forecast by Feedstock
10.9 Europe Coal Gasification Market Size Estimation and Forecast by Technology
10.10 Germany Coal Gasification Market Analysis
10.11 UK Coal Gasification Market Analysis
10.12 France Coal Gasification Market Analysis
10.13 Italy Coal Gasification Market Analysis
10.14 Russia Coal Gasification Market Analysis
10.15 Rest of Europe Coal Gasification Market Analysis
11 Asia-Pacific Coal Gasification Market Analysis
11.1 Key Findings
11.2 Asia-Pacific Coal Gasification Market Attractiveness Index
11.3 Asia-Pacific Coal Gasification Market by Country, 2023, 2028 & 2033 (US$ Billion)
11.4 Asia-Pacific Coal Gasification Market Size Estimation and Forecast
11.5 Asia-Pacific Coal Gasification Market Size Estimation and Forecast by Country
11.6 Asia-Pacific Coal Gasification Market Size Estimation and Forecast by Gasifier Type
11.7 Asia-Pacific Coal Gasification Market Size Estimation and Forecast by End-User
11.8 Asia-Pacific Coal Gasification Market Size Estimation and Forecast by Feedstock
11.9 Asia-Pacific Coal Gasification Market Size Estimation and Forecast by Technology
11.10 China Coal Gasification Market Analysis
11.11 India Coal Gasification Market Analysis
11.12 Japan Coal Gasification Market Analysis
11.13 South Korea Coal Gasification Market Analysis
11.14 Australia Coal Gasification Market Analysis
11.15 Rest of Asia-Pacific Coal Gasification Market Analysis
12 Middle East and Africa Coal Gasification Market Analysis
12.1 Key Findings
12.2 Middle East and Africa Coal Gasification Market Attractiveness Index
12.3 Middle East and Africa Coal Gasification Market by Country, 2023, 2028 & 2033 (US$ Billion)
12.4 Middle East and Africa Coal Gasification Market Size Estimation and Forecast
12.5 Middle East and Africa Coal Gasification Market Size Estimation and Forecast by Country
12.6 Middle East and Africa Coal Gasification Market Size Estimation and Forecast by Gasifier Type
12.7 Middle East and Africa Coal Gasification Market Size Estimation and Forecast by End-User
12.8 Middle East and Africa Coal Gasification Market Size Estimation and Forecast by Feedstock
12.9 Middle East and Africa Coal Gasification Market Size Estimation and Forecast by Technology
12.10 GCC Coal Gasification Market Analysis
12.11 South Africa Coal Gasification Market Analysis
12.12 Rest of Middle East & Africa Coal Gasification Market Analysis
13 Latin America Coal Gasification Market Analysis
13.1 Key Findings
13.2 Latin America Coal Gasification Market Attractiveness Index
13.3 Latin America Coal Gasification Market by Country, 2023, 2028 & 2033 (US$ Billion)
13.4 Latin America Coal Gasification Market Size Estimation and Forecast
13.5 Latin America Coal Gasification Market Size Estimation and Forecast by Country
13.6 Latin America Coal Gasification Market Size Estimation and Forecast by Gasifier Type
13.7 Latin America Coal Gasification Market Size Estimation and Forecast by End-User
13.8 Latin America Coal Gasification Market Size Estimation and Forecast by Feedstock
13.9 Latin America Coal Gasification Market Size Estimation and Forecast by Technology
13.10 Brazil Coal Gasification Market Analysis
13.11 Mexico Coal Gasification Market Analysis
13.12 Rest of Latin America Coal Gasification Market Analysis
14 Company Profiles
14.1 Competitive Landscape, 2022
14.2 Strategic Outlook
14.3 General Electric Company
14.3.1 Company Snapshot
14.3.2 Company Overview
14.3.3 Financial Analysis
14.3.3.1 Net Revenue, 2018-2022
14.3.3.2 R&D, 2018-2022
14.3.3.3 Regional Revenue Shares, 2022 (%)
14.3.3.4 Business Segment Revenue Shares, 2022 (%)
14.3.4 Product Benchmarking
14.4 Air Liquide
14.4.1 Company Snapshot
14.4.2 Company Overview
14.4.3 Financial Analysis
14.4.3.1 Net Revenue, 2018-2022
14.4.3.2 R&D, 2018-2022
14.4.3.3 Regional Revenue Shares, 2022 (%)
14.4.3.4 Business Segment Revenue Shares, 2022 (%)
14.4.4 Product Benchmarking
14.4.5 Strategic Outlook
14.5 Mitsubishi Heavy Industries Ltd
14.5.1 Company Snapshot
14.5.2 Company Overview
14.5.3 Financial Analysis
14.5.3.1 Net Revenue, 2018-2022
14.5.3.2 R&D, 2018-2022
14.5.3.3 Regional Revenue Shares, 2022 (%)
14.5.3.4 Business Segment Revenue Shares, 2022 (%)
14.5.4 Product Benchmarking
14.5.5 Strategic Outlook
14.6 Royal Dutch Shell Plc.
14.6.1 Company Snapshot
14.6.2 Company Overview
14.6.3 Financial Analysis
14.6.3.1 Net Revenue, 2018-2022
14.6.3.2 R&D, 2018-2022
14.6.3.3 Regional Revenue Shares, 2022 (%)
14.6.3.4 Business Segment Revenue Shares, 2022 (%)
14.6.4 Product Benchmarking
14.6.5 Strategic Outlook
14.7 Siemens AG
14.7.1 Company Snapshot
14.7.2 Company Overview
14.7.3 Financial Analysis
14.7.3.1 Net Revenue, 2018-2022
14.7.3.2 R&D, 2018-2022
14.7.3.3 Regional Revenue Shares, 2022 (%)
14.7.3.4 Business Segment Revenue Shares, 2022 (%)
14.7.4 Product Benchmarking
14.7.5 Strategic Outlook
14.8 Linde plc
14.8.1 Company Snapshot
14.8.2 Company Overview
14.8.3 Financial Analysis
14.8.3.1 Net Revenue, 2018-2022
14.8.3.2 R&D, 2018-2022
14.8.3.3 Regional Revenue Shares, 2022 (%)
14.8.3.4 Business Segment Revenue Shares, 2022 (%)
14.8.4 Product Benchmarking
14.8.5 Strategic Outlook
14.9 KBR, Inc.
14.9.1 Company Snapshot
14.9.2 Company Overview
14.9.3 Financial Analysis
14.9.3.1 Net Revenue, 2018-2022
14.9.3.2 Regional Revenue Shares, 2021 (%)
14.9.3.3 Business Segment Revenue Shares, 2021 (%)
14.9.4 Product Benchmarking
14.10 Sasol Limited
14.10.1 Company Snapshot
14.10.2 Company Overview
14.10.3 Financial Analysis
14.10.3.1 Net Revenue, 2018-2022
14.10.3.2 R&D, 2018-2022
14.10.3.3 Regional Revenue Shares, 2022 (%)
14.10.3.4 Business Segment Revenue Shares, 2022 (%)
14.10.4 Product Benchmarking
14.11 Xinwen Mining Group Co. Ltd
14.11.1 Company Snapshot
14.11.2 Company Overview
14.11.3 Product Benchmarking
14.12 Shanxi Lu'an Mining Group Co., Ltd.
14.12.1 Company Snapshot
14.12.2 Company Overview
14.12.3 Product Benchmarking
14.13 Foster Wheeler AG
14.13.1 Company Snapshot
14.13.2 Company Overview
14.13.3 Product Benchmarking
14.14 Linc Energy Ltd.
14.14.1 Company Snapshot
14.14.2 Company Overview
14.14.3 Product Benchmarking
14.15 CTCI Corporation
14.15.1 Company Snapshot
14.15.2 Company Overview
14.15.3 Financial Analysis
14.15.3.1 Net Revenue, 2017-2021
14.15.3.2 R&D, 2017-2021
14.15.3.3 Regional Revenue Shares, 2021 (%)
14.15.3.4 Business Segment Revenue Shares, 2021 (%)
14.15.4 Product Benchmarking
14.16 Sedin Engineering Co Ltd
14.16.1 Company Snapshot
14.16.2 Company Overview
14.16.3 Product Benchmarking
14.17 Wison Group
14.17.1 Company Snapshot
14.17.2 Company Overview
14.17.3 Product Benchmarking
15 Conclusion and Recommendations
15.1 Concluding Remarks from Visiongain
15.2 Recommendations for Market Players
List of Tables
Table 1 Coal Gasification Market Snapshot, 2023 & 2033 (US$ Billion, CAGR %)
Table 2 Global Coal Gasification Market Forecast, 2023-2033 (US$ Bn, AGR (%), CAGR (%)) (V-Shaped Recovery Scenario)
Table 3 Global Coal Gasification Market by Region, 2023-2033 (US$ Bn, AGR (%), CAGR (%)) (V-Shaped Recovery Scenario)
Table 4 Global Coal Gasification Market Forecast, 2023-2033 (US$ Bn, AGR (%), CAGR (%)) (W-Shaped Recovery Scenario)
Table 5 Global Coal Gasification Market by Region, 2023-2033 (US$ Bn, AGR (%), CAGR (%)) (W-Shaped Recovery Scenario)
Table 6 Global Coal Gasification Market Forecast, 2023-2033 (US$ Bn, AGR (%), CAGR (%)) (U-Shaped Recovery Scenario)
Table 7 Global Coal Gasification Market by Region, 2023-2033 (US$ Bn, AGR (%), CAGR (%)) (U-Shaped Recovery Scenario)
Table 8 Global Coal Gasification Market Forecast, 2023-2033 (US$ Bn, AGR (%), CAGR (%)) (L-Shaped Recovery Scenario)
Table 9 Global Coal Gasification Market by Region, 2023-2033 (US$ Bn, AGR (%), CAGR (%)) (L-Shaped Recovery Scenario)
Table 10 Global Coal Gasification Market by Gasifier Type, 2023-2033 (US$ Bn, AGR (%), CAGR (%))
Table 11 Moving Bed Gasifier Market by Region, 2023-2033 (US$ Bn, AGR (%), CAGR (%))
Table 12 Fluidized Bed Gasifier Market by Region, 2023-2033 (US$ Bn, AGR (%), CAGR (%))
Table 13 Entrained Flow Gasifier Market by Region, 2023-2033 (US$ Bn, AGR (%), CAGR (%))
Table 14 Global Coal Gasification Market by End-User, 2023-2033 (US$ Bn, AGR (%), CAGR (%))
Table 15 Chemicals Market by Region, 2023-2033 (US$ Bn, AGR (%), CAGR (%))
Table 16 Power Generation Market by Region, 2023-2033 (US$ Bn, AGR (%), CAGR (%))
Table 17 Liquid Fuels Market by Region, 2023-2033 (US$ Bn, AGR (%), CAGR (%))
Table 18 Other End-User Market by Region, 2023-2033 (US$ Bn, AGR (%), CAGR (%))
Table 19 Global Coal Gasification Market by Feedstock, 2023-2033 (US$ Bn, AGR (%), CAGR (%))
Table 20 Bituminous Coal Market by Region, 2023-2033 (US$ Bn, AGR (%), CAGR (%))
Table 21 Sub-bituminous Coal Market by Region, 2023-2033 (US$ Bn, AGR (%), CAGR (%))
Table 22 Petroleum Coke Market by Region, 2023-2033 (US$ Bn, AGR (%), CAGR (%))
Table 23 Biomass Market by Region, 2023-2033 (US$ Bn, AGR (%), CAGR (%))
Table 24 Other Feedstock Market by Region, 2023-2033 (US$ Bn, AGR (%), CAGR (%))
Table 25 Global Coal Gasification Market by Technology, 2023-2033 (US$ Bn, AGR (%), CAGR (%))
Table 26 Integrated Gasification Combined Cycle (IGCC) Market by Region, 2023-2033 (US$ Bn, AGR (%), CAGR (%))
Table 27 Chemical Looping Gasification (CLG) Market by Region, 2023-2033 (US$ Bn, AGR (%), CAGR (%))
Table 28 Hydrogen from Coal Process (HyCO) Market by Region, 2023-2033 (US$ Bn, AGR (%), CAGR (%))
Table 29 Coal-to-Liquids (CTL) Market by Region, 2023-2033 (US$ Bn, AGR (%), CAGR (%))
Table 30 Polygeneration Market by Region, 2023-2033 (US$ Bn, AGR (%), CAGR (%))
Table 31 Other Technologies Market by Region, 2023-2033 (US$ Bn, AGR (%), CAGR (%))
Table 32 Global Coal Gasification Market Forecast, 2023-2033 (US$ Bn, AGR (%), CAGR (%))
Table 33 Global Coal Gasification Market by Region, 2023-2033 (US$ Bn, AGR (%), CAGR (%))
Table 34 North America Coal Gasification Market by Value, 2023-2033 (US$ Bn, AGR (%), CAGR (%))
Table 35 North America Coal Gasification Market by Country, 2023-2033 (US$ Bn, AGR (%), CAGR (%))
Table 36 North America Coal Gasification Market by Gasifier Type, 2023-2033 (US$ Bn, AGR (%), CAGR (%))
Table 37 North America Coal Gasification Market by End-User, 2023-2033 (US$ Bn, AGR (%), CAGR (%))
Table 38 North America Coal Gasification Market by Feedstock, 2023-2033 (US$ Bn, AGR (%), CAGR (%))
Table 39 North America Coal Gasification Market by Technology, 2023-2033 (US$ Bn, AGR (%), CAGR (%))
Table 40 US Coal Gasification Market by Value, 2023-2033 (US$ Bn, AGR (%), CAGR (%))
Table 41 Canada Coal Gasification Market by Value, 2023-2033 (US$ Bn, AGR (%), CAGR (%))
Table 42 Europe Coal Gasification Market by Value, 2023-2033 (US$ Bn, AGR (%), CAGR (%))
Table 43 Europe Coal Gasification Market by Country, 2023-2033 (US$ Bn, AGR (%), CAGR (%))
Table 44 Europe Coal Gasification Market by Gasifier Type, 2023-2033 (US$ Bn, AGR (%), CAGR (%))
Table 45 Europe Coal Gasification Market by End-User, 2023-2033 (US$ Bn, AGR (%), CAGR (%))
Table 46 Europe Coal Gasification Market by Feedstock, 2023-2033 (US$ Bn, AGR (%), CAGR (%))
Table 47 Europe Coal Gasification Market by Technology, 2023-2033 (US$ Bn, AGR (%), CAGR (%))
Table 48 Germany Coal Gasification Market by Value, 2023-2033 (US$ Bn, AGR (%), CAGR (%))
Table 49 UK Coal Gasification Market by Value, 2023-2033 (US$ Bn, AGR (%), CAGR (%))
Table 50 France Coal Gasification Market by Value, 2023-2033 (US$ Bn, AGR (%), CAGR (%))
Table 51 Italy Coal Gasification Market by Value, 2023-2033 (US$ Bn, AGR (%), CAGR (%))
Table 52 Russia Coal Gasification Market by Value, 2023-2033 (US$ Bn, AGR (%), CAGR (%))
Table 53 Rest of Europe Coal Gasification Market by Value, 2023-2033 (US$ Bn, AGR (%), CAGR (%))
Table 54 Asia-Pacific Coal Gasification Market by Value, 2023-2033 (US$ Bn, AGR (%), CAGR (%))
Table 55 Asia-Pacific Coal Gasification Market by Country, 2023-2033 (US$ Bn, AGR (%), CAGR (%))
Table 56 Asia-Pacific Coal Gasification Market by Gasifier Type, 2023-2033 (US$ Bn, AGR (%), CAGR (%))
Table 57 Asia-Pacific Coal Gasification Market by End-User, 2023-2033 (US$ Bn, AGR (%), CAGR (%))
Table 58 Asia-Pacific Coal Gasification Market by Feedstock, 2023-2033 (US$ Bn, AGR (%), CAGR (%))
Table 59 Asia-Pacific Coal Gasification Market by Technology, 2023-2033 (US$ Bn, AGR (%), CAGR (%))
Table 60 China Coal Gasification Market by Value, 2023-2033 (US$ Bn, AGR (%), CAGR (%))
Table 61 India Coal Gasification Market by Value, 2023-2033 (US$ Bn, AGR (%), CAGR (%))
Table 62 Japan Coal Gasification Market by Value, 2023-2033 (US$ Bn, AGR (%), CAGR (%))
Table 63 South Korea Coal Gasification Market by Value, 2023-2033 (US$ Bn, AGR (%), CAGR (%))
Table 64 Australia Coal Gasification Market by Value, 2023-2033 (US$ Bn, AGR (%), CAGR (%))
Table 65 Rest of Asia-Pacific Coal Gasification Market by Value, 2023-2033 (US$ Bn, AGR (%), CAGR (%))
Table 66 Middle East & Africa Coal Gasification Market by Value, 2023-2033 (US$ Bn, AGR (%), CAGR (%))
Table 67 Middle East & Africa Coal Gasification Market by Country, 2023-2033 (US$ Bn, AGR (%), CAGR (%))
Table 68 Middle East & Africa Coal Gasification Market by Gasifier Type, 2023-2033 (US$ Bn, AGR (%), CAGR (%))
Table 69 Middle East & Africa Coal Gasification Market by End-User, 2023-2033 (US$ Bn, AGR (%), CAGR (%))
Table 70 Middle East & Africa Coal Gasification Market by Feedstock, 2023-2033 (US$ Bn, AGR (%), CAGR (%))
Table 71 Middle East & Africa Coal Gasification Market by Technology, 2023-2033 (US$ Bn, AGR (%), CAGR (%))
Table 72 GCC Coal Gasification Market by Value, 2023-2033 (US$ Bn, AGR (%), CAGR (%))
Table 73 South Africa Coal Gasification Market by Value, 2023-2033 (US$ Bn, AGR (%), CAGR (%))
Table 74 Rest of Middle East & Africa Coal Gasification Market by Value, 2023-2033 (US$ Bn, AGR (%), CAGR (%))
Table 75 Latin America Coal Gasification Market by Value, 2023-2033 (US$ Bn, AGR (%), CAGR (%))
Table 76 Latin America Coal Gasification Market by Country, 2023-2033 (US$ Bn, AGR (%), CAGR (%))
Table 77 Latin America Coal Gasification Market by Gasifier Type, 2023-2033 (US$ Bn, AGR (%), CAGR (%))
Table 78 Latin America Coal Gasification Market by End-User, 2023-2033 (US$ Bn, AGR (%), CAGR (%))
Table 79 Latin America Coal Gasification Market by Feedstock, 2023-2033 (US$ Bn, AGR (%), CAGR (%))
Table 80 Latin America Coal Gasification Market by Technology, 2023-2033 (US$ Bn, AGR (%), CAGR (%))
Table 81 Brazil Coal Gasification Market by Value, 2023-2033 (US$ Bn, AGR (%), CAGR (%))
Table 82 Mexico Coal Gasification Market by Value, 2023-2033 (US$ Bn, AGR (%), CAGR (%))
Table 83 Rest of Latin America Coal Gasification Market by Value, 2023-2033 (US$ Bn, AGR (%), CAGR (%))
Table 84 Strategic Outlook - Contract
Table 85 General Electric Company: Key Details, (CEO, HQ, Revenue, Founded, No. of Employees, Company Type, Website, Business Segment)
Table 86 General Electric Company: Product Benchmarking
Table 87 Air Liquide: Key Details, (CEO, HQ, Revenue, Founded, No. of Employees, Company Type, Website, Business Segment)
Table 88 Air Liquide: Product Benchmarking
Table 89 Air Liquide: Strategic Outlook
Table 90 Mitsubishi Heavy Industries, Ltd.: Key Details, (CEO, HQ, Revenue, Founded, No. of Employees, Company Type, Website, Business Segment)
Table 91 Mitsubishi Heavy Industries, Ltd.: Product Benchmarking
Table 92 Mitsubishi Heavy Industries, Ltd.: Strategic Outlook
Table 93 Royal Dutch Shell Plc: Key Details, (CEO, HQ, Revenue, Founded, No. of Employees, Company Type, Website, Business Segment)
Table 94 Royal Dutch Shell Plc: Product Benchmarking
Table 95 Royal Dutch Shell Plc: Strategic Outlook
Table 96 Siemens AG: Key Details, (CEO, HQ, Revenue, Founded, No. of Employees, Company Type, Website, Business Segment)
Table 97 Siemens AG: Product Benchmarking
Table 98 Siemens AG: Strategic Outlook
Table 99 Linde plc: Key Details, (CEO, HQ, Revenue, Founded, No. of Employees, Company Type, Website, Business Segment)
Table 100 Linde plc: Product Benchmarking
Table 101 Linde plc: Strategic Outlook
Table 102 KBR, Inc.: Key Details, (CEO, HQ, Revenue, Founded, No. of Employees, Company Type, Website, Business Segment)
Table 103 KBR, Inc.: Product Benchmarking
Table 104 Sasol Limited: Key Details, (CEO, HQ, Revenue, Founded, No. of Employees, Company Type, Website, Business Segment)
Table 105 Sasol Limited: Product Benchmarking
Table 106 Xinwen Mining Group Co., Ltd.: Key Details, (CEO, HQ, Revenue, Founded, No. of Employees, Company Type, Website, Business Segment)
Table 107 Xinwen Mining Group Co.,Ltd: Product Benchmarking
Table 108 Shanxi Lu'an Mining Group Co., Ltd.: Key Details, (CEO, HQ, Revenue, Founded, No. of Employees, Company Type, Website, Business Segment)
Table 109 Shanxi Lu'an Mining Group Co., Ltd.: Product Benchmarking
Table 110 Foster Wheeler AG: Key Details, (CEO, HQ, Revenue, Founded, No. of Employees, Company Type, Website, Business Segment)
Table 111 Foster Wheeler AG: Product Benchmarking
Table 112 Linc Energy Ltd.: Key Details, (CEO, HQ, Revenue, Founded, No. of Employees, Company Type, Website, Business Segment)
Table 113 Linc Energy Ltd.: Product Benchmarking
Table 114 CTCI Corporation: Key Details, (CEO, HQ, Revenue, Founded, No. of Employees, Company Type, Website, Business Segment)
Table 115 CTCI Corporation: Product Benchmarking
Table 116 Sedin Engineering Co Ltd: Key Details, (CEO, HQ, Revenue, Founded, No. of Employees, Company Type, Website, Business Segment)
Table 117 Sedin Engineering Co Ltd: Product Benchmarking
Table 118 Wison Group: Key Details, (CEO, HQ, Revenue, Founded, No. of Employees, Company Type, Website, Business Segment)
Table 119 Wison Group: Product Benchmarking
List of Figures
Figure 1 Coal Gasification Market Segmentation
Figure 2 Coal Gasification Market by Gasifier Type: Market Attractiveness Index
Figure 3 Coal Gasification Market by End-User: Market Attractiveness Index
Figure 4 Coal Gasification Market by Feedstock: Market Attractiveness Index
Figure 5 Coal Gasification Market by Technology: Market Attractiveness Index
Figure 6 Coal Gasification Market Attractiveness Index by Region
Figure 7 Coal Gasification Market: Market Dynamics
Figure 8 Coal Gasification Market: Porter’s Five Forces Analysis
Figure 9 Global Coal Gasification Market Share Forecast by COVID, 2023-2033 (%)
Figure 10 Global Coal Gasification Market Forecast, 2023-2033 (US$ Bn, AGR (%)) (V-Shaped Recovery Scenario)
Figure 11 Global Coal Gasification Market by Region, 2023-2033 (US$ Bn, AGR (%)) (V-Shaped Recovery Scenario)
Figure 12 Global Coal Gasification Market Forecast, 2023-2033 (US$ Bn, AGR (%)) (W-Shaped Recovery Scenario)
Figure 13 Global Coal Gasification Market by Region, 2023-2033 (US$ Bn, AGR (%)) (W-Shaped Recovery Scenario)
Figure 14 Global Coal Gasification Market Forecast, 2023-2033 (US$ Bn, AGR (%)) (U-Shaped Recovery Scenario)
Figure 15 Global Coal Gasification Market by Region, 2023-2033 (US$ Bn, AGR (%)) (U-Shaped Recovery Scenario)
Figure 16 Global Coal Gasification Market Forecast, 2023-2033 (US$ Bn, AGR (%)) (L-Shaped Recovery Scenario)
Figure 17 Global Coal Gasification Market by Region, 2023-2033 (US$ Bn, AGR (%)) (L-Shaped Recovery Scenario)
Figure 18 Coal Gasification Market: PEST Analysis
Figure 19 Coal Gasification Market by Gasifier Type: Market Attractiveness Index
Figure 20 Global Coal Gasification Market by Gasifier Type, 2023-2033 (US$ Bn, AGR (%))
Figure 21 Coal Gasification Market Share Forecast by Gasifier Type, 2023, 2028, 2033 (%)
Figure 22 Moving Bed Gasifier Market by Region, 2023-2033 (US$ Bn, AGR (%))
Figure 23 Moving Bed Gasifier Market Share Forecast by Region, 2023 & 2033 (%)
Figure 24 Fluidized Bed Gasifier Market by Region, 2023-2033 (US$ Bn, AGR (%))
Figure 25 Fluidized Bed Gasifier Market Share Forecast by Region, 2023 & 2033 (%)
Figure 26 Entrained Flow Gasifier Market by Region, 2023-2033 (US$ Bn, AGR (%))
Figure 27 Entrained Flow Gasifier Market Share Forecast by Region, 2023 & 2033 (%)
Figure 28 Coal Gasification Market by End-User: Market Attractiveness Index
Figure 29 Global Coal Gasification Market by End-User, 2023-2033 (US$ Bn, AGR (%))
Figure 30 Coal Gasification Market Share Forecast by End-User, 2023, 2028, 2033 (%)
Figure 31 Chemicals Market by Region, 2023-2033 (US$ Bn, AGR (%))
Figure 32 Chemicals Market Share Forecast by Region, 2023 & 2033 (%)
Figure 33 Power Generation Market by Region, 2023-2033 (US$ Bn, AGR (%))
Figure 34 Power Generation Market Share Forecast by Region, 2023 & 2033 (%)
Figure 35 Liquid Fuels Market by Region, 2023-2033 (US$ Bn, AGR (%))
Figure 36 Liquid Fuels Market Share Forecast by Region, 2023 & 2033 (%)
Figure 37 Other End-User Market by Region, 2023-2033 (US$ Bn, AGR (%))
Figure 38 Other End-User Market Share Forecast by Region, 2023 & 2033 (%)
Figure 39 Coal Gasification Market by Feedstock: Market Attractiveness Index
Figure 40 Global Coal Gasification Market by Feedstock, 2023-2033 (US$ Bn, AGR (%))
Figure 41 Coal Gasification Market Share Forecast by Feedstock, 2023, 2028, 2033 (%)
Figure 42 Bituminous Coal Market by Region, 2023-2033 (US$ Bn, AGR (%))
Figure 43 Bituminous Coal Market Share Forecast by Region, 2023 & 2033 (%)
Figure 44 Sub-bituminous Coal Market by Region, 2023-2033 (US$ Bn, AGR (%))
Figure 45 Sub-bituminous Coal Market Share Forecast by Region, 2023 & 2033 (%)
Figure 46 Petroleum Coke Market by Region, 2023-2033 (US$ Bn, AGR (%))
Figure 47 Petroleum Coke Market Share Forecast by Region, 2023 & 2033 (%)
Figure 48 Biomass Market by Region, 2023-2033 (US$ Bn, AGR (%))
Figure 49 Biomass Market Share Forecast by Region, 2023 & 2033 (%)
Figure 50 Other Feedstock Market by Region, 2023-2033 (US$ Bn, AGR (%))
Figure 51 Other Feedstock Market Share Forecast by Region, 2023 & 2033 (%)
Figure 52 Coal Gasification Market by Technology: Market Attractiveness Index
Figure 53 Global Coal Gasification Market by Technology, 2023-2033 (US$ Bn, AGR (%))
Figure 54 Coal Gasification Market Share Forecast by Technology, 2023, 2028, 2033 (%)
Figure 55 Integrated Gasification Combined Cycle (IGCC) Market by Region, 2023-2033 (US$ Bn, AGR (%))
Figure 56 Integrated Gasification Combined Cycle (IGCC) Market Share Forecast by Region, 2023 & 2033 (%)
Figure 57 Chemical Looping Gasification (CLG) Market by Region, 2023-2033 (US$ Bn, AGR (%))
Figure 58 Chemical Looping Gasification (CLG) Market Share Forecast by Region, 2023 & 2033 (%)
Figure 59 Hydrogen from Coal Process (HyCO) Market by Region, 2023-2033 (US$ Bn, AGR (%))
Figure 60 Hydrogen from Coal Process (HyCO) Market Share Forecast by Region, 2023 & 2033 (%)
Figure 61 Coal-to-Liquids (CTL) Market by Region, 2023-2033 (US$ Bn, AGR (%))
Figure 62 Coal-to-Liquids (CTL) Market Share Forecast by Region, 2023 & 2033 (%)
Figure 63 Polygeneration Market by Region, 2023-2033 (US$ Bn, AGR (%))
Figure 64 Polygeneration Market Share Forecast by Region, 2023 & 2033 (%)
Figure 65 Other Technologies Market by Region, 2023-2033 (US$ Bn, AGR (%))
Figure 66 Other Technologies Market Share Forecast by Region, 2023 & 2033 (%)
Figure 67 Coal Gasification Market Forecast by Region 2023 and 2033 (Revenue, CAGR%)
Figure 68 Coal Gasification Market Share Forecast by Region 2023, 2028, 2033 (%)
Figure 69 Global Coal Gasification Market Forecast, 2023-2033 (US$ Bn, AGR (%))
Figure 70 Global Coal Gasification Market by Region, 2023-2033 (US$ Bn, AGR (%))
Figure 71 North America Coal Gasification Market Attractiveness Index
Figure 72 North America Coal Gasification Market by Region, 2023, 2028 & 2033 (US$ Billion)
Figure 73 North America Coal Gasification Market by Value, 2023-2033 (US$ Bn, AGR (%))
Figure 74 North America Coal Gasification Market by Country, 2023-2033 (US$ Bn, AGR (%))
Figure 75 North America Coal Gasification Market Share Forecast by Country, 2023-2033 (%)
Figure 76 North America Coal Gasification Market by Gasifier Type, 2023-2033 (US$ Bn, AGR (%))
Figure 77 North America Coal Gasification Market Share Forecast Gasifier Type, 2023 & 2033 (%)
Figure 78 North America Coal Gasification Market by End-User, 2023-2033 (US$ Bn, AGR (%))
Figure 79 North America Coal Gasification Market Share Forecast by End-User, 2023 & 2033 (%)
Figure 80 North America Coal Gasification Market by Feedstock, 2023-2033 (US$ Bn, AGR (%))
Figure 81 North America Coal Gasification Market Share Forecast by Feedstock, 2023 & 2033 (%)
Figure 82 North America Coal Gasification Market by Technology, 2023-2033 (US$ Bn, AGR (%))
Figure 83 North America Coal Gasification Market Share Forecast by Technology, 2023 & 2033 (%)
Figure 84 US Coal Gasification Market by Value, 2023-2033 (US$ Bn, AGR (%))
Figure 85 Canada Coal Gasification Market by Value, 2023-2033 (US$ Bn, AGR (%))
Figure 86 Europe Coal Gasification Market Attractiveness Index
Figure 87 Europe Coal Gasification Market by Region, 2023, 2028 & 2033 (US$ Billion)
Figure 88 Europe Coal Gasification Market by Value, 2023-2033 (US$ Bn, AGR (%))
Figure 89 Europe Coal Gasification Market by Country, 2023-2033 (US$ Bn, AGR (%))
Figure 90 Europe Coal Gasification Market Share Forecast by Country, 2023 & 2033 (%)
Figure 91 Europe Coal Gasification Market by Gasifier Type, 2023-2033 (US$ Bn, AGR (%))
Figure 92 Europe Coal Gasification Market Share Forecast Gasifier Type, 2023 & 2033 (%)
Figure 93 Europe Coal Gasification Market by End-User, 2023-2033 (US$ Bn, AGR (%))
Figure 94 Europe Coal Gasification Market Share Forecast by End-User, 2023 & 2033 (%)
Figure 95 Europe Coal Gasification Market by Feedstock, 2023-2033 (US$ Bn, AGR (%))
Figure 96 Europe Coal Gasification Market Share Forecast by Feedstock, 2023 & 2033 (%)
Figure 97 Europe Coal Gasification Market by Technology, 2023-2033 (US$ Bn, AGR (%))
Figure 98 Europe Coal Gasification Market Share Forecast by Technology, 2023 & 2033 (%)
Figure 99 Germany Coal Gasification Market by Value, 2023-2033 (US$ Bn, AGR (%))
Figure 100 UK Coal Gasification Market by Value, 2023-2033 (US$ Bn, AGR (%))
Figure 101 France Coal Gasification Market by Value, 2023-2033 (US$ Bn, AGR (%))
Figure 102 Italy Coal Gasification Market by Value, 2023-2033 (US$ Bn, AGR (%))
Figure 103 Russia Coal Gasification Market by Value, 2023-2033 (US$ Bn, AGR (%))
Figure 104 Rest of Europe Coal Gasification Market by Value, 2023-2033 (US$ Bn, AGR (%))
Figure 105 Asia-Pacific Coal Gasification Market Attractiveness Index
Figure 106 Asia-Pacific Coal Gasification Market by Region, 2023, 2028 & 2033 (US$ Billion)
Figure 107 Asia-Pacific Coal Gasification Market by Value, 2023-2033 (US$ Bn, AGR (%))
Figure 108 Asia-Pacific Coal Gasification Market by Country, 2023-2033 (US$ Bn, AGR (%))
Figure 109 Asia-Pacific Coal Gasification Market Share Forecast by Country, 2023 & 2033 (%)
Figure 110 Asia-Pacific Coal Gasification Market by Gasifier Type, 2023-2033 (US$ Bn, AGR (%))
Figure 111 Asia-Pacific Coal Gasification Market Share Forecast Gasifier Type, 2023 & 2033 (%)
Figure 112 Asia-Pacific Coal Gasification Market by End-User, 2023-2033 (US$ Bn, AGR (%))
Figure 113 Asia-Pacific Coal Gasification Market Share Forecast by End-User, 2023 & 2033 (%)
Figure 114 Asia-Pacific Coal Gasification Market by Feedstock, 2023-2033 (US$ Bn, AGR (%))
Figure 115 Asia-Pacific Coal Gasification Market Share Forecast by Feedstock, 2023 & 2033 (%)
Figure 116 Asia-Pacific Coal Gasification Market by Technology, 2023-2033 (US$ Bn, AGR (%))
Figure 117 Asia-Pacific Coal Gasification Market Share Forecast by Technology, 2023 & 2033 (%)
Figure 118 China Coal Gasification Market by Value, 2023-2033 (US$ Bn, AGR (%))
Figure 119 India Coal Gasification Market by Value, 2023-2033 (US$ Bn, AGR (%))
Figure 120 Japan Coal Gasification Market by Value, 2023-2033 (US$ Bn, AGR (%))
Figure 121 South Korea Coal Gasification Market by Value, 2023-2033 (US$ Bn, AGR (%))
Figure 122 Australia Coal Gasification Market by Value, 2023-2033 (US$ Bn, AGR (%))
Figure 123 Rest of Asia-Pacific Coal Gasification Market by Value, 2023-2033 (US$ Bn, AGR (%))
Figure 124 Middle East and Africa Coal Gasification Market Attractiveness Index
Figure 125 Middle East and Africa Coal Gasification Market by Region, 2023, 2028 & 2033 (US$ Billion)
Figure 126 Middle East & Africa Coal Gasification Market by Value, 2023-2033 (US$ Bn, AGR (%))
Figure 127 Middle East & Africa Coal Gasification Market by Country, 2023-2033 (US$ Bn, AGR (%))
Figure 128 Middle East and Africa Coal Gasification Market Share Forecast by Country, 2023 & 2033 (%)
Figure 129 Middle East & Africa Coal Gasification Market by Gasifier Type, 2023-2033 (US$ Bn, AGR (%))
Figure 130 Middle East and Africa Coal Gasification Market Share Forecast Gasifier Type, 2023 & 2033 (%)
Figure 131 Middle East & Africa Coal Gasification Market by End-User, 2023-2033 (US$ Bn, AGR (%))
Figure 132 Middle East and Africa Coal Gasification Market Share Forecast by End-User, 2023 & 2033 (%)
Figure 133 Middle East & Africa Coal Gasification Market by Feedstock, 2023-2033 (US$ Bn, AGR (%))
Figure 134 Middle East and Africa Coal Gasification Market Share Forecast by Feedstock, 2023 & 2033 (%)
Figure 135 Middle East & Africa Coal Gasification Market by Technology, 2023-2033 (US$ Bn, AGR (%))
Figure 136 Middle East and Africa Coal Gasification Market Share Forecast by Technology, 2023 & 2033 (%)
Figure 137 GCC Coal Gasification Market by Value, 2023-2033 (US$ Bn, AGR (%))
Figure 138 South Africa Coal Gasification Market by Value, 2023-2033 (US$ Bn, AGR (%))
Figure 139 Rest of Middle East & Africa Coal Gasification Market by Value, 2023-2033 (US$ Bn, AGR (%))
Figure 140 Latin America Coal Gasification Market Attractiveness Index
Figure 141 Latin America Coal Gasification Market by Region, 2023, 2028 & 2033 (US$ Billion)
Figure 142 Latin America Coal Gasification Market by Value, 2023-2033 (US$ Bn, AGR (%))
Figure 143 Latin America Coal Gasification Market by Country, 2023-2033 (US$ Bn, AGR (%))
Figure 144 Latin America Coal Gasification Market Share Forecast by Country, 2023 & 2033 (%)
Figure 145 Latin America Coal Gasification Market by Gasifier Type, 2023-2033 (US$ Bn, AGR (%))
Figure 146 Latin America Coal Gasification Market Share Forecast Gasifier Type, 2023 & 2033 (%)
Figure 147 Latin America Coal Gasification Market by End-User, 2023-2033 (US$ Bn, AGR (%))
Figure 148 Latin America Coal Gasification Market Share Forecast by End-User, 2023 & 2033 (%)
Figure 149 Latin America Coal Gasification Market by Feedstock, 2023-2033 (US$ Bn, AGR (%))
Figure 150 Latin America Coal Gasification Market Share Forecast by Feedstock, 2023 & 2033 (%)
Figure 151 Latin America Coal Gasification Market by Technology, 2023-2033 (US$ Bn, AGR (%))
Figure 152 Latin America Coal Gasification Market Share Forecast by Technology, 2023 & 2033 (%)
Figure 153 Brazil Coal Gasification Market by Value, 2023-2033 (US$ Bn, AGR (%))
Figure 154 Mexico Coal Gasification Market by Value, 2023-2033 (US$ Bn, AGR (%))
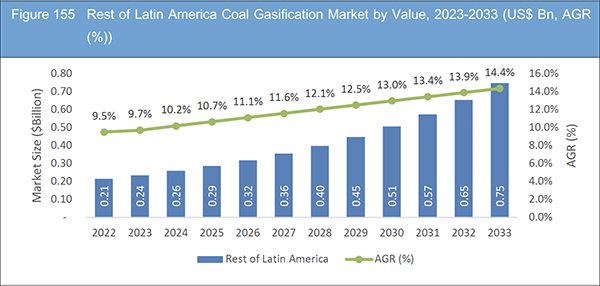
Figure 155 Rest of Latin America Coal Gasification Market by Value, 2023-2033 (US$ Bn, AGR (%))
Figure 156 Coal Gasification Market: Company Revenue Share, 2022
Figure 157 General Electric Company: Net Revenue, 2018-2022 (US$ million, AGR%)
Figure 158 General Electric Company: R&D, 2018-2022 (US$ million, AGR%)
Figure 159 General Electric Company: Regional Revenue Shares, 2022 (%)
Figure 160 General Electric Company: Business Segment Revenue Shares, 2022 (%)
Figure 161 Air Liquide: Net Revenue, 2018-2022 (US$ million, AGR%)
Figure 162 Air Liquide: R&D, 2018-2022 (US$ million, AGR%)
Figure 163 Air Liquide: Regional Revenue Shares, 2022 (%)
Figure 164 Air Liquide: Business Segment Revenue Shares, 2022 (%)
Figure 165 Mitsubishi Heavy Industries, Ltd.: Net Revenue, 2018-2022 (US$ million, AGR%)
Figure 166 Mitsubishi Heavy Industries, Ltd.: R&D, 2018-2022 (US$ million, AGR%)
Figure 167 Mitsubishi Heavy Industries, Ltd.: Regional Revenue Shares, 2022 (%)
Figure 168 Mitsubishi Heavy Industries, Ltd.: Business Segment Revenue Shares, 2022 (%)
Figure 169 Royal Dutch Shell Plc: Net Revenue, 2018-2022 (US$ million, AGR%)
Figure 170 Royal Dutch Shell Plc: R&D, 2018-2022 (US$ million, AGR%)
Figure 171 Royal Dutch Shell Plc: Regional Revenue Shares, 2022 (%)
Figure 172 Royal Dutch Shell Plc: Business Segment Revenue Shares, 2022 (%)
Figure 173 Siemens AG: Net Revenue, 2018-2022 (US$ million, AGR%)
Figure 174 Siemens AG: R&D, 2018-2022 (US$ million, AGR%)
Figure 175 Siemens AG: Regional Revenue Shares, 2022 (%)
Figure 176 Siemens AG: Business Segment Revenue Shares, 2022 (%)
Figure 177 Linde plc: Net Revenue, 2018-2022 (US$ million, AGR%)
Figure 178 Linde plc: R&D, 2018-2022 (US$ million, AGR%)
Figure 179 Linde plc: Regional Revenue Shares, 2022 (%)
Figure 180 Linde plc: Business Segment Revenue Shares, 2022 (%)
Figure 181 KBR, Inc.: Net Revenue, 2018-2022 (US$ million, AGR%)
Figure 182 KBR, Inc.: Regional Revenue Shares, 2021 (%)
Figure 183 KBR, Inc.: Business Segment Revenue Shares, 2021 (%)
Figure 184 Sasol Limited: Net Revenue, 2018-2022 (US$ million, AGR%)
Figure 185 Sasol Limited: R&D, 2018-2022 (US$ million, AGR%)
Figure 186 Sasol Limited: Regional Revenue Shares, 2023 (%)
Figure 187 Sasol Limited: Business Segment Revenue Shares, 2022 (%)
Figure 188 CTCI Corporation: Net Revenue, 2017-2021 (US$ million, AGR%)
Figure 189 CTCI Corporation: R&D, 2017-2021 (US$ million, AGR%)
Figure 190 CTCI Corporation: Regional Revenue Shares, 2021 (%)
Figure 191 CTCI Corporation: Business Segment Revenue Shares, 2021 (%)
List of Companies Profiled in the report
Air Liquide
CTCI Corporation
Foster Wheeler AG
General Electric Company
KBR, Inc.
Linc Energy Ltd.
Linde plc
Mitsubishi Heavy Industries Ltd
Royal Dutch Shell Plc.
Sasol Limited
Sedin Engineering Co Ltd
Shanxi Lu'an Mining Group Co., Ltd.
Siemens AG
Wison Group
Xinwen Mining Group Co. Ltd
List of Other Companies Mentioned in the report
ACWA Power
Advanced Plasma Power
Alberta Carbon Trunk Line (ACTL),
Andritz AG
Bharat Heavy Electricals Limited (BHEL)
Botswana
Bumi Resources
Carbon Clean Solutions
China Machinery Engineering Corporation
China National Chemical Engineering Corporation
Cipta Energy
CLARA,
Coal India Limited (CIL)
Doosan Heavy Industries & Construction
Drax Group
Enchant Energy
Equinor
GreenHydroChem
IOCL
Jindal Steel and Power Ltd (JSPL)
J-POWER
Kobe Steel
Korea Western Power Co
LanzaTec
Nakoso IGCC Power GK
NLC India Limited (NLCIL)
Osaki CoolGen Corp
RWE
Shenhua Group
Talcher Fertilizers Limited (TFL)
Thal Limited
Vale
List of Associations Mentioned in the Report
Advanced Coal Gasification Association
Carbon Capture and Coal Gasification Association
Clean Coal Gasification Association
Coal Gasification Association
Coal Gasification Catalyst Suppliers Association
Coal Gasification Environmental Impact Association
Coal Gasification Equipment Manufacturers Association
Coal Gasification Industry Association
Coal Gasification Investment Association
Coal Gasification Plant Operators Association
Coal Gasification Policy and Advocacy Association
Coal Gasification Project Development Association
Coal Gasification Research Association
Coal Gasification Technology Association
Coal Gasification Training and Education Association
Global Coal Gasification Association
Integrated Coal Gasification Association
International Coal Gasification Association
National Coal Gasification Association