Industries > Pharma > Artificial Intelligence (AI) in Oncology Market Report 2023-2033
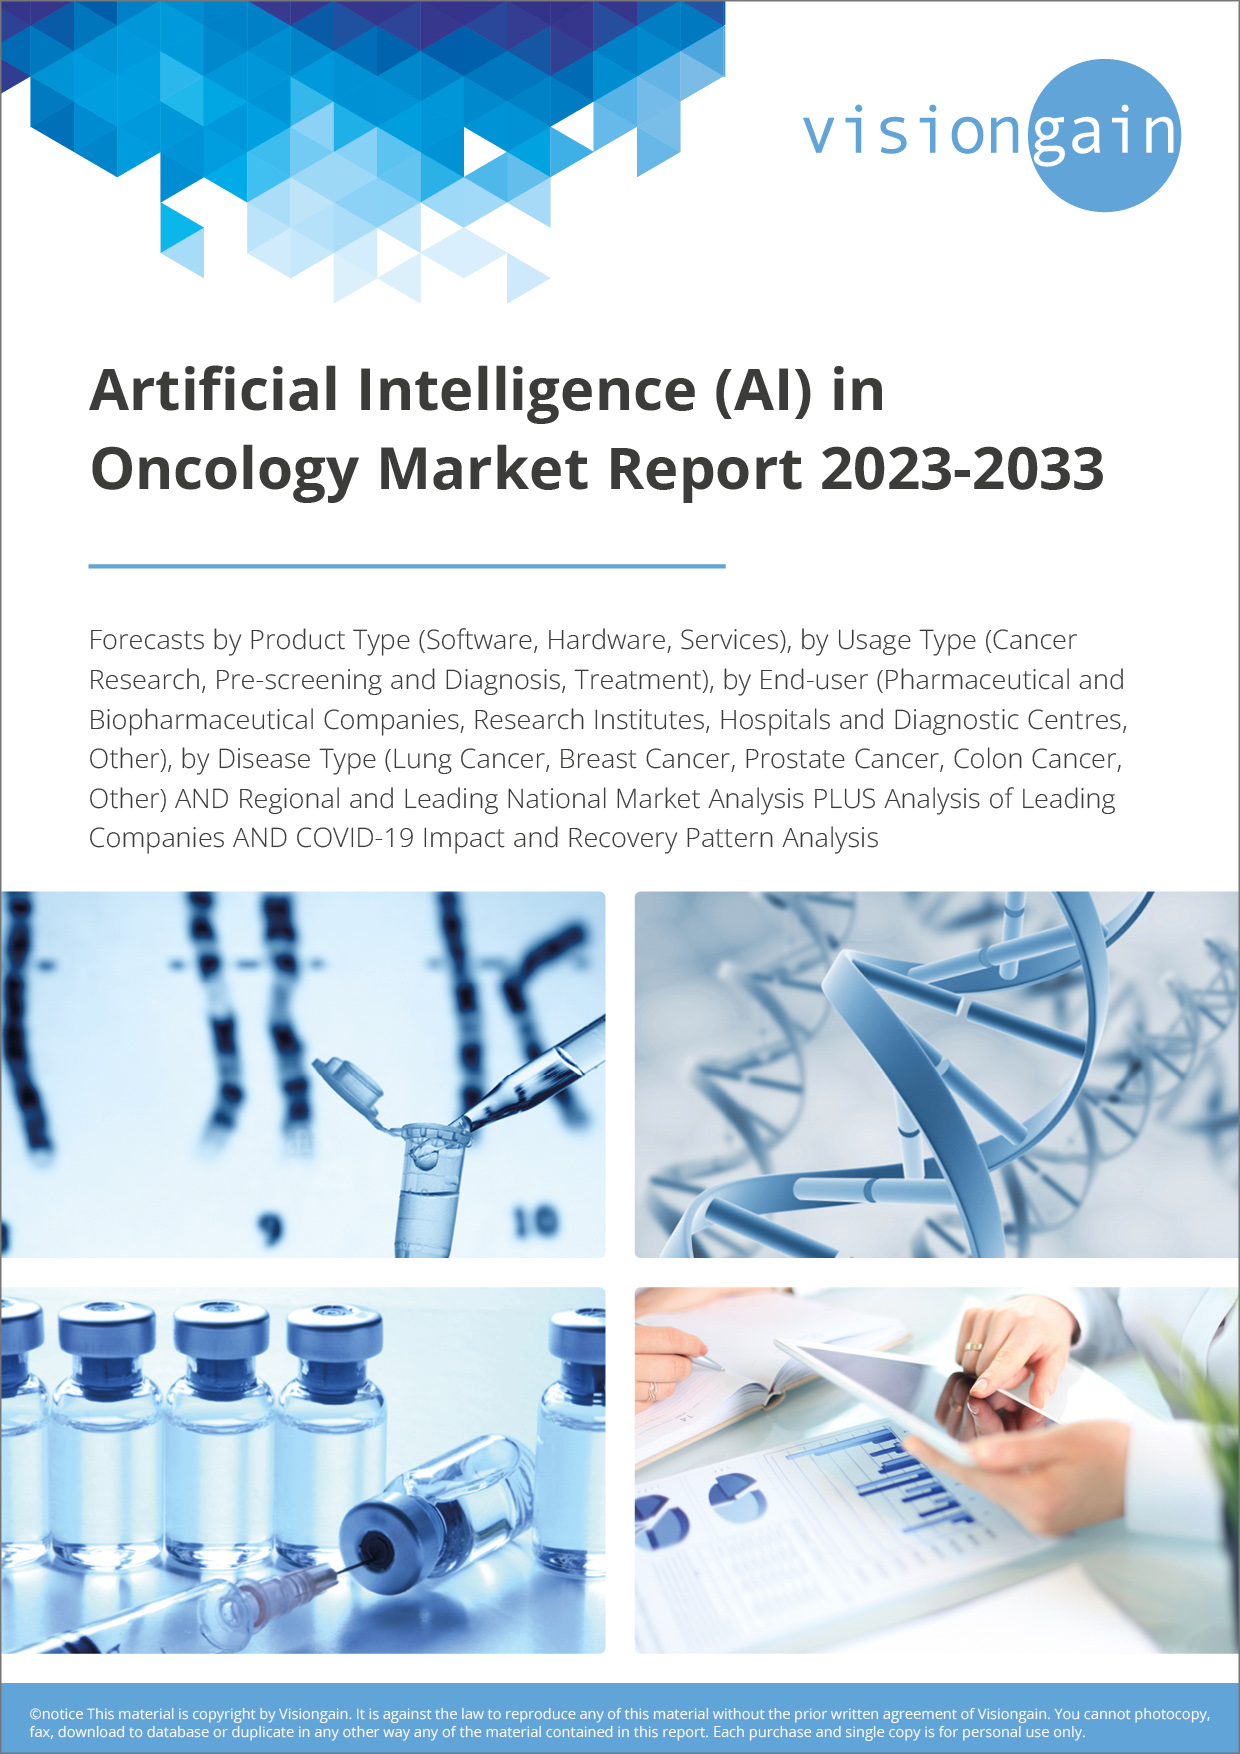
Artificial Intelligence (AI) in Oncology Market Report 2023-2033
Forecasts by Product Type (Software, Hardware, Services), by Usage Type (Cancer Research, Pre-screening and Diagnosis, Treatment), by End-user (Pharmaceutical and Biopharmaceutical Companies, Research Institutes, Hospitals and Diagnostic Centres, Other), by Disease Type (Lung Cancer, Breast Cancer, Prostate Cancer, Colon Cancer, Other) AND Regional and Leading National Market Analysis PLUS Analysis of Leading Companies AND COVID-19 Impact and Recovery Pattern Analysis
The Artificial Intelligence (AI) in Oncology Market Report 2023-2033: This report will prove invaluable to leading firms striving for new revenue pockets if they wish to better understand the industry and its underlying dynamics. It will be useful for companies that would like to expand into different industries or to expand their existing operations in a new region.
Accelerated Drug Discovery and Targeted Therapies Driving Market Growth
AI technologies are transforming the drug research and development process in cancer by harnessing massive volumes of data and smart algorithms. These developments seek to speed up the identification of prospective medication candidates, improve their efficacy, and make the development of targeted medicines easier. AI in drug development has the potential to dramatically reduce the time and expense associated with traditional techniques.
Collaborations between pharmaceutical corporations, technology businesses, and academic institutions have increased as a result of the development of AI-driven platforms and tools for drug discovery and development. These collaborations attempt to use AI to accelerate the development of new cancer medicines. For instance, in May 2023, the University of Sydney and the Australian business Pharos Therapeutics agreed to use AI to advance medication discovery for the treatment of cancer and uncommon disorders.
Lack of Standardization causes significant barriers
Standardized data collection and annotation practices are crucial in AI-driven oncology research and care. Variations in data collection methods, formats, and annotation protocols can impact the performance and generalizability of AI algorithms. By standardizing these processes, the quality and consistency of data can be improved, leading to more robust AI models. Standardization also facilitates data sharing, collaboration, and reproducibility, enabling meaningful comparisons and advancements in the field.
For instance, collaborative efforts between healthcare institutions and technology companies, such as the Cancer Imaging Archive (TCIA) and industry-led consortia like the Digital Imaging and Communications in Medicine (DICOM) are striving towards standardizing data sharing, storage, and annotation practices in oncology imaging. These initiatives promote the use of standardized guidelines and protocols for data collection, algorithm development, and evaluation.
By addressing the lack of standardization in AI oncology, stakeholders can overcome barriers to market growth. Collaborative initiatives, industry partnerships, and regulatory guidance are essential to establish comprehensive frameworks and guidelines for data collection, algorithm development, and evaluation. These efforts ensure that data collection methods, formats, and annotation protocols are consistent and harmonized across different healthcare institutions and research organizations.
What Questions Should You Ask before Buying a Market Research Report?
• How is the AI in oncology market evolving?
• What is driving and restraining the AI in oncology market?
• How will each AI in oncology submarket segment grow over the forecast period and how much revenue will these submarkets account for in 2033?
• How will the market shares for each AI in oncology submarket develop from 2023 to 2033?
• What will be the main driver for the overall market from 2023 to 2033?
• Will leading AI in oncology markets broadly follow the macroeconomic dynamics, or will individual national markets outperform others?
• How will the market shares of the national markets change by 2033 and which geographical region will lead the market in 2033?
• Who are the leading players and what are their prospects over the forecast period?
• What are the AI in oncology projects for these leading companies?
• How will the industry evolve during the period between 2023 and 2033? What are the implications of AI in oncology projects taking place now and over the next 10 years?
• Is there a greater need for product commercialisation to further scale the AI in oncology market?
• Where is the AI in oncology market heading and how can you ensure you are at the forefront of the market?
• What are the best investment options for new product and service lines?
• What are the key prospects for moving companies into a new growth path and C-suite?
You need to discover how this will impact the AI in oncology market today, and over the next 10 years:
• Our 289-page report provides 123 tables and 163 charts/graphs exclusively to you.
• The report highlights key lucrative areas in the industry so you can target them – NOW.
• It contains in-depth analysis of global, regional and national sales and growth.
• It highlights for you the key successful trends, changes and revenue projections made by your competitors.
This report tells you TODAY how the AI in oncology market will develop in the next 10 years, and in line with the variations in COVID-19 economic recession and bounce. This market is more critical now than at any point over the last 10 years.
Forecasts to 2033 and other analyses reveal commercial prospects
• In addition to revenue forecasting to 2033, our new study provides you with recent results, growth rates, and market shares.
• You will find original analyses, with business outlooks and developments.
• Discover qualitative analyses (including market dynamics, drivers, opportunities, restraints and challenges), cost structure, impact of rising AI in oncology prices and recent developments.
This report includes data analysis and invaluable insight into how COVID-19 will affect the industry and your company. Four COVID-19 recovery patterns and their impact, namely, “V”, “L”, “W” and “U” are discussed in this report.
Segments Covered in the Report
Product Type
• Software
• Hardware
• Services
Usage Type
• Cancer Research
• Pre-screening and Diagnosis
• Treatment
Disease Type
• Lung Cancer
• Breast Cancer
• Prostate Cancer
• Colon Cancer
• Others
End-users
• Pharmaceutical and Biopharmaceutical Companies
• Research Institutes
• Hospitals and Diagnostic Centres
• Others
In addition to the revenue predictions for the overall world market and segments, you will also find revenue forecasts for five regional and 20 leading national markets:
North America
• U.S.
• Canada
Europe
• Germany
• UK
• France
• Spain
• Italy
• Russia
• Rest of Europe
Asia Pacific
• China
• Japan
• India
• Australia
• South Korea
• Singapore
• Rest of Asia Pacific
Latin America
• Brazil
• Mexico
• Argentina
• Colombia
• Rest of Latin America
MEA
• GCC
• South Africa
• Rest of MEA
Need industry data? Please contact us today.
The report also includes profiles and for some of the leading companies in the AI in Oncology Market, 2023 to 2033, with a focus on this segment of these companies’ operations.
Leading companies and the potential for market growth
• Azra AI
• Botkin.AI
• CloudMedX Health
• ConcertAI
• Digital Diagnostics AI
• Enlitic
• GE Healthcare
• Google Health
• IBM Corporation
• iCAD
• Intel Corporation
• NVIDIA
• Owkin
• Siemen’s Healthineers
• SkinVision
• Therapixel
Overall world revenue for AI in oncology market, 2023 to 2033 in terms of value the market will surpass US$2,617.6 million in 2023, our work calculates. We predict strong revenue growth through to 2033. Our work identifies which organizations hold the greatest potential. Discover their capabilities, progress, and commercial prospects, helping you stay ahead.
How will the AI in Oncology Market, 2023 to 2033 report help you?
In summary, our 280+ page report provides you with the following knowledge:
• Revenue forecasts to 2033 for AI in Oncology Market, 2023 to 2033 Market, with forecasts for product types, usage types, disease types and end-users types, each forecast at a global and regional level – discover the industry’s prospects, finding the most lucrative places for investments and revenues.
• Revenue forecasts to 2033 for five regional and 20 key national markets – See forecasts for the AI in Oncology Market, 2023 to 2033 market in North America, Europe, Asia-Pacific, Latin America, and MEA. Also forecasted is the market in the US, Canada, Germany, UK, France, Spain, Italy, Russia, China, India, Japan, Australia, South Korea, Singapore, Brazil, Mexico, Argentina, Colombia, GCC, South Africa, and among other prominent economies.
• Prospects for established firms and those seeking to enter the market – including company profiles for 16 of the major companies involved in the AI in Oncology Market, 2023 to 2033.
Find quantitative and qualitative analyses with independent predictions. Receive information that only our report contains, staying informed with invaluable business intelligence.
Information found nowhere else
With our new report, you are less likely to fall behind in knowledge or miss out on opportunities. See how our work could benefit your research, analyses, and decisions. Visiongain’s study is for everybody needing commercial analyses for the AI in oncology Market, 2023 to 2033, market-leading companies. You will find data, trends and predictions.
To access the data contained in this document please email contactus@visiongain.com
Buy our report today Artificial Intelligence (AI) in Oncology Market Report 2023-2033: Forecasts by Product Type (Software, Hardware, Services), by Usage Type (Cancer Research, Pre-screening and Diagnosis, Treatment), by End-user (Pharmaceutical and Biopharmaceutical Companies, Research Institutes, Hospitals and Diagnostic Centres, Other), by Disease Type (Lung Cancer, Breast Cancer, Prostate Cancer, Colon Cancer, Other) AND Regional and Leading National Market Analysis PLUS Analysis of Leading Companies AND COVID-19 Impact and Recovery Pattern Analysis. Avoid missing out by staying informed – order our report now.
Visiongain is a trading partner with the US Federal Government
CCR Ref number: KD4R6
Do you have any custom requirements we can help you with? Any need for a specific country, geo region, market segment or specific company information? Contact us today, we can discuss your needs and see how we can help: contactus@visiongain.com
1.1 Objectives of the Study
1.2 Introduction to AI in Oncology Market
1.3 What This Report Delivers
1.4 Why You Should Read This Report
1.5 Key Questions Answered by This Analytical Report
1.6 Who is This Report for?
1.7 Methodology
1.7.1 Market Definitions
1.7.2 Market Evaluation & Forecasting Methodology
1.7.3 Data Validation
1.7.3.1 Primary Research
1.7.3.2 Secondary Research
1.8 Frequently Asked Questions (FAQs)
1.9 Associated Visiongain Reports
1.10 About Visiongain
2 Executive Summary
3 Market Overview
3.1 Key Findings
3.2 Market Dynamics
3.2.1 Market Driving Factors
3.2.1.1 Early Detection and Diagnosis Fuelling the Growth of Ai in Oncology
3.2.1.2 AI Technology Breakthroughs Improved Accuracy and Efficiency
3.2.1.3 Generation of Large And Complex Healthcare Datasets In Driving The Market
3.2.2 Market Restraining Factors
3.2.2.1 Security and Privacy of Data Concerns Causes Significant Barriers
3.2.2.2 Lack Of Skilled AI Workforce and Cost And Infrastructure Requirement Pose Significant Challenges
3.2.3 Market Opportunities
3.2.3.1 Rising Need Of Remote Monitoring And Telemedicine
3.2.3.2 Increasing Demand For Personalised Medication Is Driving Market Expansion
3.3 COVID-19 Impact Analysis
3.4 Porter’s Five Forces Analysis
3.4.1 Bargaining Power of Suppliers
3.4.2 Bargaining Power of Buyers
3.4.3 Competitive Rivalry
3.4.4 Threat from Substitutes
3.4.5 Threat of New Entrants
3.5 PEST Analysis
4 AI in Oncology Market Analysis by Product Type
4.1 Key Findings
4.2 Product Type Segment: Market Attractiveness Index
4.3 AI in Oncology Market Size Estimation and Forecast by Product Type
4.4 Software
4.4.1 Market Size by Region, 2023-2033 (US$ Million)
4.4.2 Market Share by Region, 2023 & 2033 (%)
4.5 Hardware
4.5.1 Market Size by Region, 2023-2033 (US$ Million)
4.5.2 Market Share by Region, 2023 & 2033 (%)
4.6 Services
4.6.1 Market Size by Region, 2023-2033 (US$ Million)
4.6.2 Market Share by Region, 2023 & 2033 (%)
5 AI in Oncology Market Analysis by Usage Type
5.1 Key Findings
5.2 Usage Type Segment: Market Attractiveness Index
5.3 AI in Oncology Market Size Estimation and Forecast by Usage Type
5.4 Cancer Research
5.4.1 Market Size by Region, 2023-2033 (US$ Million)
5.4.2 Market Share by Region, 2023 & 2033 (%)
5.5 Pre-screening and Diagnosis
5.5.1 Market Size by Region, 2023-2033 (US$ Million)
5.5.2 Market Share by Region, 2023 & 2033 (%)
5.6 Treatment
5.6.1 Market Size by Region, 2023-2033 (US$ Million)
5.6.2 Market Share by Region, 2023 & 2033 (%)
6 AI in Oncology Market Analysis by End-user
6.1 Key Findings
6.2 End-user Segment: Market Attractiveness Index
6.3 AI in Oncology Market Size Estimation and Forecast by End-user
6.4 Pharmaceutical and Biopharmaceutical Companies
6.4.1 Market Size by Region, 2023-2033 (US$ Million)
6.4.2 Market Share by Region, 2023 & 2033 (%)
6.5 Research Institutes
6.5.1 Market Size by Region, 2023-2033 (US$ Million)
6.5.2 Market Share by Region, 2023 & 2033 (%)
6.6 Hospitals and Diagnostic Centres
6.6.1 Market Size by Region, 2023-2033 (US$ Million)
6.6.2 Market Share by Region, 2023 & 2033 (%)
6.7 Others
6.7.1 Market Size by Region, 2023-2033 (US$ Million)
6.7.2 Market Share by Region, 2023 & 2033 (%)
7 AI in Oncology Market Analysis by Disease Type
7.1 Key Findings
7.2 Disease Type Segment: Market Attractiveness Index
7.3 AI in Oncology Market Size Estimation and Forecast by Disease Type
7.4 Lung Cancer
7.4.1 Market Size by Region, 2023-2033 (US$ Million)
7.4.2 Market Share by Region, 2023 & 2033 (%)
7.5 Breast Cancer
7.5.1 Market Size by Region, 2023-2033 (US$ Million)
7.5.2 Market Share by Region, 2023 & 2033 (%)
7.6 Prostate Cancer
7.6.1 Market Size by Region, 2023-2033 (US$ Million)
7.6.2 Market Share by Region, 2023 & 2033 (%)
7.7 Colon Cancer
7.7.1 Market Size by Region, 2023-2033 (US$ Million)
7.7.2 Market Share by Region, 2023 & 2033 (%)
7.8 Others
7.8.1 Market Size by Region, 2023-2033 (US$ Million)
7.8.2 Market Share by Region, 2023 & 2033 (%)
8 AI in Oncology Market Analysis by Region
8.1 Key Findings
8.2 Regional Market Size Estimation and Forecast
9 North America AI in Oncology Market Analysis
9.1 Key Findings
9.2 North America AI in Oncology Market Attractiveness Index
9.3 North America AI in Oncology Market by Country, 2023, 2028 & 2033 (US$ Million)
9.4 North America AI in Oncology Market Size Estimation and Forecast by Country
9.5 North America AI in Oncology Market Size Estimation and Forecast by Product Type
9.6 North America AI in Oncology Market Size Estimation and Forecast by Usage Type
9.7 North America AI in Oncology Market Size Estimation and Forecast by End-user
9.8 North America AI in Oncology Market Size Estimation and Forecast by Disease Type
9.9 U.S. AI in Oncology Market Analysis
9.10 Canada AI in Oncology Market Analysis
10 Europe AI in Oncology Market Analysis
10.1 Key Findings
10.2 Europe AI in Oncology Market Attractiveness Index
10.3 Europe AI in Oncology Market by Country, 2023, 2028 & 2033 (US$ Million)
10.4 Europe AI in Oncology Market Size Estimation and Forecast by Country
10.5 Europe AI in Oncology Market Size Estimation and Forecast by Product Type
10.6 Europe AI in Oncology Market Size Estimation and Forecast by Usage Type
10.7 Europe AI in Oncology Market Size Estimation and Forecast by End-user
10.8 Europe AI in Oncology Market Size Estimation and Forecast by Disease Type
10.9 Germany AI in Oncology Market Analysis
10.10 France AI in Oncology Market Analysis
10.11 UK AI in Oncology Market Analysis
10.12 Italy AI in Oncology Market Analysis
10.13 Spain AI in Oncology Market Analysis
10.14 Russia AI in Oncology Market Analysis
10.15 Rest of Europe AI in Oncology Market Analysis
11 Asia Pacific AI in Oncology Market Analysis
11.1 Key Findings
11.2 Asia Pacific AI in Oncology Market Attractiveness Index
11.3 Asia Pacific AI in Oncology Market by Country, 2023, 2028 & 2033 (US$ Million)
11.4 Asia Pacific AI in Oncology Market Size Estimation and Forecast by Country
11.5 Asia Pacific AI in Oncology Market Size Estimation and Forecast by Product Type
11.6 Asia Pacific AI in Oncology Market Size Estimation and Forecast by Usage Type
11.7 Asia Pacific AI in Oncology Market Size Estimation and Forecast by End-user
11.8 Asia Pacific AI in Oncology Market Size Estimation and Forecast by Disease Type
11.9 Japan AI in Oncology Market Analysis
11.10 China AI in Oncology Market Analysis
11.11 India AI in Oncology Market Analysis
11.12 Australia AI in Oncology Market Analysis
11.13 South Korea AI in Oncology Market Analysis
11.14 Singapore AI in Oncology Market Analysis
11.15 Rest of Asia Pacific AI in Oncology Market Analysis
12 Latin America AI in Oncology Market Analysis
12.1 Key Findings
12.2 Latin America AI in Oncology Market Attractiveness Index
12.3 Latin America AI in Oncology Market by Country, 2023, 2028 & 2033 (US$ Million)
12.4 Latin America AI in Oncology Market Size Estimation and Forecast by Country
12.5 Latin America AI in Oncology Market Size Estimation and Forecast by Product Type
12.6 Latin America AI in Oncology Market Size Estimation and Forecast by Usage Type
12.7 Latin America AI in Oncology Market Size Estimation and Forecast by End-user
12.8 Latin America AI in Oncology Market Size Estimation and Forecast by Disease Type
12.9 Brazil AI in Oncology Market Analysis
12.10 Mexico AI in Oncology Market Analysis
12.11 Argentina AI in Oncology Market Analysis
12.12 Colombia AI in Oncology Market Analysis
12.13 Rest of Latin America AI in Oncology Market Analysis
13 MEA AI in Oncology Market Analysis
13.1 Key Findings
13.2 MEA AI in Oncology Market Attractiveness Index
13.3 MEA AI in Oncology Market by Country, 2023, 2028 & 2033 (US$ Million)
13.4 MEA AI in Oncology Market Size Estimation and Forecast by Country
13.5 MEA AI in Oncology Market Size Estimation and Forecast by Product Type
13.6 MEA AI in Oncology Market Size Estimation and Forecast by Usage Type
13.7 MEA AI in Oncology Market Size Estimation and Forecast by End-user
13.8 MEA AI in Oncology Market Size Estimation and Forecast by Disease Type
13.9 GCC AI in Oncology Market Analysis
13.10 South Africa AI in Oncology Market Analysis
13.11 Rest of MEA AI in Oncology Market Analysis
14 Company Profiles
14.1 Competitive Landscape, 2022
14.2 Strategic Outlook
14.3 IBM Corporation
14.3.1 Company Snapshot
14.3.2 Company Overview
14.3.3 Financial Analysis
14.3.3.1 Net Revenue, 2017-2022
14.3.3.2 R&D, 2017-2022
14.3.3.3 Regional Market Shares, 2022
14.3.4 Product Benchmarking
14.3.5 Strategic Outlook
14.4 GE Healthcare
14.4.1 Company Snapshot
14.4.2 Company Overview
14.4.3 Financial Analysis
14.4.3.1 Net Revenue, 2019-2022
14.4.3.2 R&D, 2019-2022
14.4.3.3 Regional Market Shares, 2022
14.4.4 Product Benchmarking
14.4.5 Strategic Outlook
14.5 iCAD
14.5.1 Company Snapshot
14.5.2 Company Overview
14.5.3 Financial Analysis
14.5.3.1 Net Revenue, 2017-2022
14.5.3.2 R&D, 2017-2022
14.5.4 Product Benchmarking
14.5.5 Strategic Outlook
14.6 Siemen's Healthineers
14.6.1 Company Snapshot
14.6.2 Company Overview
14.6.3 Financial Analysis
14.6.3.1 Net Revenue, 2018-2022
14.6.3.2 R&D, 2018-2022
14.6.4 Product Benchmarking
14.6.5 Strategic Outlook
14.7 Google Health
14.7.1 Company Snapshot
14.7.2 Company Overview
14.7.3 Financial Analysis
14.7.3.1 Net Revenue, 2017-2022
14.7.3.2 R&D, 2017-2022
14.7.4 Product Benchmarking
14.7.5 Strategic Outlook
14.8 Intel Corporation
14.8.1 Company Snapshot
14.8.2 Company Overview
14.8.3 Financial Analysis
14.8.3.1 Net Revenue, 2017-2022
14.8.3.2 R&D, 2017-2022
14.8.4 Product Benchmarking
14.8.5 Strategic Outlook
14.9 NVIDIA
14.9.1 Company Snapshot
14.9.2 Company Overview
14.9.3 Financial Analysis
14.9.3.1 Net Revenue, 2017-2022
14.9.3.2 R&D, 2017-2022
14.9.3.3 Regional Market Shares, 2022
14.9.4 Product Benchmarking
14.9.5 Service Benchmarking
14.9.6 Strategic Outlook
14.10 Azra AI
14.10.1 Company Snapshot
14.10.2 Company Overview
14.10.3 Product Benchmarking
14.10.4 Strategic Outlook
14.11 ConcertAI
14.11.1 Company Snapshot
14.11.2 Company Overview
14.11.3 Product Benchmarking
14.11.4 Service Benchmarking
14.11.5 Strategic Outlook
14.12 Digital Diagnostics
14.12.1 Company Snapshot
14.12.2 Company Overview
14.12.3 Product Benchmarking
14.12.4 Strategic Outlook
14.13 CloudMedX Health
14.13.1 Company Snapshot
14.13.2 Company Overview
14.13.3 Product Benchmarking
14.13.4 Strategic Outlook
14.14 Enlitic
14.14.1 Company Snapshot
14.14.2 Company Overview
14.14.3 Product Benchmarking
14.14.4 Service Benchmarking
14.14.5 Strategic Outlook
14.15 SkinVision
14.15.1 Company Snapshot
14.15.2 Company Overview
14.15.3 Product Benchmarking
14.15.4 Strategic Outlook
14.16 Therapixel
14.16.1 Company Snapshot
14.16.2 Company Overview
14.16.3 Product Benchmarking
14.16.4 Strategic Outlook
14.17 Botkin.AI
14.17.1 Company Snapshot
14.17.2 Company Overview
14.17.3 Product Benchmarking
14.17.4 Strategic Outlook
14.18 Owkin
14.18.1 Company Snapshot
14.18.2 Company Overview
14.18.3 Product Benchmarking
14.18.4 Strategic Outlook
15 Conclusion and Recommendations
15.1 Concluding Remarks from Visiongain
15.2 Recommendations for Market Players
List of Tables
Table 1 AI in Oncology Market Snapshot, 2023 & 2033 (US$ Million, CAGR %)
Table 2 AI in Oncology Market Forecast by Region, 2023-2033 (US$ Million, AGR%, CAGR%): “V” Shaped Recovery
Table 3 AI in Oncology Market Forecast by Region, 2023-2033 (US$ Million, AGR%, CAGR%): “U” Shaped Recovery
Table 4 AI in Oncology Market Forecast by Region, 2023-2033 (US$ Million, AGR%, CAGR%): “W” Shaped Recovery
Table 5 AI in Oncology Market Forecast by Region, 2023-2033 (US$ Million, AGR%, CAGR%): “L” Shaped Recovery
Table 6 AI in Oncology Market Forecast by Product Type, 2023-2033 (US$ Million, AGR%, CAGR%)
Table 7 Software Segment Market Forecast by Region, 2023-2033 (US$ Million, AGR%, CAGR%)
Table 8 Hardware Segment Market Forecast by Region, 2023-2033 (US$ Million, AGR%, CAGR%)
Table 9 Services Segment Market Forecast by Region, 2023-2033 (US$ Million, AGR%, CAGR%)
Table 10 AI in Oncology Market Forecast by Usage Type, 2023-2033 (US$ Million, AGR%, CAGR%)
Table 11 Cancer Research Segment Market Forecast by Region, 2023-2033 (US$ Million, AGR%, CAGR%)
Table 12 Pre-screening and Diagnosis Segment Market Forecast by Region, 2023-2033 (US$ Million, AGR%, CAGR%)
Table 13 Treatment Segment Market Forecast by Region, 2023-2033 (US$ Million, AGR%, CAGR%)
Table 14 AI in Oncology Market Forecast by End-user, 2023-2033 (US$ Million, AGR%, CAGR%)
Table 15 Pharmaceutical and Biopharmaceutical Companies Segment Market Forecast by Region, 2023-2033 (US$ Million, AGR%, CAGR%)
Table 16 Research Institutes Segment Market Forecast by Region, 2023-2033 (US$ Million, AGR%, CAGR%)
Table 17 Hospitals and Diagnostic Centres Segment Market Forecast by Region, 2023-2033 (US$ Million, AGR%, CAGR%)
Table 18 Others Segment Market Forecast by Region, 2023-2033 (US$ Million, AGR%, CAGR%)
Table 19 AI in Oncology Market Forecast by Disease Type, 2023-2033 (US$ Million, AGR%, CAGR%)
Table 20 Lung Cancer Segment Market Forecast by Region, 2023-2033 (US$ Million, AGR%, CAGR%)
Table 21 Breast Cancer Segment Market Forecast by Region, 2023-2033 (US$ Million, AGR%, CAGR%)
Table 22 Prostate Cancer Market Forecast by Region, 2023-2033 (US$ Million, AGR%, CAGR%)
Table 23 Colon Cancer Segment Market Forecast by Region, 2023-2033 (US$ Million, AGR%, CAGR%)
Table 24 Others Segment Market Forecast by Region, 2023-2033 (US$ Million, AGR%, CAGR%)
Table 25 AI in Oncology Market Forecast by Region, 2023-2033 (US$ Million, AGR%, CAGR%)
Table 26 North America AI in Oncology Market Forecast by Country, 2023-2033 (US$ Million, AGR%, CAGR%)
Table 27 North America AI in Oncology Market Forecast by Product Type, 2023-2033 (US$ Million, AGR%, CAGR%)
Table 28 North America AI in Oncology Market Forecast by Usage Type, 2023-2033 (US$ Million, AGR%, CAGR%)
Table 29 North America AI in Oncology Market Forecast by End-user, 2023-2033 (US$ Million, AGR%, CAGR%)
Table 30 North America AI in Oncology Market Forecast by Disease Type, 2023-2033 (US$ Million, AGR%, CAGR%)
Table 31 U.S. AI in Oncology Market Forecast, 2023-2033 (US$ Million, AGR%, CAGR%)
Table 32 Canada AI in Oncology Market Forecast, 2023-2033 (US$ Million, AGR%, CAGR%)
Table 33 Europe AI in Oncology Market Forecast by Country, 2023-2033 (US$ Million, AGR%, CAGR %)
Table 34 Europe AI in Oncology Market Forecast by Product Type, 2023-2033 (US$ Million, AGR%, CAGR%)
Table 35 Europe AI in Oncology Market Forecast by Usage Type, 2023-2033 (US$ Million, AGR%, CAGR%)
Table 36 Europe AI in Oncology Market Forecast by End-user, 2023-2033 (US$ Million, AGR%, CAGR%)
Table 37 Europe AI in Oncology Market Forecast by Disease Type, 2023-2033 (US$ Million, AGR%, CAGR%)
Table 38 Germany AI in Oncology Market Forecast, 2023-2033 (US$ Million, AGR%, CAGR%)
Table 39 France AI in Oncology Market Forecast, 2023-2033 (US$ Million, AGR%, CAGR%)
Table 40 UK AI in Oncology Market Forecast, 2023-2033 (US$ Million, AGR%, CAGR%)
Table 41 Italy AI in Oncology Market Forecast, 2023-2033 (US$ Million, AGR%, CAGR%)
Table 42 Spain AI in Oncology Market Forecast, 2023-2033 (US$ Million, AGR%, CAGR%)
Table 43 Russia AI in Oncology Market Forecast, 2023-2033 (US$ Million, AGR%, CAGR%)
Table 44 Rest of Europe AI in Oncology Market Forecast, 2023-2033 (US$ Million, AGR%, CAGR%)
Table 45 Asia Pacific AI in Oncology Market Forecast by Country, 2023-2033 (US$ Million, AGR%, CAGR%)
Table 46 Asia Pacific AI in Oncology Market Forecast by Product Type, 2023-2033 (US$ Million, AGR%, CAGR%)
Table 47 Asia Pacific AI in Oncology Market Forecast by Usage Type, 2023-2033 (US$ Million, AGR%, CAGR%)
Table 48 Asia Pacific AI in Oncology Market Forecast by End-user, 2023-2033 (US$ Million, AGR%, CAGR%)
Table 49 Asia Pacific AI in Oncology Market Forecast by Disease Type, 2023-2033 (US$ Million, AGR%, CAGR%)
Table 50 Japan AI in Oncology Market Forecast, 2023-2033 (US$ Million, AGR%, CAGR%)
Table 51 China AI in Oncology Market Forecast, 2023-2033 (US$ Million, AGR%, CAGR%)
Table 52 India AI in Oncology Market Forecast, 2023-2033 (US$ Million, AGR%, CAGR%)
Table 53 Australia AI in Oncology Market Forecast, 2023-2033 (US$ Million, AGR%, CAGR%)
Table 54 South Korea AI in Oncology Market Forecast, 2023-2033 (US$ Million, AGR%, CAGR %)
Table 55 Singapore AI in Oncology Market Forecast, 2023-2033 (US$ Million, AGR%, CAGR %)
Table 56 Rest of Asia Pacific AI in Oncology Market Forecast, 2023-2033 (US$ Million, AGR%, CAGR%)
Table 57 Latin America AI in Oncology Market Forecast by Country, 2023-2033 (US$ Million, AGR%, CAGR%)
Table 58 Latin America AI in Oncology Market Forecast by Product Type, 2023-2033 (US$ Million, AGR%, CAGR%)
Table 59 Latin America AI in Oncology Market Forecast by Usage Type, 2023-2033 (US$ Million, AGR%, CAGR%)
Table 60 Latin America AI in Oncology Market Forecast by End-user, 2023-2033 (US$ Million, AGR%, CAGR%)
Table 61 Latin America AI in Oncology Market Forecast by Disease Type, 2023-2033 (US$ Million, AGR%, CAGR%)
Table 62 Brazil AI in Oncology Market Forecast, 2023-2033 (US$ Million, AGR%, CAGR%)
Table 63 Mexico AI in Oncology Market Forecast, 2023-2033 (US$ Million, AGR%, CAGR%)
Table 64 Argentina AI in Oncology Market Forecast, 2023-2033 (US$ Million, AGR%, CAGR %)
Table 65 Colombia AI in Oncology Market Forecast, 2023-2033 (US$ Million, AGR%, CAGR %)
Table 66 Rest of Latin America AI in Oncology Market Forecast, 2023-2033 (US$ Million, AGR%, CAGR%)
Table 67 MEA AI in Oncology Market Forecast by Country, 2023-2033 (US$ Million, AGR%, CAGR%)
Table 68 MEA AI in Oncology Market Forecast by Product Type, 2023-2033 (US$ Million, AGR%, CAGR%)
Table 69 MEA AI in Oncology Market Forecast by Usage Type, 2023-2033 (US$ Million, AGR%, CAGR%)
Table 70 MEA AI in Oncology Market Forecast by End-user, 2023-2033 (US$ Million, AGR%, CAGR%)
Table 71 MEA AI in Oncology Market Forecast by Disease Type, 2023-2033 (US$ Million, AGR%, CAGR%)
Table 72 GCC AI in Oncology Market Forecast, 2023-2033 (US$ Million, AGR%, CAGR%)
Table 73 South Africa AI in Oncology Market Forecast, 2023-2033 (US$ Million, AGR%, CAGR%)
Table 74 Rest of MEA AI in Oncology Market Forecast, 2023-2033 (US$ Million, AGR%, CAGR%)
Table 75 Strategic Outlook
Table 76 IBM Corporation: Key Details, (CEO, HQ, Revenue, Founded, No. of Employees, Company Type, Website, Business Segment)
Table 77 IBM Corporation: Product Benchmarking
Table 78 IBM Corporation: Product
Table 79 IBM Corporation: Strategic Outlook
Table 80 GE Healthcare: Key Details, (CEO, HQ, Revenue, Founded, No. of Employees, Company Type, Website, Business Segment)
Table 81 GE Healthcare: Product Benchmarking
Table 82 GE Healthcare: Strategic Outlook
Table 83 iCAD: Key Details, (CEO, HQ, Revenue, Founded, No. of Employees, Company Type, Website, Business Segment)
Table 84 iCAD: Product Benchmarking
Table 85 iCAD: Strategic Outlook
Table 86 Siemens Healthineers: Key Details, (CEO, HQ, Revenue, Founded, No. of Employees, Company Type, Website, Business Segment)
Table 87 Google Health: Key Details, (CEO, HQ, Revenue, Founded, No. of Employees, Company Type, Website, Business Segment)
Table 88 Google: Product Benchmarking
Table 89 Google: Strategic Outlook
Table 90 Intel: Key Details, (CEO, HQ, Revenue, Founded, No. of Employees, Company Type, Website, Business Segment)
Table 91 Intel: Product Benchmarking
Table 92 Intel: Strategic Outlook
Table 93 NVIDIA: Key Details, (CEO, HQ, Revenue, Founded, No. of Employees, Company Type, Website, Business Segment)
Table 94 NVIDIA: Product Benchmarking
Table 95 NVIDIA: Product Benchmarking
Table 96 NVIDIA: Strategic Outlook
Table 97 Azra AI: Key Details, (CEO, HQ, Revenue, Founded, No. of Employees, Company Type, Website, Business Segment)
Table 98 Azra AI: Product Benchmarking
Table 99 Azra AI: Strategic Outlook
Table 100 ConcertAI: Key Details, (CEO, HQ, Revenue, Founded, No. of Employees, Company Type, Website, Business Segment)
Table 101 ConcertAI: Product Benchmarking
Table 102 ConcertAI: Service Benchmarking
Table 103 ConcertAI: Strategic Outlook
Table 104 Digital Diagnostics: Key Details, (CEO, HQ, Revenue, Founded, No. of Employees, Company Type, Website, Business Segment)
Table 105 Digital Diagnostics: Product Benchmarking
Table 106 Digital Diagnostics: Strategic Outlook
Table 107 CloudMedX Health: Key Details, (CEO, HQ, Revenue, Founded, No. of Employees, Company Type, Website, Business Segment)
Table 108 CloudMedx Health: Product Benchmarking
Table 109 CloudMedx Health: Strategic Outlook
Table 110 Enlitic: Key Details, (CEO, HQ, Revenue, Founded, No. of Employees, Company Type, Website, Business Segment)
Table 111 Enlitic: Product Benchmarking
Table 112 Enlitic: Service Benchmarking
Table 113 Enlitic: Strategic Outlook
Table 114 SkinVision: Key Details, (CEO, HQ, Revenue, Founded, No. of Employees, Company Type, Website, Business Segment)
Table 115 SkinVision: Product Benchmarking
Table 116 SkinVision : Strategic Outlook
Table 117 Owkin: Key Details, (CEO, HQ, Revenue, Founded, No. of Employees, Company Type, Website, Business Segment)
Table 118 Therapixel: Product Benchmarking
Table 119 Therapixel: Strategic Outlook
Table 120 Botkin.AI: Key Details, (CEO, HQ, Revenue, Founded, No. of Employees, Company Type, Website, Business Segment)
Table 121 Botkin.AI: Product Benchmarking
Table 122 Botkin.AI: Strategic Outlook
Table 123 Owkin: Key Details, (CEO, HQ, Revenue, Founded, No. of Employees, Company Type, Website, Business Segment)
Table 124 Owkin: Product Benchmarking
Table 125 Owkin: Strategic Outlook
List of Figures
Figure 1 AI in Oncology Market Segmentation
Figure 2 AI in Oncology Market by Product Type: Market Attractiveness Index
Figure 3 AI in Oncology Market by Usage Type: Market Attractiveness Index
Figure 4 AI in Oncology Market by Disease Type: Market Attractiveness Index
Figure 5 AI in Oncology Market by End-user: Market Attractiveness Index
Figure 6 AI in Oncology Market Attractiveness Index by Region
Figure 7 AI in Oncology Market: Market Dynamics
Figure 8 AI in Oncology Market by Region, 2023-2033 (US$ Million, AGR %): “V” Shaped Recovery
Figure 9 AI in Oncology Market by Region, 2023-2033 (US$ Million, AGR %): “U” Shaped Recovery
Figure 10 AI in Oncology Market by Region, 2023-2033 (US$ Million, AGR %): “W” Shaped Recovery
Figure 11 AI in Oncology Market by Region, 2023-2033 (US$ Million, AGR %): “L” Shaped Recovery
Figure 12 AI in Oncology Market: Porter’s Five Forces Analysis
Figure 13 AI in Oncology Market: PEST Analysis
Figure 14 AI in Oncology Market by Product Type: Market Attractiveness Index
Figure 15 AI in Oncology Market Forecast by Product Type, 2023-2033 (US$ Million, AGR %)
Figure 16 AI in Oncology Market Share Forecast by Product Type, 2023, 2028, 2033 (%)
Figure 17 Software Segment Market Forecast by Region, 2023-2033 (US$ Million, AGR %)
Figure 18 Software Segment Market Share Forecast by Region, 2023 & 2033 (%)
Figure 19 Hardware Segment Market Forecast by Region, 2023-2033 (US$ Million, AGR %)
Figure 20 Hardware Segment Market Share Forecast by Region, 2023 & 2033 (%)
Figure 21 Services Segment Market Forecast by Region, 2023-2033 (US$ Million, AGR %)
Figure 22 Services Segment Market Share Forecast by Region, 2023 & 2033 (%)
Figure 23 AI in Oncology Market by Usage Type: Market Attractiveness Index
Figure 24 AI in Oncology Market Forecast by Usage Type, 2023-2033 (US$ Million, AGR %)
Figure 25 AI in Oncology Market Share Forecast by Usage Type, 2023, 2028, 2033 (%)
Figure 26 Cancer Research Segment Market Forecast by Region, 2023-2033 (US$ Million, AGR %)
Figure 27 Cancer Research Segment Market Share Forecast by Region, 2023 & 2033 (%)
Figure 28 Pre-screening and Diagnosis Segment Market Forecast by Region, 2023-2033 (US$ Million, AGR %)
Figure 29 Pre-screening and Diagnosis Segment Market Share Forecast by Region, 2023 & 2033 (%)
Figure 30 Treatment Segment Market Forecast by Region, 2023-2033 (US$ Million, AGR %)
Figure 31 Treatment Segment Market Share Forecast by Region, 2023 & 2033 (%)
Figure 32 AI in Oncology Market by End-user: Market Attractiveness Index
Figure 33 AI in Oncology Market Forecast by End-user, 2023-2033 (US$ Million, AGR %)
Figure 34 AI in Oncology Market Share Forecast by End-user, 2023, 2028, 2033 (%)
Figure 35 Pharmaceutical and Biopharmaceutical Companies Research Segment Market Forecast by Region, 2023-2033 (US$ Million, AGR %)
Figure 36 Pharmaceutical and Biopharmaceutical Companies Segment Market Share Forecast by Region, 2023 & 2033 (%)
Figure 37 Research Institutes Segment Market Forecast by Region, 2023-2033 (US$ Million, AGR %)
Figure 38 Research Institutes Segment Market Share Forecast by Region, 2023 & 2033 (%)
Figure 39 Hospital and Diagnostic Centres Segment Market Forecast by Region, 2023-2033 (US$ Million, AGR %)
Figure 40 Hospital and Diagnostic Centres Segment Market Share Forecast by Region, 2023 & 2033 (%)
Figure 41 Others Segment Market Forecast by Region, 2023-2033 (US$ Million, AGR %)
Figure 42 Others Segment Market Share Forecast by Region, 2023 & 2033 (%)
Figure 43 AI in Oncology Market by Disease Type: Market Attractiveness Index
Figure 44 AI in Oncology Market Forecast by Disease Type, 2023-2033 (US$ Million, AGR %)
Figure 45 AI in Oncology Market Share Forecast by Disease Type, 2023, 2028, 2033 (%)
Figure 46 Lung Cancer Market Forecast by Region, 2023-2033 (US$ Million, AGR %)
Figure 47 Lung Cancer Segment Market Share Forecast by Region, 2023 & 2033 (%)
Figure 48 Breast Cancer Segment Market Forecast by Region, 2023-2033 (US$ Million, AGR %)
Figure 49 Breast Cancer Segment Market Share Forecast by Region, 2023 & 2033 (%)
Figure 50 Prostate Cancer Segment Market Forecast by Region, 2023-2033 (US$ Million, AGR %)
Figure 51 Prostate Cancer Segment Market Share Forecast by Region, 2023 & 2033 (%)
Figure 52 Colon Cancer Segment Market Forecast by Region, 2023-2033 (US$ Million, AGR %)
Figure 53 Colon Cancer Segment Market Share Forecast by Region, 2023 & 2033 (%)
Figure 54 Others Segment Market Forecast by Region, 2023-2033 (US$ Million, AGR %)
Figure 55 Others Segment Market Share Forecast by Region, 2023 & 2033 (%)
Figure 56 AI in Oncology Market Forecast by Region 2023 and 2033 (Revenue, CAGR%)
Figure 57 AI in Oncology Market Share Forecast by Region 2023, 2028, 2033 (%)
Figure 58 AI in Oncology Market by Region, 2023-2033 (US$ Million, AGR %)
Figure 59 North America AI in Oncology Market Attractiveness Index
Figure 60 North America AI in Oncology Market by Region, 2023, 2028 & 2033 (US$ Million)
Figure 61 North America AI in Oncology Market Forecast by Country, 2023-2033 (US$ Million, AGR %)
Figure 62 North America AI in Oncology Market Share Forecast by Country, 2023 & 2033 (%)
Figure 63 North America AI in Oncology Market Forecast by Product Type, 2023-2033 (US$ Million, AGR %)
Figure 64 North America AI in Oncology Market Share Forecast by Product Type, 2023 & 2033 (%)
Figure 65 North America AI in Oncology Market Forecast by Usage Type, 2023-2033 (US$ Million, AGR %)
Figure 66 North America AI in Oncology Market Share Forecast by Usage Type, 2023 & 2033 (%)
Figure 67 North America AI in Oncology Market Forecast by End-user, 2023-2033 (US$ Million, AGR %)
Figure 68 North America AI in Oncology Market Share Forecast by End-user, 2023 & 2033 (%)
Figure 69 North America AI in Oncology Market Forecast by Disease Type, 2023-2033 (US$ Million, AGR %)
Figure 70 North America AI in Oncology Market Share Forecast by Disease Type, 2023 & 2033 (%)
Figure 71 U.S. AI in Oncology Market Forecast, 2023-2033 (US$ Million, AGR %)
Figure 72 Canada AI in Oncology Market Forecast, 2023-2033 (US$ Million, AGR %)
Figure 73 Europe AI in Oncology Market Attractiveness Index
Figure 74 Europe AI in Oncology Market by Region, 2023, 2028 & 2033 (US$ Million)
Figure 75 Europe AI in Oncology Market Forecast by Country, 2023-2033 (US$ Million, AGR %)
Figure 76 Europe AI in Oncology Market Share Forecast by Country, 2023 & 2033 (%)
Figure 77 Europe AI in Oncology Market Forecast by Product Type, 2023-2033 (US$ Million, AGR %)
Figure 78 Europe AI in Oncology Market Share Forecast by Product Type, 2023 & 2033 (%)
Figure 79 Europe AI in Oncology Market Forecast by Usage Type, 2023-2033 (US$ Million, AGR %)
Figure 80 Europe AI in Oncology Market Share Forecast by Usage Type, 2023 & 2033 (%)
Figure 81 Europe AI in Oncology Market Forecast by End-user, 2023-2033 (US$ Million, AGR %)
Figure 82 Europe AI in Oncology Market Share Forecast by End-user, 2023 & 2033 (%)
Figure 83 Europe AI in Oncology Market Forecast by Disease Type, 2023-2033 (US$ Million, AGR %)
Figure 84 Europe AI in Oncology Market Share Forecast by Disease Type, 2023 & 2033 (%)
Figure 85 Germany AI in Oncology Market Forecast, 2023-2033 (US$ Million, AGR %)
Figure 86 France AI in Oncology Market Forecast, 2023-2033 (US$ Million, AGR %)
Figure 87 UK AI in Oncology Market Forecast, 2023-2033 (US$ Million, AGR %)
Figure 88 Italy AI in Oncology Market Forecast, 2023-2033 (US$ Million, AGR %)
Figure 89 Spain AI in Oncology Market Forecast, 2023-2033 (US$ Million, AGR %)
Figure 90 Russia AI in Oncology Market Forecast, 2023-2033 (US$ Million, AGR %)
Figure 91 Rest of Europe AI in Oncology Market Forecast, 2023-2033 (US$ Million, AGR %)
Figure 92 Asia Pacific AI in Oncology Market Attractiveness Index
Figure 93 Asia Pacific AI in Oncology Market by Region, 2023, 2028 & 2033 (US$ Million)
Figure 94 Asia Pacific AI in Oncology Market Forecast by Country, 2023-2033 (US$ Million, AGR %)
Figure 95 Asia Pacific AI in Oncology Market Share Forecast by Country, 2023 & 2033 (%)
Figure 96 Asia Pacific AI in Oncology Market Forecast by Product Type, 2023-2033 (US$ Million, AGR %)
Figure 97 Asia Pacific AI in Oncology Market Share Forecast by Product Type, 2023 & 2033 (%)
Figure 98 Asia Pacific AI in Oncology Market Forecast by Usage Type, 2023-2033 (US$ Million, AGR %)
Figure 99 Asia Pacific AI in Oncology Market Share Forecast by Usage Type, 2023 & 2033 (%)
Figure 100 Asia Pacific AI in Oncology Market Forecast by End-user, 2023-2033 (US$ Million, AGR %)
Figure 101 Asia Pacific AI in Oncology Market Share Forecast by End-user, 2023 & 2033 (%)
Figure 102 Asia Pacific AI in Oncology Market Forecast by Disease Type, 2023-2033 (US$ Million, AGR %)
Figure 103 Asia Pacific AI in Oncology Market Share Forecast by Disease Type, 2023 & 2033 (%)
Figure 104 Japan AI in Oncology Market Forecast, 2023-2033 (US$ Million, AGR %)
Figure 105 China AI in Oncology Market Forecast, 2023-2033 (US$ Million, AGR %)
Figure 106 India AI in Oncology Market Forecast, 2023-2033 (US$ Million, AGR %)
Figure 107 Australia AI in Oncology Market Forecast, 2023-2033 (US$ Million, AGR %)
Figure 108 South Korea AI in Oncology Market Forecast, 2023-2033 (US$ Million, AGR %)
Figure 109 Singapore AI in Oncology Market Forecast, 2023-2033 (US$ Million, AGR %)
Figure 110 Rest of Asia Pacific AI in Oncology Market Forecast, 2023-2033 (US$ Million, AGR %)
Figure 111 Latin America AI in Oncology Market Attractiveness Index
Figure 112 Latin America AI in Oncology Market by Region, 2023, 2028 & 2033 (US$ Million)
Figure 113 Latin America AI in Oncology Market Forecast by Country, 2023-2033 (US$ Million, AGR %)
Figure 114 Latin America AI in Oncology Market Share Forecast by Country, 2023 & 2033 (%)
Figure 115 Latin America AI in Oncology Market Forecast by Product Type, 2023-2033 (US$ Million, AGR %)
Figure 116 Latin America AI in Oncology Market Share Forecast by Product Type, 2023 & 2033 (%)
Figure 117 Latin America AI in Oncology Market Forecast by Usage Type, 2023-2033 (US$ Million, AGR %)
Figure 118 Latin America AI in Oncology Market Share Forecast by Usage Type, 2023 & 2033 (%)
Figure 119 Latin America AI in Oncology Market Forecast by End-user, 2023-2033 (US$ Million, AGR %)
Figure 120 Latin America AI in Oncology Market Share Forecast by End-user, 2023 & 2033 (%)
Figure 121 Latin America AI in Oncology Market Forecast by Disease Type, 2023-2033 (US$ Million, AGR %)
Figure 122 Latin America AI in Oncology Market Share Forecast by Disease Type, 2023 & 2033 (%)
Figure 123 Brazil AI in Oncology Market Forecast, 2023-2033 (US$ Million, AGR %)
Figure 124 Mexico AI in Oncology Market Forecast, 2023-2033 (US$ Million, AGR %)
Figure 125 Argentina AI in Oncology Market Forecast, 2023-2033 (US$ Million, AGR %)
Figure 126 Colombia AI in Oncology Market Forecast, 2023-2033 (US$ Million, AGR %)
Figure 127 Rest of Latin America AI in Oncology Market Forecast, 2023-2033 (US$ Million, AGR %)
Figure 128 MEA AI in Oncology Market Attractiveness Index
Figure 129 MEA AI in Oncology Market by Region, 2023, 2028 & 2033 (US$ Million)
Figure 130 MEA AI in Oncology Market Forecast by Country, 2023-2033 (US$ Million, AGR %)
Figure 131 MEA AI in Oncology Market Share Forecast by Country, 2023 & 2033 (%)
Figure 132 MEA AI in Oncology Market Forecast by Product Type, 2023-2033 (US$ Million, AGR %)
Figure 133 MEA AI in Oncology Market Share Forecast by Product Type, 2023 & 2033 (%)
Figure 134 MEA AI in Oncology Market Forecast by Usage Type, 2023-2033 (US$ Million, AGR %)
Figure 135 MEA AI in Oncology Market Share Forecast by Usage Type, 2023 & 2033 (%)
Figure 136 MEA AI in Oncology Market Forecast by End-user, 2023-2033 (US$ Million, AGR %)
Figure 137 MEA AI in Oncology Market Share Forecast by End-user, 2023 & 2033 (%)
Figure 138 MEA AI in Oncology Market Forecast by Disease Type, 2023-2033 (US$ Million, AGR %)
Figure 139 MEA AI in Oncology Market Share Forecast by Disease Type, 2023 & 2033 (%)
Figure 140 GCC AI in Oncology Market Forecast, 2023-2033 (US$ Million, AGR %)
Figure 141 South Africa AI in Oncology Market Forecast, 2023-2033 (US$ Million, AGR %)
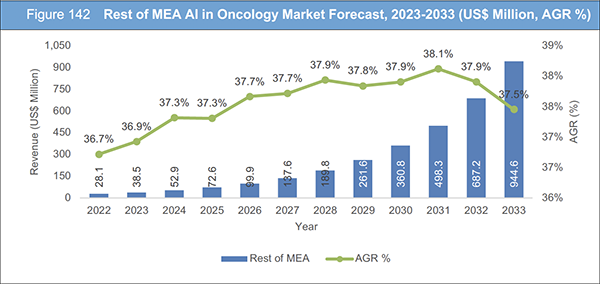
Figure 142 Rest of MEA AI in Oncology Market Forecast, 2023-2033 (US$ Million, AGR %)
Figure 143 AI in Oncology Market: Company Share/Ranking, 2022
Figure 144 IBM Corporation: Net Revenue, 2017-2022 (US$ Million, AGR%)
Figure 145 IBM: R&D, 2017-2022 (US$ Million, AGR %)
Figure 146 IBM: Regional Market Shares, 2022
Figure 147 GE Healthcare: Net Revenue, 2019-2022 (US$ Million, AGR%)
Figure 148 GE Healthcare: R&D, 2019-2022 (US$ Million, AGR%)
Figure 149 GE Healthcare: Regional Market Shares, 2022
Figure 150 iCAD: Net Revenue, 2017-2022 (US$ Million, AGR%)
Figure 151 iCAD: R&D, 2017-2022 (US$ Million, AGR%)
Figure 152 Siemens Healthineers: Net Revenue, 2018-2022 (US$ Million, AGR%)
Figure 153 Siemens Healthineers: R&D, 2018-2022 (US$ Million, AGR%)
Figure 154 Siemens Healthineers: Product Benchmarking
Figure 155 Siemens Healthineers: Strategic Outlook
Figure 156 Google: Net Revenue, 2017-2022 (US$ Million, AGR%)
Figure 157 Google: R&D, 2017-2022 (US$ Million, AGR%)
Figure 158 Intel: Net Revenue, 2017-2022 (US$ Million, AGR%)
Figure 159 Intel: R&D, 2017-2022 (US$ Million, AGR%)
Figure 160 NVIDIA: Net Revenue, 2017-2022 (US$ Million, AGR%)
Figure 161 NVIDIA: R&D, 2017-2022 (US$ Million, AGR%)
Figure 162 NVIDIA: Regional Market Shares, 2022
Azra AI
Botkin.AI
CloudMedX
ConcertAI
Digital Diagnostics
Enlitic
GE Healthcare
Google Health
IBM Corporation
iCAD
Intel
NVIDIA
Owkin
Siemen's Healthineers
SkinVision
Therapixel
List of Other Companies Mentioned in the Report
Alphabet
AstraZeneca
BenevolentAI
Carebox Health
Exscientia
Kaitek Labs
Lumea
Medicsen AI
Moove Health
OncoBot
OncoMedicAI
Optellum
Philips
Sumitomo Dainippon Pharma
Tempus
Verily
List of Associations Mentioned in the Report
American Urological Association (AUA)
Chang Gung Memorial Hospital (CGMH)
Dana-Farber Cancer Institute
European Congress of Radiology (ECR)
Harvard Medical School
Heidelberg University Hospital
Institute Gustave Roussy
International Agency for Research on Cancer's (IARC)
Latin American and Caribbean Society of Medical Oncology
Leiden University Medical Centre (Leiden, The Netherlands)
Mass General Cancer Center (MGCC)
Memorial Sloan Kettering Cancer Center
National Cancer Institute (NCI)
National Cheng Kung University
National Comprehensive Cancer Network (NCCN)
Princess Margaret Cancer Centre
Support for People with Oral Head and Neck Cancer (SPOHNC)
The Dana-Farber Cancer Institute in Boston
The Massachusetts Institute of Technology (MIT's) Abdul Latif Jameel Clinic for Machine Learning in Health
University of California, Los Angeles (UCLA)
Download sample pages
Complete the form below to download your free sample pages for Artificial Intelligence (AI) in Oncology Market Report 2023-2033
Related reports
-
Precision Cancer Diagnostic Test Market Report 2024-2034
The global Precision Cancer Diagnostic Test Market is projected to grow at a CAGR of 16.1% by 2034...Full DetailsPublished: 17 January 2024 -

Cancer Biologics Market Report 2023-2033
The global Cancer Biologics market was estimated to be valued at US$ 115.9 billion in 2023 and is expected to...Full DetailsPublished: 22 June 2023 -
Artificial Intelligence (AI) in Genomics Market Report 2023-2033
The global Artificial Intelligence (AI) in Genomics market is projected to grow at a CAGR of 38.4% by 2033...Full DetailsPublished: 21 June 2023 -
Artificial Intelligence (AI) in Biopharmaceuticals Market Report 2023-2033
The global Artificial Intelligence (AI) in Biopharmaceuticals market was valued at US$ 1,030.7 million in 2022 and is projected to...Full DetailsPublished: 23 June 2023 -
Precision Cancer Diagnostic Test Market Report 2022-2032
The global precision cancer diagnostic test market was valued at US$14,087 million in 2021 and is projected to grow at...Full DetailsPublished: 08 June 2022 -
Artificial Intelligence (AI) in Precision Medicine Market Report 2023-2033
The global Artificial Intelligence (AI) in Precision Medicine market is projected to grow at a CAGR of 28.4% by 2033...Full DetailsPublished: 22 June 2023 -
Artificial Intelligence (AI) in Drug Discovery Market Report 2022-2032
The global artificial intelligence (AI) in drug discovery market was valued at US$791 million in 2021 and is projected to...Full DetailsPublished: 14 June 2022 -
Cancer Vaccines Market Report 2023-2033
The global Cancer Vaccines market is projected to grow at a CAGR of 14% by 2033...Full DetailsPublished: 23 August 2023
Download sample pages
Complete the form below to download your free sample pages for Artificial Intelligence (AI) in Oncology Market Report 2023-2033
Do you have any custom requirements we can help you with?
Any specific country, geo region, market segment or specific company information?
Email us today, we can discuss your needs and see how we can help: jamie.roberts@visiongain.com
Would you like a free report overview of the report of your choice?
If so, please drop an email to Jamie Roberts stating your chosen report title to jamie.roberts@visiongain.com
Visiongain’s reports are based on comprehensive primary and secondary research. Those studies provide global market forecasts (sales by drug and class, with sub-markets and leading nations covered) and analyses of market drivers and restraints (including SWOT analysis) and current pipeline developments. To find out more about our reports methodology, please email jamie.roberts@visiongain.com
“Thank you for this Gene Therapy R&D Market report and for how easy the process was. Your colleague was very helpful and the report is just right for my purpose. This is the 2nd good report from Visiongain and a good price.”
Dr Luz Chapa Azuella, Mexico
American Association of Colleges of Pharmacy
American College of Clinical Pharmacy
American Pharmacists Association
American Society for Pharmacy Law
American Society of Consultant Pharmacists
American Society of Health-System Pharmacists
Association of Special Pharmaceutical Manufacturers
Australian College of Pharmacy
Biotechnology Industry Organization
Canadian Pharmacists Association
Canadian Society of Hospital Pharmacists
Chinese Pharmaceutical Association
College of Psychiatric and Neurologic Pharmacists
Danish Association of Pharmaconomists
European Association of Employed Community Pharmacists in Europe
European Medicines Agency
Federal Drugs Agency
General Medical Council
Head of Medicines Agency
International Federation of Pharmaceutical Manufacturers & Associations
International Pharmaceutical Federation
International Pharmaceutical Students’ Federation
Medicines and Healthcare Products Regulatory Agency
National Pharmacy Association
Norwegian Pharmacy Association
Ontario Pharmacists Association
Pakistan Pharmacists Association
Pharmaceutical Association of Mauritius
Pharmaceutical Group of the European Union
Pharmaceutical Society of Australia
Pharmaceutical Society of Ireland
Pharmaceutical Society Of New Zealand
Pharmaceutical Society of Northern Ireland
Professional Compounding Centers of America
Royal Pharmaceutical Society
The American Association of Pharmaceutical Scientists
The BioIndustry Association
The Controlled Release Society
The European Federation of Pharmaceutical Industries and Associations
The European Personalised Medicine Association
The Institute of Clinical Research
The International Society for Pharmaceutical Engineering
The Pharmaceutical Association of Israel
The Pharmaceutical Research and Manufacturers of America
The Pharmacy Guild of Australia
The Society of Hospital Pharmacists of Australia
Latest Pharma news
Visiongain Publishes Drug Delivery Technologies Market Report 2024-2034
The global Drug Delivery Technologies market is estimated at US$1,729.6 billion in 2024 and is projected to grow at a CAGR of 5.5% during the forecast period 2024-2034.
23 April 2024
Visiongain Publishes Cell Therapy Technologies Market Report 2024-2034
The cell therapy technologies market is estimated at US$7,041.3 million in 2024 and is projected to grow at a CAGR of 10.7% during the forecast period 2024-2034.
18 April 2024
Visiongain Publishes Automation in Biopharma Industry Market Report 2024-2034
The global Automation in Biopharma Industry market is estimated at US$1,954.3 million in 2024 and is projected to grow at a CAGR of 7% during the forecast period 2024-2034.
17 April 2024
Visiongain Publishes Anti-obesity Drugs Market Report 2024-2034
The global Anti-obesity Drugs market is estimated at US$11,540.2 million in 2024 and is expected to register a CAGR of 21.2% from 2024 to 2034.
12 April 2024
