The Cancer Biologics Market Report 2023-2033: This report will prove invaluable to leading firms striving for new revenue pockets if they wish to better understand the industry and its underlying dynamics. It will be useful for companies that would like to expand into different industries or to expand their existing operations in a new region.
Increasing geriatric population will drive demand for cancer biologics therapy
Rising elderly population is one of the major factors driving the cancer biological therapy market growth. According to United Nation estimates, the global elderly population aged 60 years and above is set to double and reach over 2.1 billion by 2050 from over 962 million in 2017. Geriatric population is at a higher risk of acquiring various types of cancer such as lung cancer, colon cancer and breast cancer boosting the demand for cancer biological therapies. According to the National Center for Biotechnology Information (NCBI), cancer is one of the predominant causes of morbidity and mortality among the geriatric population base. Around 60% of all cancer cases and approximately 70% of cancer-related deaths occur in patients above 65 years of age. Thus, the increasing elderly population base suffering from cancer will propel the demand for cancer biological therapy, thereby fostering business growth.
Toxicity and Adverse Effects associated with Cancer Therapy
Anticancer drugs have severe side effects and its clinical usage for cancer therapy is limited by its toxicity. The adverse effects vary drug to drug for numerous reasons. They may be chronic or acute, mild, permanent, self-limited or potentially life threatening. Common side effects associated with the anti-cancer drugs include low blood counts that increase the possibility of developing infection or anaemia, mouth soreness, tiredness, nausea, loss of appetite, vomiting, constipation or diarrhoea, skin reactions, hair loss, pain or nerve changes. However, certain side effects can have long lasting or permanent effects. For example, certain chemotherapy drugs can result in infertility or the inability to father a child that may be permanent. Additionally, chemotherapy may lead to long-term damage to the lungs, heart, kidneys, and reproductive organs. Growing awareness among patients regarding side effects of cancer treatment may hamper patient preference towards the cancer therapy and can therefore impede the market growth during the coming years.
What Questions Should You Ask before Buying a Market Research Report?
• How is the Cancer Biologics Market evolving?
• What is driving and restraining the Cancer Biologics Market?
• How will each Cancer Biologics submarket segment grow over the forecast period and how much revenue will these submarkets account for in 2033?
• How will the market shares for each Cancer Biologics submarket develop from 2023 to 2033?
• What will be the main driver for the overall market from 2023 to 2033?
• Will leading Cancer Biologics Markets broadly follow the macroeconomic dynamics, or will individual national markets outperform others?
• How will the market shares of the national markets change by 2033 and which geographical region will lead the market in 2033?
• Who are the leading players and what are their prospects over the forecast period?
• What are the Cancer Biologics projects for these leading companies?
• How will the industry evolve during the period between 2023 and 2033? What are the implications of Cancer Biologics projects taking place now and over the next 10 years?
• Is there a greater need for product commercialisation to further scale the Cancer Biologics Market?
• Where is the Cancer Biologics Market heading and how can you ensure you are at the forefront of the market?
• What are the best investment options for new product and service lines?
• What are the key prospects for moving companies into a new growth path and C-suite?
You need to discover how this will impact the Cancer Biologics Market today, and over the next 10 years:
• Our 308-page report provides 117 tables and 187 charts/graphs exclusively to you.
• The report highlights key lucrative areas in the industry so you can target them – NOW.
• It contains in-depth analysis of global, regional and national sales and growth.
• It highlights for you the key successful trends, changes and revenue projections made by your competitors.
This report tells you TODAY how the Cancer Biologics Market will develop in the next 10 years, and in line with the variations in COVID-19 economic recession and bounce. This market is more critical now than at any point over the last 10 years.
Forecasts to 2033 and other analyses reveal commercial prospects
• In addition to revenue forecasting to 2033, our new study provides you with recent results, growth rates, and market shares.
• You will find original analyses, with business outlooks and developments.
• Discover qualitative analyses (including market dynamics, drivers, opportunities, restraints and challenges), cost structure, impact of rising Cancer Biologics prices and recent developments.
This report includes data analysis and invaluable insight into how COVID-19 will affect the industry and your company. Four COVID-19 recovery patterns and their impact, namely, “V”, “L”, “W” and “U” are discussed in this report.
Segments Covered in the Report
By Product
• Monoclonal Antibodies
– Naked Monoclonal Antibodies
– Conjugated Monoclonal Antibodies
– Bispecific Monoclonal Antibodies
• Vaccines
– Preventive Vaccines
– Therapeutic Vaccines
• Cancer Growth Blockers
– Tyrosine kinase Inhibitors (TKI)
– Proteasome Inhibitors (PI)
– mTOR Inhibitors
• Blood Cell Growth Factors
– Lenograstim
– Filgrastim
• Cytokine
– Interferons
– Interleukins
By Application
• Non-Small Cell Lung Cancer
• Prostate Cancer
• Breast Cancer
• Acute Myeloid Leukaemia
• Lymphoma
• Multiple Myeloma
• Ovarian Cancer
• Colorectal Cancer
• Gastric Cancers
• Other Applications
By Route of Administration
• Oral
• Injectable

Regional and Country level Market estimates:
North America
• U.S.
• Canada
Europe
• Germany
• UK
• France
• Spain
• Italy
• Rest of Europe
Asia Pacific
• China
• Japan
• India
• Australia
• South Korea
• Rest of Asia Pacific
Latin America
• Brazil
• Mexico
• Rest of Latin America Latin America
MEA
• GCC
• South Africa
• Rest of MEA
Need industry data? Please contact us today.
The report also includes profiles and for some of the leading companies in the Cancer Biologics Market, 2023 to 2033, with a focus on this segment of these companies’ operations.
Leading companies and the potential for market growth
• AbbVie
• Amgen
• Astellas Pharma
• AstraZeneca PLC
• Bristol Myers Squibb
• Eisai Co., Ltd
• Eli Lilly and company
• F. Hoffmann-La Roche Ltd
• Merck & Co., Inc.
• Novartis AG
• Takeda Pharmaceutical Company
Overall world revenue for Cancer biologics market, 2023 to 2033 in terms of value the market will surpass US$ 115.9 billion in 2023, our work calculates. We predict strong revenue growth through to 2033. Our work identifies which organizations hold the greatest potential. Discover their capabilities, progress, and commercial prospects, helping you stay ahead.
How will the Cancer biologics market, 2023 to 2033 report help you?
In summary, our 300+ page report provides you with the following knowledge:
• Revenue forecasts to 2033 for Cancer biologics market, 2023 to 2033 Market, with forecasts for product, application and route of administration, each forecast at a global and regional level – discover the industry’s prospects, finding the most lucrative places for investments and revenues.
• Revenue forecasts to 2033 for five regional and 16 key national markets – See forecasts for the Cancer biologics market, 2023 to 2033 market in North America, Europe, Asia-Pacific, Latin America, and MEA. Also forecasted is the market in the US, Canada, Mexico, Brazil, Germany, France, UK, Italy, China, India, Japan, and Australia among other prominent economies.
• Prospects for established firms and those seeking to enter the market – including company profiles for 11 of the major companies involved in the Cancer biologics market, 2023 to 2033.
Find quantitative and qualitative analyses with independent predictions. Receive information that only our report contains, staying informed with invaluable business intelligence.
Information found nowhere else
With our new report, you are less likely to fall behind in knowledge or miss out on opportunities. See how our work could benefit your research, analyses, and decisions. Visiongain’s study is for everybody needing commercial analyses for the Cancer biologics market, 2023 to 2033, market-leading companies. You will find data, trends and predictions.
To access the data contained in this document please email contactus@visiongain.com
Buy our report today Cancer Biologics Market Report 2023-2033: Forecasts by Product (Monoclonal Antibodies (Naked Monoclonal Antibodies, Conjugated Monoclonal Antibodies, Bispecific Monoclonal Antibodies), Vaccines (Preventive Vaccines, Therapeutic Vaccines), Cancer Growth Blockers (Tyrosine kinase Inhibitors (TKI), Proteasome Inhibitors (PI), mTOR Inhibitors), Blood Cell Growth Factors (Lenograstim, Filgrastim), Cytokine (Interferons, Interleukins)), by Application (Non-Small Cell Lung Cancer, Prostate Cancer, Breast Cancer, Acute Myeloid Leukaemia, Lymphoma, Multiple Myeloma, Ovarian Cancer, Colorectal Cancer, Gastric Cancers, Other), by Route of Administration (Orals, Injectable) AND Regional and Leading National Market Analysis PLUS Analysis of Leading Companies AND COVID-19 Impact and Recovery Pattern Analysis. Avoid missing out by staying informed – order our report now.
Visiongain is a trading partner with the US Federal Government
CCR Ref number: KD4R6
Do you have any custom requirements we can help you with? Any need for a specific country, geo region, market segment or specific company information? Contact us today, we can discuss your needs and see how we can help: contactus@visiongain.com
1 Report Overview
1.1 Objectives of the Study
1.2 Introduction to Cancer Biologics Market
1.3 What This Report Delivers
1.4 Why You Should Read This Report
1.5 Key Questions Answered by This Analytical Report
1.6 Who is This Report for?
1.7 Methodology
1.7.1 Market Definitions
1.7.2 Market Evaluation & Forecasting Methodology
1.7.3 Data Validation
1.7.3.1 Primary Research
1.7.3.2 Secondary Research
1.8 Frequently Asked Questions (FAQs)
1.9 Associated Visiongain Reports
1.10 About Visiongain
2 Executive Summary
3 Market Overview
3.1 Key Findings
3.2 Market Dynamics
3.2.1 Market Driving Factors
3.2.1.1 Increasing Prevalence of Cancer
3.2.1.2 Growing Geriatric Population Susceptible for Cancer
3.2.1.3 Technological Advancements in Cancer Biologics Therapy
3.2.2 Market Restraining Factors
3.2.2.1 High Cost of Treatment
3.2.2.2 Toxicity and Adverse Effects of Cancer Biologics Treatment
3.2.3 Market Opportunities
3.2.3.1 Favourable Government Policies
3.2.3.2 Growing Adoption of Immunotherapy
3.3 COVID-19 Impact Analysis
3.4 Porter’s Five Forces Analysis
3.4.1 Bargaining Power of Suppliers
3.4.2 Bargaining Power of Buyers
3.4.3 Competitive Rivalry
3.4.4 Threat from Substitutes
3.4.5 Threat of New Entrants
3.5 PEST Analysis
4 Cancer Biologics Market Analysis by Product
4.1 Key Findings
4.2 Indication Segment: Market Attractiveness Index
4.3 Cancer Biologics Market Size Estimation and Forecast by Product
4.4 Monoclonal Antibodies
4.4.1 Cancer Biologics Market Size Estimation and Forecast by Monoclonal Antibodies
4.4.2 Market Size by Region, 2023-2033 (US$ Billion)
4.4.3 Market Share by Region, 2023 & 2033 (%)
4.4.4 Naked Monoclonal Antibodies
4.4.4.1 Market Size by Region, 2023-2033 (US$ Billion)
4.4.4.2 Market Share by Region, 2023 & 2033 (%)
4.4.5 Conjugated Monoclonal Antibodies
4.4.5.1 Market Size by Region, 2023-2033 (US$ Billion)
4.4.5.2 Market Share by Region, 2023 & 2033 (%)
4.4.6 Bispecific Monoclonal Antibodies
4.4.6.1 Market Size by Region, 2023-2033 (US$ Billion)
4.4.6.2 Market Share by Region, 2023 & 2033 (%)
4.5 Vaccines
4.5.1 Cancer Biologics Market Size Estimation and Forecast by Vaccines
4.5.2 Market Size by Region, 2023-2033 (US$ Billion)
4.5.3 Market Share by Region, 2023 & 2033 (%)
4.5.4 Preventive Vaccines
4.5.4.1 Market Size by Region, 2023-2033 (US$ Billion)
4.5.4.2 Market Share by Region, 2023 & 2033 (%)
4.5.5 Therapeutic Vaccines
4.5.5.1 Market Size by Region, 2023-2033 (US$ Billion)
4.5.5.2 Market Share by Region, 2023 & 2033 (%)
4.6 Cancer Growth Blockers
4.6.1 Cancer Biologics Market Size Estimation and Forecast by Cancer Growth Blockers
4.6.2 Market Size by Region, 2023-2033 (US$ Billion)
4.6.3 Market Share by Region, 2023 & 2033 (%)
4.6.4 Tyrosine Kinase Inhibitors
4.6.4.1 Market Size by Region, 2023-2033 (US$ Billion)
4.6.4.2 Market Share by Region, 2023 & 2033 (%)
4.6.5 Proteasome Inhibitors (PI)
4.6.5.1 Market Size by Region, 2023-2033 (US$ Billion)
4.6.5.2 Market Share by Region, 2023 & 2033 (%)
4.6.6 mTOR Inhibitors
4.6.6.1 Market Size by Region, 2023-2033 (US$ Billion)
4.6.6.2 Market Share by Region, 2023 & 2033 (%)
4.7 Blood Cell Growth Factors
4.7.1 Cancer Biologics Market Size Estimation and Forecast by Blood Cell Growth Factors
4.7.2 Market Size by Region, 2023-2033 (US$ Billion)
4.7.3 Market Share by Region, 2023 & 2033 (%)
4.7.4 Lenograstim
4.7.4.1 Market Size by Region, 2023-2033 (US$ Billion)
4.7.4.2 Market Share by Region, 2023 & 2033 (%)
4.7.5 Filgrastim
4.7.5.1 Market Size by Region, 2023-2033 (US$ Billion)
4.7.5.2 Market Share by Region, 2023 & 2033 (%)
4.8 Cytokine
4.8.1 Cancer Biologics Market Size Estimation and Forecast by Cytokine
4.8.2 Market Size by Region, 2023-2033 (US$ Billion)
4.8.3 Market Share by Region, 2023 & 2033 (%)
4.8.4 Interferons
4.8.4.1 Market Size by Region, 2023-2033 (US$ Billion)
4.8.4.2 Market Share by Region, 2023 & 2033 (%)
4.8.5 Interleukins
4.8.5.1 Market Size by Region, 2023-2033 (US$ Billion)
4.8.5.2 Market Share by Region, 2023 & 2033 (%)
5 Cancer Biologics Market Analysis by Application
5.1 Key Findings
5.2 Indication Segment: Market Attractiveness Index
5.3 Cancer Biologics Market Size Estimation and Forecast by Application
5.4 Non-Small Cell Lung Cancer
5.4.1 Market Size by Region, 2023-2033 (US$ Billion)
5.4.2 Market Share by Region, 2023 & 2033 (%)
5.5 Prostate Cancer
5.5.1 Market Size by Region, 2023-2033 (US$ Billion)
5.5.2 Market Share by Region, 2023 & 2033 (%)
5.6 Breast Cancer
5.6.1 Market Size by Region, 2023-2033 (US$ Billion)
5.6.2 Market Share by Region, 2023 & 2033 (%)
5.7 Acute Myeloid Leukaemia
5.7.1 Market Size by Region, 2023-2033 (US$ Billion)
5.7.2 Market Share by Region, 2023 & 2033 (%)
5.8 Lymphoma
5.8.1 Market Size by Region, 2023-2033 (US$ Billion)
5.8.2 Market Share by Region, 2023 & 2033 (%)
5.9 Multiple Myeloma
5.9.1 Market Size by Region, 2023-2033 (US$ Billion)
5.9.2 Market Share by Region, 2023 & 2033 (%)
5.10 Ovarian Cancer
5.10.1 Market Size by Region, 2023-2033 (US$ Billion)
5.10.2 Market Share by Region, 2023 & 2033 (%)
5.11 Colorectal cancer
5.11.1 Market Size by Region, 2023-2033 (US$ Billion)
5.11.2 Market Share by Region, 2023 & 2033 (%)
5.12 Gastric cancer
5.12.1 Market Size by Region, 2023-2033 (US$ Billion)
5.12.2 Market Share by Region, 2023 & 2033 (%)
5.13 Others
5.13.1 Market Size by Region, 2023-2033 (US$ Billion)
5.13.2 Market Share by Region, 2023 & 2033 (%)
6 Cancer Biologics Market Analysis by Route of Administration
6.1 Key Findings
6.2 Route of Administration Segment: Market Attractiveness Index
6.3 Cancer Biologics Market Size Estimation and Forecast by Route of Administration
6.4 Oral
6.4.1 Market Size by Region, 2023-2033 (US$ Billion)
6.4.2 Market Share by Region, 2023 & 2033 (%)
6.5 Injectable
6.5.1 Market Size by Region, 2023-2033 (US$ Billion)
6.5.2 Market Share by Region, 2023 & 2033 (%)
7 Cancer Biologics Market Analysis by Region
7.1 Key Findings
7.2 Regional Market Size Estimation and Forecast
8 North America Cancer Biologics Market Analysis
8.1 Key Findings
8.2 North America Cancer Biologics Market Attractiveness Index
8.3 North America Cancer Biologics Market by Country, 2023, 2028 & 2033 (US$ Billion)
8.4 North America Cancer Biologics Market Size Estimation and Forecast by Country
8.5 North America Cancer Biologics Market Size Estimation and Forecast by Product
8.6 North America Cancer Biologics Market Size Estimation and Forecast by Application
8.7 North America Cancer Biologics Market Size Estimation and Forecast by Route of Administration
8.8 U.S. Cancer Biologics Market Analysis
8.9 Canada Cancer Biologics Market Analysis
9 Europe Cancer Biologics Market Analysis
9.1 Key Findings
9.2 Europe Cancer Biologics Market Attractiveness Index
9.3 Europe Cancer Biologics Market by Country, 2023, 2028 & 2033 (US$ Billion)
9.4 Europe Cancer Biologics Market Size Estimation and Forecast by Country
9.5 Europe Cancer Biologics Market Size Estimation and Forecast by Product
9.6 Europe Cancer Biologics Market Size Estimation and Forecast by Application
9.7 Europe Cancer Biologics Market Size Estimation and Forecast by Route of Administration
9.8 Germany Cancer Biologics Market Analysis
9.9 France Cancer Biologics Market Analysis
9.10 UK Cancer Biologics Market Analysis
9.11 Italy Cancer Biologics Market Analysis
9.12 Spain Cancer Biologics Market Analysis
9.13 Russia Cancer Biologics Market Analysis
9.14 Rest of Europe Cancer Biologics Market Analysis
10 Asia Pacific Cancer Biologics Market Analysis
10.1 Key Findings
10.2 Asia Pacific Cancer Biologics Market Attractiveness Index
10.3 Asia Pacific Cancer Biologics Market by Country, 2023, 2028 & 2033 (US$ Billion)
10.4 Asia Pacific Cancer Biologics Market Size Estimation and Forecast by Country
10.5 Asia Pacific Cancer Biologics Market Size Estimation and Forecast by Product
10.6 Asia Pacific Cancer Biologics Market Size Estimation and Forecast by Application
10.7 Asia Pacific Cancer Biologics Market Size Estimation and Forecast by Route of Administration
10.8 Japan Cancer Biologics Market Analysis
10.9 China Cancer Biologics Market Analysis
10.10 India Cancer Biologics Market Analysis
10.11 Australia Cancer Biologics Market Analysis
10.12 South Korea Cancer Biologics Market Analysis
10.13 Rest of Asia Pacific Cancer Biologics Market Analysis
11 Latin America Cancer Biologics Market Analysis
11.1 Key Findings
11.2 Latin America Cancer Biologics Market Attractiveness Index
11.3 Latin America Cancer Biologics Market by Country, 2023, 2028 & 2033 (US$ Billion)
11.4 Latin America Cancer Biologics Market Size Estimation and Forecast by Country
11.5 Latin America Cancer Biologics Market Size Estimation and Forecast by Product
11.6 Latin America Cancer Biologics Market Size Estimation and Forecast by Application
11.7 Latin America Cancer Biologics Market Size Estimation and Forecast by Route of Administration
11.8 Brazil Cancer Biologics Market Analysis
11.9 Mexico Cancer Biologics Market Analysis
11.10 Rest of Latin America Cancer Biologics Market Analysis
12 MEA Cancer Biologics Market Analysis
12.1 Key Findings
12.2 MEA Cancer Biologics Market Attractiveness Index
12.3 MEA Cancer Biologics Market by Country, 2023, 2028 & 2033 (US$ Billion)
12.4 MEA Cancer Biologics Market Size Estimation and Forecast by Country
12.5 MEA Cancer Biologics Market Size Estimation and Forecast by Product
12.6 MEA Cancer Biologics Market Size Estimation and Forecast by Application
12.7 MEA Cancer Biologics Market Size Estimation and Forecast by Route of Administration
12.8 GCC Cancer Biologics Market Analysis
12.9 South Africa Cancer Biologics Market Analysis
12.10 Rest of MEA Cancer Biologics Market Analysis
13 Company Profiles
13.1 Competitive Landscape, 2022
13.2 Strategic Outlook
13.3 AbbVie
13.3.1 Company Snapshot
13.3.2 Company Overview
13.3.3 Financial Analysis
13.3.3.1 Net Revenue, 2017-2022
13.3.3.2 R&D, 2017-2022
13.3.3.3 Regional Market Shares, 2022
13.3.4 Product Benchmarking
13.3.5 Strategic Outlook
13.4 Amgen
13.4.1 Company Snapshot
13.4.2 Company Overview
13.4.3 Financial Analysis
13.4.3.1 Net Revenue, 2017-2022
13.4.3.2 R&D, 2017-2022
13.4.3.3 Regional Market Shares, 2022
13.4.4 Product Benchmarking
13.4.5 Strategic Outlook
13.5 Astellas Pharma
13.5.1 Company Snapshot
13.5.2 Company Overview
13.5.3 Financial Analysis
13.5.3.1 Net Revenue, 2017-2022
13.5.3.2 R&D, 2017-2022
13.5.3.3 Regional Market Shares, 2022
13.5.4 Product Benchmarking
13.5.5 Strategic Outlook
13.6 AstraZeneca PLC
13.6.1 Company Snapshot
13.6.2 Company Overview
13.6.3 Financial Analysis
13.6.3.1 Net Revenue, 2017-2022
13.6.3.2 R&D, 2017-2022
13.6.3.3 Regional Market Shares, 2022
13.6.4 Product Benchmarking
13.6.5 Strategic Outlook
13.7 Bristol Myers Squibb
13.7.1 Company Snapshot
13.7.2 Company Overviews
13.7.3 Financial Analysis
13.7.3.1 Net Revenue, 2017-2022
13.7.3.2 R&D, 2017-2022
13.7.3.3 Regional Market Shares, 2022
13.7.4 Product Benchmarking
13.7.5 Strategic Outlook
13.8 Eisai Co., Ltd
13.8.1 Company Snapshot
13.8.2 Company Overview
13.8.3 Financial Analysis
13.8.3.1 Net Revenue, 2017-2022
13.8.3.2 R&D, 2017-2022
13.8.3.3 Regional Market Shares, 2022
13.8.4 Product Benchmarking
13.8.5 Strategic Outlook
13.9 Eli Lilly and Company
13.9.1 Company Snapshot
13.9.2 Company Overview
13.9.3 Financial Analysis
13.9.3.1 Net Revenue, 2017-2022
13.9.3.2 R&D, 2017-2022
13.9.3.3 Regional Market Shares, 2022
13.9.4 Product Benchmarking
13.9.5 Strategic Outlook
13.10 F. Hoffmann-La Roche Ltd
13.10.1 Company Snapshot
13.10.2 Company Overview
13.10.3 Financial Analysis
13.10.3.1 Net Revenue, 2017-2022
13.10.3.2 R&D, 2017-2022
13.10.3.3 Regional Market Shares, 2022
13.10.4 Product Benchmarking
13.10.5 Strategic Outlook
13.11 Merck & Co., Inc.
13.11.1 Company Snapshot
13.11.2 Company Overview
13.11.3 Financial Analysis
13.11.3.1 Net Revenue, 2017-2022
13.11.3.2 R&D, 2017-2022
13.11.3.3 Regional Market Shares, 2022
13.11.4 Product Benchmarking
13.11.5 Strategic Outlook
13.12 Novartis AG
13.12.1 Company Snapshot
13.12.2 Company Overview
13.12.3 Financial Analysis
13.12.3.1 Net Revenue, 2017-2022
13.12.3.2 R&D, 2017-2022
13.12.3.3 Regional Market Shares, 2022
13.12.4 Product Benchmarking
13.12.5 Strategic Outlook
13.13 Takeda Pharmaceutical Company Ltd
13.13.1 Company Snapshot
13.13.2 Company Overview
13.13.3 Financial Analysis
13.13.3.1 Net Revenue, 2017-2022
13.13.3.2 R&D, 2017-2022
13.13.3.3 Regional Market Shares, 2022
13.13.4 Product Benchmarking
13.13.5 Strategic Outlook
14 Conclusion and Recommendations
14.1 Concluding Remarks from Visiongain
14.2 Recommendations for Market Players
List of Tables
Table 1 Cancer Biologics Market Snapshot, 2023 & 2033 (US$ Billion, CAGR %)
Table 2 Cancer Biologics Market Forecast by Region, 2023-2033 (US$ Billion, AGR%, CAGR%): “V” Shaped Recovery
Table 3 Cancer Biologics Market Forecast by Region, 2023-2033 (US$ Billion, AGR%, CAGR%): “U” Shaped Recovery
Table 4 Cancer Biologics Market Forecast by Region, 2023-2033 (US$ Billion, AGR%, CAGR%): “W” Shaped Recovery
Table 5 Cancer Biologics Market Forecast by Region, 2023-2033 (US$ Billion, AGR%, CAGR%): “L” Shaped Recovery
Table 6 Cancer Biologics Market Forecast by Product, 2023-2033 (US$ Billion, AGR%, CAGR %)
Table 7 Cancer Biologics Market Forecast by Monoclonal Antibodies, 2023-2033 (US$ Billion, AGR%, CAGR %)
Table 8 Monoclonal Antibodies Segment Market Forecast by Region, 2023-2033 (US$ Billion, AGR%, CAGR %)
Table 9 Naked Monoclonal Antibodies Market Forecast by Region, 2023-2033 (US$ Billion, AGR%, CAGR %)
Table 10 Conjugated Monoclonal Antibodies Market Forecast by Region, 2023-2033 (US$ Billion, AGR%, CAGR %)
Table 11 Bispecific Monoclonal Antibodies Market Forecast by Region, 2023-2033 (US$ Billion, AGR%, CAGR %)
Table 12 Vaccines Market Forecast by Monoclonal Antibodies, 2023-2033 (US$ Billion, AGR%, CAGR%)
Table 13 Vaccines Market Forecast by Region, 2023-2033 (US$ Billion, AGR%, CAGR%)
Table 14 Preventive Vaccines Market Forecast by Region, 2023-2033 (US$ Billion, AGR%, CAGR%)
Table 15 Therapeutic Vaccines Market Forecast by Region, 2023-2033 (US$ Billion, AGR%, CAGR%)
Table 16 Cancer Biologics Market Forecast by Cancer Growth Blockers, 2023-2033 (US$ Billion, AGR%, CAGR%)
Table 17 Cancer Growth Blockers Market Forecast by Region, 2023-2033 (US$ Billion, AGR%, CAGR%)
Table 18 Tyrosine Kinase Inhibitors Market Forecast by Region, 2023-2033 (US$ Billion, AGR%, CAGR%)
Table 19 Proteasome Inhibitors Market Forecast by Region, 2023-2033 (US$ Billion, AGR%, CAGR%)
Table 20 mTOR Inhibitors Market Forecast by Region, 2023-2033 (US$ Billion, AGR%, CAGR%)
Table 21 Cancer Biologics Market Forecast by Blood Cell growth Factors, 2023-2033 (US$ Billion, AGR%, CAGR%)
Table 22 Blood Cell growth Factors Market Forecast by Region, 2023-2033 (US$ Billion, AGR%, CAGR%)
Table 23 Lenograstim Market Forecast by Region, 2023-2033 (US$ Billion, AGR%, CAGR%)
Table 24 Filgrastim Market Forecast by Region, 2023-2033 (US$ Billion, AGR%, CAGR%)
Table 25 Cancer Biologics Market Forecast by Cytokine, 2023-2033 (US$ Billion, AGR%, CAGR%)
Table 26 Cytokine Market Forecast by Region, 2023-2033 (US$ Billion, AGR%, CAGR%)
Table 27 Interferons Market Forecast by Region, 2023-2033 (US$ Billion, AGR%, CAGR %)
Table 28 Interleukins Market Forecast by Region, 2023-2033 (US$ Billion, AGR%, CAGR%)
Table 29 Cancer Biologics Market Forecast by Application, 2023-2033 (US$ Billion, AGR%, CAGR%)
Table 30 Non-Small Cell Lung Cancer Segment Market Forecast by Region, 2023-2033 (US$ Billion, AGR%, CAGR%)
Table 31 Prostate Cancer Segment Market Forecast by Region, 2023-2033 (US$ Billion, AGR%, CAGR%)
Table 32 Breast Cancer Segment Market Forecast by Region, 2023-2033 (US$ Billion, AGR%, CAGR%)
Table 33 Acute Myeloid Leukemia Segment Market Forecast by Region, 2023-2033 (US$ Billion, AGR%, CAGR %)
Table 34 Lymphoma Market Forecast by Region, 2023-2033 (US$ Billion, AGR%, CAGR%)
Table 35 Multiple Myeloma Segment Market Forecast by Region, 2023-2033 (US$ Billion, AGR%, CAGR%)
Table 36 Ovarian Cancer Segment Market Forecast by Region, 2023-2033 (US$ Billion, AGR%, CAGR%)
Table 37 Colorectal cancer Segment Market Forecast by Region, 2023-2033 (US$ Billion, AGR%, CAGR %)
Table 38 Gastric cancer segment Market Forecast by Region, 2023-2033 (US$ Billion, AGR%, CAGR%)
Table 39 Other Segment Market Forecast by Region, 2023-2033 (US$ Billion, AGR%, CAGR%)
Table 40 Cancer Biologics Market Route of Administration, 2023-2033 (US$ Billion, AGR%, CAGR%)
Table 41 Oral Market Forecast by Region, 2023-2033 (US$ Billion, AGR%, CAGR%)
Table 42 Injectable Market Forecast by Region, 2023-2033 (US$ Billion, AGR%, CAGR%)
Table 43 Cancer Biologics Market Forecast by Region, 2023-2033 (US$ Billion, AGR%, CAGR%)
Table 44 North America Cancer Biologics Market Forecast by Country, 2023-2033 (US$ Billion, AGR%, CAGR %)
Table 45 North America Cancer Biologics Market Forecast by Product, 2023-2033 (US$ Billion, AGR%, CAGR %)
Table 46 North America Cancer Biologics Market Forecast by Application, 2023-2033 (US$ Billion, AGR%, CAGR %)
Table 47 North America Cancer Biologics Market Forecast by Route of Administration, 2023-2033 (US$ Billion, AGR%, CAGR %)
Table 48 U.S. Cancer Biologics Market Forecast, 2023-2033 (US$ Billion, AGR%, CAGR%)
Table 49 Canada Cancer Biologics Market Forecast, 2023-2033 (US$ Billion, AGR%, CAGR %)
Table 50 Europe Cancer Biologics Market Forecast by Country, 2023-2033 (US$ Billion, AGR%, CAGR%)
Table 51 Europe Cancer Biologics Market Forecast by Product, 2023-2033 (US$ Billion, AGR%, CAGR%)
Table 52 Europe Cancer Biologics Market Forecast by Application, 2023-2033 (US$ Billion, AGR%, CAGR%)
Table 53 Europe Cancer Biologics Market Forecast by Route of Administration, 2023-2033 (US$ Billion, AGR%, CAGR%)
Table 54 Germany Cancer Biologics Market Forecast, 2023-2033 (US$ Billion, AGR%, CAGR %)
Table 55 France Cancer Biologics Market Forecast, 2023-2033 (US$ Billion, AGR%, CAGR %)
Table 56 UK Cancer Biologics Market Forecast, 2023-2033 (US$ Billion, AGR%, CAGR%)
Table 57 Italy Cancer Biologics Market Forecast, 2023-2033 (US$ Billion, AGR%, CAGR %)
Table 58 Spain Cancer Biologics Market Forecast, 2023-2033 (US$ Billion, AGR%, CAGR%)
Table 59 Russia Cancer Biologics Market Forecast, 2023-2033 (US$ Billion, AGR%, CAGR%)
Table 60 Rest of Europe Cancer Biologics Market Forecast, 2023-2033 (US$ Billion, AGR%, CAGR%)
Table 61 Asia Pacific Cancer Biologics Market Forecast by Country, 2023-2033 (US$ Billion, AGR%, CAGR%)
Table 62 Asia Pacific Cancer Biologics Market Forecast by Product, 2023-2033 (US$ Billion, AGR%, CAGR%)
Table 63 Asia Pacific Cancer Biologics Market Forecast by Application, 2023-2033 (US$ Billion, AGR%, CAGR%)
Table 64 Asia Pacific Cancer Biologics Market Forecast by Route of Administration, 2023-2033 (US$ Billion, AGR%, CAGR%)
Table 65 Japan Cancer Biologics Market Forecast, 2023-2033 (US$ Billion, AGR%, CAGR%)
Table 66 China Cancer Biologics Market Forecast, 2023-2033 (US$ Billion, AGR%, CAGR%)
Table 67 India Cancer Biologics Market Forecast, 2023-2033 (US$ Billion, AGR%, CAGR %)
Table 68 Australia Cancer Biologics Market Forecast, 2023-2033 (US$ Billion, AGR%, CAGR %)
Table 69 South Korea Cancer Biologics Market Forecast, 2023-2033 (US$ Billion, AGR%, CAGR%)
Table 70 Rest of Asia Pacific Cancer Biologics Market Forecast, 2023-2033 (US$ Billion, AGR%, CAGR %)
Table 71 Latin America Cancer Biologics Market Forecast by Country, 2023-2033 (US$ Billion, AGR%, CAGR%)
Table 72 Latin America Cancer Biologics Market Forecast by Product, 2023-2033 (US$ Billion, AGR%, CAGR%)
Table 73 Latin America Cancer Biologics Market Forecast by Application, 2023-2033 (US$ Billion, AGR%, CAGR%)
Table 74 Latin America Cancer Biologics Market Forecast by Route of Administration, 2023-2033 (US$ Billion, AGR%, CAGR%)
Table 75 Brazil Cancer Biologics Market Forecast, 2023-2033 (US$ Billion, AGR%, CAGR %)
Table 76 Mexico Cancer Biologics Market Forecast, 2023-2033 (US$ Billion, AGR%, CAGR%)
Table 77 Rest of Latin America Cancer Biologics Market Forecast, 2023-2033 (US$ Billion, AGR%, CAGR%)
Table 78 MEA Cancer Biologics Market Forecast by Country, 2023-2033 (US$ Billion, AGR%, CAGR%)
Table 79 Cancer Biologics Market Forecast by Product, 2023-2033 (US$ Billion, AGR%, CAGR%)
Table 80 MEA Cancer Biologics Market Forecast by Application, 2023-2033 (US$ Billion, AGR%, CAGR%)
Table 81 MEA Cancer Biologics Market Forecast by Route of Administration, 2023-2033 (US$ Billion, AGR%, CAGR%)
Table 82 GCC Cancer Biologics Market Forecast, 2023-2033 (US$ Billion, AGR%, CAGR%)
Table 83 South Africa Cancer Biologics Market Forecast, 2023-2033 (US$ Billion, AGR%, CAGR%)
Table 84 Rest of MEA Cancer Biologics Market Forecast, 2023-2033 (US$ Billion, AGR%, CAGR %)
Table 85 Strategic Outlook
Table 86 AbbVie: Key Details, (CEO, HQ, Revenue, Founded, No. of Employees, Company Type, Website, Business Segment)
Table 87 AbbVie: Product Benchmarking
Table 88 AbbVie : Strategic Outlook
Table 89 Amgen: Key Details, (CEO, HQ, Revenue, Founded, No. of Employees, Company Type, Website, Business Segment)
Table 90 Amgen: Product Benchmarking
Table 91 Amgen : Strategic Outlook
Table 92 Astellas Pharma: Key Details, (CEO, HQ, Revenue, Founded, No. of Employees, Company Type, Website, Business Segment)
Table 93 Astellas Pharma: Product Benchmarking
Table 94 Astellas Pharma: Strategic Outlook
Table 95 AstraZeneca PLC: Key Details, (CEO, HQ, Revenue, Founded, No. of Employees, Company Type, Website, Business Segment)
Table 96 AstraZeneca PLC: Product Benchmarking
Table 97 AstraZeneca PLC: Strategic Outlook
Table 98 Bristol Myers Squibb: Key Details, (CEO, HQ, Revenue, Founded, No. of Employees, Company Type, Website, Business Segment)
Table 99 Bristol Myers Squibb: Product Benchmarking
Table 100 Bristol Myers Squibb: Strategic Outlook
Table 101 Eisai Co., Ltd: Key Details, (CEO, HQ, Revenue, Founded, No. of Employees, Company Type, Website, Business Segment)
Table 102 Eisai Co., Ltd: Product Benchmarking
Table 103 Eisai Co., Ltd: Strategic Outlook
Table 104 Eli Lilly and Company: Key Details, (CEO, HQ, Revenue, Founded, No. of Employees, Company Type, Website, Business Segment)
Table 105 Eli Lilly and Company: Product Benchmarking
Table 106 Eli Lilly and Company : Strategic Outlook
Table 107 F. Hoffmann-La Roche Ltd: Key Details, (CEO, HQ, Revenue, Founded, No. of Employees, Company Type, Website, Business Segment)
Table 108 F. Hoffmann-La Roche Ltd: Product Benchmarking
Table 109 F. Hoffmann-La Roche Ltd: Strategic Outlook
Table 110 Merck & Co., Inc.: Key Details, (CEO, HQ, Revenue, Founded, No. of Employees, Company Type, Website, Business Segment)
Table 111 Merck & Co., Inc.: Product Benchmarking
Table 112 Merck & Co., Inc.: Strategic Outlook
Table 113 Novartis AG: Key Details, (CEO, HQ, Revenue, Founded, No. of Employees, Company Type, Website, Business Segment)
Table 114 Novartis AG: Product Benchmarking
Table 115 Novartis AG: Strategic Outlook
Table 116 Takeda Pharmaceutical Company Ltd: Key Details, (CEO, HQ, Revenue, Founded, No. of Employees, Company Type, Website, Business Segment)
Table 117 Takeda Pharmaceutical Company Ltd: Product Benchmarking
Table 118 Takeda Pharmaceutical Company Ltd: Strategic Outlook
List of Figures
Figure 1 Cancer Biologics Market Segmentation
Figure 2 Cancer Biologics Market by Product: Market Attractiveness Index
Figure 3 Cancer Biologics Market by Application: Market Attractiveness Index
Figure 4 Cancer Biologics Market by Route of Administration: Market Attractiveness Index
Figure 5 Cancer Biologics Market Attractiveness Index by Region
Figure 6 Cancer Biologics Market: Market Dynamics
Figure 7 Cancer Biologics Market by Region, 2023-2033 (US$ Billion, AGR %): “V” Shaped Recovery
Figure 8 Cancer Biologics Market by Region, 2023-2033 (US$ Billion, AGR %): “U” Shaped Recovery
Figure 9 Cancer Biologics Market by Region, 2023-2033 (US$ Billion, AGR %): “W” Shaped Recovery
Figure 10 Cancer Biologics Market by Region, 2023-2033 (US$ Billion, AGR %): “L” Shaped Recovery
Figure 11 Cancer Biologics Market: Porter’s Five Forces Analysis
Figure 12 Cancer Biologics Market: PEST Analysis
Figure 13 Cancer Biologics Market by Product: Market Attractiveness Index
Figure 14 Cancer Biologics Market Forecast by Product, 2023-2033 (US$ Billion, AGR %)
Figure 15 Cancer Biologics Market Share Forecast by Product, 2023, 2028, 2033 (%)
Figure 16 Monoclonal Antibodies Segment Market Forecast by Region, 2023-2033 (US$ Billion, AGR %)
Figure 17 Monoclonal Antibodies Segment Market Share Forecast by Region, 2023 & 2033 (%)
Figure 18 Naked Monoclonal Antibodies Market Forecast by Region, 2023-2033 (US$ Billion, AGR %)
Figure 19 Naked Monoclonal Antibodies Market Share Forecast by Region, 2023 & 2033 (%)
Figure 20 Conjugated Monoclonal Antibodies Market Forecast by Region, 2023-2033 (US$ Billion, AGR %)
Figure 21 Conjugated Monoclonal Antibodies Market Share Forecast by Region, 2023 & 2033 (%)
Figure 22 Bi-specific Monoclonal Antibodies Market Forecast by Region, 2023-2033 (US$ Billion, AGR %)
Figure 23 Bispecific Monoclonal Antibodies Market Share Forecast by Region, 2023 & 2033 (%)
Figure 24 Vaccines Market Forecast by Region, 2023-2033 (US$ Billion, AGR %)
Figure 25 Vaccines Segment Market Share Forecast by Region, 2023 & 2033 (%)
Figure 26 Preventive Vaccines Market Forecast by Region, 2023-2033 (US$ Billion, AGR %)
Figure 27 Preventive Vaccines Market Share Forecast by Region, 2023 & 2033 (%)
Figure 28 Therapeutic Vaccines Market Forecast by Region, 2023-2033 (US$ Billion, AGR %)
Figure 29 Therapeutic Vaccines Market Share Forecast by Region, 2023 & 2033 (%)
Figure 30 Cancer Growth Blockers Market Forecast by Region, 2023-2033 (US$ Billion, AGR %)
Figure 31 Cancer Growth Blockers Market Share Forecast by Region, 2023 & 2033 (%)
Figure 32 Tyrosine Kinase Inhibitors Market Forecast by Region, 2023-2033 (US$ Billion, AGR %)
Figure 33 Tyrosine Kinase Inhibitors Market Share Forecast by Region, 2023 & 2033 (%)
Figure 34 Proteasome Inhibitors Market Forecast by Region, 2023-2033 (US$ Billion, AGR %)
Figure 35 Proteasome Inhibitors Market Share Forecast by Region, 2023 & 2033 (%)
Figure 36 mTOR Inhibitors Market Forecast by Region, 2023-2033 (US$ Billion, AGR %)
Figure 37 mTOR Inhibitors Market Share Forecast by Region, 2023 & 2033 (%)
Figure 38 Blood Cell Growth Factors Market Forecast by Region, 2023-2033 (US$ Billion, AGR %)
Figure 39 Blood Cell growth Factors Market Share Forecast by Region, 2023 & 2033 (%)
Figure 40 Lenograstim Market Forecast by Region, 2023-2033 (US$ Billion, AGR %)
Figure 41 Lenograstim Market Share Forecast by Region, 2023 & 2033 (%)
Figure 42 Filgrastin Market Forecast by Region, 2023-2033 (US$ Billion, AGR %)
Figure 43 Filgrastin Market Share Forecast by Region, 2023 & 2033 (%)
Figure 44 Cytokine Market Forecast by Region, 2023-2033 (US$ Billion, AGR %)
Figure 45 Cytokine Segment Market Share Forecast by Region, 2023 & 2033 (%)
Figure 46 Interferons Market Forecast by Region, 2023-2033 (US$ Billion, AGR %)
Figure 47 Interferons Market Share Forecast by Region, 2023 & 2033 (%)
Figure 48 Interleukins Market Forecast by Region, 2023-2033 (US$ Billion, AGR %)
Figure 49 Interleukins Market Share Forecast by Region, 2023 & 2033 (%)
Figure 50 Cancer Biologics Market by Application: Market Attractiveness Index
Figure 51 Cancer Biologics Market Forecast by Application, 2023-2033 (US$ Billion, AGR %)
Figure 52 Cancer Biologics Market Share Forecast by Application, 2023, 2028, 2033 (%)
Figure 53 Non-Small Cell Lung Cancer Segment Market Forecast by Region, 2023-2033 (US$ Billion, AGR %)
Figure 54 Non-Small Cell Lung Cancer Segment Market Share Forecast by Region, 2023 & 2033 (%)
Figure 55 Prostate Cancer Segment Market Forecast by Region, 2023-2033 (US$ Billion, AGR %)
Figure 56 Prostate Cancer Segment Market Share Forecast by Region, 2023 & 2033 (%)
Figure 57 Breast Cancer Segment Market Forecast by Region, 2023-2033 (US$ Billion, AGR %)
Figure 58 Breast Cancer Segment Market Share Forecast by Region, 2023 & 2033 (%)
Figure 59 Acute Myeloid Leukemia Segment Market Forecast by Region, 2023-2033 (US$ Billion, AGR %)
Figure 60 Acute Myeloid Leukemia Segment Market Share Forecast by Region, 2023 & 2033 (%)
Figure 61 Lymphoma Market Forecast by Region, 2023-2033 (US$ Billion, AGR %)
Figure 62 Lymphoma Segment Market Share Forecast by Region, 2023 & 2033 (%)
Figure 63 Multiple Myeloma Segment Market Forecast by Region, 2023-2033 (US$ Billion, AGR %)
Figure 64 Multiple Myeloma Segment Market Share Forecast by Region, 2023 & 2033 (%)
Figure 65 Ovarian Cancer Segment Market Forecast by Region, 2023-2033 (US$ Billion, AGR %)
Figure 66 Ovarian Cancer Segment Market Share Forecast by Region, 2023 & 2033 (%)
Figure 67 Colorectal cancer Segment Market Forecast by Region, 2023-2033 (US$ Billion, AGR %)
Figure 68 Colorectal Cancer Segment Market Share Forecast by Region, 2023 & 2033 (%)
Figure 69 Gastric cancers Segment Market Forecast by Region, 2023-2033 (US$ Billion, AGR %)
Figure 70 Gastric Cancer Segment Market Share Forecast by Region, 2023 & 2033 (%)
Figure 71 Other Segment Market Forecast by Region, 2023-2033 (US$ Billion, AGR %)
Figure 72 Other application Segment Market Share Forecast by Region, 2023 & 2033 (%)
Figure 73 Cancer Biologics Market by Route Of Administration: Market Attractiveness Index
Figure 74 Cancer Biologics Market Forecast by Route Of Administration, 2023-2033 (US$ Billion, AGR %)
Figure 75 Cancer Biologics Market Share Forecast by Route Of Administration, 2023, 2028, 2033 (%)
Figure 76 Oral Segment Market Forecast by Region, 2023-2033 (US$ Billion, AGR %)
Figure 77 Oral Segment Market Share Forecast by Region, 2023 & 2033 (%)
Figure 78 Injectable Market Forecast by Region, 2023-2033 (US$ Billion, AGR %)
Figure 79 Injectable Market Share Forecast by Region, 2023 & 2033 (%)
Figure 80 Cancer Biologics Market Forecast by Region 2023 and 2033 (Revenue, CAGR %)
Figure 81 Cancer Biologics Market Share Forecast by Region 2023, 2028, 2033 (%)
Figure 82 Cancer Biologics Market by Region, 2023-2033 (US$ Billion, AGR %)
Figure 83 North America Cancer Biologics Market Attractiveness Index
Figure 84 North America Cancer Biologics Market by Region, 2023, 2028 & 2033 (US$ Billion)
Figure 85 North America Cancer Biologics Market Forecast by Country, 2023-2033 (US$ Billion, AGR %)
Figure 86 North America Cancer Biologics Market Share Forecast by Country, 2023 & 2033 (%)
Figure 87 North America Cancer Biologics Market Forecast by Product, 2023-2033 (US$ Billion, AGR %)
Figure 88 North America Cancer Biologics Market Share Forecast by Product, 2023 & 2033 (%)
Figure 89 North America Cancer Biologics Market Forecast by Application, 2023-2033 (US$ Billion, AGR %)
Figure 90 North America Cancer Biologics Market Share Forecast by Application, 2023 & 2033 (%)
Figure 91 North America Cancer Biologics Market Forecast by Route of Administration, 2023-2033 (US$ Billion, AGR %)
Figure 92 North America Cancer Biologics Market Share Forecast by Route of Administration, 2023 & 2033 (%)
Figure 93 U.S. Cancer Biologics Market Forecast, 2023-2033 (US$ Billion, AGR %)
Figure 94 Canada Cancer Biologics Market Forecast, 2023-2033 (US$ Billion, AGR %)
Figure 95 Europe Cancer Biologics Market Attractiveness Index
Figure 96 Europe Cancer Biologics Market by Region, 2023, 2028 & 2033 (US$ Billion)
Figure 97 Europe Cancer Biologics Market Forecast by Country, 2023-2033 (US$ Billion, AGR %)
Figure 98 Europe Cancer Biologics Market Share Forecast by Country, 2023 & 2033 (%)
Figure 99 Europe Cancer Biologics Market Forecast by Product, 2023-2033 (US$ Billion, AGR %)
Figure 100 Europe Cancer Biologics Market Share Forecast by Product, 2023 & 2033 (%)
Figure 101 Europe Cancer Biologics Market Forecast by Application, 2023-2033 (US$ Billion, AGR %)
Figure 102 Europe Cancer Biologics Market Share Forecast by Application, 2023 & 2033 (%)
Figure 103 Europe Cancer Biologics Market Forecast by Route of Administration, 2023-2033 (US$ Billion, AGR %)
Figure 104 Europe Cancer Biologics Market Share Forecast by Route of Administration, 2023 & 2033 (%)
Figure 105 Germany Cancer Biologics Market Forecast, 2023-2033 (US$ Billion, AGR %)
Figure 106 France Cancer Biologics Market Forecast, 2023-2033 (US$ Billion, AGR %)
Figure 107 UK Cancer Biologics Market Forecast, 2023-2033 (US$ Billion, AGR %)
Figure 108 Italy Cancer Biologics Market Forecast, 2023-2033 (US$ Billion, AGR %)
Figure 109 Spain Cancer Biologics Market Forecast, 2023-2033 (US$ Billion, AGR %)
Figure 110 Russia Cancer Biologics Market Forecast, 2023-2033 (US$ Billion, AGR %)
Figure 111 Rest of Europe Cancer Biologics Market Forecast, 2023-2033 (US$ Billion, AGR %)
Figure 112 Asia Pacific Cancer Biologics Market Attractiveness Index
Figure 113 Asia Pacific Cancer Biologics Market by Region, 2023, 2028 & 2033 (US$ Billion)
Figure 114 Asia Pacific Cancer Biologics Market Forecast by Country, 2023-2033 (US$ Billion, AGR %)
Figure 115 Asia Pacific Cancer Biologics Market Share Forecast by Country, 2023 & 2033 (%)
Figure 116 Asia Pacific Cancer Biologics Market Forecast by Product, 2023-2033 (US$ Billion, AGR %)
Figure 117 Asia Pacific Cancer Biologics Market Share Forecast by Product, 2023 & 2033 (%)
Figure 118 Asia Pacific Cancer Biologics Market Forecast by Application, 2023-2033 (US$ Billion, AGR %)
Figure 119 Asia Pacific Cancer Biologics Market Share Forecast by Application, 2023 & 2033 (%)
Figure 120 Asia Pacific Cancer Biologics Market Forecast by Route of Administration, 2023-2033 (US$ Billion, AGR %)
Figure 121 Asia Pacific Cancer Biologics Market Share Forecast by Route of Administration, 2023 & 2033 (%)
Figure 122 Japan Cancer Biologics Market Forecast, 2023-2033 (US$ Billion, AGR %)
Figure 123 China Cancer Biologics Market Forecast, 2023-2033 (US$ Billion, AGR %)
Figure 124 India Cancer Biologics Market Forecast, 2023-2033 (US$ Billion, AGR %)
Figure 125 Australia Cancer Biologics Market Forecast, 2023-2033 (US$ Billion, AGR %)
Figure 126 South Korea Cancer Biologics Market Forecast, 2023-2033 (US$ Billion, AGR %)
Figure 127 Rest of Asia Pacific Cancer Biologics Market Forecast, 2023-2033 (US$ Billion, AGR %)
Figure 128 Latin America Cancer Biologics Market Attractiveness Index
Figure 129 Latin America Cancer Biologics Market by Region, 2023, 2028 & 2033 (US$ Billion)
Figure 130 Latin America Cancer Biologics Market Forecast by Country, 2023-2033 (US$ Billion, AGR %)
Figure 131 Latin America Cancer Biologics Market Share Forecast by Country, 2023 & 2033 (%)
Figure 132 Latin America Cancer Biologics Market Forecast by Product, 2023-2033 (US$ Billion, AGR %)
Figure 133 Latin America Cancer Biologics Market Share Forecast by Product, 2023 & 2033 (%)
Figure 134 Latin America Cancer Biologics Market Forecast by Application, 2023-2033 (US$ Billion, AGR %)
Figure 135 MEA Cancer Biologics Market Share Forecast by Application, 2023 & 2033 (%)
Figure 136 Latin America Cancer Biologics Market Forecast by Route of Administration, 2023-2033 (US$ Billion, AGR %)
Figure 137 Latin America Cancer Biologics Market Share Forecast by Route of Administration, 2023 & 2033 (%)
Figure 138 Brazil Cancer Biologics Market Forecast, 2023-2033 (US$ Billion, AGR %)
Figure 139 Mexico Cancer Biologics Market Forecast, 2023-2033 (US$ Billion, AGR %)
Figure 140 Rest of Latin America Cancer Biologics Market Forecast, 2023-2033 (US$ Billion, AGR %)
Figure 141 MEA Cancer Biologics Market Attractiveness Index
Figure 142 MEA Cancer Biologics Market by Region, 2023, 2028 & 2033 (US$ Billion)
Figure 143 MEA Cancer Biologics Market Forecast by Country, 2023-2033 (US$ Billion, AGR %)
Figure 144 MEA Cancer Biologics Market Share Forecast by Country, 2023 & 2033 (%)
Figure 145 MEA Cancer Biologics Market Forecast by Product, 2023-2033 (US$ Billion, AGR %)
Figure 146 MEA Cancer Biologics Market Share Forecast by Product, 2023 & 2033 (%)
Figure 147 MEA Cancer Biologics Market Forecast by Application, 2023-2033 (US$ Billion, AGR %)
Figure 148 MEA Cancer Biologics Market Share Forecast by Application, 2023 & 2033 (%)
Figure 149 MEA Cancer Biologics Market Forecast by Route of Administration, 2023-2033 (US$ Billion, AGR %)
Figure 150 MEA Cancer Biologics Market Share Forecast by Route of Administration, 2023 & 2033 (%)
Figure 151 GCC Cancer Biologics Market Forecast, 2023-2033 (US$ Billion, AGR %)
Figure 152 South Africa Cancer Biologics Market Forecast, 2023-2033 (US$ Billion, AGR %)
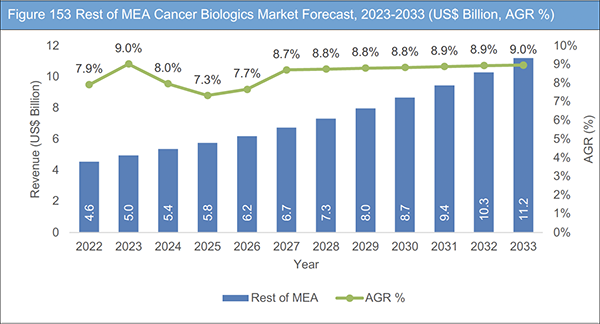
Figure 153 Rest of MEA Cancer Biologics Market Forecast, 2023-2033 (US$ Billion, AGR %)
Figure 154 Cancer Biologics Market: Company Share, 2022
Figure 155 AbbVie: Net Revenue, 2017-2022 (US$ Million, AGR%)
Figure 156 AbbVie: R&D, 2017-2022 (US$ Million, AGR%)
Figure 157 AbbVie: Regional Market Shares, 2022
Figure 158 Amgen: Net Revenue, 2017-2022 (US$ Million, AGR %)
Figure 159 Amgen: R&D, 2017-2022 (US$ Million, AGR%)
Figure 160 Amgen: Regional Market Shares, 2022
Figure 161 Astellas Pharma: Net Revenue, 2017-2022 (US$ Million, AGR%)
Figure 162 Astellas Pharma: R&D, 2017-2022 (US$ Million, AGR%)
Figure 163 Astellas Pharma: Regional Market Shares, 2022
Figure 164 AstraZeneca PLC: Net Revenue, 2017-2022 (US$ Million, AGR%)
Figure 165 AstraZeneca PLC: R&D, 2017-2022 (US$ Million, AGR %)
Figure 166 AstraZeneca PLC: Regional Market Shares, 2022
Figure 167 Bristol Myers Squibb: Net Revenue, 2017-2022 (US$ Million, AGR%)
Figure 168 Bristol Myers Squibb: R&D, 2017-2022 (US$ Million, AGR%)
Figure 169 Bristol Myers Squibb: Regional Market Shares, 2022
Figure 170 Eisai Co., Ltd: Net Revenue, 2017-2022 (US$ Million, AGR%)
Figure 171 Eisai Co., Ltd: R&D, 2017-2022 (US$ Million, AGR%)
Figure 172 Eisai Co., Ltd: Regional Market Shares, 2022
Figure 173 Eli Lilly and Company: Net Revenue, 2017-2022 (US$ Million, AGR%)
Figure 174 Eli Lilly and Company: R&D, 2017-2022 (US$ Million, AGR%)
Figure 175 Eli Lilly and Company: Regional Market Shares, 2022
Figure 176 F. Hoffmann-La Roche Ltd: Net Revenue, 2017-2022 (US$ Million, AGR%)
Figure 177 F. Hoffmann-La Roche Ltd: R&D, 2017-2022 (US$ Million, AGR%)
Figure 178 F. Hoffmann-La Roche Ltd: Regional Market Shares, 2022
Figure 179 Merck & Co., Inc.: Net Revenue, 2017-2022 (US$ Million, AGR%)
Figure 180 Merck & Co., Inc.: R&D, 2017-2022 (US$ Million, AGR%)
Figure 181 Merck & Co., Inc.: Regional Market Shares, 2022
Figure 182 Novartis AG: Net Revenue, 2017-2022 (US$ Million, AGR%)
Figure 183 Novartis AG: R&D, 2017-2022 (US$ Million, AGR%)
Figure 184 Novartis AG: Regional Market Shares, 2022
Figure 185 Takeda Pharmaceutical Company Ltd: Net Revenue, 2017-2022 (US$ Million, AGR%)
Figure 186 Takeda Pharmaceutical Company Ltd: R&D, 2017-2022 (US$ Million, AGR%)
Figure 187 Takeda Pharmaceutical Company Ltd: Regional Market Shares, 2022
List of Companies Profiled in the Report
AbbVie
Amgen
Astellas Pharma
AstraZeneca PLC
Bristol Myers Squibb
Eisai Co., Ltd
Eli Lilly and company
F. Hoffmann-La Roche Ltd
Merck & Co., Inc.
Novartis AG
Takeda Pharmaceutical Company.
List of Other Companies Mentioned in the Report
Ambrx
Anima Biotech
Arteryex
Caelum Biosciences
Chemocentrynx
CinCor Pharma
Entos Pharmaceuticals
Five Prime Therapeutics
GammaDelta Therapeutics
Generate Biomedicines
Horizon Therapeutics plc
HUTCHMED
Immunome
Kumquat Biosciences
Mersana Therapeutics
MiNA Therapeutics
Neogene Therapeutics
Nerviano Medical Sciences
Neurimmune
Rodeo
Sandoz
Sony Corporation
Teneobio
TeneoTwo
Turning Point Therapeutics
Voluntis
Xyphos Biosciences, Inc.
List of Associations Mentioned in the Report
European Medicines Agency (EMA)
Federal Joint Committee (G-BA)
Health Canada
Medicines and Healthcare Products Regulatory Agency (MHRA)
National Association of Statutory Health Insurance Funds (GKV-SV)
National Institute for Health and Care Excellence (NICE)
Scottish Medicines Consortium (SMC)
The Brazil Agência Nacional de Vigilância Sanitária (ANVISA)
The Institute for Quality and Efficiency in Health Care (IQWiG)
U.S. Department of Health and Human Services (HHS)
U.S. Food and Drug Administration (U.S.FDA)
United Nations International Children's Emergency Fund
World Allergy Organization (WAO)
World Health Organization (WHO)