Enhanced oil recovery (EOR) technologies are used to increase the amount of oil that can be extracted from an oil field after the primary and secondary production stages. The leading 20 players in the EOR market comprise a broad range of companies, including the six supermajors, large state-owned, or part state-owned, companies, and smaller private energy companies. Some of the leading players have diversified their EOR operations to include thermal, gas and chemical methods, often in numerous global locations, while others have focused their investments on one type of EOR technology or one specific region.
Strong global EOR growth over the coming decade will be driven by a combination of factors, including recently rising oil prices, ageing oil fields, rapidly escalating global energy demand, technological developments, a desire to increase energy independence, increasing EOR opportunities in heavy oil and oil sands recovery, and a desire to reduce carbon dioxide (CO2) emissions. This will ensure that there are significant growth opportunities for the leading EOR companies, along with companies currently outside the top 20 list.
The report will answer questions such as:
• Who are the leading companies in the EOR industry?
– What is their strategy?
– What is their existing processing capacity and where is it based?
– What are their core strengths and weaknesses?
– Do they have expansion plans, and if so where are they likely to go?
• What is driving and restraining the involvement of each leading company within the market?
• What are the projects these top companies are currently involved in?
• What is the total size of the EOR market in 2019? How much will it grow and why?
• What political, economic, environmental and technological factors affect the EOR market?
How will you benefit from this report?
• This report you will keep your knowledge base up to speed. Don’t get left behind
• This report will allow you to reinforce strategic decision-making based upon definitive and reliable market data
• You will learn how to exploit new technological trends
• You will be able to realise your company’s full potential within the market
• You will better understand the competitive landscape and identify potential new business opportunities and partnerships
Three reasons why you must order and read this report today:
1) The study reveals where and how leading companies are investing in EOR market. We show you the prospects for companies operating in:
– North America
– Middle East
– Asia
– Europe
2) The report provides a detailed individual profile for each of the 20 leading companies in Enhanced Oil Recovery market in 2017, providing data for Production capacity, Revenue and details of existing and upcoming EOR projects:
– Chevron
– Suncor
– BP Plc
– PDVSA
– ConocoPhillips
– China National Petroleum Corporation
– ExxonMobil
– Royal Dutch Shell
– Total SA
– Petroleo Brasileiro
– Husky Energy
– Imperial Oil
– Cenovus
– China Petroleum & Chemical Corporation (Sinopec)
– Occidental petroleum
– China National Offshore Oil Corporation (CNOOC)
– Kinder Morgan
– Halliburton
– Equinor (Statoil)
– Canadian Natural Resources
3) It also provides a PEST analysis of the key factors affecting the overall EOR market:
– Political
– Economic
– Social
– Technical
Competitive advantage
This independent, 192-page report guarantees you will remain better informed than your competitors. With 115 tables and figures examining the companies within the EOR market space, the report gives you an immediate, one-stop breakdown of the leading EOR companies plus analysis and future outlooks, keeping your knowledge one step ahead of your rivals.
Who should read this report?
• Anyone within the EOR value chain
• CEOs
• COOs
• CIOs
• Business development managers
• Marketing managers
• Technologists
• Suppliers
• Investors
• Banks
• Government agencies
• Contractors
Don’t miss out
This report is essential reading for you or anyone in the oil or other industries with an interest in EOR. Purchasing this report today will help you to recognise those important market opportunities and understand the possibilities there. Order our Top 20 Enhanced Oil Recovery (EOR) Companies 2019: Company Revenues and Analysis of the Top 20 Leading Companies in this Market Space. Plus, Global Combined Forecast for All EOR Methods (Thermal, Chemical, CO2) by Spending ($m) and Production (mmbbls/yr). Plus in-depth analysis of the top 20 leading companies in this market space.
Visiongain is a trading partner with the US Federal Government
CCR Ref number: KD4R6
1. Report Overview
1.1 Enhanced Oil Recovery Market Overview
1.2 Enhanced Oil Recovery Market Segmentation
1.3 Methodology
1.4 Why You Should Read This Report
1.5 How This Report Delivers
1.6 Key Questions Answered by This Report Include:
1.7 Who is This Report For?
1.8 Frequently Asked Questions (FAQs)
1.9 Associated Visiongain Reports
1.10 About Visiongain
2. Introduction to enhanced Oil Recovery (EOR) Market
2.1 What is Enhanced Oil Recovery?
2.2 Types of Enhanced Oil Recovery
2.3 Thermal Enhanced Oil Recovery
2.4 Gaseous Enhanced Oil Recovery
2.5 Chemical Enhanced Oil Recovery
2.6 Advantages of Enhanced Oil Recovery
3. Analysis of Enhanced Oil Recovery Market 2019-2029
3.1 Market Definition and Structure
3.2 Global Enhanced Oil Recovery Market Revenue and Forecast, 2019-2029
3.3 Factors Driving the Enhanced Oil Recovery Market
3.4 Challenges in the Enhanced Oil Recovery Market
3.5 Technological Advancements in the Enhanced Oil Recovery Market
3.6 Enhanced Oil Recovery Market Trends and Developments
3.7 Leading Companies in the Enhanced Oil Recovery Market
3.8 EOR Market Drivers & Restraints 2019
3.8.1 Drivers in the EOR Market
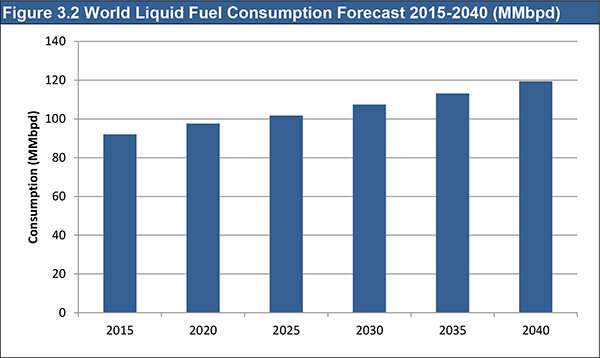
3.8.2 Increasing Demand for Oil
3.8.3 Ageing Oil Fields
3.8.4 Large Heavy Oil Deposits
3.8.5 CO2 Reduction Strategies
3.8.6 Cost and Concentration of Chemicals
3.8.7 Restraints in the EOR Market
3.8.7.1 High Costs
3.8.7.2 Environmental Concerns
3.8.8 Competition from Conventional and Unconventional Production
3.8.9 Oil Prices
3.8.9.1 Visiongain’s Description and Analysis of the Oil Price Fall
3.8.10 Supply-Side Factors
3.8.10.1 Tight Oil
3.8.10.2 OPEC
3.8.11 Demand-Side Factors
3.8.11.1 Chinese and Indian Growth
3.8.11.2 Western Stagnation
3.8.12 Other Major Variables that Impact the Oil Price
3.8.12.1 North Africa
3.8.12.2 Russia
3.8.12.3 US Shale Industry
3.8.12.4 Iran
3.8.13 3.4.5 Visiongain’s Oil Price Assumptions and Forecast
4. Leading 20 Companies in the Enhanced Oil Recovery Market 2019
4.1 BP PLC
4.1.1 Company Overview
4.1.2 Company Projects
4.1.3 BP Company Highlights, 2017
4.1.4 Company Performance
4.1.5 Recent Developments
4.2 Canadian Natural Resources Limited
4.2.1 Company Overview
4.2.2 Company Projects
4.2.3 Canadian Natural Resources Company Highlights, 2017
4.2.4 Company Performance
4.2.5 Recent Developments
4.3 Cenovus Energy Inc.
4.3.1 Company Overview
4.3.2 Company Projects
4.3.3 Cenovus Company Highlights, 2017
4.3.4 Company Performance
4.3.5 Recent Developments
4.4 Chevron Corporation
4.4.1 Company Overview
4.4.2 Company Projects
4.4.3 Chevron Company Highlights, 2017
4.4.4 Company Performance
4.4.5 Recent Developments
4.5 China National Petroleum Corporation
4.5.1 Company Overview
4.5.2 Company Projects
4.5.3 China National Petroleum Company Highlights, 2017
4.5.4 Company Performance
4.5.5 Recent Developments
4.6 China Petrochemical Corporation
4.6.1 Company Overview
4.6.2 Company Projects
4.6.3 China Petrochemical Company Highlights, 2017
4.6.4 Company Performance
4.6.5 Recent Developments
4.7 China National Offshore Oil Corporation (CNOOC)
4.7.1 Company Overview
4.7.2 Company Projects
4.7.3 CNOOC Company Highlights, 2017
4.7.4 Company Performance
4.7.5 Recent Developments
4.8 ConocoPhillips Company
4.8.1 Company Overview
4.8.2 Company Projects
4.8.3 ConocoPhillips Company Highlights, 2017
4.8.4 Company Performance
4.8.5 Recent Developments
4.9 Equinor ASA (Statoil)
4.9.1 Company Overview
4.9.2 Company Projects
4.9.3 Equinor Company Highlights, 2017
4.9.4 Company Performance
4.9.5 Recent Developments
4.10 ExxonMobil Corporation
4.10.1 Company Overview
4.10.2 Company Projects
4.10.3 ExxonMobil Company Highlights, 2017
4.10.4 Company Performance
4.10.5 Recent Developments
4.11 Halliburton Company
4.11.1 Company Overview
4.11.2 Halliburton Company Highlights, 2017
4.11.3 Company Performance
4.11.4 Recent Developments
4.12 Husky Energy Inc.
4.12.1 Company Overview
4.12.2 Company Projects
4.12.3 Husky Company Highlights, 2017
4.12.4 Company Performance
4.12.5 Recent Developments
4.13 Imperial Oil Limited
4.13.1 Company Overview
4.13.2 Company Projects
4.13.3 Imperial Oil Company Highlights, 2017
4.13.4 Company Performance
4.13.5 Recent Developments
4.14 Kinder Morgan, Inc.
4.14.1 Company Overview
4.14.2 Company Projects
4.14.3 Kinder Morgan Company Highlights, 2017
4.14.4 Company Performance
4.14.5 Recent Developments
4.15 Occidental Petroleum Corporation
4.15.1 Company Overview
4.15.2 Company Projects
4.15.3 Occidental Company Highlights, 2017
4.15.4 Company Performance
4.15.5 Recent Developments
4.16 Petroleo Brasileiro S.A. (Petrobras)
4.16.1 Company Overview
4.16.2 Company Projects
4.16.3 Petrobras Company Highlights, 2017
4.16.4 Company Performance
4.16.5 Recent Developments
4.17 Petróleos de Venezuela, S.A. (PDVSA)
4.17.1 Company Overview
4.17.2 Company Projects
4.17.3 PDVSA Company Highlights, 2017
4.17.4 Company Performance
4.17.5 Recent Developments
4.18 Royal Dutch Shell plc
4.18.1 Company Overview
4.18.2 Company Projects
4.18.3 Shell Company Highlights, 2017
4.18.4 Company Performance
4.18.5 Recent Developments
4.19 Suncor Energy Inc.
4.19.1 Company Overview
4.19.2 Company Projects
4.19.3 Suncor Company Highlights, 2017
4.19.4 Company Performance
4.19.5 Recent Developments
4.20 Total S.A.
4.20.1 Company Overview
4.20.2 Company Projects
4.20.3 Total Company Highlights, 2017
4.20.4 Company Performance
4.20.5 Recent Developments
4.21 Other Companies Involved in EOR
4.22 Other Company EOR Projects
5. PEST Analysis
5.1 Political
5.2 Economic
5.3 Social
5.4 Technological
6. Conclusion
6.1 Leading Segments in the Global Enhanced Oil Recovery Market
6.2 Leading Companies in the Global Enhanced Oil Recovery Market
6.3 Emerging Companies in the Global Enhanced Oil Recovery Market
6.4 The Future of Global Enhanced Oil Recovery Market
Visiongain Report Sales Order Form
Associated Visiongain Reports
Appendix A
About Visiongain
Appendix B
Visiongain report evaluation form
List of Tables
Table 3.1 Global EOR Market Spending and Production Forecast 2019-2029 (MMbbls/yr, $bn, AGR %, Cumulative)
Table 3.2 Leading 20 Companies in the Global Enhanced Oil Recovery Market, 2017
Table 3.3 EOR Market Drivers & Restraints 2019
Table 3.4 Visiongain’s Anticipated Brent Crude Oil Price, 2018, 2019, 2020-2022, 2023-2025, 2026-2029 ($/bbl)
Table 4.1 BP PLC Profile 2017 (CEO, Total Company Revenue US$m, Sales From Company Division That Includes EOR (US$m), Share of Total Company Revenue From Company Division That Includes EOR (%), Net Income / Loss (US$m), Net Capital Expenditure (US$m), Strongest Business Region & Business Segment, HQ, Founded, No. of Employees, IR Contact, Ticker, Website)
Table 4.2 BP EOR Projects (EOR Method, Project, Technology, BPD Capacity, Current BPD)
Table 4.3 Canadian Natural Resources Limited Profile 2017 (CEO, Total Company Revenue US$m, Net Income / Loss (US$m), Net Capital Expenditure (US$m), Strongest Business Region, HQ, Founded, No. of Employees, IR Contact, Ticker, Website)
Table 4.4 Cenovus Energy Inc. Profile 2017 (CEO, Total Company Revenue US$m, Revenue From Company Division That Includes EOR (US$m), Share of Total Company Revenue From Company Division That Includes EOR (%), Net Income / Loss (US$m), Net Capital Expenditure (US$m), Strongest Business Region & Business Segment in the Market, HQ, Founded, No. of Employees, IR Contact, Ticker, Website)
Table 4.5 Cenovus EOR Projects (Joint Venture, EOR Method, Project Name, technology, BPD Capacity, Current BPD)
Table 4.6 Chevron Corporation Profile 2017 (CEO, Total Company Revenue US$m, Revenue From Company Division That Includes EOR (US$m), Share of Total Company Revenue From Company Division That Includes EOR (%), Net Income / Loss (US$m), Net Capital Expenditure (US$m), Strongest Business Region & Business Segment in the Market, HQ, Founded, No. of Employees, IR Contact, Ticker, Website)
Table 4.7 Chevron Projects (Location, Companies, MMtpa Capacity, Operation Date and Clients)
Table 4.8 China National Petroleum Corporation Profile 2017 (CEO, Total Company Revenue US$bn, Total Profit $bn, HQ, Founded, No. of Employees, IR Contact, Ticker, Website)
Table 4.9 China Petrochemical Corporation Profile 2017 (CEO, Total Company Revenue US$m, Revenue From Company Division That Includes EOR (US$m), Share of Total Company Revenue From Company Division That Includes EOR (%), Net Income / Loss (US$m), Net Capital Expenditure (US$m), Strongest Business Region & Business Segment in the Market, HQ, Founded, No. of Employees, IR Contact, Ticker, Website)
Table 4.10 China National Offshore Oil Corporation Profile 2017 (CEO, Total Company Revenue US$m, Revenue From Company Division That Includes EOR (US$m), Share of Total Company Revenue From Company Division That Includes EOR (%), Net Income / Loss (US$m), Net Capital Expenditure (US$m), Strongest Business Segment, HQ, Founded, IR Contact, Ticker, Website)
Table 4.11 ConocoPhillips Company Profile 2017 (CEO, Total Company Revenue US$m, Revenue From Company Division That Includes EOR (US$m), Share of Total Company Revenue From Company Division That Includes EOR (%), Net Income / Loss (US$m), Net Capital Expenditure (US$m), Strongest Business Region & Business Segment in the Market, HQ, Founded, No. of Employees, IR Contact, Ticker, Website)
Table 4.12 ConocoPhillips Other Gas EOR Projects (Company, Project, Country, Start Date, Production bpd)
Table 4.13 ConocoPhillips Operating & Planned Anthropogenic CO2 Providers Facilities in the U.S. (Location, Companies, MMtpa Capacity, Operation Date and Clients)
Table 4.14 ConocoPhillips Operational Thermal Oil Sands Projects (Company Name, Project Name, Technology, BPD Capacity, Current BPD)
Table 4.15 Equinor ASA Profile 2017 (CEO, Total Company Revenue US$m, Revenue From Company Division That Includes EOR (US$m), Share of Total Company Revenue From Company Division That Includes EOR (%), Net Income / Loss (US$m), Net Capital Expenditure (US$m), Strongest Business Region & Business Segment, HQ, Founded, No. of Employees, IR Contact, Ticker, Website)
Table 4.16 Equinor Operational Thermal Oil Sands Projects (Company Name, Project Name, Technology, BPD Capacity, Current BPD)
Table 4.17 Equinor Other Gas EOR Projects (Company, Project, Country, Start Date, Production bpd)
Table 4.18 ExxonMobil Corporation Profile 2017 (CEO, Total Company Revenue US$m, Revenue From Company Division That Includes EOR (US$m), Share of Total Company Revenue From Company Division That Includes EOR (%), Net Income / Loss (US$m), Net Capital Expenditure (US$m), Strongest Business Region & Business Segment, HQ, Founded, No. of Employees, IR Contact, Ticker, Website)
Table 4.19 ExxonMobil Other Gas EOR Projects (Company, Project, Country, Start Date, Production bpd)
Table 4.20 Halliburton Company Profile 2017 (CEO, Total Company Revenue US$m, Revenue From Company Division That Includes EOR (US$m), Share of Total Company Revenue From Company Division That Includes EOR (%), Net Income / Loss (US$m), Net Capital Expenditure (US$m), Strongest Business Region & Business Segment, HQ, Founded, No. of Employees, IR Contact, Ticker, Website)
Table 4.21 Husky Energy Inc. Profile 2017 (CEO, Total Company Revenue US$m, Revenue From Company Division That Includes EOR (US$m), Share of Total Company Revenue From Company Division That Includes EOR (%), Net Income / Loss (US$m), Net Capital Expenditure (US$m), Strongest Business Region & Business Segment, HQ, Founded, IR Contact, Ticker, Website)
Table 4.22 Husky Other Gas EOR Projects (Company, Project, Country, Start Date, Production bpd)
Table 4.23 Husky Operational Thermal Oil Sands Projects (Company Name, Project Name, Technology, BPD Capacity, Current BPD)
Table 4.24 Imperial Oil Limited Profile 2017 (CEO, Total Company Revenue US$m, Revenue From Company Division That Includes EOR (US$m), Share of Total Company Revenue From Company Division That Includes EOR (%), Net Income / Loss (US$m), Net Capital Expenditure (US$m), Strongest Business Segment, HQ, Founded, No. of Employees, IR Contact, Ticker, Website)
Table 4.25 Operational Thermal Oil Sands Projects (Company Name, Project Name, Technology, BPD Capacity, Current BPD)
Table 5.26 Other Gas EOR Projects (Company, Project, Country, Start Date, Production bpd)
Table 4.27 Kinder Morgan, Inc. Profile 2017 (CEO, Total Company Revenue US$m, Revenue From Company Division That Includes EOR (US$m), Share of Total Company Revenue From Company Division That Includes EOR (%), Net Income / Loss (US$m), Net Capital Expenditure (US$m), Strongest Business Region & Business Segment, HQ, Founded, No. of Employees, IR Contact, Ticker, Website)
Table 4.28 Occidental Petroleum Corporation Profile 2017 (CEO, Total Company Revenue US$m, Revenue From Company Division That Includes EOR (US$m), Share of Total Company Revenue From Company Division That Includes EOR (%), Net Income / Loss (US$m), Net Capital Expenditure (US$m), Strongest Business Region & Business Segment, HQ, Founded, No. of Employees, IR Contact, Ticker, Website)
Table 4.29 Other Gas EOR Projects (Company, Project, Country, Start Date, Production bpd)
Table 4.30 Petrobras Profile 2017 (CEO, Total Company Revenue US$m, Revenue From Company Division That Includes EOR (US$m), Share of Total Company Revenue From Company Division That Includes EOR (%), Net Income / Loss (US$m), Net Capital Expenditure (US$m), Strongest Business Region & Business Segment, HQ, Founded, No. of Employees, IR Contact, Ticker, Website)
Table 4.31 Operating & Planned Anthropogenic CO2 Providers Facilities in the U.S. (Location, Companies, MMtpa Capacity, Operation Date and Clients)
Table 4.32 PDVSA Profile 2016 (CEO, Total Company Revenue US$m, HQ, Founded, IR Contact, Ticker, Website)
Table 4.33 Royal Dutch Shell plc Profile 2017 (CEO, Total Company Revenue US$m, Revenue From Company Division That Includes EOR (US$m), Share of Total Company Revenue From Company Division That Includes EOR (%), Net Income / Loss (US$m), Net Capital Expenditure (US$m), Strongest Business Region & Business Segment, HQ, Founded, No. of Employees, IR Contact, Ticker, Website)
Table 4.34 Operational Thermal Oil Sands Projects (Company Name, Project Name, Technology, BPD Capacity, Current BPD)
Table 4.35 Suncor Energy Inc. Profile 2017 (CEO, Total Company Revenue US$m, Revenue From Company Division That Includes EOR (US$m), Share of Total Company Revenue From Company Division That Includes EOR (%), Net Income / Loss (US$m), Net Capital Expenditure (US$m), Strongest Business Region & Business Segment, HQ, Founded, No. of Employees, IR Contact, Ticker, Website)
Table 4.36 Operational Thermal Oil Sands Projects (Company Name, Project Name, Technology, BPD Capacity, Current BPD)
Table 4.37 Planned Thermal Oil Sands Projects (Company Name, Project Name, Technology, bpd Capacity, Anticipated Production Start)
Table 4.38 Total S.A. Profile 2017 (CEO, Total Company Revenue US$m, Revenue From Company Division That Includes EOR (US$m), Share of Total Company Revenue From Company Division That Includes EOR (%), Net Income / Loss (US$m), Net Capital Expenditure (US$m), Strongest Business Region & Business Segment, HQ, Founded, No. of Employees, IR Contact, Ticker, Website)
Table 4.39 Other Gas EOR Projects (Company, Project, Country, Start Date, Production bpd)
Table 4.40 Other Companies Involved in EOR
Table 4.41 Operational Thermal Oil Sands Projects (Company Name, Project Name, Technology, BPD Capacity, Current BPD)
Table 4.42 Other Gas EOR Projects (Company, Project, Country, Start Date, Production bpd)
Table 4.43 Operating & Planned Anthropogenic CO2 Provider Facilities in Brazil (Project Name, Location, Companies, Capacity (MMtpa), Operation date and Clients)
Table 4.44 Operational Thermal Oil Sands Projects (Company Name, Project Name, Technology, BPD Capacity, Current BPD)
Table 4.45 Planned Thermal Oil Sands Projects (Company Name, Project Name, Technology, bpd Capacity, Anticipated Production Start)
Table 4.46 Operating & Planned Anthropogenic CO2 Providers Facilities in the U.S. (Location, Companies, MMtpa Capacity, Operation Date and Clients)
List of Figures
Figure 2.1 Types of Enhanced Oil Recovery
Figure 3.1 Global EOR Spending Forecast 2019-2029 ($mn, AGR %)
Figure 3.2 World Liquid Fuel Consumption Forecast 2015-2040 (MMbpd)
Figure 3.2 Global EOR Production Forecast 2019-2029 (MMbbl/yr, AGR %)
Figure 3.3 WTI and Brent Oil Prices 2010-2018 ($/bbl)
Figure 3.4 Average Monthly OPEC Crude Oil Price July 2017-July 2018 ($/bbl)
Figure 3.5 China and India Annual GDP Growth 2012-2018 (%)
Figure 3.6 US Refined Product Consumption January 2017 to Sept 2018 Four-Week Average (Mbpd)
Figure 3.7 Visiongain’s Anticipated Brent Crude Oil Price, 2018, 2019, 2020-2022, 2026-2025, 2026-2029 ($/bbl)
Figure 4.1 Business Performance of BP PLC, 2015-2017, $Mn
Figure 4.2 Business Performance of BP PLC, By Business Segments, 2017, %share
Figure 4.3 Business Performance of BP PLC, By Geography, 2017, % Share
Figure 4.4 Business Performance of Canadian Natural Resources Limited, 2015-2017, $Mn
Figure 4.5 Business Performance of Cenovus Energy Inc., 2015-2017, $Mn
Figure 4.6 Business Performance of Cenovus Energy Inc., By Business Segments, 2017, %share
Figure 4.7 Business Performance of Cenovus Energy Inc., By Geography, 2017, %Share
Figure 4.8 Business Performance of Chevron Corporation, 2015-2017, $Mn
Figure 4.9 Business Performance of Chevron Corporation, By Business Segments, 2017, %share
Figure 4.10 Business Performance of Chevron Corporation, By Geography, 2017, %Share
Figure 4.11 Total Company Revenue of China National Petroleum Corporation, 2015-2017, $Mn
Figure 4.12 Total Company Revenue of China Petrochemical Corporation, 2015-2017, $Mn
Figure 4.13 Business Performance of China Petrochemical Corporation, By Business Segments, 2017, %share
Figure 4.14 Business Performance of China Petrochemical Corporation, By Geography, 2017, %Share
Figure 4.15 Business Performance of CNOOC Limited, By Business Segments, 2017, %share
Figure 4.16 Company Revenue of ConocoPhillips Company, 2015-2017, $Mn
Figure 4.17 Business Performance of ConocoPhillips Company, By Business Segments, 2017, %share
Figure 4.18 Business Performance of ConocoPhillips Company, By Product, 2017, %Share
Figure 4.19 Business Performance of ConocoPhillips Company, By Geography, 2017, %Share
Figure 4.20 Developed Crude Oil by ConocoPhillips Company, 2016-2017, Millions of Barrels
Figure 4.21 Total Company Revenue of Equinor ASA, Inc., 2015-2017, $Mn
Figure 4.22 Business Performance of Equinor ASA, Inc., By Business Segments, 2017, %share
Figure 4.23 Business Performance of Equinor ASA, Inc., By Geography, 2017, %Share
Figure 4.24 Total Company Revenue of ExxonMobil Corporation, 2015-2017, $Mn
Figure 4.25 Business Performance of ExxonMobil Corporation, By Business Segments, 2017, %share
Figure 4.26 Business Performance of ExxonMobil Corporation, By Geography, 2017, %Share
Figure 4.27 Total Crude Oil and Natural Gas Liquids Production by ExxonMobil Corporation, 2015-2017, thousands of barrels daily
Figure 4.28 Total Company Revenue of Halliburton Company, 2015-2017, $Mn
Figure 4.29 Business Performance of Halliburton Company, By Business Segments, 2017, %share
Figure 4.30 Business Performance of Halliburton Company, By Geography, 2017, %Share
Figure 4.31 Total Company Revenue of Husky Energy Inc., 2015-2017, $Mn
Figure 4.32 Business Performance of Husky Energy Inc., By Business Segments, 2017, %share
Figure 4.33 Business Performance of Husky Energy Inc., By Upstream Business Segment, 2017, %share
Figure 4.34 Business Performance of Husky Energy Inc., By Downstream Business Segment, 2017, %share
Figure 4.35 Business Performance of Husky Energy Inc., By Geography, 2017, $Million
Figure 4.36 Total Company Revenue of Imperial Oil Limited, 2015-2017, $Mn
Figure 4.37 Business Performance of Imperial Oil Limited, By Business Segments, 2017, %share
Figure 4.38 Gross Crude Oil Production by Imperial Oil Limited, 2017-2016, Thousands Of Barrels Per Day
Figure 4.39 Total Company Revenue of Kinder Morgan, Inc., 2015-2017, $Mn
Figure 4.40 Business Performance of Kinder Morgan, Inc., By Business Segments, 2017, %share
Figure 4.41 Business Performance of Kinder Morgan, Inc., By Geography, 2017, %Share
Figure 4.42 Total Company Revenue of Occidental Petroleum Corporation, 2015-2017, $Mn
Figure 4.43 Business Performance of Occidental Petroleum Corporation, By Business Segments, 2017, %share
Figure 4.44 Business Performance of Occidental Petroleum Corporation, By Geography, 2017, %Share
Figure 4.45 Total Company Revenue of Petrobras, 2015-2017, $Mn
Figure 4.46 Business Performance of Petrobras, By Business Segments, 2017, %share
Figure 4.47 Total Company Revenue of PDVSA, 2014-2016, $Mn
Figure 4.48 Total Company Revenue of Royal Dutch Shell plc, 2015-2017, $Mn
Figure 4.49 Business Performance of Royal Dutch Shell plc, By Business Segments, 2017, %share
Figure 4.50 Business Performance of Royal Dutch Shell plc, By Geography, 2017, %Share
Figure 4.51 Business Performance of Suncor Energy Inc., 2015-2017, $Mn
Figure 4.52 Business Performance of Suncor Energy Inc., By Business Segments, 2017, %share
Figure 4.53 Business Performance of Suncor Energy Inc., By Geography, 2017, %Share
Figure 4.54 Production Volume of Suncor Energy Inc., 2015-2017, mboe/d
Figure 4.55 Total Company Revenue of Total S.A., 2015-2017, $Mn
Figure 4.56 Business Performance of Total S.A., By Business Segments, 2017, %share
Figure 4.57 Business Performance of Total S.A., By Geography, 2017, %share
Angle Energy Inc.
AP Moller
Apache Corporation
ASA (Noreco)
Atahbasca Oil Sands Corp.
Atotech
Axion Energy
Barents Sea Exploration Collaboration (BaSEC)
Barrick Energy Ltd
Baytex Energy Corp.
Bellatrix Exploration Ltd.
BHP
BlackPearl Resources Inc
Bonavista Petroleum
BP
Bridas Corporation
Brion Energy
Canacol Energy Colombia S.A.
Canadian Natural Resources
Cavalier Energy Inc
Cenovus
Chevron
China National Offshore Oil Corporation (CNOOC)
China Petroleum & Chemical Corporation (Sinopec)
Connacher Oil and Gas
ConocoPhillips
Danmark B.V.
Devon Canada Corporation
Empyrean Energy Plc
Encana Corporation
Enerplus Corporation
Equinor (Statoil)
ExxonMobil Corporation
Gaogiao Petrochemical Co. Ltd.
Grizzly Oil Sands ULC
Halliburton Company
Harvest Operation Corp.
Hexacom
Hiland
Husky Energy Inc.
Imperial Oil Ltd
Japan Canada Oil Sands Limited
Kinder Morgan
Koch Exploration Canada LP
Lukoil
MacKay Operating Corp
Maersk
Marathon Oil
MEG Energy Corp
Microsoft Corp.
Mocal Energy
Murphy Oil Company
Nexen Inc.
Occidental Petroleum
Osum Oil Sands Corp
Pan American Energy (PAE)
Pengrowth Energy Corp.
Penn West Exploration
Perenco
Perpetual Energy Inc.
Petrobank Energy Resources
Petrobras
Petroleos de Venezuela S.A. (PDVSA)
Petroleum Development Oman (PDO)
PetroNor
Phaze Ventures
Roc Oil
Roncador
Rosneft
Schlumberger
SIBUR
SilverWillow Energy Corporation
Smart Oil
Suncor Energy Inc.
Sunshine Oilsands Ltd
Syncrude Canada Inc
Tangle Creek Energy
Torxen Energy
Total S.A.
Twin Butte energy
UTS Energy
Value Creation Inc.
Windtalker Energy Corp.
Organisations Mentioned
Kuwait Foreign Petroleum Exploration Company (KUFPEC)