The Thermal Enhanced Oil Recovery Market Report 2023-2033: This report will prove invaluable to leading firms striving for new revenue pockets if they wish to better understand the industry and its underlying dynamics. It will be useful for companies that would like to expand into different industries or to expand their existing operations in a new region.
Thermal energy has already been used in places such as Oman, Kuwait, and some fields in California
The expression “enhanced oil recovery” refers to the technology used to release crude oil which cannot be recovered from oil wells by means of regular technology. It is also called a tertiary recovery phase after primary and secondary oil recovery. Technologies are used in the mechanics of oil being caught in the rocks. The primary objective is either to lower the interfacial forces that trap the oil in pores in the formation of soil, to reduce the viscosity difference between oil and water phases or to change the reservoir and oil properties so that oil is released more quickly. The major drivers for the growth of the thermal enhanced oil recovery (EOR) market are maximizing recovery factors, progress in techniques of oil production, etc. On the other hand, high costs, transportation issues, etc factors are restraining the growth of this market.
According to Visiongain’s analysis, the thermal recovery technology is a proven commercially successful EOR technique. Thermal EOR typically entails burning natural gas to generate steam, which is then injected into the reservoir to heat heavy oil and reduce its viscosity. Solar-generated steam in EOR, on the other hand, is produced using concentrating solar power technology. Mirrors are used to reflect and concentrate sunlight onto receivers, which collect and convert solar energy to heat. The heat generated is then used to generate steam from water. One of the primary advantages of using solar energy for thermal EOR is that the crude oil produced has a lower energy cost and a lower carbon footprint.
What Questions Should You Ask before Buying a Market Research Report?
• How is the thermal enhanced oil recovery market evolving?
• What is driving and restraining the thermal enhanced oil recovery market?
• How will each thermal enhanced oil recovery submarket segment grow over the forecast period and how much revenue will these submarkets account for in 2033?
• How will the market shares for each thermal enhanced oil recovery submarket develop from 2023 to 2033?
• What will be the main driver for the overall market from 2023 to 2033?
• Will leading thermal enhanced oil recovery markets broadly follow the macroeconomic dynamics, or will individual national markets outperform others?
• How will the market shares of the national markets change by 2033 and which geographical region will lead the market in 2033?
• Who are the leading players and what are their prospects over the forecast period?
• What are the thermal enhanced oil recovery projects for these leading companies?
• How will the industry evolve during the period between 2023 and 2033? What are the implications of thermal enhanced oil recovery projects taking place now and over the next 10 years?
• Is there a greater need for product commercialisation to further scale the thermal enhanced oil recovery market?
• Where is the thermal enhanced oil recovery market heading and how can you ensure you are at the forefront of the market?
• What are the best investment options for new product and service lines?
• What are the key prospects for moving companies into a new growth path and C-suite?
You need to discover how this will impact the thermal enhanced oil recovery market today, and over the next 10 years:
• Our 384-page report provides 175 tables and 236 charts/graphs exclusively to you.
• The report highlights key lucrative areas in the industry so you can target them – NOW.
• It contains in-depth analysis of global, regional and national sales and growth.
• It highlights for you the key successful trends, changes and revenue projections made by your competitors.
This report tells you TODAY how the thermal enhanced oil recovery market will develop in the next 10 years, and in line with the variations in COVID-19 economic recession and bounce. This market is more critical now than at any point over the last 10 years.
Forecasts to 2033 and other analyses reveal commercial prospects
• In addition to revenue forecasting to 2033, our new study provides you with recent results, growth rates, and market shares.
• You will find original analyses, with business outlooks and developments.
• Discover qualitative analyses (including market dynamics, drivers, opportunities, restraints and challenges), cost structure, impact of rising thermal enhanced oil recovery prices and recent developments.
This report includes data analysis and invaluable insight into how COVID-19 will affect the industry and your company. Four COVID-19 recovery patterns and their impact, namely, “V”, “L”, “W” and “U” are discussed in this report.
Segments Covered in the Report
Market Segment by Spending
• CAPEX
• OPEX
Market Segment by End-Use
• Heavy Oil Production
• Extra-heavy Oil Production
• Other End-Use
Market Segment by Type
• Cyclic Steam Stimulation (CSS)
• In-Situ Combustion (ISC)
• Steam-Assisted Gravity Drainage (SAGD)
• Electrical Heating
Market Segment by Method
• Hot Fluid Injection Processes
• In-Situ Combustion (ISC)
• Electric Heating Methods
• Electromagnetic Method
• Other Methods
Market Segment by Technology
• Fast Steam Assisted Gravity Drainage (SAGD)
• Non-Condensable Gas Injection with Steam (NCG-SAGD)
• Once Through Heat Recovery Steam Generators (OTSG)
• Solar Thermal Enhanced Oil Recovery (ST‐EOR)
• Thermally-Assisted Gas-Oil Gravity Drainage (TAGOGD)
• Tertiary Gravity Drainage (TGD)

In addition to the revenue predictions for the overall world market and segments, you will also find revenue forecasts for four regional and 20 leading national markets:
North America
• U.S.
• Canada
Europe
• Germany
• Russia
• Netherlands
• Bahrain
• UK
• Rest of Europe
Asia Pacific
• China
• Indonesia
• India
• Australia
• South Korea
• Rest of Asia Pacific
Middle East & Africa
• GCC
• South Africa
• Rest of Middle East & Africa
Latin America
• Venezuela
• Mexico
• Rest of Latin America
 br />
br />
Need industry data? Please contact us today.
The report also includes profiles and for some of the leading companies in the Thermal Enhanced Oil Recovery Market, 2023 to 2033, with a focus on this segment of these companies’ operations.
Leading companies and the potential for market growth
• BP Plc
• Canadian Natural Resources Limited
• Cenovus Energy Inc
• Chevron Corp
• China National Offshore Oil Corporation (CNOOC)
• China Petroleum & Chemical Corporation
• ConocoPhillips
• Equinor ASA
• Exxon Mobil Corp.
• Ferus Pvt. Ltd.
• Halliburton Company
• Imperial Oil Ltd
• Kinder Morgan, Inc.
• Occidental Petroleum Corporation
• Petroleo Brasileiro S.A
• Petroleos de Venezuela. S.A (PDVSA)
• Royal Dutch Shell
• Suncor Energy Inc.
Overall world revenue for Thermal Enhanced Oil Recovery Market, 2023 to 2033 in terms of value the market will surpass US$22,673 million in 2023, our work calculates. We predict strong revenue growth through to 2033. Our work identifies which organizations hold the greatest potential. Discover their capabilities, progress, and commercial prospects, helping you stay ahead.
How will the Thermal Enhanced Oil Recovery Market, 2023 to 2033 report help you?
In summary, our 380+ page report provides you with the following knowledge:
• Revenue forecasts to 2033 for Thermal Enhanced Oil Recovery Market, 2023 to 2033 Market, with forecasts for Spending, Type, Technology, End-Use, Method and company size, each forecast at a global and regional level – discover the industry’s prospects, finding the most lucrative places for investments and revenues.
• Revenue forecasts to 2033 for four regional and 20 key national markets – See forecasts for the Thermal Enhanced Oil Recovery Market, 2023 to 2033 market in North America, Europe, Asia-Pacific, Latin America, and Middle East & Africa. Also forecasted is the market in the US, Canada, Mexico, Venezuela, Germany, Netherlands, China, India, Indonesia, and Australia among other prominent economies.
• Prospects for established firms and those seeking to enter the market – including company profiles for 18 of the major companies involved in the Thermal Enhanced Oil Recovery Market, 2023 to 2033.
Find quantitative and qualitative analyses with independent predictions. Receive information that only our report contains, staying informed with invaluable business intelligence.
Information found nowhere else
With our new report, you are less likely to fall behind in knowledge or miss out on opportunities. See how our work could benefit your research, analyses, and decisions. Visiongain’s study is for everybody needing commercial analyses for the Thermal Enhanced Oil Recovery Market, 2023 to 2033, market-leading companies. You will find data, trends and predictions.
To access the data contained in this document please email contactus@visiongain.com
Buy our report today Thermal Enhanced Oil Recovery (EOR) Market Report 2023-2033: Forecasts by Spending (CAPEX, OPEX), by End-use (Heavy Oil Production, Extra-heavy Oil Production, Other), by Type (Cyclic Steam Stimulation (CSS), In-Situ Combustion (ISC), Steam-Assisted Gravity Drainage (SAGD), Electrical Heating), by Method (Hot Fluid Injection Processes, In-Situ Combustion (ISC), Electric Heating Methods, Electromagnetic Method, Other), by Technology (Fast Steam Assisted Gravity Drainage (SAGD), Non-Condensable Gas Injection with Steam (NCG-SAGD), Once Through Heat Recovery Steam Generators (OTSG), Solar Thermal Enhanced Oil Recovery (ST-EOR), Thermally-Assisted Gas-Oil Gravity Drainage (TAGOGD), Tertiary Gravity Drainage (TGD)) AND Regional and Leading National Market Analysis PLUS Analysis of Leading Companies AND COVID-19 Impact and Recovery Pattern Analysis. Avoid missing out by staying informed – order our report now.
Visiongain is a trading partner with the US Federal Government
CCR Ref number: KD4R6
Do you have any custom requirements we can help you with? Any need for a specific country, geo region, market segment or specific company information? Contact us today, we can discuss your needs and see how we can help: contactus@visiongain.com
1. Report Overview
1.1 Objectives of the Study
1.2 Introduction to Thermal Enhanced Oil Recovery Market
1.3 What This Report Delivers
1.4 Why You Should Read This Report
1.5 Key Questions Answered by This Analytical Report Include:
1.6 Who is This Report For?
1.7 Research Methodology
1.7.1 Market Definitions
1.7.2 Market Evaluation & Forecasting Methodology
1.7.3 Data Validation
1.8 Frequently Asked Questions (FAQs)
1.9 Associated Visiongain Reports
1.10 About Visiongain
2 Executive Summary
2.1 Methods of Steam Thermal Recovery Improvement Oil (ERO)
2.2 How Does Thermal Oil Recovery Work?
2.3 Is Thermal Enhanced Oil Recovery Is Proved?
2.4 What Changes Are Happened While Processing?
2.5 How Much Waste Forms Do Thermal EOR Manufacture?
3 Premium Insights
3.1 Geographical Snapshot: Global Thermal Enhanced Oil Recovery Market
3.2 Spending Segment: Market Attractiveness Index
3.3 End-Use Segment: Market Attractiveness Index
3.4 Type Segment: Market Attractiveness Index
3.5 Method Segment: Market Attractiveness Index
3.6 Technology Segment: Market Attractiveness Index
4 Market Overview
4.1 Key Findings
4.2 Market Dynamics
4.2.1 Market Driving Factors
4.2.2 Market Restraining Factors
4.2.3 Market Opportunities
4.2.4 Market Challenges
4.3 COVID-19 Impact Analysis
4.3.1 “V-Shaped Recovery”
4.3.2 “W-Shaped Recovery”
4.3.3 “U-Shaped Recovery”
4.3.4 “L-Shaped Recovery”
4.4 Porter’s Five Forces Analysis
4.4.1 Bargaining Power of Suppliers
4.4.2 Bargaining Power of Buyers
4.4.3 Competitive Rivalry in the Market
4.4.4 Threat from Substitutes in the Market
4.4.5 Threat of New Entrants
4.5 PEST Analysis
5 Global Thermal Enhanced Oil Recovery Market Analysis
5.1 Key Findings
5.2 Global Thermal Enhanced Oil Recovery Market Analysis by Region
5.3 Global Thermal Enhanced Oil Recovery Market Analysis by Region
5.4 Global Thermal Enhanced Oil Recovery Market Analysis by Segments
6 Global Thermal Enhanced Oil Recovery Market Analysis by Spending
6.1 Segment Overview
6.2 Global Thermal Enhanced Oil Recovery Market Analysis by Spending
6.3 Global Thermal Enhanced Oil Recovery Market Analysis by Spending, 2023-2033 (US$ Mn)
6.4 CAPEX Segment
6.4.1 Global CAPEX Market Forecast
6.4.2 Global CAPEX Market by Region
6.5 OPEX Segment
6.5.1 Global OPEX Market Forecast
6.5.2 Global OPEX Market by Region
7 Global Thermal Enhanced Oil Recovery Market Analysis by End-Use
7.1 Global Thermal Enhanced Oil Recovery Market Analysis by End-Use
7.2 Global Thermal Enhanced Oil Recovery Market Analysis by End-Use, 2023-2033 (US$ Mn)
7.3 Heavy Oil Segment
7.3.1 Global Heavy Oil Production Market Forecast
7.3.2 Global Heavy Oil Production Market by Region
7.4 Extra Heavy Oil Segment
7.4.1 Global Extra-heavy Oil Production Market Forecast
7.4.2 Global Extra-heavy Oil Production Market by Region
7.5 Other End-Use Segment
7.5.1 Global Other End-Use Market Forecast
7.5.2 Global Other End-Use Market by Region
8 Global Thermal Enhanced Oil Recovery Market Analysis by Type
8.1 Segment Overview
8.2 Global Thermal Enhanced Oil Recovery Market Analysis by Type
8.3 Global Thermal Enhanced Oil Recovery Market Analysis by Type, 2023-2033 (US$ Mn)
8.4 Cyclic Steam Stimulation Segment
8.4.1 Global Cyclic Steam Stimulation (CSS) Market Forecast
8.4.2 Global Cyclic Steam Stimulation (CSS) Market by Region
8.5 In-Situ Combustion (ISC) Segment
8.5.1 Global In-Situ Combustion (ISC) Market Forecast
8.5.2 Global In-Situ Combustion (ISC) Market by Region
8.6 Steam-Assisted Gravity Drainage (SAGD) Segment
8.6.1 Global Steam-Assisted Gravity Drainage (SAGD) Market Forecast
8.6.2 Global Steam-Assisted Gravity Drainage (SAGD) Market by Region
8.7 Electrical Heating Segment
8.7.1 Global Electrical Heating Market Forecast
8.7.2 Global Electrical Heating Market by Region
9 Global Thermal Enhanced Oil Recovery Market Analysis by Method
9.1 Segment Overview
9.2 Global Thermal Enhanced Oil Recovery Market Analysis by Method
9.3 Global Thermal Enhanced Oil Recovery Market Analysis by Method, 2023-2033 (US$ Mn)
9.4 Hot Fluid Injection Processes Segment
9.4.1 Global Hot Fluid Injection Processes Market Forecast
9.4.2 Global Hot Fluid Injection Processes Market by Region
9.5 In-Situ Combustion (ISC) Segment
9.5.1 Global In-Situ Combustion (ISC) Market Forecast
9.5.2 Global In-Situ Combustion (ISC) Market by Region
9.6 Electric Heating Methods Segment
9.6.1 Global Electric heating methods Market Forecast
9.6.2 Global Electric heating methods Market by Region
9.7 Electromagnetic Method Segment
9.7.1 Global Electromagnetic Method Market Forecast
9.7.2 Global Electromagnetic Method Market by Region
9.8 Other Methods Segment
9.8.1 Global Other Methods Market Forecast
9.8.2 Global Other Methods Market by Region
10 Global Thermal Enhanced Oil Recovery Market Analysis by Technology
10.1 Global Thermal Enhanced Oil Recovery Market Analysis by Technology
10.2 Global Thermal Enhanced Oil Recovery Market Analysis by Technology, 2023-2033 (US$ Mn)
10.3 Fast Steam Assisted Gravity Drainage (SAGD) Segment
10.3.1 Global Fast Steam Assisted Gravity Drainage (SAGD) Market Forecast
10.3.2 Global Fast Steam Assisted Gravity Drainage (SAGD) Market by Region
10.4 Non-Condensable Gas Injection with Steam (NCG-SAGD) Segment
10.4.1 Global Non-Condensable Gas Injection with Steam (NCG-SAGD) Market Forecast
10.4.2 Global Non-Condensable Gas Injection with Steam (NCG-SAGD) Market by Region
10.5 Once Through Heat Recovery Steam Generators (OTSG)
10.5.1 Global Once Through Heat Recovery Steam Generators (OTSG) Market Forecast
10.5.2 Global Once Through Heat Recovery Steam Generators (OTSG) Market by Region
10.6 Solar Thermal Enhanced Oil Recovery (ST‐EOR) Segment
10.6.1 Global Solar Thermal Enhanced Oil Recovery (ST‐EOR) Market Forecast
10.6.2 Global Solar Thermal Enhanced Oil Recovery (ST‐EOR) Market by Region
10.7 Thermally-Assisted Gas-Oil Gravity Drainage (TAGOGD)
10.7.1 Global Thermally-Assisted Gas-Oil Gravity Drainage (TAGOGD) Market Forecast
10.7.2 Global Thermally-Assisted Gas-Oil Gravity Drainage (TAGOGD) Market by Region
10.8 Tertiary Gravity Drainage (TGD) Segment
10.8.1 Global Tertiary Gravity Drainage (TGD) Market Forecast
10.8.2 Global Tertiary Gravity Drainage (TGD) Market by Region
11 North America Thermal Enhanced Oil Recovery Market Analysis
11.1 Key Findings
11.2 North America Thermal Enhanced Oil Recovery Market Attractiveness Index
11.3 North America Thermal Enhanced Oil Recovery Market Size Estimation and Forecast by Value
11.4 North America Thermal Enhanced Oil Recovery Market Size Estimation and Forecast by Spending
11.5 North America Thermal Enhanced Oil Recovery Market Size Estimation and Forecast by End-Use
11.6 North America Thermal Enhanced Oil Recovery Market Size Estimation and Forecast by Type
11.7 North America Thermal Enhanced Oil Recovery Market Size Estimation and Forecast by Method
11.8 North America Thermal Enhanced Oil Recovery Market Size Estimation and Forecast by Technology
11.9 North America Thermal Enhanced Oil Recovery Market Size Estimation and Forecast by Country
11.10 US Market Analysis
11.10.1 The US Is in the Highest Market for Oil Worldwide
11.10.2 Enhanced Oil Recovery Projects in the US
11.11 Canada Market Analysis
11.11.1 The Nation Has Been the 4th Largest Oil Producers in the World Today
11.11.2 Enhanced Oil Recovery Projects
12 Europe Thermal Enhanced Oil Recovery Market Analysis
12.1 Key Findings
12.2 Europe Thermal Enhanced Oil Recovery Market Attractiveness Index
12.3 Europe Thermal Enhanced Oil Recovery Market Size Estimation and Forecast by Value
12.4 Europe Thermal Enhanced Oil Recovery Market Size Estimation and Forecast by Spending
12.5 Europe Thermal Enhanced Oil Recovery Market Size Estimation and Forecast by End-Use
12.6 Europe Thermal Enhanced Oil Recovery Market Size Estimation and Forecast by Type
12.7 Europe Thermal Enhanced Oil Recovery Market Size Estimation and Forecast by Method
12.8 Europe Thermal Enhanced Oil Recovery Market Size Estimation and Forecast by Technology
12.9 Europe Thermal Enhanced Oil Recovery Market Size Estimation and Forecast by Country
12.10 Russia Market Analysis
12.10.1 Market Outlook
12.11 Germany Market Analysis
12.11.1 The Lack of Significant Oil Wells in Germany Will Restrict the EOR Technology Industry
12.12 Netherlands Market Analysis
12.12.1 Market Outlook
12.13 Bahrain Market Analysis
12.13.1 Enhanced Oil Recovery Projects
12.14 UK Market Analysis
12.14.1 The United Kingdom is the EU25's largest oil producer.
12.15 Rest of Europe Market Analysis
12.15.1 European Energy Landscape Is Shifting
12.15.2 There Are No CO2-EOR Applications in Europe
13 Asia-Pacific Thermal Enhanced Oil Recovery Market Analysis
13.1 Key Findings
13.2 Asia-Pacific Thermal Enhanced Oil Recovery Market Attractiveness Index
13.3 Asia-Pacific Thermal Enhanced Oil Recovery Market Size Estimation and Forecast by Value
13.4 Asia-Pacific Thermal Enhanced Oil Recovery Market Size Estimation and Forecast by Spending
13.5 Asia-Pacific Thermal Enhanced Oil Recovery Market Size Estimation and Forecast by End-Use
13.6 Asia-Pacific Thermal Enhanced Oil Recovery Market Size Estimation and Forecast by Type
13.7 Asia-Pacific Thermal Enhanced Oil Recovery Market Size Estimation and Forecast by Method
13.8 Asia-Pacific Thermal Enhanced Oil Recovery Market Size Estimation and Forecast by Technology
13.9 Asia-Pacific Thermal Enhanced Oil Recovery Market Size Estimation and Forecast by Country
13.10 China Market Analysis
13.10.1 Market Outlook
13.11 India Market Analysis
13.11.1 India Is Now One of the World's Largest Users of Oil
13.12 Indonesia Market Analysis
13.12.1 The Output of Indonesian Crude Oil Has Declined
13.12.2 Indonesia Faces Energy Shortages In The Next Future
13.13 South Korea Market Analysis
13.13.1 Enhanced Oil Recovery Projects
13.14 Australia Market Analysis
13.14.1 Market Outlook
13.15 Rest of Asia Pacific Market Analysis
13.15.1 More Than 170 Campaigns Have Been Undertaken for Polymer Floods
14 Middle East & Africa Thermal Enhanced Oil Recovery Market Analysis
14.1 Key Findings
14.2 Middle East & Africa Thermal Enhanced Oil Recovery Market Attractiveness Index
14.3 Middle East & Africa Thermal Enhanced Oil Recovery Market Size Estimation and Forecast by Value
14.4 Middle East & Africa Thermal Enhanced Oil Recovery Market Size Estimation and Forecast by Spending
14.5 Middle East & Africa Thermal Enhanced Oil Recovery Market Size Estimation and Forecast by End-Use
14.6 Middle East & Africa Thermal Enhanced Oil Recovery Market Size Estimation and Forecast by Type
14.7 Middle East & Africa Thermal Enhanced Oil Recovery Market Size Estimation and Forecast by Method
14.8 Middle East & Africa Thermal Enhanced Oil Recovery Market Size Estimation and Forecast by Technology
14.9 Middle East & Africa Thermal Enhanced Oil Recovery Market Size Estimation and Forecast by Country
14.10 GCC Market Analysis
14.10.1 The Production of Heavy Oil Deposits of the Country Is a Key Driver of Potential Growth on the Kuwaiti EOR Industry
14.11 South Africa Market Analysis
14.11.1 Market Outlook
14.11.2 South Africa's Thermal EOR Market Has Been Supported by a Country's Highly Viscous Oil
14.12 Rest of Middle East & Africa Market Analysis
14.12.1 Market Outlook
15 Latin America Thermal Enhanced Oil Recovery Market Analysis
15.1 Key Findings
15.2 Latin America Thermal Enhanced Oil Recovery Market Attractiveness Index
15.3 Latin America Thermal Enhanced Oil Recovery Market Size Estimation and Forecast by Value
15.4 Latin America Thermal Enhanced Oil Recovery Market Size Estimation and Forecast by Spending
15.5 Latin America Thermal Enhanced Oil Recovery Market Size Estimation and Forecast by End-Use
15.6 Latin America Thermal Enhanced Oil Recovery Market Size Estimation and Forecast by Type
15.7 Latin America Thermal Enhanced Oil Recovery Market Size Estimation and Forecast by Method
15.8 Latin America Thermal Enhanced Oil Recovery Market Size Estimation and Forecast by Technology
15.9 Latin America Thermal Enhanced Oil Recovery Market Size Estimation and Forecast by Country
15.10 Venezuela Market Analysis
15.10.1 Market Outlook
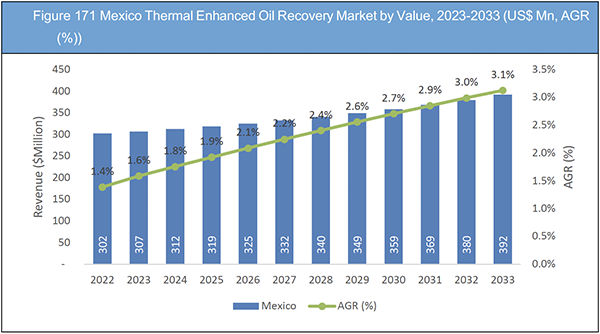
15.11 Mexico Market Analysis
15.11.1 Market Outlook
15.12 Rest of Latin America Market Analysis
16 Competitive Landscape
16.1 Company Share Analysis
16.2 Key Business Strategy Analysis
17 Company Profiles
17.1 BP Plc.
17.1.1 Company Snapshot
17.1.2 Company Overview
17.1.3 Financial Analysis
17.1.4 Product Benchmarking
17.1.5 Strategic Outlook
17.2 Canadian Natural Resources Limited
17.2.1 Company Snapshot
17.2.2 Company Overview
17.2.3 Financial Analysis
17.2.4 Product Benchmarking
17.2.5 Strategic Outlook
17.3 Cenovus Energy Inc.
17.3.1 Company Snapshot
17.3.2 Company Overview
17.3.3 Financial Analysis
17.3.4 Product Benchmarking
17.3.5 Strategic Outlook
17.4 Chevron Corporation
17.4.1 Company Snapshot
17.4.2 Company Overview
17.4.3 Financial Analysis
17.4.4 Product Benchmarking
17.4.5 Strategic Outlook
17.5 China National Offshore Oil Corporation (CNOOC)
17.5.1 Company Snapshot
17.5.2 Company Overview
17.5.3 Financial Analysis
17.5.4 Product Benchmarking
17.5.5 Strategic Outlook
17.6 China Petroleum & Chemical Corporation
17.6.1 Company Snapshot
17.6.2 Company Overview
17.6.3 Financial Analysis
17.6.4 Product Benchmarking
17.6.5 Strategic Outlook
17.7 ConocoPhillips
17.7.1 Company Snapshot
17.7.2 Company Overview
17.7.3 Financial Analysis
17.7.4 Product Benchmarking
17.7.5 Strategic Outlook
17.8 Equinor ASA
17.8.1 Company Snapshot
17.8.2 Company Overview
17.8.3 Financial Analysis
17.8.4 Product Benchmarking
17.8.5 Strategic Outlook
17.9 Exxon Mobil Corporation
17.9.1 Company Snapshot
17.9.2 Company Overview
17.9.3 Financial Analysis
17.9.4 Product Benchmarking
17.9.5 Strategic Outlook
17.10 Ferus Pvt. Ltd.
17.10.1 Company Snapshot
17.10.2 Company Overview
17.10.3 Product Benchmarking
17.10.4 Strategic Outlook
17.11 Halliburton Company
17.11.1 Company Snapshot
17.11.2 Company Overview
17.11.3 Financial Analysis
17.11.4 Product Benchmarking
17.11.5 Strategic Outlook
17.12 Imperial Oil Limited
17.12.1 Company Snapshot
17.12.2 Company Overview
17.12.3 Financial Analysis
17.12.4 Product Benchmarking
17.12.5 Strategic Outlook
17.13 Kinder Morgan, Inc.
17.13.1 Company Snapshot
17.13.2 Company Overview
17.13.3 Financial Analysis
17.13.4 Product Benchmarking
17.13.5 Strategic Outlook
17.14 Occidental Petroleum Corporation
17.14.1 Company Snapshot
17.14.2 Company Overview
17.14.3 Financial Analysis
17.14.4 Product Benchmarking
17.14.5 Strategic Outlook
17.15 Petroleo Brasileiro S.A
17.15.1 Company Snapshot
17.15.2 Company Overview
17.15.3 Financial Analysis
17.15.4 Product Benchmarking
17.15.5 Strategic Outlook
17.16 Petroleos De Venezuela. S.A (PDVSA)
17.16.1 Company Snapshot
17.16.2 Company Overview
17.16.3 Product Benchmarking
17.16.4 Strategic Outlook
17.17 Royal Dutch Shell
17.17.1 Company Snapshot
17.17.2 Company Overview
17.17.3 Financial Analysis
17.17.4 Product Benchmarking
17.17.5 Strategic Outlook
17.18 Suncor Energy Inc
17.18.1 Company Snapshot
17.18.2 Company Overview
17.18.3 Financial Analysis
17.18.4 Product Benchmarking
17.18.5 Strategic Outlook
18 Conclusion and Recommendations
18.1 Concluding Remarks from Visiongain
18.2 Recommendations for Market Players
18.2.1 Required New Technologies
18.2.2 Long Term Prospects for Projects
18.2.3 Increased Support for EOR by Government
18.2.4 Enhanced Business Experience
List of Tables
Table 1 Global Thermal Enhanced Oil Recovery Market Snapshot, 2023 & 2033 (US$ Mn, CAGR %)
Table 2 Global Thermal Enhanced Oil Recovery Market Forecast, 2023-2033 (US$ Mn, AGR (%), CAGR (%)) (V-Shaped Recovery Scenario)
Table 3 Global Thermal Enhanced Oil Recovery Market by Region, 2023-2033 (US$ Mn, AGR (%), CAGR (%)) (V-Shaped Recovery Scenario)
Table 4 Global Thermal Enhanced Oil Recovery Market Forecast, 2023-2033 (US$ Mn, AGR (%), CAGR (%)) (W-Shaped Recovery Scenario)
Table 5 Global Thermal Enhanced Oil Recovery Market by Region, 2023-2033 (US$ Mn, AGR (%), CAGR (%)) (W-Shaped Recovery Scenario)
Table 6 Global Thermal Enhanced Oil Recovery Market Forecast, 2023-2033 (US$ Mn, AGR (%), CAGR (%)) (U-Shaped Recovery Scenario)
Table 7 Global Thermal Enhanced Oil Recovery Market by Region, 2023-2033 (US$ Mn, AGR (%), CAGR (%)) (U-Shaped Recovery Scenario)
Table 8 Global Thermal Enhanced Oil Recovery Market Forecast, 2023-2033 (US$ Mn, AGR (%), CAGR (%)) (L-Shaped Recovery Scenario)
Table 9 Global Thermal Enhanced Oil Recovery Market by Region, 2023-2033 (US$ Mn, AGR (%), CAGR (%)) (L-Shaped Recovery Scenario)
Table 10 Global Thermal Enhanced Oil Recovery Market Forecast PEST Analysis
Table 11 Global Thermal Enhanced Oil Recovery Market Forecast, 2023-2033 (US$ Mn, AGR (%), CAGR (%))
Table 12 Global Thermal Enhanced Oil Recovery Market by Region, 2023-2033 (US$ Mn, AGR (%), CAGR (%))
Table 13 Global Thermal Enhanced Oil Recovery Market by Spending, 2023-2033 (US$ Mn, AGR (%), CAGR (%))
Table 14 Global Thermal Enhanced Oil Recovery Market by End-Use, 2023-2033 (US$ Mn, AGR (%), CAGR (%))
Table 15 Global Thermal Enhanced Oil Recovery Market by Type, 2023-2033 (US$ Mn, AGR (%), CAGR (%))
Table 16 Global Thermal Enhanced Oil Recovery Market by Method, 2023-2033 (US$ Mn, AGR (%), CAGR (%))
Table 17 Global Thermal Enhanced Oil Recovery Market by Technology, 2023-2033 (US$ Mn, AGR (%), CAGR (%))
Table 18 Global Thermal Enhanced Oil Recovery Market by Spending, 2023-2033 (US$ Mn, AGR (%), CAGR (%))
Table 19 Global CAPEX Market Forecast, 2023-2033 (US$ Mn, AGR (%), CAGR (%))
Table 20 Global CAPEX Market by Region, 2023-2033 (US$ Mn, AGR (%), CAGR (%))
Table 21 Global OPEX Market Forecast, 2023-2033 (US$ Mn, AGR (%), CAGR (%))
Table 22 Global OPEX Market by Region, 2023-2033 (US$ Mn, AGR (%), CAGR (%))
Table 23 Global Thermal Enhanced Oil Recovery Market by End-Use, 2023-2033 (US$ Mn, AGR (%), CAGR (%))
Table 24 Global Heavy Oil Production Market Forecast, 2023-2033 (US$ Mn, AGR (%), CAGR (%))
Table 25 Global Heavy Oil Production Market by Region, 2023-2033 (US$ Mn, AGR (%), CAGR (%))
Table 26 Global Extra-heavy Oil Production Market Forecast, 2023-2033 (US$ Mn, AGR (%), CAGR (%))
Table 27 Global Extra-heavy Oil Production Market by Region, 2023-2033 (US$ Mn, AGR (%), CAGR (%))
Table 28 Global Other End-Use Market Forecast, 2023-2033 (US$ Mn, AGR (%), CAGR (%))
Table 29 Global Other End-Use Market by Region, 2023-2033 (US$ Mn, AGR (%), CAGR (%))
Table 30 Global Thermal Enhanced Oil Recovery Market by Type, 2023-2033 (US$ Mn, AGR (%), CAGR (%))
Table 31 Global Cyclic Steam Stimulation (CSS) Market Forecast, 2023-2033 (US$ Mn, AGR (%), CAGR (%))
Table 32 Global Cyclic Steam Stimulation (CSS) Market by Region, 2023-2033 (US$ Mn, AGR (%), CAGR (%))
Table 33 Global In-Situ Combustion (ISC) Market Forecast, 2023-2033 (US$ Mn, AGR (%), CAGR (%))
Table 34 Global In-Situ Combustion (ISC) Market by Region, 2023-2033 (US$ Mn, AGR (%), CAGR (%))
Table 35 Global Steam-Assisted Gravity Drainage (SAGD) Market Forecast, 2023-2033 (US$ Mn, AGR (%), CAGR (%))
Table 36 Global Steam-Assisted Gravity Drainage (SAGD) Market by Region, 2023-2033 (US$ Mn, AGR (%), CAGR (%))
Table 37 Global Electrical Heating Market Forecast, 2023-2033 (US$ Mn, AGR (%), CAGR (%))
Table 38 Global Electrical Heating Market by Region, 2023-2033 (US$ Mn, AGR (%), CAGR (%))
Table 39 Global Thermal Enhanced Oil Recovery Market by Method, 2023-2033 (US$ Mn, AGR (%), CAGR (%))
Table 40 Global Hot Fluid Injection Processes Market Forecast, 2023-2033 (US$ Mn, AGR (%), CAGR (%))
Table 41 Global Hot Fluid Injection Processes Market by Region, 2023-2033 (US$ Mn, AGR (%), CAGR (%))
Table 42 Global In-Situ Combustion (ISC) Market Forecast, 2023-2033 (US$ Mn, AGR (%), CAGR (%))
Table 43 Global In-Situ Combustion (ISC) Market by Region, 2023-2033 (US$ Mn, AGR (%), CAGR (%))
Table 44 Global Electric heating methods Market Forecast, 2023-2033 (US$ Mn, AGR (%), CAGR (%))
Table 45 Global Electric heating methods Market by Region, 2023-2033 (US$ Mn, AGR (%), CAGR (%))
Table 46 Global Electromagnetic Method Market Forecast, 2023-2033 (US$ Mn, AGR (%), CAGR (%))
Table 47 Global Electromagnetic Method Market by Region, 2023-2033 (US$ Mn, AGR (%), CAGR (%))
Table 48 Global Other Methods Market Forecast, 2023-2033 (US$ Mn, AGR (%), CAGR (%))
Table 49 Global Other Methods Market by Region, 2023-2033 (US$ Mn, AGR (%), CAGR (%))
Table 50 Global Thermal Enhanced Oil Recovery Market by Technology, 2023-2033 (US$ Mn, AGR (%), CAGR (%))
Table 51 Global Fast Steam Assisted Gravity Drainage (SAGD) Market Forecast, 2023-2033 (US$ Mn, AGR (%), CAGR (%))
Table 52 Global Fast Steam Assisted Gravity Drainage (SAGD) Market by Region, 2023-2033 (US$ Mn, AGR (%), CAGR (%))
Table 53 Global Non-Condensable Gas Injection with Steam (NCG-SAGD) Market Forecast, 2023-2033 (US$ Mn, AGR (%), CAGR (%))
Table 54 Global Non-Condensable Gas Injection with Steam (NCG-SAGD) Market by Region, 2023-2033 (US$ Mn, AGR (%), CAGR (%))
Table 55 Global Once Through Heat Recovery Steam Generators (OTSG) Market Forecast, 2023-2033 (US$ Mn, AGR (%), CAGR (%))
Table 56 Global Once Through Heat Recovery Steam Generators (OTSG) Market by Region, 2023-2033 (US$ Mn, AGR (%), CAGR (%))
Table 57 Global Solar Thermal Enhanced Oil Recovery (ST‐EOR) Market Forecast, 2023-2033 (US$ Mn, AGR (%), CAGR (%))
Table 58 Global Solar Thermal Enhanced Oil Recovery (ST‐EOR) Market by Region, 2023-2033 (US$ Mn, AGR (%), CAGR (%))
Table 59 Global Thermally-Assisted Gas-Oil Gravity Drainage (TAGOGD) Market Forecast, 2023-2033 (US$ Mn, AGR (%), CAGR (%))
Table 60 Global Thermally-Assisted Gas-Oil Gravity Drainage (TAGOGD) Market by Region, 2023-2033 (US$ Mn, AGR (%), CAGR (%))
Table 61 Global Tertiary Gravity Drainage (TGD) Market Forecast, 2023-2033 (US$ Mn, AGR (%), CAGR (%))
Table 62 Global Tertiary Gravity Drainage (TGD) Market by Region, 2023-2033 (US$ Mn, AGR (%), CAGR (%))
Table 63 North America Thermal Enhanced Oil Recovery Market by Value, 2023-2033 (US$ Mn, AGR (%), CAGR (%))
Table 64 North America Thermal Enhanced Oil Recovery Market by Spending, 2023-2033 (US$ Mn, AGR (%), CAGR (%))
Table 65 North America Thermal Enhanced Oil Recovery Market by End-Use, 2023-2033 (US$ Mn, AGR (%), CAGR (%))
Table 66 North America Thermal Enhanced Oil Recovery Market by Type, 2023-2033 (US$ Mn, AGR (%), CAGR (%))
Table 67 North America Thermal Enhanced Oil Recovery Market by Method, 2023-2033 (US$ Mn, AGR (%), CAGR (%))
Table 68 North America Thermal Enhanced Oil Recovery Market by Technology, 2023-2033 (US$ Mn, AGR (%), CAGR (%))
Table 69 North America Thermal Enhanced Oil Recovery Market by Country, 2023-2033 (US$ Mn, AGR (%), CAGR (%))
Table 70 US Thermal Enhanced Oil Recovery Market Current Projects
Table 71 US Thermal Enhanced Oil Recovery Market by Value, 2023-2033 (US$ Mn, AGR (%), CAGR (%))
Table 72 Canada Thermal Enhanced Oil Recovery Market by Value, 2023-2033 (US$ Mn, AGR (%), CAGR (%))
Table 73 Europe Thermal Enhanced Oil Recovery Market by Value, 2023-2033 (US$ Mn, AGR (%), CAGR (%))
Table 74 Europe Thermal Enhanced Oil Recovery Market by Spending, 2023-2033 (US$ Mn, AGR (%), CAGR (%))
Table 75 Europe Thermal Enhanced Oil Recovery Market by End-Use, 2023-2033 (US$ Mn, AGR (%), CAGR (%))
Table 76 Europe Thermal Enhanced Oil Recovery Market by Type, 2023-2033 (US$ Mn, AGR (%), CAGR (%))
Table 77 Europe Thermal Enhanced Oil Recovery Market by Method, 2023-2033 (US$ Mn, AGR (%), CAGR (%))
Table 78 Europe Thermal Enhanced Oil Recovery Market by Technology, 2023-2033 (US$ Mn, AGR (%), CAGR (%))
Table 79 Europe Thermal Enhanced Oil Recovery Market by Country, 2023-2033 (US$ Mn, AGR (%), CAGR (%))
Table 80 Russia Thermal Enhanced Oil Recovery Market by Value, 2023-2033 (US$ Mn, AGR (%), CAGR (%))
Table 81 Germany Thermal Enhanced Oil Recovery Market by Value, 2023-2033 (US$ Mn, AGR (%), CAGR (%))
Table 82 Netherlands Thermal Enhanced Oil Recovery Market by Value, 2023-2033 (US$ Mn, AGR (%), CAGR (%))
Table 83 Bahrain Thermal Enhanced Oil Recovery Market by Value, 2023-2033 (US$ Mn, AGR (%), CAGR (%))
Table 84 UK Thermal Enhanced Oil Recovery Market by Value, 2023-2033 (US$ Mn, AGR (%), CAGR (%))
Table 85 Rest of Europe Thermal Enhanced Oil Recovery Market by Value, 2023-2033 (US$ Mn, AGR (%), CAGR (%))
Table 86 Asia-Pacific Thermal Enhanced Oil Recovery Market by Value, 2023-2033 (US$ Mn, AGR (%), CAGR (%))
Table 87 Asia-Pacific Thermal Enhanced Oil Recovery Market by Spending, 2023-2033 (US$ Mn, AGR (%), CAGR (%))
Table 88 Asia-Pacific Thermal Enhanced Oil Recovery Market by End-Use, 2023-2033 (US$ Mn, AGR (%), CAGR (%))
Table 89 Asia-Pacific Thermal Enhanced Oil Recovery Market by Type, 2023-2033 (US$ Mn, AGR (%), CAGR (%))
Table 90 Asia-Pacific Thermal Enhanced Oil Recovery Market by Method, 2023-2033 (US$ Mn, AGR (%), CAGR (%))
Table 91 Asia-Pacific Thermal Enhanced Oil Recovery Market by Technology, 2023-2033 (US$ Mn, AGR (%), CAGR (%))
Table 92 Asia-Pacific Thermal Enhanced Oil Recovery Market by Country, 2023-2033 (US$ Mn, AGR (%), CAGR (%))
Table 93 China Thermal Enhanced Oil Recovery Market by Value, 2023-2033 (US$ Mn, AGR (%), CAGR (%))
Table 94 India Thermal Enhanced Oil Recovery Market by Value, 2023-2033 (US$ Mn, AGR (%), CAGR (%))
Table 95 Indonesia Thermal Enhanced Oil Recovery Market by Value, 2023-2033 (US$ Mn, AGR (%), CAGR (%))
Table 96 South Korea Thermal Enhanced Oil Recovery Market by Value, 2023-2033 (US$ Mn, AGR (%), CAGR (%))
Table 97 Australia Thermal Enhanced Oil Recovery Market by Value, 2023-2033 (US$ Mn, AGR (%), CAGR (%))
Table 98 Rest of Asia-Pacific Thermal Enhanced Oil Recovery Market by Value, 2023-2033 (US$ Mn, AGR (%), CAGR (%))
Table 99 Middle East & Africa Thermal Enhanced Oil Recovery Market by Value, 2023-2033 (US$ Mn, AGR (%), CAGR (%))
Table 100 Middle East & Africa Thermal Enhanced Oil Recovery Market by Spending, 2023-2033 (US$ Mn, AGR (%), CAGR (%))
Table 101 Middle East & Africa Thermal Enhanced Oil Recovery Market by End-Use, 2023-2033 (US$ Mn, AGR (%), CAGR (%))
Table 102 Middle East & Africa Thermal Enhanced Oil Recovery Market by Type, 2023-2033 (US$ Mn, AGR (%), CAGR (%))
Table 103 Middle East & Africa Thermal Enhanced Oil Recovery Market by Method, 2023-2033 (US$ Mn, AGR (%), CAGR (%))
Table 104 Middle East & Africa Thermal Enhanced Oil Recovery Market by Technology, 2023-2033 (US$ Mn, AGR (%), CAGR (%))
Table 105 Middle East & Africa Thermal Enhanced Oil Recovery Market by Country, 2023-2033 (US$ Mn, AGR (%), CAGR (%))
Table 106 GCC Thermal Enhanced Oil Recovery Market by Value, 2023-2033 (US$ Mn, AGR (%), CAGR (%))
Table 107 South Africa Thermal Enhanced Oil Recovery Market by Value, 2023-2033 (US$ Mn, AGR (%), CAGR (%))
Table 108 Rest of Middle East & Africa Thermal Enhanced Oil Recovery Market by Value, 2023-2033 (US$ Mn, AGR (%), CAGR (%))
Table 109 Latin America Thermal Enhanced Oil Recovery Market by Value, 2023-2033 (US$ Mn, AGR (%), CAGR (%))
Table 110 Latin America Thermal Enhanced Oil Recovery Market by Spending, 2023-2033 (US$ Mn, AGR (%), CAGR (%))
Table 111 Latin America Thermal Enhanced Oil Recovery Market by End-Use, 2023-2033 (US$ Mn, AGR (%), CAGR (%))
Table 112 Latin America Thermal Enhanced Oil Recovery Market by Type, 2023-2033 (US$ Mn, AGR (%), CAGR (%))
Table 113 Latin America Thermal Enhanced Oil Recovery Market by Method, 2023-2033 (US$ Mn, AGR (%), CAGR (%))
Table 114 Latin America Thermal Enhanced Oil Recovery Market by Technology, 2023-2033 (US$ Mn, AGR (%), CAGR (%))
Table 115 Latin America Thermal Enhanced Oil Recovery Market by Country, 2023-2033 (US$ Mn, AGR (%), CAGR (%))
Table 116. Venezuela Thermal Enhanced Oil Recovery Market Project
Table 117 Venezuela Thermal Enhanced Oil Recovery Market by Value, 2023-2033 (US$ Mn, AGR (%), CAGR (%))
Table 118 Mexico Thermal Enhanced Oil Recovery Market by Value, 2023-2033 (US$ Mn, AGR (%), CAGR (%))
Table 119 Rest of Latin America Thermal Enhanced Oil Recovery Market by Value, 2023-2033 (US$ Mn, AGR (%), CAGR (%))
Table 120 Global Thermal Enhanced Oil Recovery Market: Company Share Analysis, 2021
Table 121 Key Business Strategies Adopted by Key Players in Global Thermal Enhanced Oil Recovery Market
Table 122 BP Plc: Key Details, (CEO, HQ, Revenue, Founded, No. of Employees, Company Type, Website, Business Segment)
Table 124 BP Plc: Strategic Outlook
Table 125 Canadian Natural Resources Limited: Key Details, (CEO, HQ, Revenue, Founded, No. of Employees, Company Type, Website, Business Segment)
Table 126 Canadian Natural Resources Limited: Product Benchmarking
Table 127 Canadian Natural Resources Limited: Strategic Outlook
Table 128 Cenovus Energy Inc: Key Details, (CEO, HQ, Revenue, Founded, No. of Employees, Company Type, Website, Business Segment)
Table 129 Cenovus Energy Inc: Product Benchmarking
Table 130 Cenovus Energy Inc: Strategic Outlook
Table 131 Chevron Corporation: Key Details, (CEO, HQ, Revenue, Founded, No. of Employees, Company Type, Website, Business Segment)
Table 132 Chevron Corporation: Product Benchmarking
Table 133 Chevron Corporation: Strategic Outlook
Table 134 China National Offshore Oil Corporation (CNOOC): Key Details, (CEO, HQ, Revenue, Founded, No. of Employees, Company Type, Website, Business Segment)
Table 135 China National Offshore Oil Corporation (CNOOC): Product Benchmarking
Table 136 China National Offshore Oil Corporation (CNOOC): Strategic Outlook
Table 137 China Petroleum & Chemical Corporation: Key Details, (CEO, HQ, Revenue, Founded, No. of Employees, Company Type, Website, Business Segment)
Table 138 China Petroleum & Chemical Corporation: Product Benchmarking
Table 139 China Petroleum & Chemical Corporation: Strategic Outlook
Table 140 ConocoPhillips: Key Details, (CEO, HQ, Revenue, Founded, No. of Employees, Company Type, Website, Business Segment)
Table 141 ConocoPhillips: Product Benchmarking
Table 142 ConocoPhillips: Strategic Outlook
Table 143 Equinor ASA: Key Details, (CEO, HQ, Revenue, Founded, No. of Employees, Company Type, Website, Business Segment)
Table 144 Equinor ASA: Product Benchmarking
Table 145 Equinor ASA: Strategic Outlook
Table 146 Exxon Mobil Corporation: Key Details, (CEO, HQ, Revenue, Founded, No. of Employees, Company Type, Website, Business Segment)
Table 147 Exxon Mobil Corporation: Product Benchmarking
Table 148 Exxon Mobil Corporation: Strategic Outlook
Table 149 Ferus Pvt.Ltd: Key Details, (CEO, HQ, Revenue, Founded, No. of Employees, Company Type, Website, Business Segment)
Table 150 Ferus Pvt.Ltd: Product Benchmarking
Table 151 Ferus Pvt.Ltd: Strategic Outlook
Table 152 Halliburton Company: Key Details, (CEO, HQ, Revenue, Founded, No. of Employees, Company Type, Website, Business Segment)
Table 153 Halliburton Company: Product Benchmarking
Table 154 Halliburton Company: Strategic Outlook
Table 155 Imperial Oil Limited: Key Details, (CEO, HQ, Revenue, Founded, No. of Employees, Company Type, Website, Business Segment)
Table 156 Imperial Oil Limited: Product Benchmarking
Table 157 Imperial Oil Limited: Strategic Outlook
Table 158 Kinder Morgan, Inc: Key Details, (CEO, HQ, Revenue, Founded, No. of Employees, Company Type, Website, Business Segment)
Table 159 Kinder Morgan, Inc: Product Benchmarking
Table 160 Kinder Morgan, Inc: Strategic Outlook
Table 161 Occidental Petroleum Corporation: Key Details, (CEO, HQ, Revenue, Founded, No. of Employees, Company Type, Website, Business Segment)
Table 162 Occidental Petroleum Corporation: Product Benchmarking
Table 163 Occidental Petroleum Corporation: Strategic Outlook
Table 164 Petroleo Brasileiro S.A: Key Details, (CEO, HQ, Revenue, Founded, No. of Employees, Company Type, Website, Business Segment)
Table 165 Petroleo Brasileiro S.A: Product Benchmarking
Table 166 Petroleo Brasileiro S.A: Strategic Outlook
Table 167 Petroleos de Venezuela. S.A (PDVSA): Key Details, (CEO, HQ, Revenue, Founded, No. of Employees, Company Type, Website, Business Segment)
Table 168 Petroleos de Venezuela. S.A (PDVSA): Product Benchmarking
Table 169 Petroleos de Venezuela. S.A (PDVSA): Strategic Outlook
Table 170 Royal Dutch Shell: Key Details, (CEO, HQ, Revenue, Founded, No. of Employees, Company Type, Website, Business Segment)
Table 171 Royal Dutch Shell: Product Benchmarking
Table 172 Royal Dutch Shell: Strategic Outlook
Table 173 Suncor Energy Inc: Key Details, (CEO, HQ, Revenue, Founded, No. of Employees, Company Type, Website, Business Segment)
Table 174 Suncor Energy Inc: Product Benchmarking
Table 175 Suncor Energy Inc: Strategic Outlook
List of Figures
Figure 1 Criteria and Alternatives of EOR Selection Problem
Figure 2 Global Thermal Enhanced Oil Recovery Market Segmentation
Figure 3 Breakdown of Primary Interviews: By Company Type, Designation, & Region
Figure 4 Global Thermal Enhanced Oil Recovery Market Forecast by Region: Market Attractiveness Index
Figure 5 Global Thermal Enhanced Oil Recovery Market by Spending: Market Attractiveness Index
Figure 6 Global Thermal Enhanced Oil Recovery Market by End-Use: Market Attractiveness Index
Figure 7 Global Thermal Enhanced Oil Recovery Market by Type: Market Attractiveness Index
Figure 8 Global Thermal Enhanced Oil Recovery Market by Method: Market Attractiveness Index
Figure 9 Global Thermal Enhanced Oil Recovery Market by Technology: Market Attractiveness Index
Figure 10 Global Thermal Enhanced Oil Recovery Market: Market Dynamics
Figure 11 Global COVID Impact Analysis: Thermal Enhanced Oil Recovery Market Recovery Scenarios
Figure 12 Global Thermal Enhanced Oil Recovery Market Forecast, 2023-2033 (US$ Mn, AGR (%)) (V-Shaped Recovery Scenario)
Figure 13 Global Thermal Enhanced Oil Recovery Market by Region, 2023-2033 (US$ Mn, AGR (%)) (V-Shaped Recovery Scenario)
Figure 14 Global Thermal Enhanced Oil Recovery Market Forecast, 2023-2033 (US$ Mn, AGR (%)) (W-Shaped Recovery Scenario)
Figure 15 Global Thermal Enhanced Oil Recovery Market by Region, 2023-2033 (US$ Mn, AGR (%)) (W-Shaped Recovery Scenario)
Figure 16 Global Thermal Enhanced Oil Recovery Market Forecast, 2023-2033 (US$ Mn, AGR (%)) (U-Shaped Recovery Scenario)
Figure 17 Global Thermal Enhanced Oil Recovery Market by Region, 2023-2033 (US$ Mn, AGR (%)) (U-Shaped Recovery Scenario)
Figure 18 Global Thermal Enhanced Oil Recovery Market Forecast, 2023-2033 (US$ Mn, AGR (%)) (L-Shaped Recovery Scenario)
Figure 19 Global Thermal Enhanced Oil Recovery Market by Region, 2023-2033 (US$ Mn, AGR (%)) (L-Shaped Recovery Scenario)
Figure 20 Global Thermal Enhanced Oil Recovery Market: Porter’s Five Forces Analysis
Figure 21 Global Thermal Enhanced Oil Recovery Market Forecast by Region, 2023-2033 (US$ Mn)
Figure 27 Global Thermal Enhanced Oil Recovery Market Forecast, 2023-2033 (US$ Mn, AGR (%))
Figure 28 Global Thermal Enhanced Oil Recovery Market by Region, 2023-2033 (US$ Mn, AGR (%))
Figure 29 Global Thermal Enhanced Oil Recovery Market by Spending, 2023-2033 (US$ Mn, AGR (%))
Figure 30 Global Thermal Enhanced Oil Recovery Market by End-Use, 2023-2033 (US$ Mn, AGR (%))
Figure 31 Global Thermal Enhanced Oil Recovery Market by Type, 2023-2033 (US$ Mn, AGR (%))
Figure 32 Global Thermal Enhanced Oil Recovery Market by Method, 2023-2033 (US$ Mn, AGR (%))
Figure 33 Global Thermal Enhanced Oil Recovery Market by Technology, 2023-2033 (US$ Mn, AGR (%))
Figure 34 Global Thermal Enhanced Oil Recovery Market Forecast by Spending, 2023-2033 (US$ Mn)
Figure 35 Global Thermal Enhanced Oil Recovery Market by Spending, 2023-2033 (US$ Mn, AGR (%))
Figure 36 Global CAPEX Market Forecast, 2023-2033 (US$ Mn, AGR (%))
Figure 37 Global CAPEX Market by Region, 2023-2033 (US$ Mn, AGR (%))
Figure 38 Global OPEX Market Forecast, 2023-2033 (US$ Mn, AGR (%))
Figure 39 Global OPEX Market by Region, 2023-2033 (US$ Mn, AGR (%))
Figure 40 Global Thermal Enhanced Oil Recovery Market Forecast by End-Use, 2023-2033 (US$ Mn)
Figure 41 Global Thermal Enhanced Oil Recovery Market by End-Use, 2023-2033 (US$ Mn, AGR (%))
Figure 42 Global Heavy Oil Production Market Forecast, 2023-2033 (US$ Mn, AGR (%))
Figure 43 Global Heavy Oil Production Market by Region, 2023-2033 (US$ Mn, AGR (%))
Figure 44 Global Extra-heavy Oil Production Market Forecast, 2023-2033 (US$ Mn, AGR (%))
Figure 45 Global Extra-heavy Oil Production Market by Region, 2023-2033 (US$ Mn, AGR (%))
Figure 46 Global Other End-Use Market Forecast, 2023-2033 (US$ Mn, AGR (%))
Figure 47 Global Other End-Use Market by Region, 2023-2033 (US$ Mn, AGR (%))
Figure 48 Global Thermal Enhanced Oil Recovery Market Forecast by Type, 2023-2033 (US$ Mn)
Figure 49 Global Thermal Enhanced Oil Recovery Market by Type, 2023-2033 (US$ Mn, AGR (%))
Figure 50 Global Cyclic Steam Stimulation (CSS) Market Forecast, 2023-2033 (US$ Mn, AGR (%))
Figure 51 Global Cyclic Steam Stimulation (CSS) Market by Region, 2023-2033 (US$ Mn, AGR (%))
Figure 52 Global In-Situ Combustion (ISC) Market Forecast, 2023-2033 (US$ Mn, AGR (%))
Figure 53 Global In-Situ Combustion (ISC) Market by Region, 2023-2033 (US$ Mn, AGR (%))
Figure 54 Global Steam-Assisted Gravity Drainage (SAGD) Market Forecast, 2023-2033 (US$ Mn, AGR (%))
Figure 55 Global Steam-Assisted Gravity Drainage (SAGD) Market by Region, 2023-2033 (US$ Mn, AGR (%))
Figure 56 Global Electrical Heating Market Forecast, 2023-2033 (US$ Mn, AGR (%))
Figure 57 Global Electrical Heating Market by Region, 2023-2033 (US$ Mn, AGR (%))
Figure 58 Global Thermal Enhanced Oil Recovery Market Forecast by Method, 2023-2033 (US$ Mn)
Figure 59 Global Thermal Enhanced Oil Recovery Market by Method, 2023-2033 (US$ Mn, AGR (%))
Figure 60 Global Hot Fluid Injection Processes Market Forecast, 2023-2033 (US$ Mn, AGR (%))
Figure 61 Global Hot Fluid Injection Processes Market by Region, 2023-2033 (US$ Mn, AGR (%))
Figure 62 Global In-Situ Combustion (ISC) Market Forecast, 2023-2033 (US$ Mn, AGR (%))
Figure 63 Global In-Situ Combustion (ISC) Market by Region, 2023-2033 (US$ Mn, AGR (%))
Figure 64 Global Electric heating methods Market Forecast, 2023-2033 (US$ Mn, AGR (%))
Figure 65 Global Electric heating methods Market by Region, 2023-2033 (US$ Mn, AGR (%))
Figure 66 Global Electromagnetic Method Market Forecast, 2023-2033 (US$ Mn, AGR (%))
Figure 67 Global Electromagnetic Method Market by Region, 2023-2033 (US$ Mn, AGR (%))
Figure 68 Global Other Methods Market Forecast, 2023-2033 (US$ Mn, AGR (%))
Figure 69 Global Other Methods Market by Region, 2023-2033 (US$ Mn, AGR (%))
Figure 70 Global Thermal Enhanced Oil Recovery Market Forecast by Technology, 2023-2033 (US$ Mn)
Figure 71 Global Thermal Enhanced Oil Recovery Market by Technology, 2023-2033 (US$ Mn, AGR (%))
Figure 72 Global Fast Steam Assisted Gravity Drainage (SAGD) Market Forecast, 2023-2033 (US$ Mn, AGR (%))
Figure 73 Global Fast Steam Assisted Gravity Drainage (SAGD) Market by Region, 2023-2033 (US$ Mn, AGR (%))
Figure 74 Global Non-Condensable Gas Injection with Steam (NCG-SAGD) Market Forecast, 2023-2033 (US$ Mn, AGR (%))
Figure 75 Global Non-Condensable Gas Injection with Steam (NCG-SAGD) Market by Region, 2023-2033 (US$ Mn, AGR (%))
Figure 76 Global Once Through Heat Recovery Steam Generators (OTSG) Market Forecast, 2023-2033 (US$ Mn, AGR (%))
Figure 77 Global Once Through Heat Recovery Steam Generators (OTSG) Market by Region, 2023-2033 (US$ Mn, AGR (%))
Figure 78 Global Solar Thermal Enhanced Oil Recovery (ST‐EOR) Market Forecast, 2023-2033 (US$ Mn, AGR (%)
Figure 79 Global Solar Thermal Enhanced Oil Recovery (ST‐EOR) Market by Region, 2023-2033 (US$ Mn, AGR (%))
Figure 80 Global Thermally-Assisted Gas-Oil Gravity Drainage (TAGOGD) Market Forecast, 2023-2033 (US$ Mn, AGR (%))
Figure 81 Global Thermally-Assisted Gas-Oil Gravity Drainage (TAGOGD) Market by Region, 2023-2033 (US$ Mn, AGR (%))
Figure 82 Global Tertiary Gravity Drainage (TGD) Market Forecast, 2023-2033 (US$ Mn, AGR (%))
Figure 83 Global Tertiary Gravity Drainage (TGD) Market by Region, 2023-2033 (US$ Mn, AGR (%))
Figure 84 North America Thermal Enhanced Oil Recovery Market Attractiveness Index
Figure 85 North America Thermal Enhanced Oil Recovery Market by Value, 2023-2033 (US$ Mn, AGR (%))
Figure 86 North America Thermal Enhanced Oil Recovery Market by Spending, 2023-2033 (US$ Mn, AGR (%))
Figure 87 North America Thermal Enhanced Oil Recovery Market Share Forecast by Spending, 2023, 2033 (%)
Figure 88 North America Thermal Enhanced Oil Recovery Market by End-Use, 2023-2033 (US$ Mn, AGR (%))
Figure 89 North America Thermal Enhanced Oil Recovery Market Share Forecast by End-Use, 2023, 2033 (%)
Figure 90 North America Thermal Enhanced Oil Recovery Market by Type, 2023-2033 (US$ Mn, AGR (%))
Figure 91 North America Thermal Enhanced Oil Recovery Market Share Forecast by Type, 2023, 2033 (%)
Figure 92 North America Thermal Enhanced Oil Recovery Market by Method, 2023-2033 (US$ Mn, AGR (%))
Figure 93 North America Thermal Enhanced Oil Recovery Market Share Forecast by Method, 2023, 2033 (%)
Figure 94 North America Thermal Enhanced Oil Recovery Market by Technology, 2023-2033 (US$ Mn, AGR (%))
Figure 95 North America Thermal Enhanced Oil Recovery Market Share Forecast by Technology, 2023, 2033 (%)
Figure 96 North America Thermal Enhanced Oil Recovery Market by Country, 2023-2033 (US$ Mn, AGR (%))
Figure 97 North America Thermal Enhanced Oil Recovery Market Share Forecast by Country, 2023, 2033 (%)
Figure 98 US Thermal Enhanced Oil Recovery Market by Value, 2023-2033 (US$ Mn, AGR (%))
Figure 99 Canada Thermal Enhanced Oil Recovery Market by Value, 2023-2033 (US$ Mn, AGR (%))
Figure 100 Europe Thermal Enhanced Oil Recovery Market Attractiveness Index
Figure 101 Europe Thermal Enhanced Oil Recovery Market by Value, 2023-2033 (US$ Mn, AGR (%))
Figure 102 Europe Thermal Enhanced Oil Recovery Market by Spending, 2023-2033 (US$ Mn, AGR (%))
Figure 103 Europe Thermal Enhanced Oil Recovery Market Share Forecast by Spending, 2023, 2033 (%)
Figure 104 Europe Thermal Enhanced Oil Recovery Market by End-Use, 2023-2033 (US$ Mn, AGR (%))
Figure 105 Europe Thermal Enhanced Oil Recovery Market Share Forecast by End-use, 2023, 2033 (%)
Figure 106 Europe Thermal Enhanced Oil Recovery Market by Type, 2023-2033 (US$ Mn, AGR (%))
Figure 107 Europe Thermal Enhanced Oil Recovery Market Share Forecast by Type, 2023, 2033 (%)
Figure 108 Europe Thermal Enhanced Oil Recovery Market by Method, 2023-2033 (US$ Mn, AGR (%))
Figure 109 Europe Thermal Enhanced Oil Recovery Market Share Forecast by Method, 2023, 2033 (%)
Figure 110 Europe Thermal Enhanced Oil Recovery Market by Technology, 2023-2033 (US$ Mn, AGR (%))
Figure 111 Europe Thermal Enhanced Oil Recovery Market Share Forecast by Technology, 2023, 2033 (%)
Figure 112 Europe Thermal Enhanced Oil Recovery Market by Country, 2023-2033 (US$ Mn, AGR (%))
Figure 113 Europe Thermal Enhanced Oil Recovery Market Share Forecast by Country, 2023, 2033 (%)
Figure 114 Russia Thermal Enhanced Oil Recovery Market by Value, 2023-2033 (US$ Mn, AGR (%))
Figure 115 Germany Thermal Enhanced Oil Recovery Market by Value, 2023-2033 (US$ Mn, AGR (%))
Figure 116 Netherlands Thermal Enhanced Oil Recovery Market by Value, 2023-2033 (US$ Mn, AGR (%))
Figure 117 Bahrain Thermal Enhanced Oil Recovery Market by Value, 2023-2033 (US$ Mn, AGR (%))
Figure 118 UK Thermal Enhanced Oil Recovery Market by Value, 2023-2033 (US$ Mn, AGR (%))
Figure 119 Rest of Europe Thermal Enhanced Oil Recovery Market by Value, 2023-2033 (US$ Mn, AGR (%))
Figure 120 Asia-Pacific Thermal Enhanced Oil Recovery Market by Value, 2023-2033 (US$ Mn, AGR (%))
Figure 121 Asia-Pacific Thermal Enhanced Oil Recovery Market by Spending, 2023-2033 (US$ Mn, AGR (%))
Figure 122 Asia-Pacific Thermal Enhanced Oil Recovery Market Share Forecast by Spending, 2023, 2033 (%)
Figure 123 Asia-Pacific Thermal Enhanced Oil Recovery Market by End-Use, 2023-2033 (US$ Mn, AGR (%))
Figure 124 Asia-Pacific Thermal Enhanced Oil Recovery Market Share Forecast by End Use, 2023, 2033 (%)
Figure 125 Asia-Pacific Thermal Enhanced Oil Recovery Market by Type, 2023-2033 (US$ Mn, AGR (%))
Figure 126 Asia-Pacific Thermal Enhanced Oil Recovery Market Share Forecast by Type, 2023, 2033 (%)
Figure 127 Asia-Pacific Thermal Enhanced Oil Recovery Market by Method, 2023-2033 (US$ Mn, AGR (%))
Figure 128 Asia-Pacific Thermal Enhanced Oil Recovery Market Share Forecast by Method, 2023, 2033 (%)
Figure 129 Asia-Pacific Thermal Enhanced Oil Recovery Market by Technology, 2023-2033 (US$ Mn, AGR (%))
Figure 130 Asia-Pacific Thermal Enhanced Oil Recovery Market Share Forecast by Technology, 2023, 2033 (%)
Figure 131 Asia-Pacific Thermal Enhanced Oil Recovery Market by Country, 2023-2033 (US$ Mn, AGR (%))
Figure 132 Asia-Pacific Thermal Enhanced Oil Recovery Market Share Forecast by Country, 2023, 2033 (%)
Figure 133 China Thermal Enhanced Oil Recovery Market by Value, 2023-2033 (US$ Mn, AGR (%))
Figure 134 India Thermal Enhanced Oil Recovery Market by Value, 2023-2033 (US$ Mn, AGR (%))
Figure 135 Indonesia Thermal Enhanced Oil Recovery Market by Value, 2023-2033 (US$ Mn, AGR (%))
Figure 136 South Korea Thermal Enhanced Oil Recovery Market by Value, 2023-2033 (US$ Mn, AGR (%))
Figure 137 Australia Thermal Enhanced Oil Recovery Market by Value, 2023-2033 (US$ Mn, AGR (%))
Figure 138 Rest of Asia-Pacific Thermal Enhanced Oil Recovery Market by Value, 2023-2033 (US$ Mn, AGR (%))
Figure 139 Middle East & Africa Thermal Enhanced Oil Recovery Market Attractiveness Index
Figure 140 Middle East & Africa Thermal Enhanced Oil Recovery Market by Value, 2023-2033 (US$ Mn, AGR (%))
Figure 141 Middle East & Africa Thermal Enhanced Oil Recovery Market by Spending, 2023-2033 (US$ Mn, AGR (%))
Figure 142 Middle East & Africa Thermal Enhanced Oil Recovery Market Share Forecast by Spending, 2023, 2033 (%)
Figure 143 Middle East & Africa Thermal Enhanced Oil Recovery Market by End-Use, 2023-2033 (US$ Mn, AGR (%))
Figure 144 Middle East & Africa Thermal Enhanced Oil Recovery Market Share Forecast by End Use, 2023, 2033 (%)
Figure 145 Middle East & Africa Thermal Enhanced Oil Recovery Market by Type, 2023-2033 (US$ Mn, AGR (%))
Figure 146 Middle East & Africa Thermal Enhanced Oil Recovery Market Share Forecast by Type, 2023, 2033 (%)
Figure 147 Middle East & Africa Thermal Enhanced Oil Recovery Market by Method, 2023-2033 (US$ Mn, AGR (%))
Figure 148 Middle East & Africa Thermal Enhanced Oil Recovery Market Share Forecast by Method, 2023, 2033 (%)
Figure 149 Middle East & Africa Thermal Enhanced Oil Recovery Market by Technology, 2023-2033 (US$ Mn, AGR (%))
Figure 150 Middle East & Africa Thermal Enhanced Oil Recovery Market Share Forecast by Technology, 2023, 2033 (%)
Figure 151 Middle East & Africa Thermal Enhanced Oil Recovery Market by Country, 2023-2033 (US$ Mn, AGR (%))
Figure 152 Middle East & Africa Thermal Enhanced Oil Recovery Market Share Forecast by Country, 2023, 2033 (%)
Figure 153 GCC Thermal Enhanced Oil Recovery Market by Value, 2023-2033 (US$ Mn, AGR (%))
Figure 154 South Africa Thermal Enhanced Oil Recovery Market by Value, 2023-2033 (US$ Mn, AGR (%))
Figure 155 Rest of Middle East & Africa Thermal Enhanced Oil Recovery Market by Value, 2023-2033 (US$ Mn, AGR (%))
Figure 156 Latin America Thermal Enhanced Oil Recovery Market Attractiveness Index
Figure 157 Latin America Thermal Enhanced Oil Recovery Market by Value, 2023-2033 (US$ Mn, AGR (%))
Figure 158 Latin America Thermal Enhanced Oil Recovery Market by Spending, 2023-2033 (US$ Mn, AGR (%))
Figure 159 Latin America Thermal Enhanced Oil Recovery Market Share Forecast by Spending, 2023, 2033 (%)
Figure 160 Latin America Thermal Enhanced Oil Recovery Market by End-Use, 2023-2033 (US$ Mn, AGR (%))
Figure 161 Latin America Thermal Enhanced Oil Recovery Market Share Forecast by End-Use, 2023, 2033 (%)
Figure 162 Latin America Thermal Enhanced Oil Recovery Market by Type, 2023-2033 (US$ Mn, AGR (%))
Figure 163 Latin America Thermal Enhanced Oil Recovery Market Share Forecast by Type, 2023, 2033 (%)
Figure 164 Latin America Thermal Enhanced Oil Recovery Market by Method, 2023-2033 (US$ Mn, AGR (%))
Figure 165 Latin America Thermal Enhanced Oil Recovery Market Share Forecast by Method, 2023, 2033 (%)
Figure 166 Latin America Thermal Enhanced Oil Recovery Market by Technology, 2023-2033 (US$ Mn, AGR (%))
Figure 167 Latin America Thermal Enhanced Oil Recovery Market Share Forecast by Technology, 2023, 2033 (%)
Figure 168 Latin America Thermal Enhanced Oil Recovery Market by Country, 2023-2033 (US$ Mn, AGR (%))
Figure 169 Latin America Thermal Enhanced Oil Recovery Market Share Forecast by Country, 2023, 2033 (%)
Figure 170 Venezuela Thermal Enhanced Oil Recovery Market by Value, 2023-2033 (US$ Mn, AGR (%))
Figure 171 Mexico Thermal Enhanced Oil Recovery Market by Value, 2023-2033 (US$ Mn, AGR (%))
Figure 172 Rest of Latin America Thermal Enhanced Oil Recovery Market by Value, 2023-2033 (US$ Mn, AGR (%))
Figure 173 BP Plc: Revenue, 2017-2021 (US$ Mn, AGR%)
Figure 174 BP Plc: Operating Income, 2017-2021 (US$ Mn, AGR%)
Figure 175 BP Plc: Net Income 2017-2021 (US$ Mn, AGR%)
Figure 176 BP Plc: EBITDA, 2017-2021 (US$ Mn, AGR%)
Figure 177 Canadian Natural Resources Limited: Revenue, 2017-2021 (US$ Mn, AGR%)
Figure 178 Canadian Natural Resources Limited: Operating Income, 2017-2021 (US$ Mn, AGR%)
Figure 179 Canadian Natural Resources Limited: Net Income 2017-2021 (US$ Mn, AGR%)
Figure 180 Canadian Natural Resources Limited: EBITDA, 2017-2021 (US$ Mn, AGR%)
Figure 181 Cenovus Energy Inc: Revenue, 2017-2021 (US$ Mn, AGR%)
Figure 182 Cenovus Energy Inc: Operating Income, 2017-2021 (US$ Mn, AGR%)
Figure 183 Cenovus Energy Inc: Net Income 2017-2021 (US$ Mn, AGR%)
Figure 184 Cenovus Energy Inc: EBITDA, 2017-2021 (US$ Mn, AGR%)
Figure 185 Chevron Corporation: Revenue, 2017-2021 (US$ Mn, AGR%)
Figure 186 Chevron Corporation: Operating Income, 2017-2021 (US$ Mn, AGR%)
Figure 187 Chevron Corporation: Net Income 2017-2021 (US$ Mn, AGR%)
Figure 188 Chevron Corporation: EBITDA, 2017-2021 (US$ Mn, AGR%)
Figure 189 China National Offshore Oil Corporation (CNOOC): Revenue, 2017-2021 (US$ Mn, AGR%)
Figure 190 China National Offshore Oil Corporation (CNOOC): Operating Income, 2017-2021 (US$ Mn, AGR%)
Figure 191 China National Offshore Oil Corporation (CNOOC): Net Income 2017-2021 (US$ Mn, AGR%)
Figure 192 China National Offshore Oil Corporation (CNOOC): EBITDA, 2017-2021 (US$ Mn, AGR%)
Figure 193 China Petroleum & Chemical Corporation: Revenue, 2017-2021 (US$ Mn, AGR%)
Figure 194 China Petroleum & Chemical Corporation: Operating Income, 2017-2021 (US$ Mn, AGR%)
Figure 195 China Petroleum & Chemical Corporation: Net Income 2017-2021 (US$ Mn, AGR%)
Figure 196 China Petroleum & Chemical Corporation: EBITDA, 2017-2021 (US$ Mn, AGR%)
Figure 197 ConocoPhillips: Revenue, 2017-2021 (US$ Mn, AGR%)
Figure 198 ConocoPhillips: Operating Income, 2017-2021 (US$ Mn, AGR%)
Figure 199 ConocoPhillips: Net Income 2017-2021 (US$ Mn, AGR%)
Figure 200 ConocoPhillips: EBITDA, 2017-2021 (US$ Mn, AGR%)
Figure 201 Equinor ASA: Revenue, 2017-2021 (US$ Mn, AGR%)
Figure 202 Equinor ASA: Operating Income, 2017-2021 (US$ Mn, AGR%)
Figure 203 Equinor ASA: Net Income 2017-2021 (US$ Mn, AGR%)
Figure 204 Equinor ASA: EBITDA, 2017-2021 (US$ Mn, AGR%)
Figure 205 Exxon Mobil Corporation: Revenue, 2017-2021 (US$ Mn, AGR%)
Figure 206 Exxon Mobil Corporation: Operating Income, 2017-2021 (US$ Mn, AGR%)
Figure 207 Exxon Mobil Corporation: Net Income 2017-2021 (US$ Mn, AGR%)
Figure 208 Exxon Mobil Corporation: EBITDA, 2017-2021 (US$ Mn, AGR%)
Figure 209 Halliburton Company: Revenue, 2017-2021 (US$ Mn, AGR%)
Figure 210 Halliburton Company: Operating Income, 2017-2021 (US$ Mn, AGR%)
Figure 211 Halliburton Company: Net Income 2017-2021 (US$ Mn, AGR%)
Figure 212 Halliburton Company: EBITDA, 2017-2021 (US$ Mn, AGR%)
Figure 213 Imperial Oil Limited: Revenue, 2017-2021 (US$ Mn, AGR%)
Figure 214 Imperial Oil Limited: Operating Income, 2017-2021 (US$ Mn, AGR%)
Figure 215 Imperial Oil Limited: Net Income 2017-2021 (US$ Mn, AGR%)
Figure 216 Imperial Oil Limited: EBITDA, 2017-2021 (US$ Mn, AGR%)
Figure 217 Kinder Morgan, Inc: Revenue, 2017-2021 (US$ Mn, AGR%)
Figure 218 Kinder Morgan, Inc: Operating Income, 2017-2021 (US$ Mn, AGR%)
Figure 219 Kinder Morgan, Inc: Net Income 2017-2021 (US$ Mn, AGR%)
Figure 220 Kinder Morgan, Inc: EBITDA, 2017-2021 (US$ Mn, AGR%)
Figure 221 Occidental Petroleum Corporation: Revenue, 2017-2021 (US$ Mn, AGR%)
Figure 222 Occidental Petroleum Corporation: Operating Income, 2017-2021 (US$ Mn, AGR%)
Figure 223 Occidental Petroleum Corporation: Net Income 2017-2021 (US$ Mn, AGR%)
Figure 224 Occidental Petroleum Corporation: EBITDA, 2017-2021 (US$ Mn, AGR%)
Figure 225 Petroleo Brasileiro S.A: Revenue, 2017-2021 (US$ Mn, AGR%)
Figure 226 Petroleo Brasileiro S.A: Operating Income, 2017-2021 (US$ Mn, AGR%)
Figure 227 Petroleo Brasileiro S.A: Net Income 2017-2021 (US$ Mn, AGR%)
Figure 228 Petroleo Brasileiro S.A: EBITDA, 2017-2021 (US$ Mn, AGR%)
Figure 229 Royal Dutch Shell: Revenue, 2017-2021 (US$ Mn, AGR%)
Figure 230 Royal Dutch Shell: Operating Income, 2017-2021 (US$ Mn, AGR%)
Figure 231 Royal Dutch Shell: Net Income 2017-2021 (US$ Mn, AGR%)
Figure 232 Royal Dutch Shell: EBITDA, 2017-2021 (US$ Mn, AGR%)
Figure 233 Suncor Energy Inc: Revenue, 2017-2021 (US$ Mn, AGR%)
Figure 234 Suncor Energy Inc: Operating Income, 2017-2021 (US$ Mn, AGR%)
Figure 235 Suncor Energy Inc: Net Income 2017-2021 (US$ Mn, AGR%)
Figure 236 Suncor Energy Inc: EBITDA, 2017-2021 (US$ Mn, AGR%)
List of Companies Profiled in the report
BP Plc
Canadian Natural Resources Limited
Cenovus Energy Inc
Chevron Corp
China National Offshore Oil Corporation (CNOOC)
China Petroleum & Chemical Corporation
ConocoPhillips
Equinor ASA
Exxon Mobil Corp.
Ferus Pvt. Ltd.
Halliburton Company
Imperial Oil Ltd
Kinder Morgan, Inc.
Occidental Petroleum Corporation
Petroleo Brasileiro S.A
Petroleos de Venezuela. S.A (PDVSA)
Royal Dutch Shell
Suncor Energy Inc.
List of Other Companies Mentioned in the report
Aera Energy
Athabasca Oil
Bayou State
Bayshore Petroleum
Blackpearl Resources
BP Migas
Brion Energy
Cenovus
Chevron Corporation
Chrysalix Energy venture Capital
Citgo Petroleum Group
CNPC
CNRL
Connacher
ConocoPhillips
Continental Resources
Denbury Resources
Devon Energy
E-T Energy
ENI
Equinor
Excelsior Energy
Exxon Mobil
Gazprom
Glass Point
Harvest Operations
Hot-Tec Energy
Husky Energy
Imperial Oil
Japan Canada Oil Sands
KGOC
Laricina Energy
Linn Energy
Lukoil
Maha Energy
MEG Energy
Naftex
NAM
Nexen
NOC
Nth Power
Occidental
Osum Oil Sands
Pacific Exploration
Pacific Rubiales
PDO
Pengrowth Energy
Petro-Canada
Petróleos de Venezuela S.A. PDVSA
Reliance
RockPort Capital
Rosneft
Royal Dutch Shell
Salym Petroleum Development N.V.
Sinopec
SKSPMIGAS
SOE
Suncor
Sunshine Oil Sands
Surgutneftegaz
Tatweer Petroleum
Tipco
Total
Touchstone
Valero
Wintershall
Zarubezhneft
List of Associations Mentioned in the Report
Alberta Energy Regulator
CASCO
CCC Leduc
Centre of Excellence in EOR (Malaysia)
Chemical EOR Alliance
Chinese EOR Laboratory
EOR Centre of Excellence (Oman)
EXPEC Advanced Research Center
FORCE (Forum for improved oil and gas recovery and improved exploration in Norway)
Government of Alberta
Government of Oman
Institute of Energy of Southeast Europe
Instituto Colombiano del Petróleo (ICP)
National Energy Technology Laboratory (NETL)
National Enhanced Oil Recovery Institute
Norwegian Government
Oil & Gas UK
OPEC
Petroleum Technology Research Centre
Research Partnership to Secure Energy for America (RPSEA)
RNZ Integrated
Saskatchewan Ministry of the Economy
Texas A&M University
The Joint Research Centre (JRC)
The United States Environmental Protection Agency (EPA)
U.S. Chamber of Commerce
U.S. Department of Energy (DoE)
UAE Oil Ministry
University of Kansas
University of Oklahoma
University of Wyoming Enhanced Oil Recovery Institute
 Market Report 2023-2033")