Industries > Energy > Deepwater & Ultra Deepwater Exploration & Production (E&P) Market Report 2022-2032
 Market Report 2022-2032")
Deepwater & Ultra Deepwater Exploration & Production (E&P) Market Report 2022-2032
Forecasts by Project (Production, Exploration), by Water Depth (Deepwater Ultra-Deepwater), by Type (Seismic, Drilling, Floating Operation Systems, Other), by Operation (Deepwater Geology, Deepwater Exploration, Drilling Rigs, Well Construction, Fixed and Floating Systems, Subsea Systems, ROVs and Service Vessels, Topside Construction, Pipelines, Flowlines, and Risers, Other), by SSLNG Re-Gasification (Open Rack Vaporisers (ORV), Submerged Combustion Vaporisers (SCV), Ambient Air Vaporisers (AAV), Odorisation, Send-out, and Delivery) AND Regional and Leading National Market Analysis PLUS Analysis of Leading Companies AND COVID-19 Recovery Scenarios
The Deepwater & Ultra Deepwater Exploration & Production (E&P) Market Report 2022-2032: This report will prove invaluable to leading firms striving for new revenue pockets if they wish to better understand the industry and its underlying dynamics. It will be useful for companies that would like to expand into different industries or to expand their existing operations in a new region.
New oil fields have been discovered as a result of the rising demand for oil and gas to meet energy demands
This has resulted in an increase in oil and gas extraction activity. Furthermore, the disparity between energy demand and supply has prompted the search for additional oil reserves all over the world. Authorities in countries like the United States, Iran, and Iraq have been focusing on finding new oilfields to produce oil and gas. For example, in 2019, the Iranian government claimed the discovery of new oilfields in the country’s southern region with a capacity of more than 50 million barrels of crude oil. In 2019, BP Plc announced the discovery of new oilfields in the Gulf of Mexico’s Thunder Horse field with a capacity of one billion barrels of oil.
What Are These Questions You Should Ask Before Buying A Market Research Report?
• How is the deepwater & ultra deepwater exploration & production (E&P) market evolving?
• What is driving and restraining the deepwater & ultra deepwater exploration & production (E&P) market?
• How will each deepwater & ultra deepwater exploration & production (E&P) submarket segment grow over the forecast period and how much revenue will these submarkets account for in 2032?
• How will the market shares for each deepwater & ultra deepwater exploration & production (E&P) submarket develop from 2022 to 2032?
• What will be the main driver for the overall market from 2022 to 2032?
• Will leading deepwater & ultra deepwater exploration & production (E&P) markets broadly follow the macroeconomic dynamics, or will individual national markets outperform others?
• How will the market shares of the national markets change by 2032 and which geographical region will lead the market in 2032?
• Who are the leading players and what are their prospects over the forecast period?
• What are the deepwater & ultra deepwater exploration & production (E&P) projects for these leading companies?
• How will the industry evolve during the period between 2020 and 2032? What are the implication of deepwater & ultra deepwater exploration & production (E&P) projects taking place now and over the next 10 years?
• Is there a greater need for product commercialisation to further scale the deepwater & ultra deepwater exploration & production (E&P) market?
• Where is the deepwater & ultra deepwater exploration & production (E&P) market heading? And how can you ensure you are at the forefront of the market?
• What can be the best investment options for new product and service lines?
• What are the key prospects for moving companies into a new growth path? C-suite?
You need to discover how this will impact the deepwater & ultra deepwater exploration & production (E&P) market today, and over the next 10 years:
• Our 448-page report provides 283 tables and 295 charts/graphs exclusively to you.
• The report highlights key lucrative areas in the industry so you can target them – NOW.
• Contains in-depth analyse of global, regional and national sales and growth
• Highlights for you the key successful trends, changes and revenue projections made by your competitors
This report tells you TODAY how the deepwater & ultra deepwater exploration & production (E&P) market will develop in the next 10 years, and in-line with the variations in COVID-19 economic recession and bounce. This market is more critical now than at any point over the last 10 years.
Delivers exclusive COVID-19 variations economic data specific to your market.
To access the data contained in this document please email contactus@visiongain.com
Forecasts to 2032 and other analyses reveal the commercial prospects
• In addition to revenue forecasting to 2032, our new study provides you with recent results, growth rates, and market shares.
• You find original analyses, with business outlooks and developments.
• Discover qualitative analyses (including market dynamics, drivers, opportunities, restraints and challenges), cost structure, impact of rising deepwater & ultra deepwater exploration & production (E&P) prices and recent developments.
This report includes data analysis and invaluable insight into how COVID-19 will affect the industry and your company. Four COVID-19 recovery patterns and their impact, namely, V, L, W and U are discussed in this report.
Global Deepwater & Ultra Deepwater Exploration & Production (E&P) Market (COVID Impact Analysis) by Project
• Production
• Exploration
Global Deepwater & Ultra Deepwater Exploration & Production (E&P) Market (COVID Impact Analysis) by Water Depth
• Deepwater
• Ultra-Deepwater
Global Deepwater & Ultra Deepwater Exploration & Production (E&P) Market (COVID Impact Analysis) by Type
• Seismic Submarket
• Drilling Submarket
• Floating Operation Systems Submarket
• Other Submarkets
Global Deepwater & Ultra Deepwater Exploration & Production (E&P) Market (COVID Impact Analysis) by Operation
• Deepwater Geology
• Deepwater Exploration
• Drilling Rigs
• Well Construction
• Fixed and Floating Systems
• Subsea Systems
• ROVs and Service Vessels
• Topside Construction
• Pipelines, Flowlines, and Risers
• Subsea Systems
• Other Operations

In addition to the revenue predictions for the overall world market and segments, you will also find revenue forecasts for 7 regional markets:
• Gulf of Mexico Deepwater & Ultra Deepwater Exploration & Production (E&P) Market, 2022 to 2032 Market Outlook
• South American Deepwater & Ultra Deepwater Exploration & Production (E&P) Market, 2022 to 2032 Market Outlook
• West African Deepwater & Ultra Deepwater Exploration & Production (E&P) Market, 2022 to 2032 Market Outlook
• East African Deepwater & Ultra Deepwater Exploration & Production (E&P) Market, 2022 to 2032 Market Outlook
• Asia-Pacific Deepwater & Ultra Deepwater Exploration & Production (E&P) Market, 2022 to 2032 Market Outlook
• European Deepwater & Ultra Deepwater Exploration & Production (E&P) Market, 2022 to 2032 Market Outlook
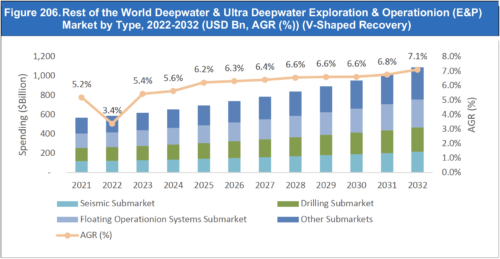
• Rest of the World Deepwater & Ultra Deepwater Exploration & Production (E&P) Market, 2022 to 2032 Market Outlook
Need industry data? Please contact us today.
The report also includes profiles and for some of the leading companies in the Deepwater & Ultra Deepwater Exploration & Production (E&P) Market, 2022 to 2032, with a focus on this segment of these companies’ operations.
Leading companies and the potential for market growth
• Aker Solutions ASA
• CGG SA (CGG)
• China National Offshore Oil Corporation
• Maersk Drilling A/S
• MODEC, INC.
• Nabors Industries Ltd.
• Noble Corporation
• Petroleo Brasileiro S.A
• Petronas Gas Berhad (PGB)
• PGS ASA
• Saipem SpA
• Sapura Energy Berhad
• SBM Offshore NV
• SeaBird Exploration PLC
• Seadrill Limited
• Shelf Drilling Ltd
• Subsea 7 S.A.
• The Royal Dutch Shell plc
• Transocean Ltd.
• Valaris Ltd
Overall world revenue for Deepwater & Ultra Deepwater Exploration & Production (E&P) Market, 2022 to 2032 in terms of value the market will surpass US$xx million in 2022, our work calculates. We predict strong revenue growth through to 2032. Our work identifies which organizations hold the greatest potential. Discover their capabilities, progress, and commercial prospects, helping you stay ahead.
How the Deepwater & Ultra Deepwater Exploration & Production (E&P) Market, 2022 to 2032 Market report helps you?
In summary, our 480+ page report provides you with the following knowledge:
• Revenue forecasts to 2032 for Deepwater & Ultra Deepwater Exploration & Production (E&P) Market, 2022 to 2032 Market, with forecasts for project, water depth, type, operation each forecasted at a global and regional level– discover the industry’s prospects, finding the most lucrative places for investments and revenues
• Revenue forecasts to 2032 for 4 regional and 20 key national markets – See forecasts for the Deepwater & Ultra Deepwater Exploration & Production (E&P) Market, 2022 to 2032 market in South American, Gulf of Mexico, West African, East African, Asia Pacific, European, Rest of the World.
• Prospects for established firms and those seeking to enter the market– including company profiles for 20 of the major companies involved in the Deepwater & Ultra Deepwater Exploration & Production (E&P) Market, 2022 to 2032 Market.
Find quantitative and qualitative analyses with independent predictions. Receive information that only our report contains, staying informed with this invaluable business intelligence.
Information found nowhere else
With our newly report title, you are less likely to fall behind in knowledge or miss out on opportunities. See how our work could benefit your research, analyses, and decisions. Visiongain’s study is for everybody needing commercial analyses for the Deepwater & Ultra Deepwater Exploration & Production (E&P) Market, 2022 to 2032 Market and leading companies. You will find data, trends and predictions.
To access the data contained in this document please email contactus@visiongain.com
Buy our report today Deepwater & Ultra Deepwater Exploration & Production (E&P) Market Report 2022-2032: Forecasts by Project (Production, Exploration), by Water Depth (Deepwater Ultra-Deepwater), by Type (Seismic, Drilling, Floating Operation Systems, Other), by Operation (Deepwater Geology, Deepwater Exploration, Drilling Rigs, Well Construction, Fixed and Floating Systems, Subsea Systems, ROVs and Service Vessels, Topside Construction, Pipelines, Flowlines, and Risers, Other), by SSLNG Re-Gasification (Open Rack Vaporisers (ORV), Submerged Combustion Vaporisers (SCV), Ambient Air Vaporisers (AAV), Odorisation, Send-out, and Delivery) AND Regional and Leading National Market Analysis PLUS Analysis of Leading Companies AND COVID-19 Recovery Scenarios. Avoid missing out by staying informed – order our report now.
Visiongain is a trading partner with the US Federal Government
CCR Ref number: KD4R6
Do you have any custom requirements we can help you with? Any need for a specific country, geo region, market segment or specific company information? Contact us today, we can discuss your needs and see how we can help: sara.peerun@visiongain.com
1.1 Introduction to Deepwater & Ultra Deepwater Exploration & Production (E&P) Market
1.2 Global Deepwater & Ultra Deepwater Exploration & Production (E&P) Market Overview
1.3 What are the Objectives of this Report?
1.4 What is the Scope of the Report?
1.5 Why You Should Read This Report
1.6 What This Report Delivers
1.7 Key Questions Answered By This Analytical Report Include:
1.8 Who is This Report for?
1.9 Research Methodology
1.9.1 Primary Research
1.9.2 Secondary Research
1.9.3 Market Evaluation & Forecasting Methodology
1.10 Frequently Asked Questions (FAQs)
1.11 Associated Visiongain Reports
1.12 About Visiongain
2 Executive Summary
3 Global Market Dynamics
3.1 Current Trends in the Global Market
3.2 Market Driving Factors
3.2.1 Key Success Factors For Project Developers And Operators
3.2.1.1 Strategic Approach
3.2.1.2 Resource Evaluation
3.2.1.3 Infrastructure Planning
3.2.1.4 Project Management
3.2.1.5 Multidisciplinary Approach
3.2.1.6 Contracting
3.2.2 New Oil Field Discoveries
3.2.2.1 Gulf Of Mexico
3.2.2.2 Mexico
3.2.2.3 Norway
3.2.2.4 Guyana
3.2.2.5 Malaysia
3.2.2.6 Indonesia
3.2.3 Automated Drilling Rigs
3.2.4 Government Initiatives To Increase Refining Capacity
3.2.5 Increasing Investment In Oil & Gas Exploration In Developing Countries
3.3 Market Restraining Factors
3.3.1 Focus On Renewable Energy Generation
3.3.2 Increasing Onshore Oil Production
3.3.3 New Technologies In Hydrogen Storage
3.4 Opportunities in the Global Market
3.4.1 An Industry On The Seach For New Growth Areas
3.4.2 To Survive And Succeed In This Increasingly Complex And Evolving Global Deepwater Sector Key Areas Of Opportunity Include
3.4.3 Offshore Exploration Opportunities Beckon In Southern Africa
3.5 Challenges in the Global Market
3.5.1 Challenges For Oil And Gas Deepwater Players
3.5.1.1 Uncertainty About Resource Potential
3.5.1.2 Availability Of Drilling Rigs
3.5.1.3 Production Facilities/Technology Concepts
3.5.1.4 Logistics and Infrastructure
3.5.1.5 Project Management
3.5.1.6 Fiscal Terms
3.5.1.7 Availability Of Drilling Rigs
3.5.1.8 Production Facilities/Technology Concepts
3.5.1.9 Weather Hazards
3.5.2 Challenges For Oilfield Services And Equipment Suppliers
3.5.2.1 Increasing National Content Requirements
3.5.2.2 Commoditization Of Technology
3.5.2.3 Increasingly Complicated Supply Chains
3.5.2.4 Skill Shortages
3.5.2.5 Capacity Restrictions And Rising Material Costs
3.5.3 Shallow Hazards Of The Deep
3.5.4 Mapping Uncharted Ground
3.5.5 The Ultradeep Ahead: Remote, Challenging And Integrated
3.6 SWOT Analysis:
3.7 PEST Analysis
3.8 Porter’s Five Forces
3.8.1 Competitive Rivalry
3.8.2 Bargaining Power of Buyers
3.8.3 Bargaining Power of Suppliers
3.8.4 Threat of Substitutes
3.8.5 The Threat Of New Entrants
4 Global Deepwater & Ultra Deepwater Exploration & Production (E&P) Market Analysis
4.1 Global Market Outlook
4.2 Global Market Size Estimation and Forecast
4.2.1 Pre-COVID-19 Market Scenario
4.2.2 Post-COVID-19 Market Scenarios (V, W, U, L-Shaped Recovery Analysis)
5 Global Deepwater & Ultra Deepwater Exploration & Production (E&P) Market Analysis By Region
5.1 South American
5.2 Gulf Of Mexico
5.3 West African
5.4 East African
5.5 Asia-Pacific
5.6 European
5.7 Regional Market Size Estimation and Forecast
5.7.1 Pre-COVID-19 Market Scenario
5.7.2 Post-COVID-19 Market Scenarios (V, W, U, L-Shaped Recovery Analysis)
6 Global Deepwater & Ultra Deepwater Exploration & Production (E&P) Market Analysis By Project
6.1 Production
6.2 Exploration
6.3 Global Market Size Estimation and Forecast by Project
6.3.1 Pre-COVID-19 Market Scenario
6.3.2 Post-COVID-19 Market Scenarios (V, W, U, L-Shaped Recovery Analysis)
7 Global Deepwater & Ultra Deepwater Exploration & Production (E&P) Market Analysis By Water Depth
7.1 Deepwater
7.2 Ultra-Deepwater
7.3 Global Market Size Estimation and Forecast by Water Depth
7.3.1 Pre-COVID-19 Market Scenario
7.3.2 Post-COVID-19 Market Scenarios (V, W, U, L-Shaped Recovery Analysis)
8 Global Deepwater & Ultra Deepwater Exploration & Production (E&P) Market Analysis By Type
8.1 Seismic Submarket
8.2 Drilling Submarket
8.3 Floating Operation Systems Submarket
8.4 Global Market Size Estimation and Forecast by Type
8.4.1 Pre-COVID-19 Market Scenario
8.4.2 Post-COVID-19 Market Scenarios (V, W, U, L-Shaped Recovery Analysis)
9 Global Deepwater & Ultra Deepwater Exploration & Production (E&P) Market Analysis By Operation
9.1 Deepwater Geology
9.2 Deepwater Exploration
9.3 Drilling Rigs
9.4 Well Construction
9.5 Fixed and Floating Systems
9.6 Subsea Systems
9.7 ROVs and Service Vessels
9.8 Topside Construction
9.9 Pipelines, Flowlines, and Risers
9.10 Global Market Size Estimation and Forecast by Operation
9.10.1 Pre-COVID-19 Market Scenario
9.10.2 Post-COVID-19 Market Scenarios (V, W, U, L-Shaped Recovery Analysis)
10 South America Deepwater & Ultra Deepwater Exploration & Production (E&P) Market Analysis
10.1 Upcoming Deepwater Exploration And Production Projects In Brazil, Argentina, And Other Nations Is To Drive The Market
10.2 Brazil Is Likely To Be The Fastest Growing Market
10.3 South America Market Size Estimation and Forecast
10.3.1 Pre-COVID-19 Market Scenario
10.3.2 Post-COVID-19 Market Scenarios (V, W, U, L-Shaped Recovery Analysis)
10.4 South America Market Size Estimation and Forecast by Project
10.4.1 Pre-COVID-19 Market Scenario
10.4.2 Post-COVID-19 Market Scenarios (V, W, U, L-Shaped Recovery Analysis)
10.5 South America Market Size Estimation and Forecast by Water Depth
10.5.1 Pre-COVID-19 Market Scenario
10.5.2 Post-COVID-19 Market Scenarios (V, W, U, L-Shaped Recovery Analysis)
10.6 South America Market Size Estimation and Forecast by Type
10.6.1 Pre-COVID-19 Market Scenario
10.6.2 Post-COVID-19 Market Scenarios (V, W, U, L-Shaped Recovery Analysis)
10.7 South America Market Size Estimation and Forecast by Operation
10.7.1 Pre-COVID-19 Market Scenario
10.7.2 Post-COVID-19 Market Scenarios (V, W, U, L-Shaped Recovery Analysis)
11 Gulf of Mexico Deepwater & Ultra Deepwater Exploration & Production (E&P) Market Analysis
11.1 Gulf Oil Companies Rethinking Their Deepwater Development Strategies
11.2 Unlocking Future Growth For Deepwater In The Gulf Of Mexico
11.3 Gulf of Mexico Market Size Estimation and Forecast
11.3.1 Pre-COVID-19 Market Scenario
11.3.2 Post-COVID-19 Market Scenarios (V, W, U, L-Shaped Recovery Analysis)
11.4 Gulf of Mexico Market Size Estimation and Forecast by Project
11.4.1 Pre-COVID-19 Market Scenario
11.4.2 Post-COVID-19 Market Scenarios (V, W, U, L-Shaped Recovery Analysis)
11.5 Gulf of Mexico Market Size Estimation and Forecast by Water Depth
11.5.1 Pre-COVID-19 Market Scenario
11.5.2 Post-COVID-19 Market Scenarios (V, W, U, L-Shaped Recovery Analysis)
11.6 Gulf of Mexico Market Size Estimation and Forecast by Type
11.6.1 Pre-COVID-19 Market Scenario
11.6.2 Post-COVID-19 Market Scenarios (V, W, U, L-Shaped Recovery Analysis)
11.7 Gulf of Mexico Market Size Estimation and Forecast by Operation
11.7.1 Pre-COVID-19 Market Scenario
11.7.2 Post-COVID-19 Market Scenarios (V, W, U, L-Shaped Recovery Analysis)
12 West African Deepwater & Ultra Deepwater Exploration & Production (E&P) Market Analysis
12.1 Increasing Oil And Natural Gas Production In The Major Countries In West Africa Driving The Market
12.2 Offshore Segment To Be The Fastest Growing Market In West Africa
12.3 West African Market Size Estimation and Forecast
12.3.1 Pre-COVID-19 Market Scenario
12.3.2 Post-COVID-19 Market Scenarios (V, W, U, L-Shaped Recovery Analysis)
12.4 West African Market Size Estimation and Forecast by Project
12.4.1 Pre-COVID-19 Market Scenario
12.4.2 Post-COVID-19 Market Scenarios (V, W, U, L-Shaped Recovery Analysis)
12.5 West African Market Size Estimation and Forecast by Water Depth
12.5.1 Pre-COVID-19 Market Scenario
12.5.2 Post-COVID-19 Market Scenarios (V, W, U, L-Shaped Recovery Analysis)
12.6 West African Market Size Estimation and Forecast by Type
12.6.1 Pre-COVID-19 Market Scenario
12.6.2 Post-COVID-19 Market Scenarios (V, W, U, L-Shaped Recovery Analysis)
12.7 West African Market Size Estimation and Forecast by Operation
12.7.1 Pre-COVID-19 Market Scenario
12.7.2 Post-COVID-19 Market Scenarios (V, W, U, L-Shaped Recovery Analysis)
13 East African Deepwater & Ultra Deepwater Exploration & Production (E&P) Market Analysis
13.1 Rising Production Of Oil And Natural Gas In The Region To Drive The Market
13.2 Mozambique To Witness The Fastest Growth In The Region
13.3 East African Market Size Estimation and Forecast
13.3.1 Pre-COVID-19 Market Scenario
13.3.2 Post-COVID-19 Market Scenarios (V, W, U, L-Shaped Recovery Analysis)
13.4 East African Market Size Estimation and Forecast by Project
13.4.1 Pre-COVID-19 Market Scenario
13.4.2 Post-COVID-19 Market Scenarios (V, W, U, L-Shaped Recovery Analysis)
13.5 East African Market Size Estimation and Forecast by Water Depth
13.5.1 Pre-COVID-19 Market Scenario
13.5.2 Post-COVID-19 Market Scenarios (V, W, U, L-Shaped Recovery Analysis)
13.6 East African Market Size Estimation and Forecast by Type
13.6.1 Pre-COVID-19 Market Scenario
13.6.2 Post-COVID-19 Market Scenarios (V, W, U, L-Shaped Recovery Analysis)
13.7 East African Market Size Estimation and Forecast by Operation
13.7.1 Pre-COVID-19 Market Scenario
13.7.2 Post-COVID-19 Market Scenarios (V, W, U, L-Shaped Recovery Analysis)
14 Asia Pacific Deepwater & Ultra Deepwater Exploration & Production (E&P) Market Analysis
14.1 Asia/Pacific Lowers Offshore Expectations In New Era Of Uncertainty
14.2 Factors Such As An Increase In Demand For Advanced Technology, Tools And Equipment To Increase The Efficiency Of Exploration And Production Activities In Onshore And Offshore Areas
14.3 Asia Pacific Market Size Estimation and Forecast
14.3.1 Pre-COVID-19 Market Scenario
14.3.2 Post-COVID-19 Market Scenarios (V, W, U, L-Shaped Recovery Analysis)
14.4 Asia Pacific Market Size Estimation and Forecast by Project
14.4.1 Pre-COVID-19 Market Scenario
14.4.2 Post-COVID-19 Market Scenarios (V, W, U, L-Shaped Recovery Analysis)
14.5 Asia Pacific Market Size Estimation and Forecast by Water Depth
14.5.1 Pre-COVID-19 Market Scenario
14.5.2 Post-COVID-19 Market Scenarios (V, W, U, L-Shaped Recovery Analysis)
14.6 Asia Pacific Market Size Estimation and Forecast by Type
14.6.1 Pre-COVID-19 Market Scenario
14.6.2 Post-COVID-19 Market Scenarios (V, W, U, L-Shaped Recovery Analysis)
14.7 Asia Pacific Market Size Estimation and Forecast by Operation
14.7.1 Pre-COVID-19 Market Scenario
14.7.2 Post-COVID-19 Market Scenarios (V, W, U, L-Shaped Recovery Analysis)
15 European Deepwater & Ultra Deepwater Exploration & Production (E&P) Market Analysis
15.1 Offshore Exploration In Greece: Deepwater Exploration And Drilling
15.2 Demand Of Oil & Gas In Europe Will Drive The Market
15.3 European Market Size Estimation and Forecast
15.3.1 Pre-COVID-19 Market Scenario
15.3.2 Post-COVID-19 Market Scenarios (V, W, U, L-Shaped Recovery Analysis)
15.4 European Market Size Estimation and Forecast by Project
15.4.1 Pre-COVID-19 Market Scenario
15.4.2 Post-COVID-19 Market Scenarios (V, W, U, L-Shaped Recovery Analysis)
15.5 European Market Size Estimation and Forecast by Water Depth
15.5.1 Pre-COVID-19 Market Scenario
15.5.2 Post-COVID-19 Market Scenarios (V, W, U, L-Shaped Recovery Analysis)
15.6 European Market Size Estimation and Forecast by Type
15.6.1 Pre-COVID-19 Market Scenario
15.6.2 Post-COVID-19 Market Scenarios (V, W, U, L-Shaped Recovery Analysis)
15.7 European Market Size Estimation and Forecast by Operation
15.7.1 Pre-COVID-19 Market Scenario
15.7.2 Post-COVID-19 Market Scenarios (V, W, U, L-Shaped Recovery Analysis)
16 Rest of World Deepwater & Ultra Deepwater Exploration & Production (E&P) Market Analysis
16.1 Rest of World Market Outlook
16.2 Rest of World Market Size Estimation and Forecast
16.2.1 Pre-COVID-19 Market Scenario
16.2.2 Post-COVID-19 Market Scenarios (V, W, U, L-Shaped Recovery Analysis)
16.3 Rest of World Market Size Estimation and Forecast by Project
16.3.1 Pre-COVID-19 Market Scenario
16.3.2 Post-COVID-19 Market Scenarios (V, W, U, L-Shaped Recovery Analysis)
16.4 Rest of World Market Size Estimation and Forecast by Water Depth
16.4.1 Pre-COVID-19 Market Scenario
16.4.2 Post-COVID-19 Market Scenarios (V, W, U, L-Shaped Recovery Analysis)
16.5 Rest of World Market Size Estimation and Forecast by Type
16.5.1 Pre-COVID-19 Market Scenario
16.5.2 Post-COVID-19 Market Scenarios (V, W, U, L-Shaped Recovery Analysis)
16.6 Rest of World Market Size Estimation and Forecast by Operation
16.6.1 Pre-COVID-19 Market Scenario
16.6.2 Post-COVID-19 Market Scenarios (V, W, U, L-Shaped Recovery Analysis)
17 Leading Company Profiles
17.1 Transocean Ltd.
17.1.1 Company Snapshot
17.1.2 Company Overview
17.1.3 Company Financial Profile
17.1.4 Company Product Benchmarking
17.1.5 Company Recent Developments
17.2 Seadrill Limited
17.2.1 Company Snapshot
17.2.2 Company Overview
17.2.3 Company Financial Profile
17.2.4 Company Product Benchmarking
17.2.5 Company Recent Developments
17.3 Noble Corporation
17.3.1 Company Snapshot
17.3.2 Company Overview
17.3.3 Company Financial Profile
17.3.4 Company Product Benchmarking
17.3.5 Company Recent Developments
17.4 Valaris Plc
17.4.1 Company Snapshot
17.4.2 Company Overview
17.4.3 Company Financial Profile
17.4.4 Company Product Benchmarking
17.4.5 Company Recent Developments
17.5 Saipem SpA
17.5.1 Company Snapshot
17.5.2 Company Overview
17.5.3 Company Financial Profile
17.5.4 Company Product Benchmarking
17.5.5 Company Recent Developments
17.6 Sapura Energy Berhad
17.6.1 Company Snapshot
17.6.2 Company Overview
17.6.3 Company Financial Profile
17.6.4 Company Product Benchmarking
17.6.5 Company Recent Developments
17.7 Nabors Industries
17.7.1 Company Snapshot
17.7.2 Company Overview
17.7.3 Company Financial Profile
17.7.4 Company Product Benchmarking
17.7.5 Company Recent Developments
17.8 Maersk Drilling
17.8.1 Company Snapshot
17.8.2 Company Overview
17.8.3 Company Financial Profile
17.8.4 Company Product Benchmarking
17.8.5 Company Recent Developments
17.9 Shelf Drilling Ltd
17.9.1 Company Snapshot
17.9.2 Company Overview
17.9.3 Company Financial Profile
17.9.4 Company Product Benchmarking
17.10 Aker Solutions
17.10.1 Company Snapshot
17.10.2 Company Overview
17.10.3 Company Financial Profile
17.10.4 Company Product Benchmarking
17.10.5 Company Recent Developments
17.11 CGG
17.11.1 Company Snapshot
17.11.2 Company Overview
17.11.3 Company Financial Profile
17.11.4 Company Product Benchmarking
17.11.5 Company Recent Developments
17.12 MODEC
17.12.1 Company Snapshot
17.12.2 Company Overview
17.12.3 Company Financial Profile
17.12.4 Company Product Benchmarking
17.12.5 Company Recent Developments
17.13 PGS
17.13.1 Company Snapshot
17.13.2 Company Overview
17.13.3 Company Financial Profile
17.13.4 Company Product Benchmarking
17.13.5 Company Recent Developments
17.14 SBM Offshore
17.14.1 Company Snapshot
17.14.2 Company Overview
17.14.3 Company Financial Profile
17.14.4 Company Product Benchmarking
17.14.5 Company Recent Developments
17.15 The Royal Dutch Shell
17.15.1 Company Snapshot
17.15.2 Company Overview
17.15.3 Company Financial Profile
17.15.4 Company Product Benchmarking
17.15.5 Company Recent Developments
17.16 Subsea 7
17.16.1 Company Snapshot
17.16.2 Company Overview
17.16.3 Company Financial Profile
17.16.4 Company Recent Developments
17.17 China National Offshore Oil Corporation
17.17.1 Company Snapshot
17.17.2 Company Overview
17.17.3 Company Financial Profile
17.17.4 Company Product Benchmarking
17.18 Seabird Exploration
17.18.1 Company Snapshot
17.18.2 Company Overview
17.18.3 Company Financial Profile
17.18.4 Company Product Benchmarking
17.19 Petrobras
17.19.1 Company Snapshot
17.19.2 Company Overview
17.19.3 Company Financial Profile
17.19.4 Company Recent Developments
17.20 Petronas
17.20.1 Company Snapshot
17.20.2 Company Overview
17.20.3 Company Financial Profile
17.20.4 Company Recent Developments
18 Conclusion
19 Recommendations
19.1 South America Region To Dominate the Market
20 Glossary Terms
List of Tables
Table 1. Global Deepwater & Ultra Deepwater Exploration & Operation (E&P) Market Forecast, 2022-2032 (USD Bn, AGR (%), CAGR(%))
Table 2. Global Deepwater & Ultra Deepwater Exploration & Production (E&P) Market Snapshot, 2022 & 2032 (US$million, CAGR %)
Table 3. Global Deepwater & Ultra Deepwater Exploration & Production (E&P) Market SWOT Analysis 2021-2031
Table 4. Global Deepwater & Ultra Deepwater Exploration & Production (E&P) Market PEST Analysis 2021-2031
Table 5. Global Deepwater & Ultra Deepwater Exploration & Operation (E&P) Market Forecast, 2022-2032 (USD Bn, AGR (%), CAGR(%))
Table 6. Global Deepwater & Ultra Deepwater Exploration & Operation (E&P) Market Forecast, 2022-2032 (USD Bn, AGR (%), CAGR(%)) (V-Shaped Recovery)
Table 7. Global Deepwater & Ultra Deepwater Exploration & Operation (E&P) Market Forecast, 2022-2032 (USD Bn, AGR (%), CAGR(%)) (W-Shaped Recovery)
Table 8. Global Deepwater & Ultra Deepwater Exploration & Operation (E&P) Market Forecast, 2022-2032 (USD Bn, AGR (%), CAGR(%)) (U-Shaped Recovery)
Table 9. Global Deepwater & Ultra Deepwater Exploration & Operation (E&P) Market Forecast, 2022-2032 (USD Bn, AGR (%), CAGR(%)) (L-Shaped Recovery)
Table 10. Global Deepwater & Ultra Deepwater Exploration & Operation (E&P) Market by Region, 2022-2032 (USD Bn, AGR (%), CAGR(%))
Table 11. Global Deepwater & Ultra Deepwater Exploration & Operation (E&P) Market by Region, 2022-2032 (USD Bn, AGR (%), CAGR(%)) (V-Shaped Recovery)
Table 12. Global Deepwater & Ultra Deepwater Exploration & Operation (E&P) Market by Region, 2022-2032 (USD Bn, AGR (%), CAGR(%)) (W-Shaped Recovery)
Table 13. Global Deepwater & Ultra Deepwater Exploration & Operation (E&P) Market by Region, 2022-2032 (USD Bn, AGR (%), CAGR(%)) (U-Shaped Recovery)
Table 14. Global Deepwater & Ultra Deepwater Exploration & Operation (E&P) Market by Region, 2022-2032 (USD Bn, AGR (%), CAGR(%)) (L-Shaped Recovery)
Table 15. Global Deepwater & Ultra Deepwater Exploration & Operation (E&P) Market by Project, 2022-2032 (USD Bn, AGR (%), CAGR(%))
Table 16. Global Deepwater & Ultra Deepwater Exploration & Operation (E&P) Market by Project, 2022-2032 (USD Bn, AGR (%), CAGR(%)) (V-Shaped Recovery)
Table 17. Global Deepwater & Ultra Deepwater Exploration & Operation (E&P) Market by Project, 2022-2032 (USD Bn, AGR (%), CAGR(%)) (W-Shaped Recovery)
Table 18. Global Deepwater & Ultra Deepwater Exploration & Operation (E&P) Market by Project, 2022-2032 (USD Bn, AGR (%), CAGR(%)) (U-Shaped Recovery)
Table 19. Global Deepwater & Ultra Deepwater Exploration & Operation (E&P) Market by Project, 2022-2032 (USD Bn, AGR (%), CAGR(%)) (L-Shaped Recovery)
Table 20. Global Deepwater & Ultra Deepwater Exploration & Operation (E&P) Market by Water Depth, 2022-2032 (USD Bn, AGR (%), CAGR(%))
Table 21. Global Deepwater & Ultra Deepwater Exploration & Operation (E&P) Market by Water Depth, 2022-2032 (USD Bn, AGR (%), CAGR(%)) (V-Shaped Recovery)
Table 22. Global Deepwater & Ultra Deepwater Exploration & Operation (E&P) Market by Water Depth, 2022-2032 (USD Bn, AGR (%), CAGR(%)) (W-Shaped Recovery)
Table 23. Global Deepwater & Ultra Deepwater Exploration & Operation (E&P) Market by Water Depth, 2022-2032 (USD Bn, AGR (%), CAGR(%)) (U-Shaped Recovery)
Table 24. Global Deepwater & Ultra Deepwater Exploration & Operation (E&P) Market by Water Depth, 2022-2032 (USD Bn, AGR (%), CAGR(%)) (L-Shaped Recovery)
Table 25. Global Deepwater & Ultra Deepwater Exploration & Operation (E&P) Market by Type, 2022-2032 (USD Bn, AGR (%), CAGR(%))
Table 26. Global Deepwater & Ultra Deepwater Exploration & Operation (E&P) Market by Type, 2022-2032 (USD Bn, AGR (%), CAGR(%)) (V-Shaped Recovery)
Table 27. Global Deepwater & Ultra Deepwater Exploration & Operation (E&P) Market by Type, 2022-2032 (USD Bn, AGR (%), CAGR(%)) (W-Shaped Recovery)
Table 28. Global Deepwater & Ultra Deepwater Exploration & Operation (E&P) Market by Type, 2022-2032 (USD Bn, AGR (%), CAGR(%)) (U-Shaped Recovery)
Table 29. Global Deepwater & Ultra Deepwater Exploration & Operation (E&P) Market by Type, 2022-2032 (USD Bn, AGR (%), CAGR(%)) (L-Shaped Recovery)
Table 30. Global Deepwater & Ultra Deepwater Exploration & Operation (E&P) Market by Operation, 2022-2032 (USD Bn, AGR (%), CAGR(%))
Table 31. Global Deepwater & Ultra Deepwater Exploration & Operation (E&P) Market by Operation, 2022-2032 (USD Bn, AGR (%), CAGR(%)) (V-Shaped Recovery)
Table 32. Global Deepwater & Ultra Deepwater Exploration & Operation (E&P) Market by Operation, 2022-2032 (USD Bn, AGR (%), CAGR(%)) (W-Shaped Recovery)
Table 33. Global Deepwater & Ultra Deepwater Exploration & Operation (E&P) Market by Operation, 2022-2032 (USD Bn, AGR (%), CAGR(%)) (U-Shaped Recovery)
Table 34. Global Deepwater & Ultra Deepwater Exploration & Operation (E&P) Market by Operation, 2022-2032 (USD Bn, AGR (%), CAGR(%)) (L-Shaped Recovery)
Table 35. South American Deepwater & Ultra Deepwater Exploration & Operation (E&P) Market by Value, 2022-2032 (USD Bn, AGR (%), CAGR(%))
Table 36. South American Deepwater & Ultra Deepwater Exploration & Operation (E&P) Market by Value, 2022-2032 (USD Bn, AGR (%), CAGR(%)) (V-Shaped Recovery)
Table 37. South American Deepwater & Ultra Deepwater Exploration & Operation (E&P) Market by Value, 2022-2032 (USD Bn, AGR (%), CAGR(%)) (W-Shaped Recovery)
Table 38. South American Deepwater & Ultra Deepwater Exploration & Operation (E&P) Market by Value, 2022-2032 (USD Bn, AGR (%), CAGR(%)) (U-Shaped Recovery)
Table 39. South American Deepwater & Ultra Deepwater Exploration & Operation (E&P) Market by Value, 2022-2032 (USD Bn, AGR (%), CAGR(%)) (L-Shaped Recovery)
Table 40. South American Deepwater & Ultra Deepwater Exploration & Operation (E&P) Market by Project, 2022-2032 (USD Bn, AGR (%), CAGR(%))
Table 41. South American Deepwater & Ultra Deepwater Exploration & Operation (E&P) Market by Project, 2022-2032 (USD Bn, AGR (%), CAGR(%)) (V-Shaped Recovery)
Table 42. South American Deepwater & Ultra Deepwater Exploration & Operation (E&P) Market by Project, 2022-2032 (USD Bn, AGR (%), CAGR(%)) (W-Shaped Recovery)
Table 43. South American Deepwater & Ultra Deepwater Exploration & Operation (E&P) Market by Project, 2022-2032 (USD Bn, AGR (%), CAGR(%)) (U-Shaped Recovery)
Table 44. South American Deepwater & Ultra Deepwater Exploration & Operation (E&P) Market by Project, 2022-2032 (USD Bn, AGR (%), CAGR(%)) (L-Shaped Recovery)
Table 45. South American Deepwater & Ultra Deepwater Exploration & Operation (E&P) Market by Water Depth, 2022-2032 (USD Bn, AGR (%), CAGR(%))
Table 46. South American Deepwater & Ultra Deepwater Exploration & Operation (E&P) Market by Water Depth, 2022-2032 (USD Bn, AGR (%), CAGR(%)) (V-Shaped Recovery)
Table 47. South American Deepwater & Ultra Deepwater Exploration & Operation (E&P) Market by Water Depth, 2022-2032 (USD Bn, AGR (%), CAGR(%)) (W-Shaped Recovery)
Table 48. South American Deepwater & Ultra Deepwater Exploration & Operation (E&P) Market by Water Depth, 2022-2032 (USD Bn, AGR (%), CAGR(%)) (U-Shaped Recovery)
Table 49. South American Deepwater & Ultra Deepwater Exploration & Operation (E&P) Market by Water Depth, 2022-2032 (USD Bn, AGR (%), CAGR(%)) (L-Shaped Recovery)
Table 50. South American Deepwater & Ultra Deepwater Exploration & Operation (E&P) Market by Type, 2022-2032 (USD Bn, AGR (%), CAGR(%))
Table 51. South American Deepwater & Ultra Deepwater Exploration & Operation (E&P) Market by Type, 2022-2032 (USD Bn, AGR (%), CAGR(%)) (V-Shaped Recovery)
Table 52. South American Deepwater & Ultra Deepwater Exploration & Operation (E&P) Market by Type, 2022-2032 (USD Bn, AGR (%), CAGR(%)) (W-Shaped Recovery)
Table 53. South American Deepwater & Ultra Deepwater Exploration & Operation (E&P) Market by Type, 2022-2032 (USD Bn, AGR (%), CAGR(%)) (U-Shaped Recovery)
Table 54. South American Deepwater & Ultra Deepwater Exploration & Operation (E&P) Market by Type, 2022-2032 (USD Bn, AGR (%), CAGR(%)) (L-Shaped Recovery)
Table 55. South American Deepwater & Ultra Deepwater Exploration & Operation (E&P) Market by Operation, 2022-2032 (USD Bn, AGR (%), CAGR(%))
Table 56. South American Deepwater & Ultra Deepwater Exploration & Operation (E&P) Market by Operation, 2022-2032 (USD Bn, AGR (%), CAGR(%)) (V-Shaped Recovery)
Table 57. South American Deepwater & Ultra Deepwater Exploration & Operation (E&P) Market by Operation, 2022-2032 (USD Bn, AGR (%), CAGR(%)) (W-Shaped Recovery)
Table 58. South American Deepwater & Ultra Deepwater Exploration & Operation (E&P) Market by Operation, 2022-2032 (USD Bn, AGR (%), CAGR(%)) (U-Shaped Recovery)
Table 59. South American Deepwater & Ultra Deepwater Exploration & Operation (E&P) Market by Operation, 2022-2032 (USD Bn, AGR (%), CAGR(%)) (L-Shaped Recovery)
Table 60. Gulf of Mexico Deepwater & Ultra Deepwater Exploration & Operation (E&P) Market by Value, 2022-2032 (USD Bn, AGR (%), CAGR(%))
Table 61. Gulf of Mexico Deepwater & Ultra Deepwater Exploration & Operation (E&P) Market by Value, 2022-2032 (USD Bn, AGR (%), CAGR(%)) (V-Shaped Recovery)
Table 62. Gulf of Mexico Deepwater & Ultra Deepwater Exploration & Operation (E&P) Market by Value, 2022-2032 (USD Bn, AGR (%), CAGR(%)) (W-Shaped Recovery)
Table 63. Gulf of Mexico Deepwater & Ultra Deepwater Exploration & Operation (E&P) Market by Value, 2022-2032 (USD Bn, AGR (%), CAGR(%)) (U-Shaped Recovery)
Table 64. Gulf of Mexico Deepwater & Ultra Deepwater Exploration & Operation (E&P) Market by Value, 2022-2032 (USD Bn, AGR (%), CAGR(%)) (L-Shaped Recovery)
Table 65. Gulf of Mexico Deepwater & Ultra Deepwater Exploration & Operation (E&P) Market by Project, 2022-2032 (USD Bn, AGR (%), CAGR(%))
Table 66. Gulf of Mexico Deepwater & Ultra Deepwater Exploration & Operation (E&P) Market by Project, 2022-2032 (USD Bn, AGR (%), CAGR(%)) (V-Shaped Recovery)
Table 67. Gulf of Mexico Deepwater & Ultra Deepwater Exploration & Operation (E&P) Market by Project, 2022-2032 (USD Bn, AGR (%), CAGR(%)) (W-Shaped Recovery)
Table 68. Gulf of Mexico Deepwater & Ultra Deepwater Exploration & Operation (E&P) Market by Project, 2022-2032 (USD Bn, AGR (%), CAGR(%)) (U-Shaped Recovery)
Table 69. Gulf of Mexico Deepwater & Ultra Deepwater Exploration & Operation (E&P) Market by Project, 2022-2032 (USD Bn, AGR (%), CAGR(%)) (L-Shaped Recovery)
Table 70. Gulf of Mexico Deepwater & Ultra Deepwater Exploration & Operation (E&P) Market by Water Depth, 2022-2032 (USD Bn, AGR (%), CAGR(%))
Table 71. Gulf of Mexico Deepwater & Ultra Deepwater Exploration & Operation (E&P) Market by Water Depth, 2022-2032 (USD Bn, AGR (%), CAGR(%)) (V-Shaped Recovery)
Table 72. Gulf of Mexico Deepwater & Ultra Deepwater Exploration & Operation (E&P) Market by Water Depth, 2022-2032 (USD Bn, AGR (%), CAGR(%)) (W-Shaped Recovery)
Table 73. Gulf of Mexico Deepwater & Ultra Deepwater Exploration & Operation (E&P) Market by Water Depth, 2022-2032 (USD Bn, AGR (%), CAGR(%)) (U-Shaped Recovery)
Table 74. Gulf of Mexico Deepwater & Ultra Deepwater Exploration & Operation (E&P) Market by Water Depth, 2022-2032 (USD Bn, AGR (%), CAGR(%)) (L-Shaped Recovery)
Table 75. Gulf of Mexico Deepwater & Ultra Deepwater Exploration & Operation (E&P) Market by Type, 2022-2032 (USD Bn, AGR (%), CAGR(%))
Table 76. Gulf of Mexico Deepwater & Ultra Deepwater Exploration & Operation (E&P) Market by Type, 2022-2032 (USD Bn, AGR (%), CAGR(%)) (V-Shaped Recovery)
Table 77. Gulf of Mexico Deepwater & Ultra Deepwater Exploration & Operation (E&P) Market by Type, 2022-2032 (USD Bn, AGR (%), CAGR(%)) (W-Shaped Recovery)
Table 78. Gulf of Mexico Deepwater & Ultra Deepwater Exploration & Operation (E&P) Market by Type, 2022-2032 (USD Bn, AGR (%), CAGR(%)) (U-Shaped Recovery)
Table 79. Gulf of Mexico Deepwater & Ultra Deepwater Exploration & Operation (E&P) Market by Type, 2022-2032 (USD Bn, AGR (%), CAGR(%)) (L-Shaped Recovery)
Table 80. Gulf of Mexico Deepwater & Ultra Deepwater Exploration & Operation (E&P) Market by Operation, 2022-2032 (USD Bn, AGR (%), CAGR(%))
Table 81. Gulf of Mexico Deepwater & Ultra Deepwater Exploration & Operation (E&P) Market by Operation, 2022-2032 (USD Bn, AGR (%), CAGR(%)) (V-Shaped Recovery)
Table 82. Gulf of Mexico Deepwater & Ultra Deepwater Exploration & Operation (E&P) Market by Operation, 2022-2032 (USD Bn, AGR (%), CAGR(%)) (W-Shaped Recovery)
Table 83. Gulf of Mexico Deepwater & Ultra Deepwater Exploration & Operation (E&P) Market by Operation, 2022-2032 (USD Bn, AGR (%), CAGR(%)) (U-Shaped Recovery)
Table 84. Gulf of Mexico Deepwater & Ultra Deepwater Exploration & Operation (E&P) Market by Operation, 2022-2032 (USD Bn, AGR (%), CAGR(%)) (L-Shaped Recovery)
Table 85. West African Deepwater & Ultra Deepwater Exploration & Operation (E&P) Market by Value, 2022-2032 (USD Bn, AGR (%), CAGR(%))
Table 86. West African Deepwater & Ultra Deepwater Exploration & Operation (E&P) Market by Value, 2022-2032 (USD Bn, AGR (%), CAGR(%)) (V-Shaped Recovery)
Table 87. West African Deepwater & Ultra Deepwater Exploration & Operation (E&P) Market by Value, 2022-2032 (USD Bn, AGR (%), CAGR(%)) (W-Shaped Recovery)
Table 88. West African Deepwater & Ultra Deepwater Exploration & Operation (E&P) Market by Value, 2022-2032 (USD Bn, AGR (%), CAGR(%)) (U-Shaped Recovery)
Table 89. West African Deepwater & Ultra Deepwater Exploration & Operation (E&P) Market by Value, 2022-2032 (USD Bn, AGR (%), CAGR(%)) (L-Shaped Recovery)
Table 90. West African Deepwater & Ultra Deepwater Exploration & Operation (E&P) Market by Project, 2022-2032 (USD Bn, AGR (%), CAGR(%))
Table 91. West African Deepwater & Ultra Deepwater Exploration & Operation (E&P) Market by Project, 2022-2032 (USD Bn, AGR (%), CAGR(%)) (V-Shaped Recovery)
Table 92. West African Deepwater & Ultra Deepwater Exploration & Operation (E&P) Market by Project, 2022-2032 (USD Bn, AGR (%), CAGR(%)) (W-Shaped Recovery)
Table 93. West African Deepwater & Ultra Deepwater Exploration & Operation (E&P) Market by Project, 2022-2032 (USD Bn, AGR (%), CAGR(%)) (U-Shaped Recovery)
Table 94. West African Deepwater & Ultra Deepwater Exploration & Operation (E&P) Market by Project, 2022-2032 (USD Bn, AGR (%), CAGR(%)) (L-Shaped Recovery)
Table 95. West African Deepwater & Ultra Deepwater Exploration & Operation (E&P) Market by Water Depth, 2022-2032 (USD Bn, AGR (%), CAGR(%))
Table 96. West African Deepwater & Ultra Deepwater Exploration & Operation (E&P) Market by Water Depth, 2022-2032 (USD Bn, AGR (%), CAGR(%)) (V-Shaped Recovery)
Table 97. West African Deepwater & Ultra Deepwater Exploration & Operation (E&P) Market by Water Depth, 2022-2032 (USD Bn, AGR (%), CAGR(%)) (W-Shaped Recovery)
Table 98. West African Deepwater & Ultra Deepwater Exploration & Operation (E&P) Market by Water Depth, 2022-2032 (USD Bn, AGR (%), CAGR(%)) (U-Shaped Recovery)
Table 99. West African Deepwater & Ultra Deepwater Exploration & Operation (E&P) Market by Water Depth, 2022-2032 (USD Bn, AGR (%), CAGR(%)) (L-Shaped Recovery)
Table 100. West African Deepwater & Ultra Deepwater Exploration & Operation (E&P) Market by Type, 2022-2032 (USD Bn, AGR (%), CAGR(%))
Table 101. West African Deepwater & Ultra Deepwater Exploration & Operation (E&P) Market by Type, 2022-2032 (USD Bn, AGR (%), CAGR(%)) (V-Shaped Recovery)
Table 102. West African Deepwater & Ultra Deepwater Exploration & Operation (E&P) Market by Type, 2022-2032 (USD Bn, AGR (%), CAGR(%)) (W-Shaped Recovery)
Table 103. West African Deepwater & Ultra Deepwater Exploration & Operation (E&P) Market by Type, 2022-2032 (USD Bn, AGR (%), CAGR(%)) (U-Shaped Recovery)
Table 104. West African Deepwater & Ultra Deepwater Exploration & Operation (E&P) Market by Type, 2022-2032 (USD Bn, AGR (%), CAGR(%)) (L-Shaped Recovery)
Table 105. West African Deepwater & Ultra Deepwater Exploration & Operation (E&P) Market by Operation, 2022-2032 (USD Bn, AGR (%), CAGR(%))
Table 106. West African Deepwater & Ultra Deepwater Exploration & Operation (E&P) Market by Operation, 2022-2032 (USD Bn, AGR (%), CAGR(%)) (V-Shaped Recovery)
Table 107. West African Deepwater & Ultra Deepwater Exploration & Operation (E&P) Market by Operation, 2022-2032 (USD Bn, AGR (%), CAGR(%)) (W-Shaped Recovery)
Table 108. West African Deepwater & Ultra Deepwater Exploration & Operation (E&P) Market by Operation, 2022-2032 (USD Bn, AGR (%), CAGR(%)) (U-Shaped Recovery)
Table 109. West African Deepwater & Ultra Deepwater Exploration & Operation (E&P) Market by Operation, 2022-2032 (USD Bn, AGR (%), CAGR(%)) (L-Shaped Recovery)
Table 110. East African Deepwater & Ultra Deepwater Exploration & Operation (E&P) Market by Value, 2022-2032 (USD Bn, AGR (%), CAGR(%))
Table 111. East African Deepwater & Ultra Deepwater Exploration & Operation (E&P) Market by Value, 2022-2032 (USD Bn, AGR (%), CAGR(%)) (V-Shaped Recovery)
Table 112. East African Deepwater & Ultra Deepwater Exploration & Operation (E&P) Market by Value, 2022-2032 (USD Bn, AGR (%), CAGR(%)) (W-Shaped Recovery)
Table 113. East African Deepwater & Ultra Deepwater Exploration & Operation (E&P) Market by Value, 2022-2032 (USD Bn, AGR (%), CAGR(%)) (U-Shaped Recovery)
Table 114. East African Deepwater & Ultra Deepwater Exploration & Operation (E&P) Market by Value, 2022-2032 (USD Bn, AGR (%), CAGR(%)) (L-Shaped Recovery)
Table 115. East African Deepwater & Ultra Deepwater Exploration & Operation (E&P) Market by Project, 2022-2032 (USD Bn, AGR (%), CAGR(%))
Table 116. East African Deepwater & Ultra Deepwater Exploration & Operation (E&P) Market by Project, 2022-2032 (USD Bn, AGR (%), CAGR(%)) (V-Shaped Recovery)
Table 117. East African Deepwater & Ultra Deepwater Exploration & Operation (E&P) Market by Project, 2022-2032 (USD Bn, AGR (%), CAGR(%)) (W-Shaped Recovery)
Table 118. East African Deepwater & Ultra Deepwater Exploration & Operation (E&P) Market by Project, 2022-2032 (USD Bn, AGR (%), CAGR(%)) (U-Shaped Recovery)
Table 119. East African Deepwater & Ultra Deepwater Exploration & Operation (E&P) Market by Project, 2022-2032 (USD Bn, AGR (%), CAGR(%)) (L-Shaped Recovery)
Table 120. East African Deepwater & Ultra Deepwater Exploration & Operation (E&P) Market by Water Depth, 2022-2032 (USD Bn, AGR (%), CAGR(%))
Table 121. East African Deepwater & Ultra Deepwater Exploration & Operation (E&P) Market by Water Depth, 2022-2032 (USD Bn, AGR (%), CAGR(%)) (V-Shaped Recovery)
Table 122. East African Deepwater & Ultra Deepwater Exploration & Operation (E&P) Market by Water Depth, 2022-2032 (USD Bn, AGR (%), CAGR(%)) (W-Shaped Recovery)
Table 123. East African Deepwater & Ultra Deepwater Exploration & Operation (E&P) Market by Water Depth, 2022-2032 (USD Bn, AGR (%), CAGR(%)) (U-Shaped Recovery)
Table 124. East African Deepwater & Ultra Deepwater Exploration & Operation (E&P) Market by Water Depth, 2022-2032 (USD Bn, AGR (%), CAGR(%)) (L-Shaped Recovery)
Table 125. East African Deepwater & Ultra Deepwater Exploration & Operation (E&P) Market by Type, 2022-2032 (USD Bn, AGR (%), CAGR(%))
Table 126. East African Deepwater & Ultra Deepwater Exploration & Operation (E&P) Market by Type, 2022-2032 (USD Bn, AGR (%), CAGR(%)) (V-Shaped Recovery)
Table 127. East African Deepwater & Ultra Deepwater Exploration & Operation (E&P) Market by Type, 2022-2032 (USD Bn, AGR (%), CAGR(%)) (W-Shaped Recovery)
Table 128. East African Deepwater & Ultra Deepwater Exploration & Operation (E&P) Market by Type, 2022-2032 (USD Bn, AGR (%), CAGR(%)) (U-Shaped Recovery)
Table 129. East African Deepwater & Ultra Deepwater Exploration & Operation (E&P) Market by Type, 2022-2032 (USD Bn, AGR (%), CAGR(%)) (L-Shaped Recovery)
Table 130. East African Deepwater & Ultra Deepwater Exploration & Operation (E&P) Market by Operation, 2022-2032 (USD Bn, AGR (%), CAGR(%))
Table 131. East African Deepwater & Ultra Deepwater Exploration & Operation (E&P) Market by Operation, 2022-2032 (USD Bn, AGR (%), CAGR(%)) (V-Shaped Recovery)
Table 132. East African Deepwater & Ultra Deepwater Exploration & Operation (E&P) Market by Operation, 2022-2032 (USD Bn, AGR (%), CAGR(%)) (W-Shaped Recovery)
Table 133. East African Deepwater & Ultra Deepwater Exploration & Operation (E&P) Market by Operation, 2022-2032 (USD Bn, AGR (%), CAGR(%)) (U-Shaped Recovery)
Table 134. East African Deepwater & Ultra Deepwater Exploration & Operation (E&P) Market by Operation, 2022-2032 (USD Bn, AGR (%), CAGR(%)) (L-Shaped Recovery)
Table 135. Asia-Pacific Deepwater & Ultra Deepwater Exploration & Operation (E&P) Market by Value, 2022-2032 (USD Bn, AGR (%), CAGR(%))
Table 136. Asia-Pacific Deepwater & Ultra Deepwater Exploration & Operation (E&P) Market by Value, 2022-2032 (USD Bn, AGR (%), CAGR(%)) (V-Shaped Recovery)
Table 137. Asia-Pacific Deepwater & Ultra Deepwater Exploration & Operation (E&P) Market by Value, 2022-2032 (USD Bn, AGR (%), CAGR(%)) (W-Shaped Recovery)
Table 138. Asia-Pacific Deepwater & Ultra Deepwater Exploration & Operation (E&P) Market by Value, 2022-2032 (USD Bn, AGR (%), CAGR(%)) (U-Shaped Recovery)
Table 139. Asia-Pacific Deepwater & Ultra Deepwater Exploration & Operation (E&P) Market by Value, 2022-2032 (USD Bn, AGR (%), CAGR(%)) (L-Shaped Recovery)
Table 140. Asia-Pacific Deepwater & Ultra Deepwater Exploration & Operation (E&P) Market by Project, 2022-2032 (USD Bn, AGR (%), CAGR(%))
Table 141. Asia-Pacific Deepwater & Ultra Deepwater Exploration & Operation (E&P) Market by Project, 2022-2032 (USD Bn, AGR (%), CAGR(%)) (V-Shaped Recovery)
Table 142. Asia-Pacific Deepwater & Ultra Deepwater Exploration & Operation (E&P) Market by Project, 2022-2032 (USD Bn, AGR (%), CAGR(%)) (W-Shaped Recovery)
Table 143. Asia-Pacific Deepwater & Ultra Deepwater Exploration & Operation (E&P) Market by Project, 2022-2032 (USD Bn, AGR (%), CAGR(%)) (U-Shaped Recovery)
Table 144. Asia-Pacific Deepwater & Ultra Deepwater Exploration & Operation (E&P) Market by Project, 2022-2032 (USD Bn, AGR (%), CAGR(%)) (L-Shaped Recovery)
Table 145. Asia-Pacific Deepwater & Ultra Deepwater Exploration & Operation (E&P) Market by Water Depth, 2022-2032 (USD Bn, AGR (%), CAGR(%))
Table 146. Asia-Pacific Deepwater & Ultra Deepwater Exploration & Operation (E&P) Market by Water Depth, 2022-2032 (USD Bn, AGR (%), CAGR(%)) (V-Shaped Recovery)
Table 147. Asia-Pacific Deepwater & Ultra Deepwater Exploration & Operation (E&P) Market by Water Depth, 2022-2032 (USD Bn, AGR (%), CAGR(%)) (W-Shaped Recovery)
Table 148. Asia-Pacific Deepwater & Ultra Deepwater Exploration & Operation (E&P) Market by Water Depth, 2022-2032 (USD Bn, AGR (%), CAGR(%)) (U-Shaped Recovery)
Table 149. Asia-Pacific Deepwater & Ultra Deepwater Exploration & Operation (E&P) Market by Water Depth, 2022-2032 (USD Bn, AGR (%), CAGR(%)) (L-Shaped Recovery)
Table 150. Asia-Pacific Deepwater & Ultra Deepwater Exploration & Operation (E&P) Market by Type, 2022-2032 (USD Bn, AGR (%), CAGR(%))
Table 151. Asia-Pacific Deepwater & Ultra Deepwater Exploration & Operation (E&P) Market by Type, 2022-2032 (USD Bn, AGR (%), CAGR(%)) (V-Shaped Recovery)
Table 152. Asia-Pacific Deepwater & Ultra Deepwater Exploration & Operation (E&P) Market by Type, 2022-2032 (USD Bn, AGR (%), CAGR(%)) (W-Shaped Recovery)
Table 153. Asia-Pacific Deepwater & Ultra Deepwater Exploration & Operation (E&P) Market by Type, 2022-2032 (USD Bn, AGR (%), CAGR(%)) (U-Shaped Recovery)
Table 154. Asia-Pacific Deepwater & Ultra Deepwater Exploration & Operation (E&P) Market by Type, 2022-2032 (USD Bn, AGR (%), CAGR(%)) (L-Shaped Recovery)
Table 155. Asia-Pacific Deepwater & Ultra Deepwater Exploration & Operation (E&P) Market by Operation, 2022-2032 (USD Bn, AGR (%), CAGR(%))
Table 156. Asia-Pacific Deepwater & Ultra Deepwater Exploration & Operation (E&P) Market by Operation, 2022-2032 (USD Bn, AGR (%), CAGR(%)) (V-Shaped Recovery)
Table 157. Asia-Pacific Deepwater & Ultra Deepwater Exploration & Operation (E&P) Market by Operation, 2022-2032 (USD Bn, AGR (%), CAGR(%)) (W-Shaped Recovery)
Table 158. Asia-Pacific Deepwater & Ultra Deepwater Exploration & Operation (E&P) Market by Operation, 2022-2032 (USD Bn, AGR (%), CAGR(%)) (U-Shaped Recovery)
Table 159. Asia-Pacific Deepwater & Ultra Deepwater Exploration & Operation (E&P) Market by Operation, 2022-2032 (USD Bn, AGR (%), CAGR(%)) (L-Shaped Recovery)
Table 160. European Deepwater & Ultra Deepwater Exploration & Operation (E&P) Market by Value, 2022-2032 (USD Bn, AGR (%), CAGR(%))
Table 161. European Deepwater & Ultra Deepwater Exploration & Operation (E&P) Market by Value, 2022-2032 (USD Bn, AGR (%), CAGR(%)) (V-Shaped Recovery)
Table 162. European Deepwater & Ultra Deepwater Exploration & Operation (E&P) Market by Value, 2022-2032 (USD Bn, AGR (%), CAGR(%)) (W-Shaped Recovery)
Table 163. European Deepwater & Ultra Deepwater Exploration & Operation (E&P) Market by Value, 2022-2032 (USD Bn, AGR (%), CAGR(%)) (U-Shaped Recovery)
Table 164. European Deepwater & Ultra Deepwater Exploration & Operation (E&P) Market by Value, 2022-2032 (USD Bn, AGR (%), CAGR(%)) (L-Shaped Recovery)
Table 165. European Deepwater & Ultra Deepwater Exploration & Operation (E&P) Market by Project, 2022-2032 (USD Bn, AGR (%), CAGR(%))
Table 166. European Deepwater & Ultra Deepwater Exploration & Operation (E&P) Market by Project, 2022-2032 (USD Bn, AGR (%), CAGR(%)) (V-Shaped Recovery)
Table 167. European Deepwater & Ultra Deepwater Exploration & Operation (E&P) Market by Project, 2022-2032 (USD Bn, AGR (%), CAGR(%)) (W-Shaped Recovery)
Table 168. European Deepwater & Ultra Deepwater Exploration & Operation (E&P) Market by Project, 2022-2032 (USD Bn, AGR (%), CAGR(%)) (U-Shaped Recovery)
Table 169. European Deepwater & Ultra Deepwater Exploration & Operation (E&P) Market by Project, 2022-2032 (USD Bn, AGR (%), CAGR(%)) (L-Shaped Recovery)
Table 170. European Deepwater & Ultra Deepwater Exploration & Operation (E&P) Market by Water Depth, 2022-2032 (USD Bn, AGR (%), CAGR(%))
Table 171. European Deepwater & Ultra Deepwater Exploration & Operation (E&P) Market by Water Depth, 2022-2032 (USD Bn, AGR (%), CAGR(%)) (V-Shaped Recovery)
Table 172. European Deepwater & Ultra Deepwater Exploration & Operation (E&P) Market by Water Depth, 2022-2032 (USD Bn, AGR (%), CAGR(%)) (W-Shaped Recovery)
Table 173. European Deepwater & Ultra Deepwater Exploration & Operation (E&P) Market by Water Depth, 2022-2032 (USD Bn, AGR (%), CAGR(%)) (U-Shaped Recovery)
Table 174. European Deepwater & Ultra Deepwater Exploration & Operation (E&P) Market by Water Depth, 2022-2032 (USD Bn, AGR (%), CAGR(%)) (L-Shaped Recovery)
Table 175. European Deepwater & Ultra Deepwater Exploration & Operation (E&P) Market by Type, 2022-2032 (USD Bn, AGR (%), CAGR(%))
Table 176. European Deepwater & Ultra Deepwater Exploration & Operation (E&P) Market by Type, 2022-2032 (USD Bn, AGR (%), CAGR(%)) (V-Shaped Recovery)
Table 177. European Deepwater & Ultra Deepwater Exploration & Operation (E&P) Market by Type, 2022-2032 (USD Bn, AGR (%), CAGR(%)) (W-Shaped Recovery)
Table 178. European Deepwater & Ultra Deepwater Exploration & Operation (E&P) Market by Type, 2022-2032 (USD Bn, AGR (%), CAGR(%)) (U-Shaped Recovery)
Table 179. European Deepwater & Ultra Deepwater Exploration & Operation (E&P) Market by Type, 2022-2032 (USD Bn, AGR (%), CAGR(%)) (L-Shaped Recovery)
Table 180. European Deepwater & Ultra Deepwater Exploration & Operation (E&P) Market by Operation, 2022-2032 (USD Bn, AGR (%), CAGR(%))
Table 181. European Deepwater & Ultra Deepwater Exploration & Operation (E&P) Market by Operation, 2022-2032 (USD Bn, AGR (%), CAGR(%)) (V-Shaped Recovery)
Table 182. European Deepwater & Ultra Deepwater Exploration & Operation (E&P) Market by Operation, 2022-2032 (USD Bn, AGR (%), CAGR(%)) (W-Shaped Recovery)
Table 183. European Deepwater & Ultra Deepwater Exploration & Operation (E&P) Market by Operation, 2022-2032 (USD Bn, AGR (%), CAGR(%)) (U-Shaped Recovery)
Table 184. European Deepwater & Ultra Deepwater Exploration & Operation (E&P) Market by Operation, 2022-2032 (USD Bn, AGR (%), CAGR(%)) (L-Shaped Recovery)
Table 185. Rest of the World Deepwater & Ultra Deepwater Exploration & Operation (E&P) Market by Value, 2022-2032 (USD Bn, AGR (%), CAGR(%))
Table 186. Rest of the World Deepwater & Ultra Deepwater Exploration & Operation (E&P) Market by Value, 2022-2032 (USD Bn, AGR (%), CAGR(%)) (V-Shaped Recovery)
Table 187. Rest of the World Deepwater & Ultra Deepwater Exploration & Operation (E&P) Market by Value, 2022-2032 (USD Bn, AGR (%), CAGR(%)) (W-Shaped Recovery)
Table 188. Rest of the World Deepwater & Ultra Deepwater Exploration & Operation (E&P) Market by Value, 2022-2032 (USD Bn, AGR (%), CAGR(%)) (U-Shaped Recovery)
Table 189. Rest of the World Deepwater & Ultra Deepwater Exploration & Operation (E&P) Market by Value, 2022-2032 (USD Bn, AGR (%), CAGR(%)) (L-Shaped Recovery)
Table 190. Rest of the World Deepwater & Ultra Deepwater Exploration & Operation (E&P) Market by Project, 2022-2032 (USD Bn, AGR (%), CAGR(%))
Table 191. Rest of the World Deepwater & Ultra Deepwater Exploration & Operation (E&P) Market by Project, 2022-2032 (USD Bn, AGR (%), CAGR(%)) (V-Shaped Recovery)
Table 192. Rest of the World Deepwater & Ultra Deepwater Exploration & Operation (E&P) Market by Project, 2022-2032 (USD Bn, AGR (%), CAGR(%)) (W-Shaped Recovery)
Table 193. Rest of the World Deepwater & Ultra Deepwater Exploration & Operation (E&P) Market by Project, 2022-2032 (USD Bn, AGR (%), CAGR(%)) (U-Shaped Recovery)
Table 194. Rest of the World Deepwater & Ultra Deepwater Exploration & Operation (E&P) Market by Project, 2022-2032 (USD Bn, AGR (%), CAGR(%)) (L-Shaped Recovery)
Table 195. Rest of the World Deepwater & Ultra Deepwater Exploration & Operation (E&P) Market by Water Depth, 2022-2032 (USD Bn, AGR (%), CAGR(%))
Table 196. Rest of the World Deepwater & Ultra Deepwater Exploration & Operation (E&P) Market by Water Depth, 2022-2032 (USD Bn, AGR (%), CAGR(%)) (V-Shaped Recovery)
Table 197. Rest of the World Deepwater & Ultra Deepwater Exploration & Operation (E&P) Market by Water Depth, 2022-2032 (USD Bn, AGR (%), CAGR(%)) (W-Shaped Recovery)
Table 198. Rest of the World Deepwater & Ultra Deepwater Exploration & Operation (E&P) Market by Water Depth, 2022-2032 (USD Bn, AGR (%), CAGR(%)) (U-Shaped Recovery)
Table 199. Rest of the World Deepwater & Ultra Deepwater Exploration & Operation (E&P) Market by Water Depth, 2022-2032 (USD Bn, AGR (%), CAGR(%)) (L-Shaped Recovery)
Table 200. Rest of the World Deepwater & Ultra Deepwater Exploration & Operation (E&P) Market by Type, 2022-2032 (USD Bn, AGR (%), CAGR(%))
Table 201. Rest of the World Deepwater & Ultra Deepwater Exploration & Operation (E&P) Market by Type, 2022-2032 (USD Bn, AGR (%), CAGR(%)) (V-Shaped Recovery)
Table 202. Rest of the World Deepwater & Ultra Deepwater Exploration & Operation (E&P) Market by Type, 2022-2032 (USD Bn, AGR (%), CAGR(%)) (W-Shaped Recovery)
Table 203. Rest of the World Deepwater & Ultra Deepwater Exploration & Operation (E&P) Market by Type, 2022-2032 (USD Bn, AGR (%), CAGR(%)) (U-Shaped Recovery)
Table 204. Rest of the World Deepwater & Ultra Deepwater Exploration & Operation (E&P) Market by Type, 2022-2032 (USD Bn, AGR (%), CAGR(%)) (L-Shaped Recovery)
Table 205. Rest of the World Deepwater & Ultra Deepwater Exploration & Operation (E&P) Market by Operation, 2022-2032 (USD Bn, AGR (%), CAGR(%))
Table 206. Rest of the World Deepwater & Ultra Deepwater Exploration & Operation (E&P) Market by Operation, 2022-2032 (USD Bn, AGR (%), CAGR(%)) (V-Shaped Recovery)
Table 207. Rest of the World Deepwater & Ultra Deepwater Exploration & Operation (E&P) Market by Operation, 2022-2032 (USD Bn, AGR (%), CAGR(%)) (W-Shaped Recovery)
Table 208. Rest of the World Deepwater & Ultra Deepwater Exploration & Operation (E&P) Market by Operation, 2022-2032 (USD Bn, AGR (%), CAGR(%)) (U-Shaped Recovery)
Table 209. Rest of the World Deepwater & Ultra Deepwater Exploration & Operation (E&P) Market by Operation, 2022-2032 (USD Bn, AGR (%), CAGR(%)) (L-Shaped Recovery)
Table 210. Transocean Ltd.: Company Information
Table 211. Transocean Ltd.: Company Revenue 2016-2020 (US$Mn, AGR %)
Table 212. Transocean Ltd.: Company Product and Service Benchmarking
Table 213. Transocean Ltd.: Company Recent Developments
Table 214. Seadrill Limited: Company Information
Table 215. Seadrill Limited: Company Revenue 2016-2020 (US$Mn, AGR %)
Table 216. Seadrill Limited: Company Product and Service Benchmarking
Table 217. Seadrill Limited: Company Recent Developments
Table 218. Noble Corporation: Company Information
Table 219. Noble Corporation: Company Revenue 2016-2020 (US$Mn, AGR %)
Table 220. Noble Corporation: Company Product and Service Benchmarking
Table 221. Noble Corporation: Company Recent Developments
Table 222. Valaris Plc: Company Information
Table 223. Valaris Plc: Company Revenue 2016-2020 (US$Mn, AGR %)
Table 224. Valaris Plc: Company Product and Service Benchmarking
Table 225. Valaris Plc: Company Recent Developments
Table 226. Saipem SpA: Company Information
Table 227. Saipem SpA: Company Revenue 2016-2020 (US$Mn, AGR %)
Table 228. Saipem SpA: Company Product and Service Benchmarking
Table 229. Saipem SpA: Company Recent Developments
Table 230. Sapura Energy Berhad: Company Information
Table 231. Sapura Energy Berhad: Company Revenue 2017-2021 (US$Mn, AGR %)
Table 232. Sapura Energy Berhad: Company Product and Service Benchmarking
Table 233. Sapura Energy Berhad: Company Recent Developments
Table 234. Nabors Industries: Company Information
Table 235. Nabors Industries: Company Revenue 2016-2020 (US$Mn, AGR %)
Table 236. Nabors Industries: Company Product and Service Benchmarking
Table 237. Nabors Industries: Company Recent Developments
Table 238. Maersk Drilling: Company Information
Table 239. Maersk Drilling: Company Revenue 2016-2020 (US$Mn, AGR %)
Table 240. Maersk Drilling: Company Product and Service Benchmarking
Table 241. Maersk Drilling: Company Recent Developments
Table 242. Shelf Drilling Ltd: Company Information
Table 243. Shelf Drilling Ltd: Company Revenue 2016-2020 (US$Mn, AGR %)
Table 244. Shelf Drilling Ltd: Company Product and Service Benchmarking
Table 245. Aker Solutions: Company Information
Table 246. Aker Solutions: Company Revenue 2016-2020 (US$Mn, AGR %)
Table 247. Aker Solutions: Company Product and Service Benchmarking
Table 248. Aker Solutions: Company Recent Developments
Table 249. CGG: Company Information
Table 250. CGG: Company Revenue 2016-2020 (US$Mn, AGR %)
Table 251. CGG: Company Product and Service Benchmarking
Table 252. CGG: Company Recent Developments
Table 253. MODEC: Company Information
Table 254. MODEC: Company Revenue 2016-2020 (US$Mn, AGR %)
Table 255. MODEC: Company Product and Service Benchmarking
Table 256. MODEC: Company Recent Developments
Table 257. PGS: Company Information
Table 258. PGS: Company Revenue 2016-2020 (US$Mn, AGR %)
Table 259. PGS: Company Product and Service Benchmarking
Table 260. PGS: Company Recent Developments
Table 261. SBM Offshore: Company Information
Table 262. SBM Offshore: Company Revenue 2016-2020 (US$Mn, AGR %)
Table 263. SBM Offshore: Company Product and Service Benchmarking
Table 264. SBM Offshore: Company Recent Developments
Table 265. The Royal Dutch Shell: Company Information
Table 266. The Royal Dutch Shell: Company Revenue 2016-2020 (US$Mn, AGR %)
Table 267. The Royal Dutch Shell: Company Product and Service Benchmarking
Table 268. The Royal Dutch Shell: Company Recent Developments
Table 269. Subsea 7: Company Information
Table 270. Subsea 7: Company Revenue 2016-2020 (US$Mn, AGR %)
Table 271. Subsea 7: Company Recent Developments
Table 272. China National Offshore Oil Corporation: Company Information
Table 273. China National Offshore Oil Corporation: Company Revenue 2016-2020 (US$Mn, AGR %)
Table 274. China National Offshore Oil Corporation: Company Product and Service Benchmarking
Table 275. Seabird Exploration: Company Information
Table 276. Seabird Exploration: Company Revenue 2016-2020 (US$Mn, AGR %)
Table 277. Seabird Exploration: Company Product and Service Benchmarking
Table 278. Petrobras: Company Information
Table 279. Petrobras: Company Revenue 2016-2020 (US$Mn, AGR %)
Table 280. Petrobras: Company Recent Developments
Table 281. Petronas: Company Information
Table 282. Petronas: Company Revenue 2016-2020 (US$Mn, AGR %)
Table 283. Petronas: Company Recent Developments
List of Figures
Figure 1. Global Deepwater & Ultra Deepwater Exploration & Operation (E&P) Market Forecast, 2022-2032 (USD Bn, AGR (%))
Figure 2. Global Deepwater & Ultra Deepwater Exploration & Production (E&P) Market Segmentation
Figure 3. Global Deepwater & Ultra Deepwater Exploration & Production (E&P) Market Trends :
Figure 4. Porters Five Forces
Figure 5. Global Deepwater & Ultra Deepwater Exploration & Operation (E&P) Market Forecast, 2022-2032 (USD Bn, AGR (%))
Figure 6. Global Deepwater & Ultra Deepwater Exploration & Operation (E&P) Market Forecast, 2022-2032 (USD Bn, AGR (%)) (V-Shaped Recovery)
Figure 7. Global Deepwater & Ultra Deepwater Exploration & Operation (E&P) Market Forecast, 2022-2032 (USD Bn, AGR (%)) (W-Shaped Recovery)
Figure 8. Global Deepwater & Ultra Deepwater Exploration & Operation (E&P) Market Forecast, 2022-2032 (USD Bn, AGR (%)) (U-Shaped Recovery)
Figure 9. Global Deepwater & Ultra Deepwater Exploration & Operation (E&P) Market Forecast, 2022-2032 (USD Bn, AGR (%)) (L-Shaped Recovery)
Figure 10. Global Deepwater & Ultra Deepwater Exploration & Production (E&P) Market Share Forecast by Region 2022, 2027, 2032(%)
Figure 11. Global Deepwater & Ultra Deepwater Exploration & Operation (E&P) Market by Region, 2022-2032 (USD Bn, AGR (%))
Figure 12. Global Deepwater & Ultra Deepwater Exploration & Operation (E&P) Market by Region, 2022-2032 (USD Bn, AGR (%)) (V-Shaped Recovery)
Figure 13. Global Deepwater & Ultra Deepwater Exploration & Operation (E&P) Market by Region, 2022-2032 (USD Bn, AGR (%)) (W-Shaped Recovery)
Figure 14. Global Deepwater & Ultra Deepwater Exploration & Operation (E&P) Market by Region, 2022-2032 (USD Bn, AGR (%)) (U-Shaped Recovery)
Figure 15. Global Deepwater & Ultra Deepwater Exploration & Operation (E&P) Market by Region, 2022-2032 (USD Bn, AGR (%)) (L-Shaped Recovery)
Figure 16. Global Deepwater & Ultra Deepwater Exploration & Production (E&P) Market Share Forecast by Project 2022, 2027, 2032(%)
Figure 17. Global Deepwater & Ultra Deepwater Exploration & Operation (E&P) Market by Project, 2022-2032 (USD Bn, AGR (%))
Figure 18. Global Deepwater & Ultra Deepwater Exploration & Operation (E&P) Market by Project, 2022-2032 (USD Bn, AGR (%)) (V-Shaped Recovery)
Figure 19. Global Deepwater & Ultra Deepwater Exploration & Operation (E&P) Market by Project, 2022-2032 (USD Bn, AGR (%)) (W-Shaped Recovery)
Figure 20. Global Deepwater & Ultra Deepwater Exploration & Operation (E&P) Market by Project, 2022-2032 (USD Bn, AGR (%)) (U-Shaped Recovery)
Figure 21. Global Deepwater & Ultra Deepwater Exploration & Operation (E&P) Market by Project, 2022-2032 (USD Bn, AGR (%)) (L-Shaped Recovery)
Figure 22. Global Deepwater & Ultra Deepwater Exploration & Production (E&P) Market Share Forecast by Water Depth 2022, 2027, 2032(%)
Figure 23. Global Deepwater & Ultra Deepwater Exploration & Operation (E&P) Market by Water Depth, 2022-2032 (USD Bn, AGR (%))
Figure 24. Global Deepwater & Ultra Deepwater Exploration & Operation (E&P) Market by Water Depth, 2022-2032 (USD Bn, AGR (%)) (V-Shaped Recovery)
Figure 25. Global Deepwater & Ultra Deepwater Exploration & Operation (E&P) Market by Water Depth, 2022-2032 (USD Bn, AGR (%)) (W-Shaped Recovery)
Figure 26. Global Deepwater & Ultra Deepwater Exploration & Operation (E&P) Market by Water Depth, 2022-2032 (USD Bn, AGR (%)) (U-Shaped Recovery)
Figure 27. Global Deepwater & Ultra Deepwater Exploration & Operation (E&P) Market by Water Depth, 2022-2032 (USD Bn, AGR (%)) (L-Shaped Recovery)
Figure 28. Global Deepwater & Ultra Deepwater Exploration & Production (E&P) Market Share Forecast by Type 2022, 2027, 2032(%)
Figure 29. Global Deepwater & Ultra Deepwater Exploration & Operation (E&P) Market by Type, 2022-2032 (USD Bn, AGR (%))
Figure 30. Global Deepwater & Ultra Deepwater Exploration & Operation (E&P) Market by Type, 2022-2032 (USD Bn, AGR (%)) (V-Shaped Recovery)
Figure 31. Global Deepwater & Ultra Deepwater Exploration & Operation (E&P) Market by Type, 2022-2032 (USD Bn, AGR (%)) (W-Shaped Recovery)
Figure 32. Global Deepwater & Ultra Deepwater Exploration & Operation (E&P) Market by Type, 2022-2032 (USD Bn, AGR (%)) (U-Shaped Recovery)
Figure 33. Global Deepwater & Ultra Deepwater Exploration & Operation (E&P) Market by Type, 2022-2032 (USD Bn, AGR (%)) (L-Shaped Recovery)
Figure 34. Global Deepwater & Ultra Deepwater Exploration & Production (E&P) Market Share Forecast by Systems 2022, 2027, 2032(%)
Figure 35. Global Deepwater & Ultra Deepwater Exploration & Operation (E&P) Market by Operation, 2022-2032 (USD Bn, AGR (%))
Figure 36. Global Deepwater & Ultra Deepwater Exploration & Operation (E&P) Market by Operation, 2022-2032 (USD Bn, AGR (%)) (V-Shaped Recovery)
Figure 37. Global Deepwater & Ultra Deepwater Exploration & Operation (E&P) Market by Operation, 2022-2032 (USD Bn, AGR (%)) (W-Shaped Recovery)
Figure 38. Global Deepwater & Ultra Deepwater Exploration & Operation (E&P) Market by Operation, 2022-2032 (USD Bn, AGR (%)) (U-Shaped Recovery)
Figure 39. Global Deepwater & Ultra Deepwater Exploration & Operation (E&P) Market by Operation, 2022-2032 (USD Bn, AGR (%)) (L-Shaped Recovery)
Figure 40. South American Deepwater & Ultra Deepwater Exploration & Operation (E&P) Market by Value, 2022-2032 (USD Bn, AGR (%))
Figure 41. South American Deepwater & Ultra Deepwater Exploration & Operation (E&P) Market by Value, 2022-2032 (USD Bn, AGR (%)) (V-Shaped Recovery)
Figure 42. South American Deepwater & Ultra Deepwater Exploration & Operation (E&P) Market by Value, 2022-2032 (USD Bn, AGR (%)) (W-Shaped Recovery)
Figure 43. South American Deepwater & Ultra Deepwater Exploration & Operation (E&P) Market by Value, 2022-2032 (USD Bn, AGR (%)) (U-Shaped Recovery)
Figure 44. South American Deepwater & Ultra Deepwater Exploration & Operation (E&P) Market by Value, 2022-2032 (USD Bn, AGR (%)) (L-Shaped Recovery)
Figure 45. South American Deepwater & Ultra Deepwater Exploration & Operation (E&P) Market by Project, 2022-2032 (USD Bn, AGR (%))
Figure 46. South American Deepwater & Ultra Deepwater Exploration & Operation (E&P) Market by Project, 2022-2032 (USD Bn, AGR (%)) (V-Shaped Recovery)
Figure 47. South American Deepwater & Ultra Deepwater Exploration & Operation (E&P) Market by Project, 2022-2032 (USD Bn, AGR (%)) (W-Shaped Recovery)
Figure 48. South American Deepwater & Ultra Deepwater Exploration & Operation (E&P) Market by Project, 2022-2032 (USD Bn, AGR (%)) (U-Shaped Recovery)
Figure 49. South American Deepwater & Ultra Deepwater Exploration & Operation (E&P) Market by Project, 2022-2032 (USD Bn, AGR (%)) (L-Shaped Recovery)
Figure 50. South American Deepwater & Ultra Deepwater Exploration & Operation (E&P) Market by Water Depth, 2022-2032 (USD Bn, AGR (%))
Figure 51. South American Deepwater & Ultra Deepwater Exploration & Operation (E&P) Market by Water Depth, 2022-2032 (USD Bn, AGR (%)) (V-Shaped Recovery)
Figure 52. South American Deepwater & Ultra Deepwater Exploration & Operation (E&P) Market by Water Depth, 2022-2032 (USD Bn, AGR (%)) (W-Shaped Recovery)
Figure 53. South American Deepwater & Ultra Deepwater Exploration & Operation (E&P) Market by Water Depth, 2022-2032 (USD Bn, AGR (%)) (U-Shaped Recovery)
Figure 54. South American Deepwater & Ultra Deepwater Exploration & Operation (E&P) Market by Water Depth, 2022-2032 (USD Bn, AGR (%)) (L-Shaped Recovery)
Figure 55. South American Deepwater & Ultra Deepwater Exploration & Operation (E&P) Market by Type, 2022-2032 (USD Bn, AGR (%))
Figure 56. South American Deepwater & Ultra Deepwater Exploration & Operation (E&P) Market by Type, 2022-2032 (USD Bn, AGR (%)) (V-Shaped Recovery)
Figure 57. South American Deepwater & Ultra Deepwater Exploration & Operation (E&P) Market by Type, 2022-2032 (USD Bn, AGR (%)) (W-Shaped Recovery)
Figure 58. South American Deepwater & Ultra Deepwater Exploration & Operation (E&P) Market by Type, 2022-2032 (USD Bn, AGR (%)) (U-Shaped Recovery)
Figure 59. South American Deepwater & Ultra Deepwater Exploration & Operation (E&P) Market by Type, 2022-2032 (USD Bn, AGR (%)) (L-Shaped Recovery)
Figure 60. South American Deepwater & Ultra Deepwater Exploration & Operation (E&P) Market by Operation, 2022-2032 (USD Bn, AGR (%))
Figure 61. South American Deepwater & Ultra Deepwater Exploration & Operation (E&P) Market by Operation, 2022-2032 (USD Bn, AGR (%)) (V-Shaped Recovery)
Figure 62. South American Deepwater & Ultra Deepwater Exploration & Operation (E&P) Market by Operation, 2022-2032 (USD Bn, AGR (%)) (W-Shaped Recovery)
Figure 63. South American Deepwater & Ultra Deepwater Exploration & Operation (E&P) Market by Operation, 2022-2032 (USD Bn, AGR (%)) (U-Shaped Recovery)
Figure 64. South American Deepwater & Ultra Deepwater Exploration & Operation (E&P) Market by Operation, 2022-2032 (USD Bn, AGR (%)) (L-Shaped Recovery)
Figure 65. Gulf of Mexico Deepwater & Ultra Deepwater Exploration & Operation (E&P) Market by Value, 2022-2032 (USD Bn, AGR (%))
Figure 66. Gulf of Mexico Deepwater & Ultra Deepwater Exploration & Operation (E&P) Market by Value, 2022-2032 (USD Bn, AGR (%)) (V-Shaped Recovery)
Figure 67. Gulf of Mexico Deepwater & Ultra Deepwater Exploration & Operation (E&P) Market by Value, 2022-2032 (USD Bn, AGR (%)) (W-Shaped Recovery)
Figure 68. Gulf of Mexico Deepwater & Ultra Deepwater Exploration & Operation (E&P) Market by Value, 2022-2032 (USD Bn, AGR (%)) (U-Shaped Recovery)
Figure 69. Gulf of Mexico Deepwater & Ultra Deepwater Exploration & Operation (E&P) Market by Value, 2022-2032 (USD Bn, AGR (%)) (L-Shaped Recovery)
Figure 70. Gulf of Mexico Deepwater & Ultra Deepwater Exploration & Operation (E&P) Market by Project, 2022-2032 (USD Bn, AGR (%))
Figure 71. ulf of Mexico Deepwater & Ultra Deepwater Exploration & Operation (E&P) Market by Project, 2022-2032 (USD Bn, AGR (%)) (V-Shaped Recovery)
Figure 72. Gulf of Mexico Deepwater & Ultra Deepwater Exploration & Operation (E&P) Market by Project, 2022-2032 (USD Bn, AGR (%)) (W-Shaped Recovery)
Figure 73. Gulf of Mexico Deepwater & Ultra Deepwater Exploration & Operation (E&P) Market by Project, 2022-2032 (USD Bn, AGR (%)) (U-Shaped Recovery)
Figure 74. Gulf of Mexico Deepwater & Ultra Deepwater Exploration & Operation (E&P) Market by Project, 2022-2032 (USD Bn, AGR (%)) (L-Shaped Recovery)
Figure 75. Gulf of Mexico Deepwater & Ultra Deepwater Exploration & Operation (E&P) Market by Water Depth, 2022-2032 (USD Bn, AGR (%))
Figure 76. Gulf of Mexico Deepwater & Ultra Deepwater Exploration & Operation (E&P) Market by Water Depth, 2022-2032 (USD Bn, AGR (%)) (V-Shaped Recovery)
Figure 77. Gulf of Mexico Deepwater & Ultra Deepwater Exploration & Operation (E&P) Market by Water Depth, 2022-2032 (USD Bn, AGR (%)) (W-Shaped Recovery)
Figure 78. Gulf of Mexico Deepwater & Ultra Deepwater Exploration & Operation (E&P) Market by Water Depth, 2022-2032 (USD Bn, AGR (%)) (U-Shaped Recovery)
Figure 79. Gulf of Mexico Deepwater & Ultra Deepwater Exploration & Operation (E&P) Market by Water Depth, 2022-2032 (USD Bn, AGR (%)) (L-Shaped Recovery)
Figure 80. Gulf of Mexico Deepwater & Ultra Deepwater Exploration & Operation (E&P) Market by Type, 2022-2032 (USD Bn, AGR (%))
Figure 81. Gulf of Mexico Deepwater & Ultra Deepwater Exploration & Operation (E&P) Market by Type, 2022-2032 (USD Bn, AGR (%)) (V-Shaped Recovery)
Figure 82. Gulf of Mexico Deepwater & Ultra Deepwater Exploration & Operation (E&P) Market by Type, 2022-2032 (USD Bn, AGR (%)) (W-Shaped Recovery)
Figure 83. Gulf of Mexico Deepwater & Ultra Deepwater Exploration & Operation (E&P) Market by Type, 2022-2032 (USD Bn, AGR (%)) (U-Shaped Recovery)
Figure 84. Gulf of Mexico Deepwater & Ultra Deepwater Exploration & Operation (E&P) Market by Type, 2022-2032 (USD Bn, AGR (%)) (L-Shaped Recovery)
Figure 85. Gulf of Mexico Deepwater & Ultra Deepwater Exploration & Operation (E&P) Market by Operation, 2022-2032 (USD Bn, AGR (%))
Figure 86. Gulf of Mexico Deepwater & Ultra Deepwater Exploration & Operation (E&P) Market by Operation, 2022-2032 (USD Bn, AGR (%)) (V-Shaped Recovery)
Figure 87. Gulf of Mexico Deepwater & Ultra Deepwater Exploration & Operation (E&P) Market by Operation, 2022-2032 (USD Bn, AGR (%)) (W-Shaped Recovery)
Figure 88. Gulf of Mexico Deepwater & Ultra Deepwater Exploration & Operation (E&P) Market by Operation, 2022-2032 (USD Bn, AGR (%)) (U-Shaped Recovery)
Figure 89. Gulf of Mexico Deepwater & Ultra Deepwater Exploration & Operation (E&P) Market by Operation, 2022-2032 (USD Bn, AGR (%)) (L-Shaped Recovery)
Figure 90. West African Deepwater & Ultra Deepwater Exploration & Operation (E&P) Market by Value, 2022-2032 (USD Bn, AGR (%))
Figure 91. West African Deepwater & Ultra Deepwater Exploration & Operation (E&P) Market by Value, 2022-2032 (USD Bn, AGR (%)) (V-Shaped Recovery)
Figure 92. West African Deepwater & Ultra Deepwater Exploration & Operation (E&P) Market by Value, 2022-2032 (USD Bn, AGR (%)) (W-Shaped Recovery)
Figure 93. West African Deepwater & Ultra Deepwater Exploration & Operation (E&P) Market by Value, 2022-2032 (USD Bn, AGR (%)) (U-Shaped Recovery)
Figure 94. West African Deepwater & Ultra Deepwater Exploration & Operation (E&P) Market by Value, 2022-2032 (USD Bn, AGR (%)) (L-Shaped Recovery)
Figure 95. West African Deepwater & Ultra Deepwater Exploration & Operation (E&P) Market by Project, 2022-2032 (USD Bn, AGR (%))
Figure 96. West African Deepwater & Ultra Deepwater Exploration & Operation (E&P) Market by Project, 2022-2032 (USD Bn, AGR (%)) (V-Shaped Recovery)
Figure 97. West African Deepwater & Ultra Deepwater Exploration & Operation (E&P) Market by Project, 2022-2032 (USD Bn, AGR (%)) (W-Shaped Recovery)
Figure 98. West African Deepwater & Ultra Deepwater Exploration & Operation (E&P) Market by Project, 2022-2032 (USD Bn, AGR (%)) (U-Shaped Recovery)
Figure 99. West African Deepwater & Ultra Deepwater Exploration & Operation (E&P) Market by Project, 2022-2032 (USD Bn, AGR (%)) (L-Shaped Recovery)
Figure 100. West African Deepwater & Ultra Deepwater Exploration & Operation (E&P) Market by Water Depth, 2022-2032 (USD Bn, AGR (%))
Figure 101. West African Deepwater & Ultra Deepwater Exploration & Operation (E&P) Market by Water Depth, 2022-2032 (USD Bn, AGR (%)) (V-Shaped Recovery)
Figure 102. West African Deepwater & Ultra Deepwater Exploration & Operation (E&P) Market by Water Depth, 2022-2032 (USD Bn, AGR (%)) (W-Shaped Recovery)
Figure 103. West African Deepwater & Ultra Deepwater Exploration & Operation (E&P) Market by Water Depth, 2022-2032 (USD Bn, AGR (%)) (U-Shaped Recovery)
Figure 104. West African Deepwater & Ultra Deepwater Exploration & Operation (E&P) Market by Water Depth, 2022-2032 (USD Bn, AGR (%)) (L-Shaped Recovery)
Figure 105. West African Deepwater & Ultra Deepwater Exploration & Operation (E&P) Market by Type, 2022-2032 (USD Bn, AGR (%))
Figure 106. West African Deepwater & Ultra Deepwater Exploration & Operation (E&P) Market by Type, 2022-2032 (USD Bn, AGR (%)) (V-Shaped Recovery)
Figure 107. West African Deepwater & Ultra Deepwater Exploration & Operation (E&P) Market by Type, 2022-2032 (USD Bn, AGR (%)) (W-Shaped Recovery)
Figure 108. West African Deepwater & Ultra Deepwater Exploration & Operation (E&P) Market by Type, 2022-2032 (USD Bn, AGR (%)) (U-Shaped Recovery)
Figure 109. West African Deepwater & Ultra Deepwater Exploration & Operation (E&P) Market by Type, 2022-2032 (USD Bn, AGR (%)) (L-Shaped Recovery)
Figure 110. West African Deepwater & Ultra Deepwater Exploration & Operation (E&P) Market by Operation, 2022-2032 (USD Bn, AGR (%))
Figure 111. West African Deepwater & Ultra Deepwater Exploration & Operation (E&P) Market by Operation, 2022-2032 (USD Bn, AGR (%)) (V-Shaped Recovery)
Figure 112. West African Deepwater & Ultra Deepwater Exploration & Operation (E&P) Market by Operation, 2022-2032 (USD Bn, AGR (%)) (W-Shaped Recovery)
Figure 113. West African Deepwater & Ultra Deepwater Exploration & Operation (E&P) Market by Operation, 2022-2032 (USD Bn, AGR (%)) (U-Shaped Recovery)
Figure 114. West African Deepwater & Ultra Deepwater Exploration & Operation (E&P) Market by Operation, 2022-2032 (USD Bn, AGR (%)) (L-Shaped Recovery)
Figure 115. East African Deepwater & Ultra Deepwater Exploration & Operation (E&P) Market by Value, 2022-2032 (USD Bn, AGR (%))
Figure 116. East African Deepwater & Ultra Deepwater Exploration & Operation (E&P) Market by Value, 2022-2032 (USD Bn, AGR (%)) (V-Shaped Recovery)
Figure 117. East African Deepwater & Ultra Deepwater Exploration & Operation (E&P) Market by Value, 2022-2032 (USD Bn, AGR (%)) (W-Shaped Recovery)
Figure 118. East African Deepwater & Ultra Deepwater Exploration & Operation (E&P) Market by Value, 2022-2032 (USD Bn, AGR (%)) (U-Shaped Recovery)
Figure 119. East African Deepwater & Ultra Deepwater Exploration & Operation (E&P) Market by Value, 2022-2032 (USD Bn, AGR (%)) (L-Shaped Recovery)
Figure 120. East African Deepwater & Ultra Deepwater Exploration & Operation (E&P) Market by Project, 2022-2032 (USD Bn, AGR (%))
Figure 121. East African Deepwater & Ultra Deepwater Exploration & Operation (E&P) Market by Project, 2022-2032 (USD Bn, AGR (%)) (V-Shaped Recovery)
Figure 122. East African Deepwater & Ultra Deepwater Exploration & Operation (E&P) Market by Project, 2022-2032 (USD Bn, AGR (%)) (W-Shaped Recovery)
Figure 123. East African Deepwater & Ultra Deepwater Exploration & Operation (E&P) Market by Project, 2022-2032 (USD Bn, AGR (%)) (U-Shaped Recovery)
Figure 124. East African Deepwater & Ultra Deepwater Exploration & Operation (E&P) Market by Project, 2022-2032 (USD Bn, AGR (%)) (L-Shaped Recovery)
Figure 125. East African Deepwater & Ultra Deepwater Exploration & Operation (E&P) Market by Water Depth, 2022-2032 (USD Bn, AGR (%))
Figure 126. East African Deepwater & Ultra Deepwater Exploration & Operation (E&P) Market by Water Depth, 2022-2032 (USD Bn, AGR (%)) (V-Shaped Recovery)
Figure 127. East African Deepwater & Ultra Deepwater Exploration & Operation (E&P) Market by Water Depth, 2022-2032 (USD Bn, AGR (%)) (W-Shaped Recovery)
Figure 128. East African Deepwater & Ultra Deepwater Exploration & Operation (E&P) Market by Water Depth, 2022-2032 (USD Bn, AGR (%)) (U-Shaped Recovery)
Figure 129. East African Deepwater & Ultra Deepwater Exploration & Operation (E&P) Market by Water Depth, 2022-2032 (USD Bn, AGR (%)) (L-Shaped Recovery)
Figure 130. East African Deepwater & Ultra Deepwater Exploration & Operation (E&P) Market by Type, 2022-2032 (USD Bn, AGR (%))
Figure 131. East African Deepwater & Ultra Deepwater Exploration & Operation (E&P) Market by Type, 2022-2032 (USD Bn, AGR (%)) (V-Shaped Recovery)
Figure 132. East African Deepwater & Ultra Deepwater Exploration & Operation (E&P) Market by Type, 2022-2032 (USD Bn, AGR (%)) (W-Shaped Recovery)
Figure 133. East African Deepwater & Ultra Deepwater Exploration & Operation (E&P) Market by Type, 2022-2032 (USD Bn, AGR (%)) (U-Shaped Recovery)
Figure 134. East African Deepwater & Ultra Deepwater Exploration & Operation (E&P) Market by Type, 2022-2032 (USD Bn, AGR (%)) (L-Shaped Recovery)
Figure 135. East African Deepwater & Ultra Deepwater Exploration & Operation (E&P) Market by Operation, 2022-2032 (USD Bn, AGR (%))
Figure 136. East African Deepwater & Ultra Deepwater Exploration & Operation (E&P) Market by Operation, 2022-2032 (USD Bn, AGR (%)) (V-Shaped Recovery)
Figure 137. East African Deepwater & Ultra Deepwater Exploration & Operation (E&P) Market by Operation, 2022-2032 (USD Bn, AGR (%)) (W-Shaped Recovery)
Figure 138. East African Deepwater & Ultra Deepwater Exploration & Operation (E&P) Market by Operation, 2022-2032 (USD Bn, AGR (%)) (U-Shaped Recovery)
Figure 139. East African Deepwater & Ultra Deepwater Exploration & Operation (E&P) Market by Operation, 2022-2032 (USD Bn, AGR (%)) (L-Shaped Recovery)
Figure 140. Asia-Pacific Deepwater & Ultra Deepwater Exploration & Operation (E&P) Market by Value, 2022-2032 (USD Bn, AGR (%))
Figure 141. Asia-Pacific Deepwater & Ultra Deepwater Exploration & Operation (E&P) Market by Value, 2022-2032 (USD Bn, AGR (%)) (V-Shaped Recovery)
Figure 142. Asia-Pacific Deepwater & Ultra Deepwater Exploration & Operation (E&P) Market by Value, 2022-2032 (USD Bn, AGR (%)) (W-Shaped Recovery)
Figure 143. Asia-Pacific Deepwater & Ultra Deepwater Exploration & Operation (E&P) Market by Value, 2022-2032 (USD Bn, AGR (%)) (U-Shaped Recovery)
Figure 144. Asia-Pacific Deepwater & Ultra Deepwater Exploration & Operation (E&P) Market by Value, 2022-2032 (USD Bn, AGR (%)) (L-Shaped Recovery)
Figure 145. Asia-Pacific Deepwater & Ultra Deepwater Exploration & Operation (E&P) Market by Project, 2022-2032 (USD Bn, AGR (%))
Figure 146. Asia-Pacific Deepwater & Ultra Deepwater Exploration & Operation (E&P) Market by Project, 2022-2032 (USD Bn, AGR (%)) (V-Shaped Recovery)
Figure 147. Asia-Pacific Deepwater & Ultra Deepwater Exploration & Operation (E&P) Market by Project, 2022-2032 (USD Bn, AGR (%)) (W-Shaped Recovery)
Figure 148. Asia-Pacific Deepwater & Ultra Deepwater Exploration & Operation (E&P) Market by Project, 2022-2032 (USD Bn, AGR (%)) (U-Shaped Recovery)
Figure 149. Asia-Pacific Deepwater & Ultra Deepwater Exploration & Operation (E&P) Market by Project, 2022-2032 (USD Bn, AGR (%)) (L-Shaped Recovery)
Figure 150. Asia-Pacific Deepwater & Ultra Deepwater Exploration & Operation (E&P) Market by Water Depth, 2022-2032 (USD Bn, AGR (%))
Figure 151. Asia-Pacific Deepwater & Ultra Deepwater Exploration & Operation (E&P) Market by Water Depth, 2022-2032 (USD Bn, AGR (%)) (V-Shaped Recovery)
Figure 152. Asia-Pacific Deepwater & Ultra Deepwater Exploration & Operation (E&P) Market by Water Depth, 2022-2032 (USD Bn, AGR (%)) (W-Shaped Recovery)
Figure 153. Asia-Pacific Deepwater & Ultra Deepwater Exploration & Operation (E&P) Market by Water Depth, 2022-2032 (USD Bn, AGR (%)) (U-Shaped Recovery)
Figure 154. Asia-Pacific Deepwater & Ultra Deepwater Exploration & Operation (E&P) Market by Water Depth, 2022-2032 (USD Bn, AGR (%)) (L-Shaped Recovery)
Figure 155. Asia-Pacific Deepwater & Ultra Deepwater Exploration & Operation (E&P) Market by Type, 2022-2032 (USD Bn, AGR (%))
Figure 156. Asia-Pacific Deepwater & Ultra Deepwater Exploration & Operation (E&P) Market by Type, 2022-2032 (USD Bn, AGR (%)) (V-Shaped Recovery)
Figure 157. Asia-Pacific Deepwater & Ultra Deepwater Exploration & Operation (E&P) Market by Type, 2022-2032 (USD Bn, AGR (%)) (W-Shaped Recovery)
Figure 158. Asia-Pacific Deepwater & Ultra Deepwater Exploration & Operation (E&P) Market by Type, 2022-2032 (USD Bn, AGR (%)) (U-Shaped Recovery)
Figure 159. Asia-Pacific Deepwater & Ultra Deepwater Exploration & Operation (E&P) Market by Type, 2022-2032 (USD Bn, AGR (%)) (L-Shaped Recovery)
Figure 160. Asia-Pacific Deepwater & Ultra Deepwater Exploration & Operation (E&P) Market by Operation, 2022-2032 (USD Bn, AGR (%))
Figure 161. Asia-Pacific Deepwater & Ultra Deepwater Exploration & Operation (E&P) Market by Operation, 2022-2032 (USD Bn, AGR (%)) (V-Shaped Recovery)
Figure 162. Asia-Pacific Deepwater & Ultra Deepwater Exploration & Operation (E&P) Market by Operation, 2022-2032 (USD Bn, AGR (%)) (W-Shaped Recovery)
Figure 163. Asia-Pacific Deepwater & Ultra Deepwater Exploration & Operation (E&P) Market by Operation, 2022-2032 (USD Bn, AGR (%)) (U-Shaped Recovery)
Figure 164. Asia-Pacific Deepwater & Ultra Deepwater Exploration & Operation (E&P) Market by Operation, 2022-2032 (USD Bn, AGR (%)) (L-Shaped Recovery)
Figure 165. European Deepwater & Ultra Deepwater Exploration & Operation (E&P) Market by Value, 2022-2032 (USD Bn, AGR (%))
Figure 166. European Deepwater & Ultra Deepwater Exploration & Operation (E&P) Market by Value, 2022-2032 (USD Bn, AGR (%)) (V-Shaped Recovery)
Figure 167. European Deepwater & Ultra Deepwater Exploration & Operation (E&P) Market by Value, 2022-2032 (USD Bn, AGR (%)) (W-Shaped Recovery)
Figure 168. European Deepwater & Ultra Deepwater Exploration & Operation (E&P) Market by Value, 2022-2032 (USD Bn, AGR (%)) (U-Shaped Recovery)
Figure 169. European Deepwater & Ultra Deepwater Exploration & Operation (E&P) Market by Value, 2022-2032 (USD Bn, AGR (%)) (L-Shaped Recovery)
Figure 170. European Deepwater & Ultra Deepwater Exploration & Operation (E&P) Market by Project, 2022-2032 (USD Bn, AGR (%))
Figure 171. European Deepwater & Ultra Deepwater Exploration & Operation (E&P) Market by Project, 2022-2032 (USD Bn, AGR (%)) (V-Shaped Recovery)
Figure 172. European Deepwater & Ultra Deepwater Exploration & Operation (E&P) Market by Project, 2022-2032 (USD Bn, AGR (%)) (W-Shaped Recovery)
Figure 173. European Deepwater & Ultra Deepwater Exploration & Operation (E&P) Market by Project, 2022-2032 (USD Bn, AGR (%)) (U-Shaped Recovery)
Figure 174. European Deepwater & Ultra Deepwater Exploration & Operation (E&P) Market by Project, 2022-2032 (USD Bn, AGR (%)) (L-Shaped Recovery)
Figure 175. European Deepwater & Ultra Deepwater Exploration & Operation (E&P) Market by Water Depth, 2022-2032 (USD Bn, AGR (%))
Figure 176. European Deepwater & Ultra Deepwater Exploration & Operation (E&P) Market by Water Depth, 2022-2032 (USD Bn, AGR (%)) (V-Shaped Recovery)
Figure 177. European Deepwater & Ultra Deepwater Exploration & Operation (E&P) Market by Water Depth, 2022-2032 (USD Bn, AGR (%)) (W-Shaped Recovery)
Figure 178. European Deepwater & Ultra Deepwater Exploration & Operation (E&P) Market by Water Depth, 2022-2032 (USD Bn, AGR (%)) (U-Shaped Recovery)
Figure 179. European Deepwater & Ultra Deepwater Exploration & Operation (E&P) Market by Water Depth, 2022-2032 (USD Bn, AGR (%)) (L-Shaped Recovery)
Figure 180. European Deepwater & Ultra Deepwater Exploration & Operation (E&P) Market by Type, 2022-2032 (USD Bn, AGR (%))
Figure 181. European Deepwater & Ultra Deepwater Exploration & Operation (E&P) Market by Type, 2022-2032 (USD Bn, AGR (%)) (V-Shaped Recovery)
Figure 182. European Deepwater & Ultra Deepwater Exploration & Operation (E&P) Market by Type, 2022-2032 (USD Bn, AGR (%)) (W-Shaped Recovery)
Figure 183. European Deepwater & Ultra Deepwater Exploration & Operation (E&P) Market by Type, 2022-2032 (USD Bn, AGR (%)) (U-Shaped Recovery)
Figure 184. European Deepwater & Ultra Deepwater Exploration & Operation (E&P) Market by Type, 2022-2032 (USD Bn, AGR (%)) (L-Shaped Recovery)
Figure 185. European Deepwater & Ultra Deepwater Exploration & Operation (E&P) Market by Operation, 2022-2032 (USD Bn, AGR (%))
Figure 186. European Deepwater & Ultra Deepwater Exploration & Operation (E&P) Market by Operation, 2022-2032 (USD Bn, AGR (%)) (V-Shaped Recovery)
Figure 187. European Deepwater & Ultra Deepwater Exploration & Operation (E&P) Market by Operation, 2022-2032 (USD Bn, AGR (%)) (W-Shaped Recovery)
Figure 188. European Deepwater & Ultra Deepwater Exploration & Operation (E&P) Market by Operation, 2022-2032 (USD Bn, AGR (%)) (U-Shaped Recovery)
Figure 189. European Deepwater & Ultra Deepwater Exploration & Operation (E&P) Market by Operation, 2022-2032 (USD Bn, AGR (%)) (L-Shaped Recovery)
Figure 190. Rest of the World Deepwater & Ultra Deepwater Exploration & Operation (E&P) Market by Value, 2022-2032 (USD Bn, AGR (%))
Figure 191. Rest of the World Deepwater & Ultra Deepwater Exploration & Operation (E&P) Market by Value, 2022-2032 (USD Bn, AGR (%)) (V-Shaped Recovery)
Figure 192. Rest of the World Deepwater & Ultra Deepwater Exploration & Operation (E&P) Market by Value, 2022-2032 (USD Bn, AGR (%)) (W-Shaped Recovery)
Figure 193. Rest of the World Deepwater & Ultra Deepwater Exploration & Operation (E&P) Market by Value, 2022-2032 (USD Bn, AGR (%)) (U-Shaped Recovery)
Figure 194. Rest of the World Deepwater & Ultra Deepwater Exploration & Operation (E&P) Market by Value, 2022-2032 (USD Bn, AGR (%)) (L-Shaped Recovery)
Figure 195. Rest of the World Deepwater & Ultra Deepwater Exploration & Operation (E&P) Market by Project, 2022-2032 (USD Bn, AGR (%))
Figure 196. Rest of the World Deepwater & Ultra Deepwater Exploration & Operation (E&P) Market by Project, 2022-2032 (USD Bn, AGR (%)) (V-Shaped Recovery)
Figure 197. Rest of the World Deepwater & Ultra Deepwater Exploration & Operation (E&P) Market by Project, 2022-2032 (USD Bn, AGR (%)) (W-Shaped Recovery)
Figure 198. Rest of the World Deepwater & Ultra Deepwater Exploration & Operation (E&P) Market by Project, 2022-2032 (USD Bn, AGR (%)) (U-Shaped Recovery)
Figure 199. Rest of the World Deepwater & Ultra Deepwater Exploration & Operation (E&P) Market by Project, 2022-2032 (USD Bn, AGR (%)) (L-Shaped Recovery)
Figure 200. Rest of the World Deepwater & Ultra Deepwater Exploration & Operation (E&P) Market by Water Depth, 2022-2032 (USD Bn, AGR (%))
Figure 201. Rest of the World Deepwater & Ultra Deepwater Exploration & Operation (E&P) Market by Water Depth, 2022-2032 (USD Bn, AGR (%)) (V-Shaped Recovery)
Figure 202. Rest of the World Deepwater & Ultra Deepwater Exploration & Operation (E&P) Market by Water Depth, 2022-2032 (USD Bn, AGR (%)) (W-Shaped Recovery)
Figure 203. Rest of the World Deepwater & Ultra Deepwater Exploration & Operation (E&P) Market by Water Depth, 2022-2032 (USD Bn, AGR (%)) (U-Shaped Recovery)
Figure 204. Rest of the World Deepwater & Ultra Deepwater Exploration & Operation (E&P) Market by Water Depth, 2022-2032 (USD Bn, AGR (%)) (L-Shaped Recovery)
Figure 205. Rest of the World Deepwater & Ultra Deepwater Exploration & Operation (E&P) Market by Type, 2022-2032 (USD Bn, AGR (%))
Figure 206. Rest of the World Deepwater & Ultra Deepwater Exploration & Operation (E&P) Market by Type, 2022-2032 (USD Bn, AGR (%)) (V-Shaped Recovery)
Figure 207. Rest of the World Deepwater & Ultra Deepwater Exploration & Operation (E&P) Market by Type, 2022-2032 (USD Bn, AGR (%)) (W-Shaped Recovery)
Figure 208. Rest of the World Deepwater & Ultra Deepwater Exploration & Operation (E&P) Market by Type, 2022-2032 (USD Bn, AGR (%)) (U-Shaped Recovery)
Figure 209. Rest of the World Deepwater & Ultra Deepwater Exploration & Operation (E&P) Market by Type, 2022-2032 (USD Bn, AGR (%)) (L-Shaped Recovery)
Figure 210. Rest of the World Deepwater & Ultra Deepwater Exploration & Operation (E&P) Market by Operation, 2022-2032 (USD Bn, AGR (%))
Figure 211. Rest of the World Deepwater & Ultra Deepwater Exploration & Operation (E&P) Market by Operation, 2022-2032 (USD Bn, AGR (%)) (V-Shaped Recovery)
Figure 212. Rest of the World Deepwater & Ultra Deepwater Exploration & Operation (E&P) Market by Operation, 2022-2032 (USD Bn, AGR (%)) (W-Shaped Recovery)
Figure 213. Rest of the World Deepwater & Ultra Deepwater Exploration & Operation (E&P) Market by Operation, 2022-2032 (USD Bn, AGR (%)) (U-Shaped Recovery)
Figure 214. Rest of the World Deepwater & Ultra Deepwater Exploration & Operation (E&P) Market by Operation, 2022-2032 (USD Bn, AGR (%)) (L-Shaped Recovery)
Figure 215. Transocean Ltd.: Company Revenue 2016-2020 (US$Mn, AGR %)
Figure 216. Transocean Ltd.: Company Operating Income 2016-2020 (US$Mn, AGR %)
Figure 217. Transocean Ltd.: Company Net Income 2016-2020 (US$Mn, AGR %)
Figure 218. Transocean Ltd.: Company EBITDA 2016-2020 (US$Mn, AGR %)
Figure 219. Seadrill Limited: Company Revenue 2016-2020 (US$Mn, AGR %)
Figure 220. Seadrill Limited: Company Operating Income 2016-2020 (US$Mn, AGR %)
Figure 221. Seadrill Limited: Company Net Income 2016-2020 (US$Mn, AGR %)
Figure 222. Seadrill Limited: Company EBITDA 2016-2020 (US$Mn, AGR %)
Figure 223. Noble Corporation: Company Revenue 2016-2020 (US$Mn, AGR %)
Figure 224. Noble Corporation: Company Operating Income 2016-2020 (US$Mn, AGR %)
Figure 225. Noble Corporation: Company Net Income 2016-2020 (US$Mn, AGR %)
Figure 226. Noble Corporation: Company EBITDA 2016-2020 (US$Mn, AGR %)
Figure 227. Valaris Plc: Company Revenue 2016-2020 (US$Mn, AGR %)
Figure 228. Valaris Plc: Company Operating Income 2016-2020 (US$Mn, AGR %)
Figure 229. Valaris Plc: Company Net Income 2016-2020 (US$Mn, AGR %)
Figure 230. Valaris Plc: Company EBITDA 2016-2020 (US$Mn, AGR %)
Figure 231. Saipem SpA: Company Revenue 2016-2020 (US$Mn, AGR %)
Figure 232. Saipem SpA: Company Operating Income 2016-2020 (US$Mn, AGR %)
Figure 233. Saipem SpA: Company Net Income 2016-2020 (US$Mn, AGR %)
Figure 234. Saipem SpA: Company EBITDA 2016-2020 (US$Mn, AGR %)
Figure 235. Sapura Energy Berhad: Company Revenue 2017-2021 (US$Mn, AGR %)
Figure 236. Sapura Energy Berhad: Company Operating Income 2017-2021 (US$Mn, AGR %)
Figure 237. Sapura Energy Berhad: Company Net Income 2017-2021 (US$Mn, AGR %)
Figure 238. Sapura Energy Berhad: Company EBITDA 2017-2021 (US$Mn, AGR %)
Figure 239. Nabors Industries: Company Revenue 2016-2020 (US$Mn, AGR %)
Figure 240. Nabors Industries: Company Operating Income 2016-2020 (US$Mn, AGR %)
Figure 241. Nabors Industries: Company Net Income 2016-2020 (US$Mn, AGR %)
Figure 242. Nabors Industries: Company EBITDA 2016-2020 (US$Mn, AGR %)
Figure 243. Maersk Drilling: Company Revenue 2016-2020 (US$Mn, AGR %)
Figure 244. Maersk Drilling: Company Operating Income 2016-2020 (US$Mn, AGR %)
Figure 245. Maersk Drilling: Company Net Income 2016-2020 (US$Mn, AGR %)
Figure 246. Maersk Drilling: Company EBITDA 2016-2020 (US$Mn, AGR %)
Figure 247. Shelf Drilling Ltd: Company Revenue 2016-2020 (US$Mn, AGR %)
Figure 248. Shelf Drilling Ltd: Company Operating Income 2016-2020 (US$Mn, AGR %)
Figure 249. Shelf Drilling Ltd: Company Net Income 2016-2020 (US$Mn, AGR %)
Figure 250. Shelf Drilling Ltd: Company EBITDA 2016-2020 (US$Mn, AGR %)
Figure 251. Aker Solutions: Company Revenue 2016-2020 (US$Mn, AGR %)
Figure 252. Aker Solutions: Company Operating Income 2016-2020 (US$Mn, AGR %)
Figure 253. Aker Solutions: Company Net Income 2016-2020 (US$Mn, AGR %)
Figure 254. Aker Solutions: Company EBITDA 2016-2020 (US$Mn, AGR %)
Figure 255. CGG: Company Revenue 2016-2020 (US$Mn, AGR %)
Figure 256. CGG: Company Operating Income 2016-2020 (US$Mn, AGR %)
Figure 257. CGG: Company Net Income 2016-2020 (US$Mn, AGR %)
Figure 258. CGG: Company EBITDA 2016-2020 (US$Mn, AGR %)
Figure 259. MODEC: Company Revenue 2016-2020 (US$Mn, AGR %)
Figure 260. MODEC: Company Operating Income 2016-2020 (US$Mn, AGR %)
Figure 261. MODEC: Company Net Income 2016-2020 (US$Mn, AGR %)
Figure 262. MODEC: Company EBITDA 2016-2020 (US$Mn, AGR %)
Figure 263. PGS: Company Revenue 2016-2020 (US$Mn, AGR %)
Figure 264. PGS: Company Operating Income 2016-2020 (US$Mn, AGR %)
Figure 265. PGS: Company Net Income 2016-2020 (US$Mn, AGR %)
Figure 266. PGS: Company EBITDA 2016-2020 (US$Mn, AGR %)
Figure 267. SBM Offshore: Company Revenue 2016-2020 (US$Mn, AGR %)
Figure 268. SBM Offshore: Company Operating Income 2016-2020 (US$Mn, AGR %)
Figure 269. SBM Offshore: Company Net Income 2016-2020 (US$Mn, AGR %)
Figure 270. SBM Offshore: Company EBITDA 2016-2020 (US$Mn, AGR %)
Figure 271. The Royal Dutch Shell: Company Revenue 2016-2020 (US$Mn, AGR %)
Figure 272. The Royal Dutch Shell: Company Operating Income 2016-2020 (US$Mn, AGR %)
Figure 273. The Royal Dutch Shell: Company Net Income 2016-2020 (US$Mn, AGR %)
Figure 274. The Royal Dutch Shell: Company EBITDA 2016-2020 (US$Mn, AGR %)
Figure 275. Subsea 7: Company Revenue 2016-2020 (US$Mn, AGR %)
Figure 276. Subsea 7: Company Operating Income 2016-2020 (US$Mn, AGR %)
Figure 277. Subsea 7: Company Net Income 2016-2020 (US$Mn, AGR %)
Figure 278. Subsea 7: Company EBITDA 2016-2020 (US$Mn, AGR %)
Figure 279. China National Offshore Oil Corporation: Company Revenue 2016-2020 (US$Mn, AGR %)
Figure 280. China National Offshore Oil Corporation: Company Operating Income 2016-2020 (US$Mn, AGR %)
Figure 281. China National Offshore Oil Corporation: Company Net Income 2016-2020 (US$Mn, AGR %)
Figure 282. China National Offshore Oil Corporation: Company EBITDA 2016-2020 (US$Mn, AGR %)
Figure 283. Seabird Exploration: Company Revenue 2016-2020 (US$Mn, AGR %)
Figure 284. Seabird Exploration: Company Operating Income 2016-2020 (US$Mn, AGR %)
Figure 285. Seabird Exploration: Company Net Income 2016-2020 (US$Mn, AGR %)
Figure 286. Seabird Exploration: Company EBITDA 2016-2020 (US$Mn, AGR %)
Figure 287. Petrobras: Company Revenue 2016-2020 (US$Mn, AGR %)
Figure 288. Petrobras: Company Operating Income 2016-2020 (US$Mn, AGR %)
Figure 289. Petrobras: Company Net Income 2016-2020 (US$Mn, AGR %)
Figure 290. Petrobras: Company EBITDA 2016-2020 (US$Mn, AGR %)
Figure 291. Petronas: Company Revenue 2016-2020 (US$Mn, AGR %)
Figure 292. Petronas: Company Operating Income 2016-2020 (US$Mn, AGR %)
Figure 293. Petronas: Company Net Income 2016-2020 (US$Mn, AGR %)
Figure 294. Petronas: Company EBITDA 2016-2020 (US$Mn, AGR %)
Figure 295. Global Deepwater & Ultra Deepwater Exploration & Production (E&P) Market Share Forecast by Region 2022, 2027, 2032(%)
Aker Solutions ASA
CGG SA (CGG)
China National Offshore Oil Corporation
Maersk Drilling A/S
MODEC, INC.
Nabors Industries Ltd.
Noble Corporation
Petroleo Brasileiro S.A
Petronas Gas Berhad (PGB)
PGS ASA
Saipem SpA
Sapura Energy Berhad
SBM Offshore NV
SeaBird Exploration PLC
Seadrill Limited
Shelf Drilling Ltd
Subsea 7 S.A.
The Royal Dutch Shell plc
Transocean Ltd.
Valaris Ltd
List of Other Companies Mentioned in the report
A/S Norske Shell
ADX Energy Ltd.
African Petroleum Corp.
AGM Petroleum Ghana Limited
Aker Solutions
Anadarko
Apache Corp
ATP Oil & Gas
Atwood Oceanics
Aveon Offshore Ltd
BG Group
BHP Billiton
Bluewater Energy Services B.W
BP
BP Angola
Burullus Gas Company
BW Offshore
Cairn Energy
Cairn India Limited
Cameron
Cardon IV
Centrica Energi NVF
Centrica North Sea Gas Ltd
CGG
Chevron
China National Offshore Oil Corporation (CNOOC)
China Oilfield Services Ltd.
CNPC
Coastal Energy
Cobalt International Energy
ConocoPhilips
COSCO
Daewoo Shipbuilding & Marine Engineering (DSME)
Delek
Det norske oljeselskap ASA
Diamond Offshore
DNO International
Dolphin Geophysical AS
Dolphin Offshore Drilling Ltd.
Doris Engineering
Drill-Quip Inc.
Ecopetrol
Ecovix
Elf Exploration UK Ltd
EMAS AMC
Encana Corporation
Eni
Eni Norge A/S
Ensco plc
Esaleiro Atlântico Sul
Esso Exploration and Production Nigeria
Estaleiro Enseada do Paraguaçu
Estaleiro Jurong Aracruz
Estaleiro Rio Grande
Etesco
Excelerate Energy
Exmar
Expro Group
ExxonMobil
ExxonMobil Canada
Flensburger
FMC Technologies
Fred Olsen
Gazprom
GDF Suez
General Electric (GE)
GETECH
GNPC
Hess Corporation
Hoegh
Husky
Idemitsu
INPEX
Isramco
JDR
JGC
KBR
Keppel Corporation
Keppel FELS
Kosmos Energy Ltd.
KPOC
LLOG Exploration
Lukoil
Lundin Petroleum
Maersk Drilling
Maersk Drilling
Maersk FPSO
Maersk Oil
Marathon Oil
Marubeni
McDermott
Mendes Júnior
Mobil Producing Nigeria Unlimited
MODEC
Murphy Oil
Newfield Exploration
Nexans
Nexen Petroleum
Nigerian Gas Company Limited (NGC)
Nigerian National Petroleum Corporation (NNPC)
Niko Resources
Noble Corporation
Noble Energy
Ocean Installer
Ocean Rig UDW Inc.
Oceaneering
Odebrecht Oil & Gas
Odfjell Drilling
OGX
OMV Petroleum
OneSubsea
ONGC
Ophir Energy
Otto Energy
Pacific Drilling
Pacific Rubiales
PEMEX
Petro-Canada
Petrobras
Petrofac
Petroleum Geo-Services (PGS)
Petronas
Petroserv S.A.
Plains Exploration& Production
Polarcus Ltd
Prosafe SE
Providence Resources
QGOG
Queiroz Galvao Oleo e Gas S.A.
Reliance Industries
Repsol
Rig Management Norway
Rocksource
RWE DEA AG
Saipem
Salamander Energy
Samsung Heavy Industries (SHI)
Santos
SBM Offshore
Schahin S.A.
Schlumberger
Seabird Exploration
Seadrill
Sete Brasil S.A.
Sevan Drilling ASA
Shell
Shell Brunei
Sinopec
Songa Offshore AS
Sovcomflot
Spectrum
Spike
Statoil
Statsolie
Stena Drilling
Stone Energy
Subsea 7
Suncor
Talisman Sinopec Energy UK
TAQA Bratani
Technip
Teekay
TGS
Total SA
Transocean
Tullow Oil
Valiant Petroleum
Vanco Energy Company
VNG
WesternGeco
Wintershall Holding GmbH
Woodside
Yinka Folawiyo Petroleum
List of Associations Mentioned in the Report
Brazilian National Oil, Natural Gas and Biofuel Agency
Bureau of Ocean Energy Management (BOEM)
Bureau of Safety and Environmental Enforcement (BSEE)
Myanmar Ministry of Energy
Nigerian Ministry of Petroleum
Norway’s Ministry of Petroleum and Energy
Norwegian Ministry of Petroleum & Energy
Norwegian Oil and Gas Association
OPEC
Resources for the Future (RFF)
University of Leeds
US Energy Information Agency
Download sample pages
Complete the form below to download your free sample pages for Deepwater & Ultra Deepwater Exploration & Production (E&P) Market Report 2022-2032Related reports
-
Thermal Enhanced Oil Recovery (EOR) Market Report 2023-2033
The Thermal Enhanced Oil Recovery (EOR) market is projected to grow at a CAGR of 5.2% by 2033....Full DetailsPublished: 23 November 2022 -
Industrial Storage Tank Market Report 2021-2031
In many key markets, the fundamental principles for LNG growth – such as falling domestic supply and increased need for...Full DetailsPublished: 26 October 2021 -
Non-Destructive Testing (NDT) Market Report 2021-2031
India, China, Malaysia, and Brazil are all building new bridges, dams, railroads, power plants, and refineries as part of their...Full DetailsPublished: 14 October 2021 -
Chemical Enhanced Oil Recovery (EOR) Market Report 2021-2031
The growing success of chemical EOR techniques that have been proven through field/pilot testing is expected to increase investment in...Full DetailsPublished: 03 December 2021 -
Marine Engine Monitoring System Market Report 2020-2030
The 145 page report provides clear, detailed insight into the global Marine Engine Monitoring System market. Discover the key drivers...
Full DetailsPublished: 01 January 1970 -
Carbon Dioxide (CO2) Enhanced Oil Recovery (EOR) Market Report 2022-2032
The global CO2 enhanced oil recovery market was valued at US$3,735 million in 2021 and is projected to grow at...Full DetailsPublished: 25 July 2022 -
Integrated Marine Automation System Market Report 2020-2030
The 170 page report provides clear, detailed insight into the global Integrated Marine Automation System market. Discover the key drivers...
Full DetailsPublished: 01 January 1970 -
Land Drill Rigs Market Report 2023-2033
The global Land Drill Rigs market is projected to grow at a CAGR of 5.5% by 2033...Full DetailsPublished: 13 October 2023 -
Oil & Gas Drill Bit Market Report 2021-2031
The demand for drill bit is expected to grow on account of the increasing oil & gas exploration and drilling...Full DetailsPublished: 27 October 2021 -
Proppants Market Report 2022-2032
The combination of the Coronavirus (COVID-19) and the oil price shock is particularly damaging to oil-exporting developing countries at a...Full DetailsPublished: 06 January 2022
Download sample pages
Complete the form below to download your free sample pages for Deepwater & Ultra Deepwater Exploration & Production (E&P) Market Report 2022-2032Do you have any custom requirements we can help you with?
Any specific country, geo region, market segment or specific company information?
Email us today, we can discuss your needs and see how we can help: jamie.roberts@visiongain.com
Would you like a free report overview of the report of your choice?
If so, please drop an email to Jamie Roberts stating your chosen report title to jamie.roberts@visiongain.com
Visiongain energy reports are compiled using a broad and rich mixture of both primary and secondary information to produce an overall industry outlook. In order to provide our clients with the best product possible product, we do not rely on any one single source of information. Visiongain analysts reach out to market-leading vendors and industry experts where possible but also review a wealth of financial data and product information from a vast range of sources. To find out more about our reports methodology, please email jamie.roberts@visiongain.com
Would you like to get the latest Visiongain energy reports catalogue?
What are the dynamic growth sectors? where are the regional business opportunities?
Which technologies will prevail and who are the leading companies succeeding in these sectors and why?
If you want definitive answers to business critical questions, discover Visiongain’s full range of business intelligence reports.
If so, please email Jamie Roberts on jamie.roberts@visiongain.com or call her today on +44 207 336 6100
“The Visiongain report was extremely insightful and helped us construct our basic go-to market strategy for our solution.”
H.
“F.B has used Visiongain to prepare two separate market studies on the ceramic proppants market over the last 12 months. These reports have been professionally researched and written and have assisted FBX greatly in developing its business strategy and investment plans.”
F.B
“We just received your very interesting report on the Energy Storage Technologies (EST) Market and this is a very impressive and useful document on that subject.”
I.E.N
“Visiongain does an outstanding job on putting the reports together and provides valuable insight at the right informative level for our needs. The EOR Visiongain report provided confirmation and market outlook data for EOR in MENA with the leading countries being Oman, Kuwait and eventually Saudi Arabia.”
E.S
“Visiongain produced a comprehensive, well-structured GTL Market report striking a good balance between scope and detail, global and local perspective, large and small industry segments. It is an informative forecast, useful for practitioners as a trusted and upto-date reference.”
Y.N Ltd
Association of Dutch Suppliers in the Oil & Gas Industry
Society of Naval Architects & Marine Engineers
Association of Diving Contractors
Association of Diving Contractors International
Associazione Imprese Subacquee Italiane
Australian Petroleum Production & Exploration Association
Brazilian Association of Offshore Support Companies
Brazilian Petroleum Institute
Canadian Energy Pipeline
Diving Medical Advisory Committee
European Diving Technology Committee
French Oil and Gas Industry Council
IMarEST – Institute of Marine Engineering, Science & Technology
International Association of Drilling Contractors
International Association of Geophysical Contractors
International Association of Oil & Gas Producers
International Chamber of Shipping
International Shipping Federation
International Marine Contractors Association
International Tanker Owners Pollution Federation
Leading Oil & Gas Industry Competitiveness
Maritime Energy Association
National Ocean Industries Association
Netherlands Oil and Gas Exploration and Production Association
NOF Energy
Norsk olje og gass Norwegian Oil and Gas Association
Offshore Contractors’ Association
Offshore Mechanical Handling Equipment Committee
Oil & Gas UK
Oil Companies International Marine Forum
Ontario Petroleum Institute
Organisation of the Petroleum Exporting Countries
Regional Association of Oil and Natural Gas Companies in Latin America and the Caribbean
Society for Underwater Technology
Society of Maritime Industries
Society of Petroleum Engineers
Society of Petroleum Enginners – Calgary
Step Change in Safety
Subsea UK
The East of England Energy Group
UK Petroleum Industry Association
All the events postponed due to COVID-19.
Don’t Miss Out!
Latest Energy news
Energy as a Service (EaaS) Market
The global Energy as a Service (EaaS) market is projected to grow at a CAGR of 12.6% by 2034
25 July 2024
Synthetic Fuels Market
The global Synthetic Fuels market is projected to grow at a CAGR of 23% by 2034
18 July 2024
Power-to-X (P2X) Market
The global Power-to-X (P2X) market is projected to grow at a CAGR of 10.6% by 2034
09 July 2024
Airborne Wind Energy Market
The global Airborne Wind Energy market is projected to grow at a CAGR of 9.7% by 2034
05 June 2024


