Wearable Technology – our new study reveals trends, R&D progress, and predicted revenues
Where is the Wearable Technology market heading? If you are involved in this sector you must read this new report. Visiongain’s report shows you the potential revenues streams to 2028, assessing data, trends, opportunities and business prospects there.
Discover How to Stay Ahead
Our 172-page report provides 134 tables, charts, and graphs. Read on to discover the most lucrative areas in the industry and the future market prospects. Our new study lets you assess forecasted sales at overall world market and regional level. See financial results, trends, opportunities, and revenue predictions. Much opportunity remains in this growing Wearable Technology market. See how to exploit the opportunities.
Forecasts to 2028 and other analyses reveal the commercial prospects
• In addition to revenue forecasting to 2028, our new study provides you with recent results, growth rates, and market shares.
• You find original analyses, with business outlooks and developments.
• Discover qualitative analyses (including market dynamics, drivers, opportunities, restraints and challenges), product profiles and commercial developments.
Discover sales predictions for the world market and submarkets
Along with revenue prediction for the overall world market, the Wearable Technology market is segmented by solution, technology and application, each forecasted at a global and regional level.
Global Wearable Technology Market by Product Type
• Wristwear
• Headwear
• Bodywear
Global Wearable Technology Market by Application
• Consumer Electronics
• Healthcare
• Enterprise & Industrial
• Other
In addition to the revenue predictions for the overall world market and segments, you will also find revenue forecasts for 5 regional and 11 leading national markets:
• North America
• US
• Canada
• Mexico
• Europe
• Germany
• The UK
• France
• Rest of Europe
• Asia-Pacific
• Japan
• China
• South Korea
• India
• Rest of Asia-Pacific
• Rest of the World
• Middle East & Africa
• Brazil
• Other Countries
The report also includes profiles and for some of the leading companies in the Wearable Technology market, with a focus on this segment of these companies’ operations.
There will be growth in both established and in developing countries. Our analyses show that the both developed and developing markets, the US, South Korea and China in particular, will continue to achieve high revenue growth to 2028.
Leading companies and the potential for market growth
Overall world revenue for Wearable Technology will surpass $25bn in 2018, our work calculates. We predict strong revenue growth through to 2028.
Our work identifies which organisations hold the greatest potential. Discover their capabilities, progress, and commercial prospects, helping you stay ahead.
How the Wearable Technology Market report helps you
In summary, our 172-page report provides you with the following knowledge:
• Revenue forecasts to 2028 for 2 segmentations of the Wearable Technology market, with forecasts for 3 product types and 4 applications, each forecasted at a global and regional level – discover the industry’s prospects, finding the most lucrative places for investments and revenues
• Revenue forecasts to 2028 for 5 regional and 11 key national markets – See forecasts for the Wearable Technology market in North America, Europe, Asia-Pacific and MEA. Also forecasted is the market in the US, Mexico, Canada, Germany, France, the UK, China, India, Japan, South Korea and Brazil.
• What stimulates and restrains companies and the market
• Prospects for established firms and those seeking to enter the market – including company profiles for 13 of the major companies involved in the Wearable Technology market
Find quantitative and qualitative analyses with independent predictions. Receive information that only our report contains, staying informed with this invaluable business intelligence.
Information found nowhere else
With our newly report title, you are less likely to fall behind in knowledge or miss out on opportunities. See how our work could benefit your research, analyses, and decisions.
Visiongain’s study is for everybody needing commercial analyses for the Wearable Technology market and leading companies. You will find data, trends and predictions.
Get our report today Wearable Technology Market 2018-2028: Forecasts and Analysis by Product Type (Wristwear, Headwear, Bodywear), Application (Consumer Electronics, Healthcare, Enterprise & Industrial, Others) and Geography, with Analysis of Leading Companies.
Visiongain is a trading partner with the US Federal Government
CCR Ref number: KD4R6
1. Report Overview
1.1 Global Wearable Technology Market Overview
1.2 Global Wearable Technology Market Segmentation
1.3 Why You Should Read This Report
1.4 How This Report Delivers
1.5 Key Questions Answered by This Analytical Report Include:
1.6 Who is This Report For?
1.7 Methodology
1.7.1 Secondary Research
1.7.2 Market Evaluation & Forecasting Methodology
1.8 Frequently Asked Questions (FAQ)
1.9 Associated Visiongain Reports
1.10 About Visiongain
2. Wearable Technology Market Summary
2.1 Introduction
2.2 Market Insight
2.2.1 Emerging Economies Will Offer Lucrative Growth In Wearable Technology Market
2.2.2 Wristwear Segment Will Continue To Dominate The Global Wearable Technology Market
2.2.3 North America To Grow At The Fastest CAGR Till 2028 In The Global Wearable Technology Market
2.2.4 Use Of Wearable Wechnology In The Consumer Electronics Industry Will continue To Dominate The Market Till 2028
3. Global Wearable Technology Market Overview
3.1 Global Wearable Technology Market Forecast 2018-2028
3.2 Global Wearable Technology Drivers & Restraints 2017
3.3 Global Wearable Technology Market Segmentation
3.3.1 Wearable Technology Market by Product Type
3.3.2 Wearable Technology Market, By Application
3.3.3 Wearable Technology Market, By Region
4. Global Wearable Technology By Product Type 2018-2028
4.1 Summary
4.2 Introduction
4.3 Wristwear
4.4 Headwear
4.5 Bodywear
5. Global Wearable Technology Market By Application 2018-2028
5.1 Summary
5.2 Introduction
5.3 Consumer Electronics
5.4 Health Care
5.5 Enterprise & Industrial
5.6 Others
6 Wearable Technology Market, By Geographical Analysis
6.1 Summary
6.2 Introduction
6.3 North America
6.3.1 U.S.
6.3.2 Canada
6.3.3 Mexico
6.4 Asia-Pacific
6.4.1 China
6.4.2 Japan
6.4.3 South Korea
6.4.4 India
6.4.5 Rest of Asia-Pacific
6.5 Europe
6.4.1 Germany
6.4.2 U.K.
6.4.3 France
6.4.4 Rest of Europe
6.6 Rest of the World
6.5.1 Middle East and Africa
6.5.2 Brazil
6.5.3 Other Countries
7. SWOT Analysis of the Wearable Technology Market 2018-2028
8. Leading Wearable Technology Companies
8.1 Apple Inc.
8.1.1 Introduction
8.1.2 Apple Inc. SWOT Analysis
8.1.3 Apple Inc. Future Outlook
8.1.4 Apple Inc. Performance Analysis
8.2 Adidas
8.2.1 Introduction
8.2.2 Adidas SWOT Analysis
8.2.3 Adidas Future Outlook
8.2.4 Adidas. Performance Analysis
8.3 Boston Scientific
8.3.1 Introduction
8.3.2 Boston Scientific SWOT Analysis
8.2.3 Boston Scientific Future Outlook
8.3.4 Boston Scientific Performance Analysis
Source: Company Annual Reports, Press Releases,
8.4 Eurotech
8.4.1 Introduction
8.4.2 Eurotech SWOT Analysis
8.4.3 Eurotech Future Outlook
8.4.4 Eurotech Performance Analysis
8.5 Fitbit
8.5.1 Introduction
8.5.2 Fitbit SWOT Analysis
8.5.3 Fitbit Future Outlook
8.5.4 Fitbit Performance Analysis
8.6 Garmin Corporation
8.6.1 Introduction
8.6.2 Garmin SWOT Analysis
8.6.3 Garmin Future Outlook
8.6.4 Garmin Performance Analysis
8.7 Samsung
8.7.1 Introduction
8.7.2 Samsung SWOT Analysis
8.7.3 Samsung Future Outlook
8.7.4 Samsung Performance Analysis
8.8 Sony
8.8.1 Introduction
8.8.2 Sony SWOT Analysis
8.8.3 Sony Future Outlook
8.8.4 Sony Performance Analysis
8.9 Johnson & Johnson
8.9.1 Introduction
8.9.2 Johnson & Johnson SWOT Analysis
8.9.3 Johnson & Johnson Future Outlook
8.9.4 Johnson & Johnson Performance Analysis
8.10 Medtronic
8.10.1 Introduction
8.10.2 Medtronic SWOT Analysis
8.10.3 Medtronic Future Outlook
8.10.4 Medtronic PerformanceAnalysis
8.11 Nike
8.11.1 Introduction
8.11.2 Nike SWOT Analysis
8.11.3 Nike Future Outlook
8.11.4 Nike Performance Analysis
8.12 Motorola Solution
8.12.1 Introduction
8.12.2 Motorola Solutions SWOT Analysis
8.12.3 Motorola Solutions Future Outlook
8.12.4 Motorola Performance Analysis
8.13 Plantronics
8.13.1 Introduction
8.13.2 Plantronics SWOT Analysis
8.13.3 Platronics Future Outlook
8.12.4 Plantronics Performance Analysis
8.14 Other Companies of Interest in the Wearable Technology Market
9. Conclusions
10. Glossary
Associated Visiongain Reports
Visiongain Report Sales Order Form
Appendix A
About visiongain
Appendix B
Visiongain report evaluation form
List of Figures
Figure 1.1 Global Wearable Technology Market Segmentation Overview
Figure 2.1 Wearable technology Market Size, 2017 & 2028 (US$B, CAGR %)
Figure 2.2 Wearable Technology Market Share,By Product type 2017 & 2028 (% share)
Figure 2.3 Wearable Technology Market Size, By Region 2018-2028 (US$ billion, CAGR %)
Figure 2.4 Wearable Technology Market Size, By Application 2018-2028 (US$Billion)
Figure 3.1 Global Wearable Technology Market Forecast 2018-2028 (US$ Bn, AGR%)
Figure 3.2 Global Wearable Technology Market Segmentation
Figure 4.1 Global Wearable Technology market by product AGR Forecast 2018-2028 (AGR%)
Figure 4.2 Global Wearable Technology Submarket by Product Type, by Value Forecast 2017-2027 (US$Bn Global AGR%)
Figure 4.3 Global Wearable Technology market by product type, by shipments AGR Forecast 2018-2028 (AGR %)
Figure 4.4 Global Wearable Technology market, by Product type, by Shipments Forecast 2018-2028 (Million Units, Global AGR %)
Figure 4.5 Wrist Wear Market Value Forecast 2018-2028 (USD Billion, AGR %)
Figure 4.6 Wrist Wear Market Value Share 2018, 2023, 2028 (%)
Figure 4.7 Head Wear Market Value Forecast 2018-2028 (USD Billion, AGR %)
Figure 4.8 Head Wear Market Value Share 2018, 2023, 2028 (%)
Figure 4.9 Body Wear Market Value Forecast 2018-2028 (USD Billion, AGR %)
Figure 4.10 Body Wear Market Value Share 2018, 2023, 2028 (%)
Figure 5.1 Global Wearable Technology Market, by Application Value, AGR Forecast 2018-2028 (AGR %)
Figure 5.2 Global Wearable Technology market, by Application Value Forecast 2018-2028 (US$bn, Global AGR %)
Figure 5.3 Global Wearable Technology Shipments AGR Forecast 2018-2028 (AGR %)
Figure 5.4 Global Wearable Technology Market by Application, Shipments Forecast 2018-2028 (million units, Global AGR %)
Figure 5.5 Wearable Technology maket for Consumer Electronics Application, Value Forecast 2018-2028 (USD Billion, AGR %)
Figure 5.6 Consumer Electronics Application Market Value Share 2018, 2023, 2028 (%)
Figure 5.7 Healthcare Application Submarket Value Forecast 2018-2028 (USD Billion, AGR %)
Figure 5.8 Healthcare Submarket Market Value Share 2018, 2023, 2028 (%)
Figure 5.9 Healthcare Application Submarket Value Forecast 2018-2028 (USD Billion, AGR %)
Figure 5.10 Enterprise and Industrial Submarket Market Value Share 2018, 2023, 2028 (%)
Figure 5.11 Other Applications Submarket Value Forecast 2018-2028 (USD Billion, AGR %)
Figure 5.12 Others Submarket Market Value Share 2018, 2023, 2028 (%)
Figure 6.1. Global Wearable Technology Market, By Regional Market Value AGR Forecast 2018-2028 (AGR %)
Figure 6.2. Global Wearable Technology Market, By Regional Market Shipments AGR Forecast 2018-2028 (AGR %)
Figure 6.3. North America Wearable Technology Market Shares by Value and Volume, by product type 2017 (% Share)
Figure 6.4. North America Wearable Technology Market by Application Market Shares, 2017 (% Share)
Figure 6.5 Wearable Technology Market Size in the United States, 2018-2028 (US$bn, CAGR %)
Figure 6.6 Wearable Technology Market Size in Canada, 2018-2028 (US$bn, CAGR %)
Figure 6.7 Wearable Technology Market Size in Mexico, 2018-2028 (US$bn, CAGR %)
Figure 6.8 Asia-Pacific Wearable technology by product Type Market Shares (Value & Shipments, 2017 (% Share)
Figure 6.9 Asia-Pacific Wearable Technology by Application Market Shares,Value & Shipments 2017 (% Share)
Figure 6.10 Wearable Technology Market Size in China, 2018-2028 (US$bn, CAGR %)
Figure 6.11 Wearable Technology Market Size in Japan, 2016-2027 (US$bn, CAGR %)
Figure 6.12 Wearable Technology Market Size in South Korea, 2018-2028 (US$Bn , CAGR %)
Figure 6.14 Wearable Technology Market Size in India, 2018-2028 (US$bn, AGR %)
Figure 6.15 Wearable Technology Market Size in Rest of Asia Pacific, 2018-2028 (US$bn, CAGR %)
Figure 6.16 Europe Wearable Technology by Product Type Market Shares, 2017 (% Share)
Figure 6.17 Europe Wearable Technology Application Market Shares, 2017 (% Share)
Figure 6.18 Wearable Technology Market Size in Germany, 2018-2028 (US$bn, AGR %)
Figure 6.19 Wearable Technology Market Size in Germany, 2018-2028 (US$bn, CAGR %)
Figure 6.20 Wearable technology Market Size in France, 2018-2028 (US$bn, CAGR %)
Figure 6.21 Wearable Technology Market Size in Rest of Europe, 2018-2028 (US$bn, CAGR %)
Figure 6.22 Rest of the World Wearable Technology by Product type Market Shares, 2017 (% Share)
Figure 6.23 Rest of the World Wearable Technology by Application Type Market Shares, 2017 (% Share)
Figure 6.24 Wearable technology Market Size in Middle East and Africa, 2018-2028 (US$bn, CAGR %)
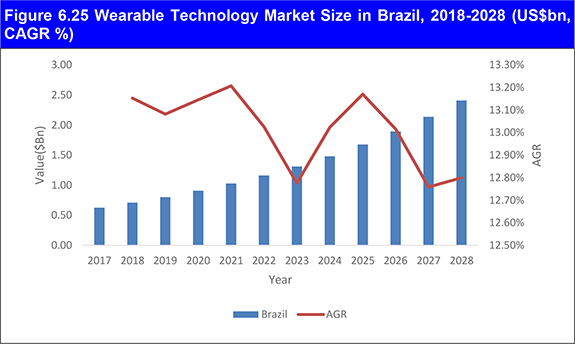
Figure 6.25 Wearable Technology Market Size in Brazil, 2018-2028 (US$bn, CAGR %)
Figure 6.26 Wearable Technology Market Size in Other countries, 2016-2027 (US$bn, CAGR %)
Figure 8.1 Apple Inc. Financial Snapshot
Figure 8.2 Adidas Financial Snapshot
Figure 8.3 Boston Scientific Financial Snapshot
Figure 8.4 Eurotech Snapshot
Figure 8.5 Fitbit Financial Snapshot
Figure 8.6 Garmin Financial Snapshot
Figure 8.7 Samsung Financial Snapshot
Figure 8.8 Sony Financial Snapshot
Figure 8.9 Johnson & Johnson Financial Snapshot
Figure 8.10 Medtronic Financial Snapshot
Figure 8.11 Nike Financial Snapshot
Figure 8.12 Motorola Solutions Financial Snapshot
Figure 8.13 Plantronics Financial Snapshot
List of Tables
Table 3.1 Global Wearable Technology Market Forecast 2018-2028 (US$ Billion, AGR %, CAGR%, Cumulative)
Table 3.2 Global Wearable Technology Market Drivers & Restraints 2017
Table 4.1 Global Wearable Technology market, by product type Value Forecast 2018-2028 (US$ Billion, AGR%, CAGR%)
Table 4.2 Global Wearable Technology Submarket Volume Forecast 2017-2027 (Kilotons, AGR%, CAGR%)
Table 4.3 Wrist Wear Product Type Market Value Forecast 2018-2028 (USD Billion, AGR %, CAGR %)
Table 4.4 Glass Fiber Composite Market Value Forecast 2017-2027 (USD Billion, AGR %, CAGR %)
Table 4.5 Body Wear Market Value Forecast 2017-2027 (USD Billion, AGR %, CAGR %)
Table 5.1 Global Wearable Technology market, by Application Value Forecast 2018-2028 (US$ Billion, AGR %, CAGR%)
Table 5.2 Global Wearable Technology Market, by Application Shipments Forecast 2018-2028 (Million Units, AGR%, CAGR%)
Table 5.3 Wearable Technology for Consumer Electronics Application Market Value Forecast 2018-2028 (USD Billion, AGR %, CAGR %)
Table 5.4 Health Care Submarket Value for wearable technology market Forecast 2018-2028 (USD Billion, AGR %, CAGR %)
Table 5.5 Enterprise & Industrial Submarket Value for wearable technology market Forecast 2018-2028 (USD Billion, AGR %, CAGR %)
Table 5.6 Enterprise & Industrial Submarket Value for wearable technology market Forecast 2018-2028 (USD Billion, AGR %, CAGR %)
Table 6.1 Global Wearable technology Market, By Regional Value Forecast 2018-2028 (US$bn, AGR %, CAGR %)
Table 6.2 Global Wearable Technology Market, By Regional Shipments Forecast 2018-2028 (Million Units, AGR %, CAGR %)
Table 6.3 North America Wearable Technology Shipments Market, By Country Forecast 2018-2028 (Million Units, CAGR %)
Table 6.4 North America Wearable Technology Shipments Market, By Country Forecast 2018-2028 ($ Bn, CAGR %)
Table 6.5 North America Wearable Technology Market, By Prodcut type Forecast 2018-2028 (US$bn, CAGR %)
Table 6.6 North America Wearable Technology, By Product type Forecast 2018-2028 (Million Units, CAGR %)
Table 6.7 North America Wearable Technology Market, By application Forecast 2018-2028 (US$bn, CAGR %)
Table 6.8 North America Wearable Technology Market, By Application Type Forecast 2018-2028 (Million Units, CAGR %)
Table 6.9 Asia-Pacific Wearable Technology Market, By Country Forecast 2018-2028 (Million Units, CAGR %)
Table 6.10 Asia-Pacific Wearable Technology Market, By Country Forecast 2018-2028 ($ Bn, CAGR %)
Table 6.11 Asia-Pacific Wearable Technology Market, By Product Type Forecast 2018-2028 (US$bn, CAGR %)
Table 6.12 Asia-Pacific Wearable Technology Market, By Product Type Forecast 2018-2028 (Million Units, CAGR %)
Table 6.13 Asia-Pacific Wearable Technology Market, By Application Type Forecast 2018-2028 (US$bn, CAGR %)
Table 6.14 Asia-Pacific Wearable Technology Market, By Application Forecast 2018-2028 (Million Units, CAGR %)
Table 6.15 Europe Wearable Technology Market, By Country Forecast 2018-2028 (US$bn, CAGR %)
Table 6.16 Europe Wearable Technology Market, By Country Forecast 2018-2028 (Million Units, CAGR %)
Table 6.17 Europe Wearable Technology Market, By Product type Forecast 2018-2028 (US$bn, CAGR %)
Table 6.18 Europe Wearable Technology Market, By Product Type Forecast 2018-2028 (Million Units, CAGR %)
Table 6.19 Europe Wearable Technology Market, By Application Forecast 2018-2028 (US$bn, CAGR %)
Table 6.20 Europe Wearable Technology Market, By Application Forecast 2018-2028 (Million Units, CAGR %)
Table 6.21 Rest of the World Wearable technology Market, By Country Forecast 2018-2028 (US$bn, CAGR %)
Table 6.22 Rest of the World Wearable Technology Market, By Country Forecast 2018-2028 (Million UNits, CAGR %)
Table 6.23 Rest of the World Wearable technology Market, By Product Type Forecast 2018-2028 (US$bn, CAGR %)
Table 6.24 Rest of the world Wearable Technology Market, By Product Type Forecast 2018-2028 (Million Units, CAGR %)
Table 6.25 Rest of the World Wearabale Technology Market, By Application Type Forecast 2018-2028 (US$bn, CAGR %)
Table 6.26 Rest of the World wearable Technology Market, By Application Type Forecast 2018-2028 (Million Units, CAGR %)
Table 7.1 Wearable Technology Market SWOT Analysis 2018-2028
Table 8.1 Apple Inc. Profile
Table 8.2 Apple Inc. SWOT Analysis
Table 8.3 Adidas Profile
Table 8.4 Adidas. SWOT Analysis
Table 8.5 Boston Scientific Profile
Table 8.6 Boston Scientific SWOT Analysis
Table 8.7 Eurotech Profile
Table 8.8 Eurotech SWOT Analysis
Table 8.9 Fitbit Profile
Table 8.10 Fitbit SWOT Analysis
Table 8.11 Garmin Profile
Table 8.12 Garmin SWOT Analysis
Table 8.13 Samsung Profile
Table 8.14 Samsung SWOT Analysis
Table 8.15 Sony Profile
Table 8.16 Sony SWOT Analysis
Table 8.17 Johnson & Johnson Profile
Table 8.18 Johnson & Johnson SWOT Analysis
Table 8.19 Medtronic Profile
Table 8.20 Medtronic SWOT Analysis
Table 8.21 Nike Profile
Table 8.22 Nike SWOT Analysis
Table 8.23 Motorola Solutions Profile
Table 8.24 Motorola Solutions SWOT Analysis
Table 8.25 Plantronics Profile
Table 8.26 Plantronics SWOT Analysis
Table 8.27: Other Wearable Technology Companies
3rd Space
Adidas
Advanet Group
AiQ
Alta Devices
Amigo
Apple Inc.
Bayer
Bayer Material Science
Best Buy
Bioserve Technologies AB
BlackBerry
Boston Scientific
Breitling
Coca-Cola
CommBadge
Contextual Computing Group
Continue
CrossFit
DAQRI
DFK I
Embrace+
Engadget
Ericcson
Ethlab
Eurotech Finland
Eurotech France
Eurotech Ltd
Eurotechnic
Eurotech S.p.A.
EyeTanya
Facebook
FedEx
First Warning Systems Inc.
Fitbit Inc.
Fitbug Flextronics
Fujitsu
Garmin Asia Corporation
Garmin International Inc.
Garmin Ltd.
Google
GoPro
Heapsylon
Hewlett-Packard
HP Labs
HTC
Huawei
I’m Watch
Imec
Intel
ION
Jabra
Jawbone
Jins
Johnson & Johnson
KeyGlove
Kickstarter
Kiwi Wearables
Kleiner Perkins Caufield & Byers (KPCB)
Knoica Minolta
Kopin
LaForge
Laster Technologies
Lenovo
LG
Limmex
Lok8u
Looxie
Maxvirtual
Medtronic
Memoo
MetalPro
MetaWatch
Microsoft
Misfit Shine
Misfit Wearables
Mobisante
Motorola Mobility
Motorola Solutions
Muse
New York Times
Nike
Oakley
Oculus
ODG
Optinvent
Parvus
Pebble
Plantronics
Pocketfinder
Polar Electro
Preventice
Proteus Digital Health
Recon Instruments
Reebok
Samsung
Scott
Sharp
Sleep Cycle
Smith I/O
Sonitus Medical
Sony
Sony Mobile Communications
Spartan Race
ST MicroElectronics
Tag-Heuer
Taser
Tech Radar
Technical Illusions
Telit Wireless
Texas Instruments
Thimble Bioelectronics
Toshiba
Twitter
Vantron
Varta
Vievu
Vuzix
Wal;-Mart
Wearable Experiments
Xiaomi
YouTube
Zeal
Zephyr Technology
ZTE
List of Organizations
Camera & Imaging Products Association
New Orleans Police Department
US Food & Drug Administration (FDA)
US DARPA