Visiongain’s comprehensive new 138 page report reveals that power bank technologies will achieve revenues of $15.1bn in 2017.
Are you involved in the power bank market or intend to be? If so, then you must read this report
It’s vital that you keep your industry knowledge up to date. You need this report.
Market scope: The quick discharge rate of batteries in smartphones, tablets, MP3 players, and laptops due to the increased power and usage of such devices has stimulated the demand for portable battery sources. Power banks or external batteries are increasingly being adopted as a mobile source of battery power for devices with USB capability. These are primarily based on either lithium-ion or lithium-polymer batteries with power ratings that range below 3,500 mAh to above 20,000 mAh. Visiongain assesses how these power rating categories and other segments plus the 11 largest national markets will evolve over the forecast period The competitive landscape is further illustrated with examination of the 10 market leading power bank manufacturers.
The Power Bank Market Report 2017-2027 responds to your need for definitive market data:
• Who are the leading 10 power bank companies?
– Examine competitive positioning, capabilities, product portfolios, R&D activity, services, focus, strategies, M&A activity, and future outlook.
– Anker Technology Co. Limited
– Apacer Technology Inc.
– GP Batteries International Ltd
– Hitachi Maxwell Ltd.
– Microsoft Corporation
– OnePlus
– Panasonic Corporation
– Samsung Electronics Co. Ltd.
– Sony Corporation
– Xiaomi Inc.
• Where are the power bank market opportunities?
– 138 tables, charts, and graphs reveal market data allowing you to target your strategy more effectively
• When will the power bank market grow?
– Global, regional and power bank submarket forecasts and analysis from 2017-2027 illustrate the market progression
• Which power bank power rating submarkets will flourish from 2017-2027?
– Individual forecasts and analysis demonstrate the prospects
– Below 3,500 mAh,
– 3,501 – 20,000 mAh
– Above 20,000 mAh
• Which power bank battery type will thrive from 2017-2027?
– Separate technology projections and analysis explore the potential
– Lithium-Ion (Li-Ion)
– Lithium-Polymer (Li-Po)
• Which power bank type will develop from 2017-2027?
– Portable
– Battery Case
– Solar(PV)
• Where are the regional power bank market opportunities from 2017-2027?
– Focused regional and national forecasts and analysis explore the future business opportunities
North America Power Bank forecast 2017-2027
– U.S. Power Bank Market 2017-2027
– Canada Power Bank Market 2017-2027
– Mexico Power Bank Market 2017-2027
Europe Power Bank forecast 2017-2027
– United Kingdom Power Bank Market 2017-2027
– Germany Power Bank Market 2017-2027
– France Power Bank Market 2017-2027
– Russia Power Bank Market 2017-2027
– Rest of Europe Power Bank Market 2017-2027
Asia Pacific Power Bank forecast 2017-2027
– China Power Bank Market 2017-2027
– Japan Power Bank Market 2017-2027
– India Power Bank Market 2017-2027
– Australia Power Bank Market 2017-2027
– Rest of Asia-Pacific Power Bank Market 2017-2027
Latin America, Middle East & Africa (LAMEA) Power Bank forecast 2017-2027
– Latin America Power Bank Market 2017-2027
– Middle East Power Bank Market 2017-2027
– Africa Power Bank Market 2017-2027
• What are the factors influencing power bank market dynamics?
– Porter’s Five Force analysis explores the factors.
– Research and development (R&D) strategy
– Technological issues and constraints.
– Supply and demand dynamics
– Competition from new product types
– Increasing specialisation by leading players
– Advances in product quality
• Who should read this report?
– Anyone within the power bank value chain, including
– Battery manufacturers
– Smart mobile device manufacturers
– CEO’s
– COO’s
– CIO’s
– Business development managers
– Marketing managers
– Suppliers
– Technologists
– Investors
– Banks
– Government agencies
– Contractors
Get our report today Forecasts by Power Rating (Below 3,500 mAh, 3,501 – 20,000 mAh, Above 20,000 mAh) by Battery Type (Lithium-Ion (Li-Ion), Lithium-Polymer (Li-Po)) by Type (Portable, Battery Case, Solar(PV)), Plus Analysis of Leading Companies Developing Technologies for Laptops, Tablets, Smartphones & Other Mobile Devices. Avoid missing out – order our report now.
Visiongain is a trading partner with the US Federal Government
CCR Ref number: KD4R6
1. Report Overview
1.1 Global Power Bank Market Overview
1.2 Market Definition & Methodology
1.2.1 Market Definition
1.2.2 Methodology
1.2.2.1 Primary Research
1.2.2.2 Secondary Research
1.2.2.3 Market Evaluation & Forecasting Methodology
1.3 Why You Should Read This Report
1.4 How This Report Delivers
1.5 Key Questions Answered by This Analytical Report Include
1.6 Who is This Report For?
1.7 Frequently Asked Questions (FAQ)
1.8 Associated Visiongain Reports
1.9 About Visiongain
2. Introduction to the Power Bank Market
2.1 Power Bank Market Structure
2.2 Power Bank Market Definition
2.3 Power Bank Submarkets
2.3.1 Power Bank, By Type
2.3.1.1 Portable Power Bank
2.3.1.2 Battery Case Power Bank
2.3.1.3 Solar Charger Power Bank
2.3.2 Power Bank, By Power Rating
2.3.2.1 Power Bank Below 3,500mAh Power Rating
2.3.2.2 Power Bank 3,500-20,000mAh Power Rating
2.3.2.3 Power Bank Above 20,000mAh Power Rating
2.3.3 Power Bank, By Battery Type
2.3.3.1 Power Bank Lithium-ion Battery Type
2.3.3.2 Power Bank Lithium-polymer Battery Type
2.4 Power Bank Market Drivers
2.4.1 Increased Growth in Demand For Smart Devices
2.4.2 Introduction of New Power Banks Which Are Comparatively Low-Priced
2.4.3 Increasing Digitization and Penetration of Wireless Services
2.5 Power Bank Market Restraints
2.5.1 Introduction of Advanced Devices Reduces The Need For Power Banks
2.5.2 Wireless Charging Capability In Smart Devices
2.5.3 Power Banks With Inefficient Battery Quality
2.6 Power Bank Market Opportunities
2.6.1 Innovative Ideas And Techniques in Power Banks
2.6.2 Growth Through E-Commerce
3. Porters Five Forces Analysis of Global Power Bank Market
3.1.1 More Concentrated Suppliers And Price-Oriented Buyers Have Led To Moderate Bargaining Power Among Suppliers
3.1.2 Easy Access To Distribution Channel And Well-Known Brand Names Have Led To Moderate Threat Of New Entrants In The Market
3.1.3 Superior Substitute Product Quality And More Expensive Substitute Product Have Led To Moderate Threat Of Substitutes In The Market
3.1.4 Numerous Competitors And Insignificant Brand Loyalty Have Led To High Rivalry In The Market
3.1.5 Price-Sensitive And Less Educated Buyers Have Led To Moderate Bargaining Power Among Buyers
4. Global Power Bank Type Market Forecast 2017-2027
4.1 Portable Power Bank Market 2017-2027
4.1.1 Portable Power Bank Key Drivers & Opportunities
4.1.2 Portable Power Bank Market Size & Forecast 2017-2027
4.2 Battery Case Power Bank Market 2017-2027
4.2.1 Battery Case Power Bank Key Drivers & Opportunities
4.2.2 Battery Case Power Bank Market Size & Forecast 2017-2027
4.3 Solar Power Bank Market 2017-2027
4.3.1 Solar Power Bank Key Drivers & Opportunities
4.3.2 Solar Power Bank Market Size & Forecast 2017-2027
5. Global Power Bank Battery Type Market Forecast 2017-2027
5.1 Lithium-Ion Power Bank Market 2017-2027
5.1.1 Lithium-Ion Power Bank Key Drivers & Opportunities
5.1.2 Lithium-Ion Power Bank Market Size & Forecast 2017-2027
5.2 Lithium-Polymer Power Bank Market 2017-2027
5.2.1 Lithium-Polymer Power Bank Key Drivers & Opportunities
5.2.2 Lithium-Polymer Power Bank Market Size & Forecast 2017-2027
6. Global Power Bank Power Rating Market 2017-2027
6.1 Below 3,500mAh Power Bank Market 2017-2027
6.1.1 Below 3,500mAh Power Bank Key Drivers & Opportunities
6.1.2 Below 3,500mAh Power Bank Market Size & Forecast 2017-2027
6.2 3,501-20,000mAh Power Bank Market 2017-2027
6.2.1 3,501-20,000mAh Power Bank Key Drivers & Opportunities
6.2.2 3,501-20,000mAh Power Bank Market Size & Forecast 2017-2027
6.3 3,501-20,000mAh Power Bank Market 2017-2027
6.3.1 Above 20,000mAh Power Bank Key Drivers & Opportunities
6.3.2 Above 20,000mAh Power Bank Market Size & Forecast 2017-2027
7. Regional Power Bank Market Forecasts 2017-2027
7.1 North America Power Bank Market 2017-2027
7.1.1 U.S. Power Bank Market 2017-2027
7.1.2 Canada Power Bank Market 2017-2027
7.1.3 Mexico Power Bank Market 2017-2027
7.2 Europe Power Bank Market 2017-2027
7.2.1 United Kingdom Power Bank Market 2017-2027
7.2.2 Germany Power Bank Market 2017-2027
7.2.3 France Power Bank Market 2017-2027
7.2.4 Russia Power Bank Market 2017-2027
7.2.5 Rest of Europe Power Bank Market 2017-2027
7.3 Asia-Pacific Power Bank Market 2017-2027
7.3.1 China Power Bank Market 2017-2027
7.3.2 Japan Power Bank Market 2017-2027
7.3.3 India Power Bank Market 2017-2027
7.3.4 Australia Power Bank Market 2017-2027
7.3.5 Rest of Asia-Pacific Power Bank Market 2017-2027
7.4 Latin America, Middle East & Africa (LAMEA) Power Bank Market 2017-2027
7.4.1 Latin America Power Bank Market 2017-2027
7.4.2 Middle East Power Bank Market 2017-2027
7.4.3 Africa Power Bank Market 2017-2027
8. Leading 10 Power Bank Companies
8.1 Panasonic Corporation
8.1.1 Panasonic Corporation Company Overview
8.1.2 Panasonic Corporation Business Performance
8.1.3 Panasonic Corporation Key Developments
8.1.4 Panasonic Corporation Products / Services
8.2 Samsung Electronics Co. Ltd.
8.2.1 Samsung Electronics Co. Ltd. Company Overview
8.2.2 Samsung Electronics Co. Ltd. Business Performance
8.2.3 Samsung Electronics Co. Ltd. Key Developments
8.2.4 Samsung Electronics Co. Ltd. Products / Services
8.3. Microsoft Corporation
8.3.1 Microsoft Corporation Company Overview
8.3.2 Microsoft Corporation Business Performance
8.3.3 Microsoft Corporation Key Developments
8.3.4 Microsoft Corporation Products / Services
8.4 Apacer Technology Inc.
8.4.1 Apacer Technology Inc. Company Overview
8.4.2 Apacer Technology Inc. Business Performance
8.4.3 Apacer Technology Inc. Key Developments
8.4.4 Apacer Technology Inc. Products / Services
8.5 Xiaomi Inc.
8.5.1 Xiaomi Inc. Company Overview
8.5.2 Xiaomi Inc. Business Performance
8.5.3 Xiaomi Inc. Key Developments
8.5.4 Xiaomi Inc. Products / Services
8.6 Sony Corporation
8.6.1 Sony Corporation Company Overview
8.6.2 Sony Corporation Business Performance
8.6.3 Sony Corporation Key Developments
8.6.4 Sony Corporation Products / Services
8.7 GP Batteries International Ltd
8.7.1 GP Batteries International Ltd. Company Overview
8.7.2 GP Batteries International Ltd. Business Performance
8.7.3 GP Batteries International Ltd. Key Developments
8.7.4 GP Batteries International Ltd. Products / Services
8.8 Anker Technology Co. Limited
8.8.1 Anker Technology Co. Limited Company Overview
8.8.2 Anker Technology Co. Limited Business Performance
8.8.3 Anker Technology Co. Limited Key Developments
8.8.4 Anker Technology Co. Limited Products / Services
8.9 OnePlus
8.9.1 OnePlus Company Overview
8.9.2 OnePlus. Business Performance
8.9.3 OnePlus. Key Developments
8.9.4 OnePlus. Products / Services
8.10 Hitachi Maxwell Ltd.
8.10.1 Hitachi Maxwell Ltd. Company Overview
8.10.2 Hitachi Maxwell Ltd. Business Performance
8.10.3 Hitachi Maxwell Ltd. Key Developments
8.10.4 Hitachi Maxwell Ltd. Products / Services
8.11 Other Power Bank Companies
9. Conclusions & Recommendations
10. Glossary
List of Tables
Table 1. Global Power Bank Market by Regional Market Forecast 2017-2027 (US$m, YOY %, Cumulative)
Table 2 Global Power Bank Type Submarket Forecast 2017-2027 (US$m, AGR%, CAGR%)
Table 3 Global Power Bank Type Submarket by Regional Market Forecast 2016-2026 (US$m, AGR%, CAGR%)
Table 4 Global Power Bank Battery Type Submarket Forecast 2017-2027 (US$m, AGR%, CAGR%)
Table 5 Global Power Bank Battery Type Submarket by Regional Market Forecast 2017-2027 (US$m, AGR%, CAGR%)
Table 6 Global Power Bank Power Rating Submarket Forecast 2017-2027 (US$m, AGR%, CAGR%)
Table 7 Global Power Bank Power Rating Submarket by Regional Market Forecast 2016-2026 (US$m, AGR%, CAGR%)
Table 8 North American Power Bank Market Forecast, By Type 2017-2027 (US$m, CAGR%)
Table 9 North American Power Bank Market Forecast, By Battery Type 2017-2027 (US$m, CAGR%)
Table 10 North American Power Bank Market Forecast, By Power Rating 2017-2027 (US$m, CAGR%)
Table 11 North American Power Bank Market Forecast, By Country 2017-2027 (US$m, AGR %, CAGR%)
Table 12 Europe Power Bank Market Forecast, By Type 2017-2027 (US$m, CAGR%)
Table 13 Europe Power Bank Market Forecast, By Battery Type 2017-2027 (US$m, CAGR%)
Table 14 Europe Power Bank Market Forecast, By Power Rating 2017-2027 (US$m, CAGR%)
Table 15 European Power Bank Market Forecast, By Country 2017-2027 (US$m, AGR%, CAGR%)
Table 16 Asia-Pacific Power Bank Market Forecast, By Type 2017-2027 (US$m, CAGR%)
Table 17 Asia-Pacific Power Bank Market Forecast, By Battery Type 2017-2027 (US$m, CAGR%)
Table 18 Asia-Pacific Power Bank Market Forecast, By Power Rating 2017-2027 (US$m, CAGR%)
Table 19 Asia-Pacific Power Bank Market Forecast, By Country 2017-2027 (US$m, AGR%, CAGR%)
Table 20 LAMEA Power Bank Market Forecast, By Type 2017-2027 (US$m, CAGR%)
Table 21 LAMEA Power Bank Market Forecast, By Battery Type 2017-2027 (US$m, CAGR%)
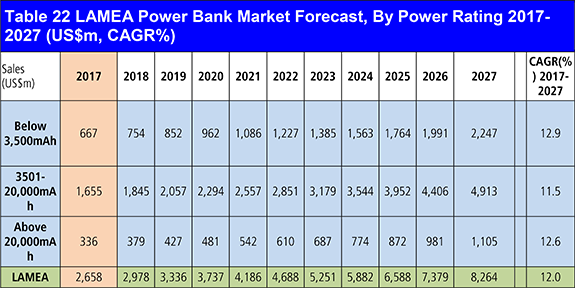
Table 22 LAMEA Power Bank Market Forecast, By Power Rating 2017-2027 (US$m, CAGR%)
Table 23 LAMEA Power Bank Market Forecast, By Country 2017-2027 (US$m, AGR%, CAGR %)
Table 24 Panasonic Corporation Company Profile 2015 (CEO, Total Company Sales US$m Net Income US$m, Strongest Business Region, Business Segment in the Market, Submarket Involvement, HQ, Founded, No. of Employees, IR Contact, Ticker, Website)
Table 25 Panasonic Corporation Products / Services
Table 26 Samsung Electronics Co. Ltd. Company Profile 2014 (CEO, Total Company Sales US$m, Net Income US$m, Strongest Business Region, Business Segment in the Market, Submarket Involvement, HQ, Founded, No. of Employees, Ticker, Website)
Table 27 Samsung Electronics Co., Ltd., Products / Services
Table 28 Microsoft Corporation Company Profile 2015 (CEO, Total Company Sales US$m, Net Income US$m, Strongest Business Region, Business Segment in the Market, Submarket Involvement, HQ, Founded, No. of Employees, IR Contact, Ticker, Website)
Table 29 Microsoft Corporation, Products / Services
Table 30 Apacer Technology Inc. Company Profile
Table 31 Microsoft Corporation, Products / Services
Table 32 Xiaomi Inc. Company Profile 2015
Table 33 Microsoft Corporation, Products / Services
Table 34 Sony Corporation Company Profile 2015 (CEO, Total Company Sales US$m, Net Income US$m, Strongest Business Region, Business Segment in the Market, HQ, Founded, No. of Employees, IR Contact, Ticker, Website)
Table 35 Microsoft Corporation Products / Services
Table 36 GP Batteries International Ltd. Company Profile 2015 (CEO, Total Company Sales US$m, Strongest Business Region, Business Segment in the Market, Submarket Involvement, HQ, Founded, No. of Employees, IR Contact, Ticker, Website)
Table 37 GP Batteries International Ltd., Products / Services
Table 38 Anker Technology Co. Ltd. Company Profile
Table 39 Anker Technology Co. Limited., Products /Services
Table 40 OnePlus Company Profile
Table 41 OnePlus, Products / Services
Table 42 Hitachi Maxwell Ltd. Company Profile 2015 (CEO, Total Company Sales US$m, Net Income US$m, Strongest Business Region, HQ, Founded, No. of Employees, Ticker, Website)
Table 43 Hitachi Maxwell Ltd., Products / Services
List of Figures
Figure 1. Power Bank Market by Regional Market Share Forecast 2017, 2022, 2027 (% Share)
Figure 2. Global Power Bank Market Segmentation Overview
Figure 3. Global Power Bank Market, By Type
Figure 4. Global Power Bank Market, By Power Rating
Figure 5. Global Power Bank Market, By Battery Type
Figure 6. Power Bank Market Drivers
Figure 7. Power Bank Market Restraints
Figure 8. Power Bank Market Opportunities
Figure 9. Porter’s Five Forces Analysis
Figure 10 Global Power Bank Portable Type Submarket Forecast 2017-2027 (US$m)
Figure 11 Global Power Bank Battery Case Type Submarket Forecast 2017-2027 (US$m)
Figure 12 Global Power Bank Solar Type Submarket Forecast 2017-2027(US$m)
Figure 13 North America Power Bank Portable Type Submarket Forecast 2017-2027(US$m)
Figure 14 Europe Power Bank Portable Type Submarket Forecast 2017-2027(US$m)
Figure 15 Asia-Pacific Power Bank Portable Type Submarket Forecast 2017-2027(US$m)
Figure 16 LAMEA Power Bank Portable Type Submarket Forecast 2017-2027(US$m)
Figure 17 North America Power Bank Battery Case Type Submarket Forecast 2017-2027(US$m)
Figure 18 Europe Power Bank Battery Case Type Submarket Forecast 2017-2027(US$m)
Figure 19 Asia-Pacific Power Bank Battery Case Type Submarket Forecast 2017-2027(US$m)
Figure 20 LAMEA Power Bank Battery Case Type Submarket Forecast 2017-2027(US$m)
Figure 21 North America Power Bank Solar Type Submarket Forecast 2017-2027(US$m)
Figure 22 Europe Power Bank Solar Type Submarket Forecast 2017-2027(US$m)
Figure 23 Asia-Pacific Power Bank Solar Type Submarket Forecast 2017-2027(US$m)
Figure 24 LAMEA Power Bank Solar Type Submarket Forecast 2017-2027(US$m)
Figure 25 Global Power Bank Type Submarket Share Forecast 2017 (% Share)
Figure 26 Global Power Bank Type Submarket Share Forecast 2022 (% Share)
Figure 27 Global Power Bank Type Submarket Share Forecast 2027 (% Share)
Figure 28 Global Power Bank Lithium-Ion Battery Type Submarket Forecast 2017-2027 (US$m)
Figure 29 Global Power Bank Lithium-Polymer Submarket Forecast 2017-2027 (US$m)
Figure 30 North America Power Bank Lithium-Ion Battery Type Submarket Forecast 2017-2027(US$m)
Figure 31 Europe Power Bank Lithium-Ion Battery Type Submarket Forecast 2017-2027(US$m)
Figure 32 Asia-Pacific Power Bank Lithium-Ion Battery Type Submarket Forecast 2017-2027(US$m)
Figure 33 LAMEA Power Bank Lithium-Ion Battery Type Submarket Forecast 2017-2027(US$m)
Figure 34 North America Power Bank Lithium-Polymer Battery Type Submarket Forecast 2017-2027(US$m)
Figure 35 Europe Power Bank Lithium-Polymer Battery Type Submarket Forecast 2017-2027(US$m)
Figure 36 Asia-Pacific Power Bank Lithium-Polymer Battery Type Submarket Forecast 2017-2027(US$m)
Figure 37 LAMEA Power Bank Lithium-Polymer Battery Type Submarket Forecast 2017-2027(US$m)
Figure 38 Global Power Bank Battery Type Submarket Share Forecast 2017 (% Share)
Figure 39 Global Power Bank Battery Type Submarket Share Forecast 2022 (% Share)
Figure 40 Global Power Bank Battery Type Submarket Share Forecast 2027 (% Share)
Figure 41 Global Power Bank Below 3,500mAh Power Rating Submarket Forecast 2017-2027 (US$m)
Figure 42 Global Power Bank 3,501-20,000mAh Power Rating Submarket Forecast 2017-2027 (US$m)
Figure 43 Global Power Bank Above 20,000mAh Power Rating Submarket Forecast 2017-2027 (US$m)
Figure 44 North America Power Bank Below 3,500mAh Power Rating Submarket Forecast 2017-2027(US$m)
Figure 45 Europe Power Bank Below 3,500mAh Power Rating Submarket Forecast 2017-2027(US$m)
Figure 46 Asia-Pacific Power Bank Below 3,500mAh Power Rating Submarket Forecast 2017-2027(US$m)
Figure 47 LAMEA Power Bank Below 3,500mAh Power Rating Submarket Forecast 2017-2027(US$m)
Figure 48 North America Power Bank 3,500-20,000mAh Power Rating Submarket Forecast 2017-2027(US$m)
Figure 49 Europe Power Bank 3,500-20,000mAh Power Rating Submarket Forecast 2017-2027(US$m)
Figure 50 Asia-Pacific Power Bank 3,500-20,000mAh Power Rating Submarket Forecast 2017-2027(US$m)
Figure 51 LAMEA Power Bank 3,500-20,000mAh Power Rating Submarket Forecast 2017-2027(US$m)
Figure 52 North America Power Bank Above 20,000mAh Power Rating Submarket Forecast 2017-2027(US$m)
Figure 53 Europe Power Bank Above 20,000mAh Power Rating Submarket Forecast 2017-2027(US$m)
Figure 54 Asia-Pacific Power Bank Above 20,000mAh Power Rating Submarket Forecast 2017-2027(US$m)
Figure 55 LAMEA Power Bank Above 20,000mAh Power Rating Submarket Forecast 2017-2027(US$m)
Figure 56 Global Power Bank Power Rating Submarket Share Forecast 2017 (% Share)
Figure 57 Global Power Bank Power Rating Submarket Share Forecast 2022 (% Share)
Figure 58 Global Power Bank Power Rating Submarket Share Forecast 2027 (% Share)
Figure 59 North American Power Bank Market Revenue, 2017-2027(US$m)
Figure 60 North American Power Bank Market Revenue, By Country, 2017-2027(US$m)
Figure 61 U.S. Power Bank Market Revenue, 2017-2027(US$m)
Figure 62 Canada Power Bank Market Revenue, 2017-2027(US$m)
Figure 63 Mexico Power Bank Market Revenue, 2017-2027(US$m)
Figure 64 European Power Bank Market Revenue, 2017-2027(US$m)
Figure 65 U.K. Power Bank Market Revenue, 2017-2027(US$m)
Figure 66 Germany Power Bank Market Revenue, 2017-2027(US$m)
Figure 67 France Power Bank Market Revenue, 2017-2027(US$m)
Figure 68 Russia Power Bank Market Revenue, 2017-2027(US$m)
Figure 69 Rest of Europe Power Bank Market Revenue, 2017-2027(US$m)
Figure 70 Asia-Pacific Power Bank Market Revenue, 2017-2027(US$m)
Figure 71 China Power Bank Market Revenue, 2017-2027(US$m)
Figure 72 India Power Bank Market Revenue, 2017-2027(US$m)
Figure 73 Japan Power Bank Market Revenue, 2017-2027(US$m)
Figure 74 Australia Power Bank Market Revenue, 2017-2027(US$m)
Figure 75 Rest of Asia-Pacific Power Bank Market Revenue, 2017-2027(US$m)
Figure 76 LAMEA Power Bank Market Revenue, 2017-2027(US$m)
Figure 77 Latin America Power Bank Market Revenue, 2017-2027(US$m)
Figure 78 Middle East Power Bank Market Revenue, 2017-2027(US$m)
Figure 79 Africa Power Bank Market Revenue, 2017-2027(US$m)
Figure 80 Panasonic Corporation, Net Sales, 2013-2015
Figure 81 Panasonic Corporation, Business Segment, 2015(%)
Figure 82 Samsung Electronics Co., Ltd., Net Sales, 2012-2014
Figure 83 Samsung Electronics Co., Ltd., Business Segment, 2014(%)
Figure 84 Samsung Electronics Co., Ltd., Geography, 2014(%)
Figure 85 Microsoft Corporation, Net Sales, 2012-2015
Figure 86 Microsoft Corporation, Business Segment, 2015(%)
Figure 87 Microsoft Corporation, Geography, 2015(%)
Figure 88 Sony Corporation, Net Sales, 2013-2015
Figure 89 Sony Corporation, Business Segment, 2015(%)
Figure 90 Sony Corporation, Geography, 2015(%)
Figure 91 GP Batteries International Ltd., Net Sales, 2012-2015
Figure 92 GP Batteries International Ltd., Business Segment, 2015(%)
Figure 93 GP Batteries International Ltd., Geography, 2015(%)
Figure 94 Hitachi Maxwell Ltd., Net Sales, 2012-2015
Figure 95 Hitachi Maxwell Ltd, Geography, 2015(%)