Visiongain has calculated that the global Cryogenic Pump market will see a capital expenditure (CAPEX) of $1,842 mn in 2018. Read on to discover the potential business opportunities available.
The cryogenic pump or cryopump is a high-speed vacuum pump that use cryogenic temperatures to produce vacuum through condensation of vapours and gases on a cold surface.
It functions at a wide range of temperatures ranging from 80K to sub kelvin levels and offers advantages towards the development of clean vacuum spaces, low contamination by hydrocarbons in the semiconductor industry, the creation of adequate space for pumping and high pumping speed.
The Cryogenic Pump technology was first introduced in the 1950s for large-scale applications which mainly included those with liquid hydrogen. Cryogenic pump can be readily used in a large number of applications including energy and power, chemicals, metals, electronics. shipping, food and beverages, aerospace, healthcare and infrastructure.
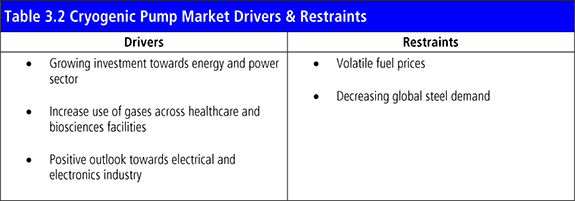
The cryogenic pump market is mainly driven by the factors including growing investment towards energy and power sector, increase use of gases across healthcare and bioscience facilities and positive outlook towards electrical and electronics industry. Rising investments in electricity and oil and gas sectors are expected to fuel growth in cryogenic pump market. The market will be further influenced by upcoming government policies to curb carbon emissions and encourage clean domestic and commercial fuel alternative to enhance demand for renewable-based power generation
Visiongain’s global Cryogenic Pump market report can keep you informed and up to date with the developments in the market, across five different regions: North America, Europe, Middle East & Africa, Asia Pacific and Latin America.
With reference to this report, it details the key investments trend in the global market, subdivided by regions, capital expenditure and application. Through extensive secondary research and interviews with industry experts, visiongain has identified a series of market trends that will impact the Cryogenic Pump market over the forecast timeframe.
The report will answer questions such as:
– How is the Cryogenic Pump market evolving?
– What is driving and restraining Cryogenic Pump market dynamics?
– How will each Cryogenic Pump submarket segment grow over the forecast period and how much Sales will these submarkets account for in 2028?
– How will market shares of each Cryogenic Pump submarket develop from 2018-2028?
– Which individual technologies will prevail and how will these shifts be responded to?
– Which Cryogenic Pump submarket will be the main driver of the overall market from 2018-2028?
– How will political and regulatory factors influence regional Cryogenic Pump markets and submarkets?
– Will leading national Cryogenic Pump market broadly follow macroeconomic dynamics, or will individual country sectors outperform the rest of the economy?
– How will market shares of the national markets change by 2028 and which nation will lead the market in 2028?
– Who are the leading players and what are their prospects over the forecast period?
– How will the sector evolve as alliances form during the period between 2018 and 2028?
Five Reasons Why You Must Order and Read This Report Today:
1) The report provides forecasts for the global Cryogenic Pump market by Application, for the period 2018-2028
– Energy and Power CAPEX 2018-2028
– Chemical CAPEX 2018-2028
– Metal CAPEX 2018-2028
– Electronics CAPEX 2018-2028
– Other CAPEX 2018-2028
2) The report also forecasts and analyses the Cryogenic Pump market by Region from 2018-2028
North America
– United States CAPEX 2018-2028
– Canada CAPEX 2018-2028
– Mexico CAPEX 2018-2028
Asia Pacific
– China CAPEX 2018-2028
– Japan CAPEX 2018-2028
– India CAPEX 2018-2028
– Rest of Asia Pacific CAPEX 2018-2028
Europe
– UK CAPEX 2018-2028
– France CAPEX 2018-2028
– Germany CAPEX 2018-2028
– Rest of Europe CAPEX 2018-2028
Middle East and Africa
– Saudi Arabia CAPEX 2018-2028
– UAE CAPEX 2018-2028
– South Africa CAPEX 2018-2028
– Rest of the Middle East and Africa CAPEX 2018-2028
Latin America
– Brazil CAPEX 2018-2028
– Argentina CAPEX 2018-2028
– Rest of Latin America CAPEX 2018-2028
3) The report reveals the Drivers and Restraints in the Cryogenic Pump market
4) The report includes SWOT and PEST Analysis affecting the Cryogenic Pump market
5) The report provides detailed profiles of the leading companies operating within the Cryogenic Pump market:
– Sumitomo Heavy Industries, Ltd.
– Ebara Corporation
– Flowserve Corporation
– Fives Group
– Brooks Automation, Inc.
– Nikkiso Co. Ltd.
– Linde Group
– ULVAC Inc.
– KSB Group
– Trillium US
This independent 150-page report guarantees you will remain better informed than your competitors. With 140 tables and figures examining the Cryogenic Pump market space, the report gives you a direct, detailed breakdown of the market. PLUS, Capital expenditure by application and region, as well as in-Depth analysis of leading companies in the Cryogenic Pump market from 2018-2028 that will keep your knowledge that one step ahead of your rivals.
This report is essential reading for you or anyone in the Energy sector. Purchasing this report today will help you to recognise those important market opportunities and understand the possibilities there. I look forward to receiving your order.
Visiongain is a trading partner with the US Federal Government
CCR Ref number: KD4R6
1. Report Overview
1.1 Global Cryogenic Pump Market Overview
1.2 Why You Should Read This Report
1.3 How This Report Delivers
1.4 Key Questions Answered by This Analytical Report Include:
1.5 Who is This Report For?
1.6 Methodology
1.6.1 Primary Research
1.6.2 Secondary Research
1.6.3 Market Evaluation & Forecasting Methodology
1.7 Frequently Asked Questions (FAQ)
1.8 Associated Visiongain Reports
1.9 About Visiongain
2. Introduction to the Cryogenic Pump Market
2.1 Cryogenic Pump Market Definition
2.2 Brief History of Cryogenic Pump
2.3 Cryogenic Pump Market Structure
3. Global Cryogenic Pump Market 2018-2028
3.1 Global Cryogenic Pump Market Forecast 2018-2028
3.2 Cryogenic Pump Market Drivers & Restraints 2018
3.2.1 Drivers in the Cryogenic Pump Market
3.2.1.1 Growing Investment Towards Energy and Power Sector
3.2.1.2 Increase Use of Gases Across Healthcare and Biosciences Facilities
3.2.1.3 Positive Outlook Towards Electrical and Electronics Industry
3.2.2 Restraints in the Cryogenic Pump Market
3.2.2.1 Volatile Fuel Prices
3.2.2.2 Decreasing Global Steel Production
4. Global Cryogenic Pump Market By Application Forecast 2018-2028
4.1 Global Cryogenic Pump Market By Energy and Power Application Forecast 2018-2028
4.2 Global Cryogenic Pump Market By Chemical Application Forecast 2018-2028
4.3 Global Cryogenic Pump Market By Metal Application Forecast 2018-2028
4.4 Global Cryogenic Pump Market By Electronics Application Forecast 2018-2028
4.5 Global Cryogenic Pump Market By Other Application Forecast 2018-2028
5. Leading Regional and National Cryogenic Pump Market Forecast 2018-2028
5.1 North America Cryogenic Pump Market Forecast 2018-2028
5.1.1 The US Cryogenic Pump Market Forecast 2018-2028
5.1.2 Canada Cryogenic Pump Market Forecast 2018-2028
5.1.3 Mexico Cryogenic Pump Market Forecast 2018-2028
5.2 Europe Cryogenic Pump Market Forecast 2018-2028
5.2.1 Germany Cryogenic Pump Market Forecast 2018-2028
5.2.2 The UK Cryogenic Pump Market Forecast 2018-2028
5.2.3 France Cryogenic Pump Market Forecast 2018-2028
5.2.4 Rest of Europe Cryogenic Pump Market Forecast 2018-2028
5.3 Asia Pacific Cryogenic Pump Market Forecast 2018-2028
5.3.1 China Cryogenic Pump Market Forecast 2018-2028
5.3.2 Japan Cryogenic Pump Market Forecast 2018-2028
5.3.3 India Cryogenic Pump Market Forecast 2018-2028
5.3.4 Rest of Asia Pacific Cryogenic Pump Market Forecast 2018-2028
5.4 Middle East and Africa Cryogenic Pump Market Forecast 2018-2028
5.4.1 Saudi Arabia Cryogenic Pump Market Forecast 2018-2028
5.4.2 UAE Cryogenic Pump Market Forecast 2018-2028
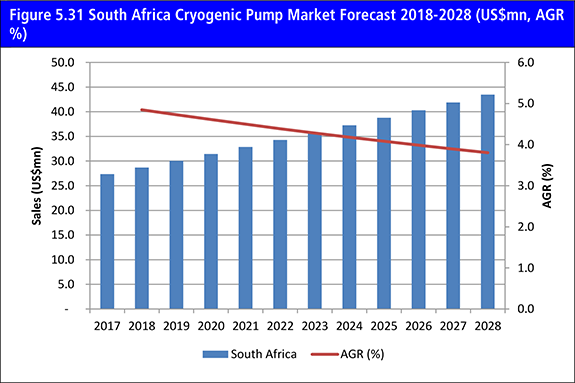
5.4.3 South Africa Cryogenic Pump Market Forecast 2018-2028
5.4.4 Rest of the Middle East and Africa Cryogenic Pump Market Forecast 2018-2028
5.5 Latin America Cryogenic Pump Market Forecast 2018-2028
5.5.1 Brazil Cryogenic Pump Market Forecast 2018-2028
5.5.2 Argentina Cryogenic Pump Market Forecast 2018-2028
5.5.3 Rest of Latin America Cryogenic Pump Market Forecast 2018-2028
6. SWOT Analysis of the Cryogenic Pump Market 2018-2028
6.1 Strengths
6.2 Weaknesses
6.3 Opportunities
6.4 Threats
7. PEST Analysis of the Cryogenic Pump Market 2018-2028
7.1 PEST Analysis
8. The Leading Companies in the Cryogenic Pump Market
8.1 Sumitomo Heavy Industries, Ltd.
8.1.1 Sumitomo Heavy Industries Ltd. Total Company Sales 2011-2016
8.1.2 Sumitomo Heavy Industries Ltd. Sales in the Cryogenic Pump Market 2011-2016
8.2 Ebara Corporation
8.2.1 Ebara Corporation Plc Total Company Sales 2011-2016
8.3 Flowserve Corporation
8.3.1 Flowserve Corporation Total Company Sales 2013-2016
8.3.2 Flowserve Corporation Sales in the Cryogenic Pump Market 2011-2016
8.4 Fives Group
8.4.1 Fives Group Total Company Sales 2011-2016
8.4.2 Fives Group Sales in the Cryogenic Pump Market 2011-2016
8.5 Brooks Automation, Inc.
8.5.1 Brooks Automation, Inc. Total Company Sales 2011-2016
8.5.2 Brooks Automation, Inc. Sales in the Cryogenic Pump Market 2011-2016
8.6 Nikkiso Co. Ltd.
8.6.1 Nikkiso Co. Ltd. Total Company Sales 2011-2016
8.6.2 Nikkiso Co. Ltd. Sales in the Cryogenic Pump Market 2011-2016
8.7 Linde Group
8.7.1 Linde Group Total Company Sales 2011-2016
8.7.2 Linde Group Sales in the Cryogenic Pump Market 2011-2016
8.8 ULVAC Inc.
8.8.1 ULVAC Inc. Total Company Sales 2011-2016
8.8.2 ULVAC Inc. Sales in the Cryogenic Pump Market 2011-2016
8.9 KSB Group
8.9.1 KSB Group Total Company Sales 2011-2016
8.9.2 KSB Group Sales in the Cryogenic Pump Market 2012-2016
8.10 Trillium US
9. Conclusions and Recommendations
9.1 Key Findings
9.2 Recommendations
10. Glossary
Appendix
Associated Visiongain Reports
Visiongain Report Sales Order Form
Appendix A
Appendix B
Visiongain Report Evaluation Form
List of Tables
Table 1.1 Leading Regional Cryogenic Pump Market Forecast 2018-2028 (US$mn, Global AGR %, Cumulative)
Table 1.2 Global Cryogenic Pump Market By Application Forecast 2018-2028 (US$mn, AGR %, CAGR %, Cumulative)
Table 3.1 Global Cryogenic Pump Market Forecast 2018-2028 (US$mn, AGR %, CAGR %, Cumulative)
Table 3.2 Cryogenic Pump Market Drivers & Restraints
Table 4.1 Global Cryogenic Pump Market By Application Forecast 2018-2028 (US$mn, AGR %, Cumulative)
Table 4.2 Global Cryogenic Pump Market By Application CAGR Forecast 2018-2023, 2023-2028, 2018-2028 (CAGR %)
Table 4.3 Global Cryogenic Pump Market By Energy and Power Application Forecast 2018-2028 (US$mn, AGR %, CAGR %, Cumulative)
Table 4.4 Global Cryogenic Pump Market By Chemical Application Forecast 2018-2028 (US$mn, AGR %, CAGR %, Cumulative)
Table 4.5 Global Cryogenic Pump Market By Metal Application Forecast 2018-2028 (US$mn, AGR %, CAGR %, Cumulative)
Table 4.6 Global Cryogenic Pump Market By Electronics Application Forecast 2018-2028 (US$mn, AGR %, CAGR %, Cumulative)
Table 4.7 Global Cryogenic Pump Market By Other Application Forecast 2018-2028 (US$mn, AGR %, CAGR %, Cumulative)
Table 5.1 Leading Regional Cryogenic Pump Market Forecast 2018-2028 (US$mn, Global AGR %, Cumulative)
Table 5.2 Regional Cryogenic Pump Market Percentage Change in Market Share 2018-2023, 2023-2028, 2018-2028 (% Change)
Table 5.3 North America Cryogenic Market by Country Forecast 2018-2028 (US$mn, AGR %, CAGR %, Cumulative)
Table 5.4 The U.S. Cryogenic Pump Market Forecast 2018-2028 (US$mn, AGR %, CAGR %, Cumulative)
Table 5.5 Canada Cryogenic Pump Market Forecast 2018-2028 (US$mn, AGR %, CAGR %, Cumulative)
Table 5.6 Mexico Cryogenic Pump Market Forecast 2018-2028 (US$mn, AGR %, CAGR %, Cumulative)
Table 5.7 Europe Cryogenic Pump Market by Country Forecast 2018-2028 (US$mn, AGR %, CAGR %, Cumulative)
Table 5.8 Germany Cryogenic Pump Market Forecast 2018-2028 (US$mn, AGR %, CAGR %, Cumulative)
Table 5.9 The UK Cryogenic Pump Market Forecast 2018-2028 (US$mn, AGR %, CAGR %, Cumulative)
Table 5.10 France Cryogenic Pump Market Forecast 2018-2028 (US$mn, AGR %, CAGR %, Cumulative)
Table 5.11 Rest of Europe Cryogenic Pump Market Forecast 2018-2028 (US$mn, AGR %, CAGR %, Cumulative)
Table 5.12 Asia Pacific Cryogenic Pump Market by Country Forecast 2018-2028 (US$mn, AGR %, CAGR %, Cumulative)
Table 5.13 China Cryogenic Pump Market Forecast 2018-2028 (US$mn, AGR %, CAGR %, Cumulative)
Table 5.14 Japan Cryogenic Pump Market Forecast 2018-2028 (US$mn, AGR %, CAGR %, Cumulative)
Table 5.15 India Cryogenic Pump Market Forecast 2018-2028 (US$mn, AGR %, CAGR %, Cumulative)
Table 5.16 Rest of Asia Pacific Cryogenic Pump Market Forecast 2018-2028 (US$mn, AGR %, CAGR %, Cumulative)
Table 5.17 Middle East & Africa Cryogenic Pump Market by Country Forecast 2018-2028 (US$mn, AGR %, CAGR %, Cumulative)
Table 5.18 Saudi Arabia Cryogenic Pump Market Forecast 2018-2028 (US$mn, AGR %, CAGR %, Cumulative)
Table 5.19 UAE Cryogenic Pump Market Forecast 2018-2028 (US$mn, AGR %, CAGR %, Cumulative)
Table 5.20 South Africa Cryogenic Pump Market Forecast 2018-2028 (US$mn, AGR %, CAGR %, Cumulative)
Table 5.21 Rest of the Middle East and Africa Cryogenic Pump Market Forecast 2018-2028 (US$mn, AGR %, CAGR %, Cumulative)
Table 5.22 Latin America Cryogenic Pump Market by Country Forecast 2018-2028 (US$mn, AGR %, CAGR %, Cumulative)
Table 5.23 Brazil Cryogenic Pump Market Forecast 2018-2028 (US$mn, AGR %, CAGR %, Cumulative)
Table 5.24 Argentina Cryogenic Pump Market Forecast 2018-2028 (US$mn, AGR %, CAGR %, Cumulative)
Table 5.25 Rest of Latin America Cryogenic Pump Market Forecast 2018-2028 (US$mn, AGR %, CAGR %, Cumulative)
Table 6.1 Global Cryogenic Pump Market SWOT Analysis 2018-2028
Table 7.1 Global Cryogenic Pump Market PEST Analysis 2018-2028
Table 8.1 Sumitomo Heavy Industries Ltd. 2016 (CEO, Total Company Sales US$m, Sales from Company Division that includes Cryogenic Pump US$m, Share of Total Company Sales from Company Division that includes Cryogenic Pump %, Net Income / Loss US$m, Net Capital Expenditure US$m, Strongest Business Region, Business Segment in the Market, HQ, Founded, No. of Employees, IR Contact, Ticker, Website)
Table 8.2 Sumitomo Heavy Industries Ltd. Total Company Sales 2010-2016 (US$m, AGR %)
Table 8.3 Sumitomo Heavy Industries Ltd. Sales in the Cryogenic Pump Market 2010-2016 (US$m, AGR %)
Table 8.4 Ebara Corporation Plc 2016 (CEO, Total Company Sales US$m, Sales in the Market US$m, Share of Company Sales from Cryogenic Pump Market %, Net Income / Loss US$m, Net Capital Expenditure US$m, Strongest Business Region, Business Segment in the Market, HQ, Founded, No. of Employees, IR Contact, Ticker, Website)
Table 8.5 Ebara Corporation Plc Total Company Sales 2010-2016 (US$m, AGR %)
Table 8.6 Flowserve Corporation 2016 (CEO, Total Company Sales US$m, Sales from Company Division that includes Cryogenic Pump US$m, Share of Total Company Sales from Company Division that includes Cryogenic Pump %, Net Income / Loss US$m, Net Capital Expenditure US$m, Strongest Business Region, Business Segment in the Market, HQ, Founded, No. of Employees, IR Contact, Ticker, Website)
Table 8.7 Flowserve Corporation Total Company Sales 2012-2016 (US$m, AGR %)
Table 8.8 Flowserve Corporation Sales in the Cryogenic Pump Market 2010-2016 (US$m, AGR %)
Table 8.9 Fives Group 2016 (CEO, Total Company Sales US$m, Sales from Company Division that includes Cryogenic Pump US$m, Share of Total Company Sales from Company Division that includes Cryogenic Pump %, Net Income / Loss US$m, Net Capital Expenditure US$m, Strongest Business Region, Business Segment in the Market, HQ, Founded, No. of Employees, IR Contact, Ticker, Website)
Table 8.10 Fives Group Total Company Sales 2010-2016 (US$m, AGR %)
Table 8.11 Fives Group Sales in the Cryogenic Pump Market 2011-2016 (US$m, AGR %)
Table 8.12 Brooks Automation, Inc. Profile 2016 (CEO, Total Company Sales US$m, Sales from Company Division that includes Cryogenic Pump US$m, Share of Total Company Sales from Company Division that includes Cryogenic Pump %, Net Income / Loss US$m, Net Capital Expenditure US$m, Strongest Business Region, Business Segment in the Market, HQ, Founded, No. of Employees, IR Contact, Ticker, Website)
Table 8.13 Brooks Automation, Inc. Total Company Sales 2010-2016 (US$m, AGR %)
Table 8.14 Brooks Automation, Inc. Sales in the Cryogenic Pump Market 2010-2016 (US$m, AGR %)
Table 8.15 Nikkiso Co. Ltd. 2016 (CEO, Total Company Sales US$m, Sales from Company Division that includes Cryogenic Pump US$m, Share of Total Company Sales from Company Division that includes Cryogenic Pump %, Net Income / Loss US$m, Net Capital Expenditure US$m, Strongest Business Region, Business Segment in the Market, HQ, Founded, No. of Employees, IR Contact, Ticker, Website)
Table 8.16 Nikkiso Co. Ltd. Total Company Sales 2010-2016 (US$m, AGR %)
Table 8.17 Nikkiso Co. Ltd. Sales in the Cryogenic Pump Market 2010-2016 (US$m, AGR %)
Table 8.18 Linde Group 2016 (CEO, Total Company Sales US$m, Sales from Company Division that includes Cryogenic Pump US$m, Share of Total Company Sales from Company Division that includes Cryogenic Pump %, Net Income / Loss US$m, Net Capital Expenditure US$m, Strongest Business Region, Business Segment in the Market, HQ, Founded, No. of Employees, IR Contact, Ticker, Website)
Table 8.19 Linde Group Total Company Sales 2010-2016 (US$m, AGR %)
Table 8.20 Linde Group Sales in the Cryogenic Pump Market 2010-2016 (US$m, AGR %)
Table 8.21 Ulvac Inc. 2016 (CEO, Total Company Sales US$m, Sales from Company Division that includes Cryogenic Pump US$m, Share of Total Company Sales from Company Division that includes Cryogenic Pump %, Net Income / Loss US$m, Net Capital Expenditure US$m, Strongest Business Region, Business Segment in the Market, HQ, Founded, No. of Employees, IR Contact, Ticker, Website)
Table 8.22 ULVAC Inc. Total Company Sales 2010-2016 (US$m, AGR %)
Table 8.23 ULVAC Inc. Sales in the Cryogenic Pump Market 2010-2016 (US$m, AGR %)
Table 8.24 KSB Group 2016 (CEO, Total Company Sales US$m, Sales in the Market US$m, Share of Company Sales from Cryogenic Pump Market %, Net Income / Loss US$m, Net Capital Expenditure US$m, Strongest Business Region, Business Segment in the Market, HQ, Founded, No. of Employees, IR Contact, Ticker, Website)
Table 8.25 KSB Group Total Company Sales 2010-2016 (US$m, AGR %)
Table 8.26 KSB Group Sales in the Cryogenic Pump Market 2011-2016 (US$m, AGR %)
Table 8.27 Trillium US 2016 (CEO, Total Company Sales US$m, Sales in the Market US$m, Share of Company Sales from Cryogenic Pump Market %, Net Income / Loss US$m, Net Capital Expenditure US$m, Strongest Business Region, Business Segment in the Market, HQ, Founded, No. of Employees, IR Contact, Ticker, Website)
Table 9.1 Global Cryogenic Pump Market By Application Forecast 2018-2028 (US$mn, AGR %, Cumulative)
Table 9.2 Leading Regional Cryogenic Pump Market Forecast 2018-2028 (US$mn, Global AGR %, Cumulative)
List of Figures
Figure 2.1 Global Cryogenic Pump Market Segmentation Overview
Figure 3.1 Global Cryogenic Pump Market Forecast 2018-2028 (US$mn, AGR %)
Figure 3.2 Global Energy Investment by Sector 2016 (US$bn)
Figure 4.1 Global Cryogenic Pump Market By Application AGR Forecast 2018-2028 (AGR %)
Figure 4.2 Global Cryogenic Pump Market By Application Forecast 2018-2028 (US$mn, Global AGR %)
Figure 4.3 Global Cryogenic Pump Market By Application Share Forecast 2018 (% Share)
Figure 4.4 Global Cryogenic Pump Market By Application Share Forecast 2023 (% Share)
Figure 4.5 Global Cryogenic Pump Market By Application Share Forecast 2028 (% Share)
Figure 4.6 Global Cryogenic Pump Market By Energy and Power Application Forecast 2018-2028 (US$mn, Global AGR %)
Figure 4.7 Share of the Energy and Power Application in Global Cryogenic Pump Market 2018-2028 (%)
Figure 4.8 Global Cryogenic Pump Market By Chemical Application Forecast 2018-2028 (US$mn, Global AGR %)
Figure 4.9 Share of the Chemical Application in Global Cryogenic Pump Market 2018-2028 (%)
Figure 4.10 Global Cryogenic Pump Market By Metal Application Forecast 2018-2028 (US$mn, Global AGR %)
Figure 4.11 Share of the Metal Application in Global Cryogenic Pump Market 2018-2028 (%)
Figure 4.12 Global Cryogenic Pump Market By Electronics Application Forecast 2018-2028 (US$mn, Global AGR %)
Figure 4.13 Share of the Electronics Application in Global Cryogenic Pump Market 2018-2028 (%)
Figure 4.14 Global Cryogenic Pump Market By Other Application Forecast 2018-2028 (US$mn, Global AGR %)
Figure 4.15 Share of the Energy and Power Application in Global Cryogenic Pump Market 2018-2028 (%)
Figure 5.1 Global Cryogenic Pump Market by Region Market Forecast 2018-2028 (US$mn, Global AGR %)
Figure 5.2 Global Cryogenic Pump Market by Region Market AGR Forecast 2018-2028 (AGR %)
Figure 5.3 Global Cryogenic Pump Market by Regional Market Share Forecast 2018 (% Share)
Figure 5.4 Global Cryogenic Pump Market by Regional Market Share Forecast 2023 (% Share)
Figure 5.5 Global Cryogenic Pump Market by Regional Market Share Forecast 2028 (% Share)
Figure 5.6 North America Cryogenic Pump Market by Country AGR Forecast 2018-2028 (AGR %)
Figure 5.7 North America Cryogenic Pump Market by Country Forecast 2018-2028 (US$mn, North America Total Market Sales AGR %)
Figure 5.8 North America Cryogenic Pump Market Share by Country Forecast 2018, 2023, 2028 (% Share)
Figure 5.9 U.S. Cryogenic Pump Market Forecast 2018-2028 (US$mn, AGR %)
Figure 5.10 Canada Cryogenic Pump Market Forecast 2018-2028 (US$mn, AGR %)
Figure 5.11 Mexico Cryogenic Pump Market Forecast 2018-2028 (US$mn, AGR %)
Figure 5.12 Europe Cryogenic Pump Market by Country AGR Forecast 2018-2028 (AGR %)
Figure 5.13 Europe Cryogenic Pump Market by Country Forecast 2018-2028 (US$mn, Europe Total Market Sales AGR %)
Figure 5.14 Europe Cryogenic Pump Market Share by Country Forecast 2018, 2023, 2028 (% Share)
Figure 5.15 Germany Cryogenic Pump Market Forecast 2018-2028 (US$mn, AGR %)
Figure 5.16 The UK Cryogenic Pump Market Forecast 2018-2028 (US$mn, AGR %)
Figure 5.17 France Cryogenic Pump Market Forecast 2018-2028 (US$mn, AGR %)
Figure 5.18 Rest of Europe Cryogenic Pump Market Forecast 2018-2028 (US$mn, AGR %)
Figure 5.19 Asia Pacific Cryogenic Pump Market by Country AGR Forecast 2018-2028 (AGR %)
Figure 5.20 Asia Pacific Cryogenic Pump Market by Country Forecast 2018-2028 (US$mn, Asia Pacific Total Market Sales AGR %)
Figure 5.21 Asia Pacific Cryogenic Pump Market Share by Country Forecast 2018, 2023, 2028(% Share)
Figure 5.22 China Cryogenic Pump Market Forecast 2018-2028 (US$mn, AGR %)
Figure 5.23 Japan Cryogenic Pump Market Forecast 2018-2028 (US$mn, AGR %)
Figure 5.24 India Cryogenic Pump Market Forecast 2018-2028 (US$mn, AGR %)
Figure 5.25 Rest of Asia Pacific Cryogenic Pump Market Forecast 2018-2028 (US$mn, AGR %)
Figure 5.26 Middle East and Africa Cryogenic Pump Market by Country AGR Forecast 2018-2028 (AGR %)
Figure 5.27 Middle East and Africa Cryogenic Pump Market by Country Forecast 2018-2028 (US$mn, Middle East and Africa Total Market Sales AGR %)
Figure 5.28 Middle East and Africa Cryogenic Pump Market Share By Country Forecast 2018, 2023, 2028 (% Share)
Figure 5.29 Saudi Arabia Cryogenic Pump Market Forecast 2018-2028 (US$mn, AGR %)
Figure 5.30 UAE Cryogenic Pump Market Forecast 2018-2028 (US$mn, AGR %)
Figure 5.31 South Africa Cryogenic Pump Market Forecast 2018-2028 (US$mn, AGR %)
Figure 5.32 Rest of the Middle East and Africa Cryogenic Pump Market Forecast 2018-2028 (US$mn, AGR %)
Figure 5.33 Latin America Cryogenic Pump Market by Country AGR Forecast 2018-2028 (AGR %)
Figure 5.34 Latin America Cryogenic Pump Market by Country Forecast 2018-2028 (US$mn, Latin America Total Market Sales AGR %)
Figure 5.35 Latin America Cryogenic Pump Market Share by Country Forecast 2018, 2023, 2028 (% Share)
Figure 5.36 Brazil Cryogenic Pump Market Forecast 2018-2028 (US$mn, AGR %)
Figure 5.37 Argentina Cryogenic Pump Market Forecast 2018-2028 (US$mn, AGR %)
Figure 5.38 Rest of Latin America Cryogenic Pump Market Forecast 2018-2028 (US$mn, AGR %)
Figure 8.1 Sumitomo Heavy Industries Ltd. Total Company Sales 2011-2016 (US$m, AGR %)
Figure 8.2 Sumitomo Heavy Industries Ltd. Sales in the Cryogenic Pump Market 2011-2016 (US$m, AGR %)
Figure 8.3 Ebara Corporation Plc Total Company Sales 2011-2016 (US$m, AGR %)
Figure 8.4 Flowserve Corporation Total Company Sales 2013-2016 (US$m, AGR %)
Figure 8.5 Flowserve Corporation Sales in the Cryogenic Pump Market 2011-2016 (US$m, AGR %)
Figure 8.6 Fives Group Total Company Sales 2011-2016 (US$m, AGR %)
Figure 8.7 Fives Group Sales in the Cryogenic Pump Market 2011-2016 (US$m, AGR %)
Figure 8.8 Brooks Automation, Inc. Total Company Sales 2011-2016 (US$m, AGR %)
Figure 8.9 Brooks Automation, Inc. Sales in the Cryogenic Pump Market 2011-2016 (US$m, AGR %)
Figure 8.10 Nikkiso Co. Ltd. Company Sales 2011-2016 (US$m, AGR %)
Figure 8.11 Nikkiso Co. Ltd. Sales in the Cryogenic Pump Market 2011-2016 (US$m, AGR %)
Figure 8.12 Linde Group Company Sales 2011-2016 (US$m, AGR %)
Figure 8.13 Linde Group Sales in the Cryogenic Pump Market 2011-2016 (US$m, AGR %)
Figure 8.14 ULVAC Inc. Company Sales 2011-2016 (US$m, AGR %)
Figure 8.15 ULVAC Inc. Sales in the Cryogenic Pump Market 2011-2016 (US$m, AGR %)
Figure 8.16 KSB Group Company Sales 2011-2016 (US$m, AGR %)
Figure 8.17 KSB Group Sales in the Cryogenic Pump Market 2012-2016 (US$m, AGR %)