The world cancer-treating drugs market is expected to grow at a CAGR of 6.6% in the second half of the forecast period. The market reached $102bn in 2016, dominated by the immunotherapy segment which held 44.1% share of the market.
How this report will benefit you
Read on to discover how you can exploit the future business opportunities emerging in this sector.
In this brand new 194-page report you will receive 110 tables and 101 figures – all unavailable elsewhere.
The 194-page report provides clear detailed insight into the world cancer-treating drugs market. Discover the key drivers and challenges affecting the market.
By ordering and reading our brand-new report today you stay better informed and ready to act.
Report Scope
• World cancer-treating drugs market forecasts from 2017-2027
• This report also breaks down the revenue forecast for the world cancer-treating drugs market by its leading segments:
– Immunotherapy
– Chemotherapy
– Targeted Therapy
– Hormone Therapy
Each sector is analysed and revenue forecasts presented.
• This report discusses and forecasts revenues of the top 25 anti-cancer drugs:
– Avastin
– Herceptin
– Rituxan
– Gleevec
– Revlimid
– Alimta
– Velcade
– Erbitux
– Gardasil
– Zytiga
– Xeloda
– Tarceva
– Afinitor
– Sprycel
– Tasigna
– Sutent
– Nexavar
– Xgeva
– Zoladex
– Yervoy
– Vidaza
– Treanda
– Temodar
– Faslodex
– Abraxane
– Others
• This report provides individual revenue forecasts to 2027 for these regional and national markets:
– North America: US, Canada, Mexico
– South America: Brazil, Argentina, Paraguay, Brazil, Rest of South America
– Europe: The UK, Germany, France, Spain, Italy, Rest of Europe
– Asia-Pacific: China, Japan, India, Australia, Thailand, Rest of Asia-Pacific
– Rest of World: Middle East, Africa, Other Countries
• This report discusses trends in the industry and assesses strengths and weaknesses, as well as opportunities and threats (SWOT). It also analyses social, technological, economic and political factors (STEP) that influence the cancer-treating drugs market
• Our study discusses the selected leading companies that are the major players in the cancer-treating drugs market:
– AstraZeneca
– Merck & Co., Inc. (Merck)
– Novartis
– Amgen
– Bristol-Myers Squibb (BMS)
– GlaxoSmithKline (GSK)
– Johnson & Johnson (J&J)
– Roche
– Eli Lilly
– Celgene
The report provides overviews of the companies, financial information, product portfolio, pipeline products and recent developments.
Visiongain’s study is intended for anyone requiring commercial analyses for the world cancer-treating drugs market. You find data, trends and predictions.
Buy our report today World Cancer-Treating Drugs Market Forecast 2017-2027: Immunotherapy, Chemotherapy, Targeted Therapy, Hormone Therapy, Leading Drugs.
Visiongain is a trading partner with the US Federal Government
CCR Ref number: KD4R6
1 Report Overview
1.1 Global Cancer-Treating Drugs Overview
1.2 Research Methodology
1.2.1 Primary Research
1.2.2 Secondary Research
1.3 Market Evaluation & Forecasting Methodology
1.4 Global Cancer-Treating Drugs Market Segmentation
1.4.1 Global Top 25 Cancer Treating Drug Market
1.5 Overview of Findings
1.6 Why You Should Read This Report
1.7 How this report delivers?
1.8 Key Questions Answered by This Analytical Report
1.9 Frequently Asked Questions (FAQ)
1.10 Who is This Report For?
1.11 Associated Visiongain Reports
1.12 About Visiongain
2 Introduction to Cancer-Treating Drugs
2.1 The Physiology of Cancer – Causes and Effects
2.2 Uncontrolled Growth
2.3 Dedifferentiation
2.4 Invasiveness and Metastasis
2.5 Causes of Cancer
2.6 The Incidence and Prevalence of Cancer – Trends in the World
2.6.1 Incidence
2.6.2 Mortality
2.6.3 Survival – Improving Odds
2.7 The Developed World
2.7.1 The Developing World – More Must Be Done
2.8 Treating Tumours – How Can We Fight Back?
2.9 Chemotherapy – The Traditional Treatment
2.10 Hormone Therapies
2.11 Immunotherapy – A Magic Bullet?
2.11.1.1 Monoclonal Antibodies (mAbs)
2.11.1.2 Cancer Vaccines
2.11.1.3 Non-Specific Immunotherapies
2.11.1.4 Targeted Therapies
2.11.1.5 Differentiating Agents
3 Global Cancer-Treating Drug Market Forecast to 2027
4 Global Cancer Treating Drugs Market by Therapy: Market Forecast to 2027
4.1 Overview
4.2 Immunotherapy
4.3 Chemotherapy
4.4 Targeted Therapy
4.5 Hormone Therapy
5 Global Top 25 Cancer Treating Drugs: Market Forecast to 2027
5.1 Avastin - Roche
5.2 Herceptin - Roche
5.3 Rituxan – Roche
5.4 Gleevec - Novartis
5.5 Revlimid - Celgene
5.6 Alimta – Eli Lilly and Co.
5.7 Velcade – Takeda/ Janssen
5.8 Erbitux – Bristol Myers Squibb/ Merck KGaA/ Eli Lilly
5.9 Gardasil – Merck Sharp and Dohme Ltd
5.10 Zytiga - Janssen
5.11 Xeloda – Roche
5.12 Tarceva - Roche
5.13 Afinitor - Novartis
5.14 Sprycel – Bristol Myers Squibb
5.15 Tasigna – Novartis
5.16 Sutent – Pfizer
5.17 Nexavar – Bayer
5.18 Xgeva - Amgen
5.19 Zoladex - AstraZeneca
5.20 Yervoy – Bristol Myers Squibb
5.21 Vidaza - Celgene
5.22 Treanda Cephalon/ Teva
5.23 Temodar – Merck Sharp and Dohme Ltd
5.24 Faslodex - AstraZeneca
5.25 Abraxane – Celgene
5.26 Others
6 Regional Cancer Treating Drugs Market Forecasts to 2027
6.1 Regional Cancer Treating Drugs Market Forecast 2017-2027
6.2 North American Cancer Treating Drugs Market Forecast 2017-2027
6.2.1 US Cancer Treating Drugs Market Forecast 2017-2027
6.2.2 Canada Cancer Treating Drugs Market Forecast 2017-2027
6.2.3 Mexico Cancer Treating Drugs Market Forecast 2017-2027
6.3 South American Cancer Treating Drugs Market Forecast 2017-2027
6.3.1 Brazil Cancer Treating Drugs Market Forecast 2017-2027
6.3.2 Argentina Cancer Treating Drugs Market Forecast 2017-2027
6.3.3 Paraguay Cancer Treating Drugs Market Forecast 2017-2027
6.3.4 Bolivia Cancer Treating Drugs Market Forecast 2017-2027
6.3.5 Rest of South America Cancer Treating Drugs Market Forecast 2017-2027
6.4 European Cancer Treating Drugs Market Forecast 2017-2027
6.4.1 France Cancer Treating Drugs Market Forecast 2017-2027
6.4.2 Germany Cancer Treating Drugs Market Forecast 2017-2027
6.4.3 UK Cancer Treating Drugs Market Forecast 2017-2027
6.4.4 Spain Cancer Treating Drugs Market Forecast 2017-2027
6.4.5 Italy Cancer Treating Drugs Market Forecast 2017-2027
6.4.6 Rest of Europe Cancer Treating Drugs Market Foons
9.1 The Top 25 Drugs in the Cancer Treatment Market
9.2 Immunotherapies – The Future of the Market
9.3 Patent Expiries and the Impact of Biosimilars
9.4 The US – Still the Largest National Market
9.5 China and Brazil Will Lead the Emerging Markets
9.6 Treatment – It’s Personal
9.7 The Anti-Cancer Drug Pipeline Remains Strong
9.8 Concluding Remarks
Appendices
Visiongain Report Sales Order Form
Appendix A
About Visiongain
Appendix B
Visiongain report evaluation form
List of Tables
Table 2.1 Cancer-Treating Agents: Chemotherapies and Hormone Therapies, 2017
Table 2.2 Cancer-Treating Agents: Immunotherapies, Targeted Therapies and Differentiating Agents, 2017
Table 3.1. Global Cancer-Treating Drugs Forecast ($bn, AGR%, CAGR%) 2017-2027
Table 4.1. Global Cancer Treating Drugs Market Forecast, by Therapy ($bn, AGR%, CAGR%) 2017-2027
Table 4.2. Global Immunotherapy Market for Cancer Treating Drugs Market Forecast, ($bn, AGR%, CAGR%) 2017-2027
Table 4.3. Global Immunotherapy Market for Cancer Treating Drugs Market Forecast, by Geography, ($bn, AGR%, CAGR%) 2017-2027
Table 4.4. Global Chemotherapy Market for Cancer Treating Drugs Market Forecast, ($bn, AGR%, CAGR%) 2017-2027
Table 4.5. Global Chemotherapy Market for Cancer Treating Drugs Market Forecast, by Geography ($bn, AGR%, CAGR%) 2017-2027
Table 4.6. Global Targeted Therapy Cancer Treating Drugs Market Forecast, ($bn, AGR%, CAGR%) 2017-2027
Table 4.7. Global Targeted Therapy Cancer Treating Drugs Market Forecast, by Geography ($bn, AGR%, CAGR%) 2017-2027
Table 4.8. Global Hormone Therapy Cancer Treating Drugs Market Forecast, ($bn, AGR%, CAGR%) 2017-2027
Table 4.9. Global Hormone Therapy Cancer Treating Drugs Market Forecast, by Geography ($bn, AGR%, CAGR%) 2017-2027
Table 5.1 Global Top 25 Cancer Treating Drugs Market, ($bn, AGR%, CAGR%) 2017-2027
Table 5.2. Global Avastin Revenue Forecast ($bn, AGR%, CAGR%), 2017-2027
Table 5.3. Global Herceptin Revenue Forecast ($bn, AGR%, CAGR%), 2017-2027
Table 5.4. Global Rituxan Revenue ($bn, AGR%, CAGR%), 2017-2027
Table 5.5 Global Gleevec Revenue ($bn, AGR%, CAGR%), 2017-2027
Table 5.6 Global Revlimid Revenue ($bn, AGR%, CAGR%),2017-2027
Table 5.7 Global Alimta Revenue ($bn, AGR%, CAGR%), 2017-2027
Table 5.8 Global Velcade Revenue ($bn, AGR%, CAGR%), 2017-2027
Table 5.9 Global Erbitux Revenue ($bn, AGR%, CAGR%), 2017-2027
Table 5.10 Global Gardasil Revenue ($bn, AGR%, CAGR%), 2017-2027
Table 5.11 Global Zytiga Revenue ($bn, AGR%, CAGR%), 2017-2027
Table 5.12 Global Xeloda Revenue ($bn), Annual Growth (%) and CAGR (%),2017-2027
Table 5.13 Global Tarceva Revenue ($bn, AGR%, CAGR%), 2017-2027
Table 5.14 Global Afinitor Revenue ($bn, AGR%, CAGR%), 2017-2027
Table 5.15 Global Sprycel Revenue ($bn, AGR%, CAGR%), 2017-2027
Table 5.16 Global Tasigna Revenue ($bn, AGR%, CAGR%), 2017-2027
Table 5.17 Global Sutent Revenue ($bn, AGR%, CAGR%), 2017-2027
Table 5.18 Global Nexavar Revenue ($bn, AGR%, CAGR%), 2017-2027
Table 5.19 Global Xgeva Revenue ($bn, AGR%, CAGR%), 2017-2027
Table 5.20 Global Zoladex Revenue ($bn, AGR%, CAGR%), 2017-2027
Table 5.21 Global Yervoy Revenue ($bn, AGR%, CAGR%), 2017-2027
Table 5.22 Global Vidaza Revenue ($bn, AGR%, CAGR%), 2017-2027
Table 5.23 Global Treanda Revenue ($bn, AGR%, CAGR%), 2017-2027
Table 5.24 Global Temodar Revenue ($bn, AGR%, CAGR%), 2017-2027
Table 5.25 Global Faslodex Revenue ($bn, AGR%, CAGR%), 2017-2027
Table 5.26 Global Abraxane Revenue ($bn, AGR%, CAGR%), 2017-2027
Table 5.27 Global Others Revenue ($bn, AGR%, CAGR%), 2017-2027
Table 6.1. Global Cancer Treating Drugs Market, by Geography ($bn, AGR%, CAGR%) 2017-2027
Table 6.2. North America Cancer Treating Drugs Market Forecast, by Country ($bn, AGR%, CAGR%) 2017-2027
Table 6.3. US Cancer Treating Drugs Market Forecast, ($bn, AGR%, CAGR%) 2017-2027
Table 6.4. Canada Cancer Treating Drugs Market Forecast, ($bn, AGR%, CAGR%) 2017-2027
Table 6.5. Mexico Cancer Treating Drugs Market Forecast, ($bn, AGR%, CAGR%) 2017-2027
Table 6.6. South America Cancer Treating Drugs Market Forecast, by Country ($bn, AGR%, CAGR%) 2017-2027
Table 6.7. Brazil Cancer Treating Drugs Market Forecast, ($bn, AGR%, CAGR%) 2017-2027
Table 6.8. Argentina Cancer Treating Drugs Market Forecast, ($bn, AGR%, CAGR%) 2016-2027
Table 6.9. Paraguay Cancer Treating Drugs Market Forecast, ($bn, AGR%, CAGR%) 2017-2027
Table 6.10. Bolivia Cancer Treating Drugs Market Forecast, ($bn, AGR%, CAGR%) 2017-2027
Table 6.11. Rest of South America Cancer Treating Drugs Market Forecast, ($bn, AGR%, CAGR%) 2017-2027
Table 6.12. European Cancer Treating Drugs Market Forecast, by Country ($bn, AGR%, CAGR%) 2017-2027
Table 6.13. France Cancer Treating Drugs Market Forecast, ($bn, AGR%, CAGR%) 2017-2027
Table 6.14 Germany Cancer Treating Drugs Market Forecast, ($bn, AGR%, CAGR%) 2017-2027
Table 6.15 UK Cancer Treating Drugs Market Forecast, ($bn, AGR%, CAGR%) 2017-2027
Table 6.16. Spain Cancer Treating Drugs Market Forecast, ($bn, AGR%, CAGR%) 2017-2027
Table 6.17. Italy Cancer Treating Drugs Market Forecast, ($bn, AGR%, CAGR%) 2017-2027
Table 6.18. Rest of European Cancer Treating Drugs Market Forecast, ($bn, AGR%, CAGR%) 2017-2027
Table 6.19. Asia-Pacific Cancer Treating Drugs Market Forecast, by Country ($bn, AGR%, CAGR%) 2017-2027
Table 6.20. China Cancer Treating Drugs Market Forecast, ($bn, AGR%, CAGR%) 2017-2027
Table 6.21. Japan Cancer Treating Drugs Market Forecast ($bn, AGR%, CAGR%) 2017-2027
Table 6.22. India Cancer Treating Drugs Market Forecast, ($bn, AGR%, CAGR%) 2017-2027
Table 6.23. Australia Cancer Treating Drugs Market Forecast, ($bn, AGR%, CAGR%) 2017-2027
Table 6.24. Thailand Cancer Treating Drugs Market Forecast, ($bn, AGR%, CAGR%) 2017-2027
Table 6.25. Rest of Asia-Pacific Cancer Treating Drugs Market Forecast, ($bn, AGR%, CAGR%) 2017-2027
Table 6.26. Rest of World Cancer Treating Drugs Market Forecast, by Country ($bn, AGR%, CAGR%) 2017-2027
Table 6.27. Middle East Cancer Treating Drugs Market Forecast, ($bn, AGR%, CAGR%) 2017-2027
Table 6.28. Africa Cancer Treating Drugs Market Forecast, ($bn, AGR%, CAGR%) 2017-2027
Table 6.29. Other Countries Cancer Treating Drugs Market Forecast, ($bn, AGR%, CAGR%) 2017-2027
Table 7.1 Strengths, Weaknesses, Opportunities and Threats in the Anti-Cancer Drugs Market, 2017
Table 7.2 Social, Technological, Economic and Political Analysis of the Anti-Cancer Drugs Market, 2017
Table 8.1 AstraZeneca Plc: Company Overview
Table 8.2 AstraZeneca Plc: Pipeline Products
Table 8.3 AstraZeneca Plc: Product Portfolio
Table 8.4 AstraZeneca Plc: Recent Developments
Table 8.5 Merck & Co. Inc.: Company Overview
Table 8.6 Merck & Co. Ltd.: Pipeline Products
Table 8.7 Merck & Co. Inc.: Product Portfolio
Table 8.8 Merck & Co. Inc.: Recent Developments
Table 8.9 Novartis AG: Company Overview
Table 8.10 Novartis AG: Pipeline Products
Table 8.11 Novartis AG: Product Portfolio
Table 8.12 Novartis AG: Recent Developments
Table 8.13 Amgen Inc.: Company Overview
Table 8.14 Amgen Inc.: Pipeline Products
Table 8.15 Amgen Inc.: Product Portfolio
Table 8.16 Amgen Inc.: Recent Developments
Table 8.17 Bristol-Myers Squibb: Company Overview
Table 8.18 Bristol-Myers Squibb: Pipeline Products
Table 8.19 Bristol-Myers Squibb : Product Portfolio
Table 8.20 Bristol-Myers Squibb: Recent Developments
Table 8.21 GlaxoSmithKline PLC: Company Overview
Table 8.22 GlaxoSmithKline: Pipeline Products
Table 8.23 GlaxoSmithKline PLC: Product Portfolio
Table 8.24 GlaxoSmithKline PLC: Recent Developments
Table 8.25 Johnson & Johnson: Company Overview
Table 8.26 Johnson & Johnson: Pipeline Products
Table 8.27 Johnson & Johnson: Product Portfolio
Table 8.28 Johnson & Johnson: Recent Developments
Table 8.29 F. Hoffmann-La Roche : Company Overview
Table 8.30 F. Hoffmann-La Roche: Pipeline Products
Table 8.31 F. Hoffmann-La Roche : Product Portfolio
Table 8.32 F. Hoffmann-La Roche : Recent Developments
Table 8.33 Eli Lilly and Company: Company Overview
Table 8.34 F. Eli Lilly Company: Pipeline Products
Table 8.35 Eli Lilly and Company : Product Portfolio
Table 8.36 Eli Lilly and Company : Recent Developments
Table 8.37 Celgene Corporation: Company Overview
Table 8.38 Celgene Corporation: Pipeline Products
Table 8.39 Celgene Corporation: Product Portfolio
Table 8.40 Celgene Corporation : Recent Developments
List of Figures
Figure 1.1 Anti-Cancer Market Segmentation, 2017
Figure 3.1 Cancer Treating Drugs Market, by Therapy, ($bn), 2017-2027
Figure 4.1 Cancer Treating Drugs Market, by Therapy, Market Share (%), 2016
Figure 4.2 Cancer Treating Drugs Market, by Therapy, Forecast ($bn) 2017-2027
Figure 4.3 Global Immunotherapy Market for Cancer Treating Drugs Market Forecast, by Geography, ($bn) 2017-2027
Figure 4.4 Global Chemotherapy Market for Cancer Treating Drugs Market Forecast, by Geography, ($bn) 2017-2027
Figure 4.5 Global Targeted Therapy Cancer Treating Drugs Market Forecast, by Geography, ($bn) 2017-2027
Figure 4.6 Global Hormone Therapy Cancer Treating Drugs Market Forecast, by Geography, ($bn) 2017-2027
Figure 5.1 Global Top 25 Cancer Treating Drugs, Market Share (%), 2016
Figure 5.2. Global Avastin Revenue Forecast, ($bn) 2017-2027
Figure 5.3. Global Herceptin Revenue Forecast, ($bn) 2017-2027
Figure 5.4. Global Rituxan Revenue Forecast, ($bn) 2017-2027
Figure 5.5. Global Gleevec Revenue Forecast, ($bn, AGR%, CAGR%), 2017-2027
Figure 5.6. Global Revlimid Revenue Forecast, ($bn) 2017-2027
Figure 5.7. Global Alimta Revenue Forecast, ($bn) 2017-2027
Figure 5.8. Global Velcade Revenue Forecast, ($bn) 2017-2027
Figure 5.9. Global Erbitux Revenue Forecast, ($bn) 2017-2027
Figure 5.10. Global Gardasil Revenue Forecast, ($bn) 2017-2027
Figure 5.11. Global Zytiga Revenue Forecast, ($bn) 2017-2027
Figure 5.12 Global Xeloda Revenue Forecast, ($bn, AGR%, CAGR%), 2017-2027
Figure 5.13. Global Tarceva Revenue Forecast, ($bn) 2017-2027
Figure 5.14. Global Afinitor Revenue Forecast, ($bn) 2017-2027
Figure 5.15. Global Sprycel Revenue Forecast, ($bn) 2017-2027
Figure 5.16. Global Tasigna Revenue Forecast, ($bn) 2017-2027
Figure 5.17. Global Sutent Revenue Forecast, ($bn) 2017-2027
Figure 5.18 Global Nexavar Revenue Forecast, ($bn) 2017-2027
Figure 5.19. Global Xgeva Revenue Forecast, ($bn) 2017-2027
Figure 5.20. Global Zoladex Revenue Forecast, ($bn) 2017-2027
Figure 5.21. Global Yervoy Revenue Forecast, ($bn) 2017-2027
Figure 5.22 Global Vidaza Revenue Forecast, ($bn) 2017-2027
Figure 5.23. Global Treanda Revenue Forecast, ($bn) 2017-2027
Figure 5.24. Global Temodar Revenue Forecast, ($bn) 2017-2027
Figure 5.25. Global Faslodex Revenue Forecast, ($bn) 2017-2027
Figure 5.26. Global Abraxane Revenue Forecast, ($bn) 2017-2027
Figure 5.27. Global Others Revenue Forecast, ($bn) 2017-2027
Figure 6.1. Global Cancer Treating Drugs Market, by Geography, ($bn) 2017-2027
Figure 6.2. Global Cancer Treating Drugs Market Forecast, by Geography, Market Share (%), 2016
Figure 6.3. North America Cancer Treating Drugs Market Forecast, by Country($bn) 2017-2027
Figure 6.4. North America Cancer Treating Drugs Market, by Country, Market Share (%), 2016
Figure 6.5. US Cancer Treating Drugs Market Forecast ($bn) 2017-2027
Figure 6.6. Estimation of Diagnosis of Canadian Cancer Immunotherapy
Figure 6.7. Canada Cancer Treating Drugs Market Forecast ($bn) 2017-2027
Figure 6.8 Mexico Cancer Treating Drugs Market Forecast ($bn) 2017-2027
Figure 6.9 South America Cancer Treating Drugs Market Forecast, by Country($bn) 2017-2027
Figure 6.10. South America Cancer Treating Drugs Market, by Country, Market Share (%), 2016
Figure 6.11. Brazil Cancer Treating Drugs Market Forecast ($bn) 2017-2027
Figure 6.12. Argentina Cancer Treating Drugs Market Forecast ($bn) 2017-2027
Figure 6.13. Paraguay Cancer Treating Drugs Market Forecast ($bn) 2017-2027
Figure 6.14. Bolivia Cancer Treating Drugs Market Forecast ($bn) 2017-2027
Figure 6.15. Rest of South America Cancer Treating Drugs Market Forecast ($bn) 2017-2027
Figure 6.16. Europe Cancer Treating Drugs Market Forecast, by Country($bn) 2017-2027
Figure 6.17. Europe Cancer Treating Drugs Market, by Country, Market Share (%), 2016
Figure 6.18. France Cancer Treating Drugs Market Forecast ($bn) 2017-2027
Figure 6.19 Germany Cancer Treating Drugs Market Forecast ($bn) 2017-2027
Figure 6.20. UK Cancer Treating Drugs Market Forecast ($bn) 2017-2027
Figure 6.21. Spain Cancer Treating Drugs Market Forecast ($bn) 2017-2027
Figure 6.22. Italy Cancer Treating Drugs Market Forecast ($bn) 2017-2027
Figure 6.23. Rest of Europe Cancer Treating Drugs Market Forecast ($bn) 2017-2027
Figure 6.24. Asia-Pacific Cancer Treating Drugs Market Forecast, by Country($bn) 2017-2027
Figure 6.25. Asia-Pacific Cancer Treating Drugs Market, Market Share (%), 2016
Figure 6.26. Cancer Treating Drugs Market Forecast ($bn) 2017-2027
Figure 6.27. Japan Cancer Treating Drugs Market Forecast ($bn) 2017-2027
Figure 6.28. India Cancer Treating Drugs Market Forecast ($bn) 2017-2027
Figure 6.29. Australia Cancer Treating Drugs Market Forecast ($bn) 2017-2027
Figure 6.30. Thailand Cancer Treating Drugs Market Forecast ($bn) 2017-2027
Figure 6.31. Rest of Asia-Pacific Cancer Treating Drugs Market Forecast ($bn) 2017-2027
Figure 6.32. RoW Cancer Treating Drugs Market, by Country($bn) 2017-2027
Figure 6.33. Rest of World Cancer Treating Drugs Market, by Country, Market Share (%), 2016
Figure 6.34. Middle East Cancer Treating Drugs Market Forecast ($bn) 2017-2027
Figure 6.35. Africa Cancer Treating Drugs Market Forecast ($bn) 2017-2027
Figure 6.36. Other Countries Cancer Treating Drugs Market Forecast ($bn) 2017-2027
Figure 8.1 AstraZeneca Plc, Historical Revenue, ($billion), 2012-2016
Figure 8.2 AstraZeneca Plc, Product Segments Share (%), 2016
Figure 8.3 Merck & Co. Inc., Historical Revenue, ($Billion), 2012-2016
Figure 8.4 Merck & Co. Inc., Product Segments Share (%), 2016
Figure 8.5 Merck & Co. Inc., Geographical Presence Share (%), 2016
Figure 8.6 Novartis AG, Historical Revenue, ($billion), 2012-2016
Figure 8.7 Novartis AG, Product Segments Share (%), 2016
Figure 8.8 Novartis AG, Geographical Presence Share (%), 2016
Figure 8.9 Amgen Inc., Historical Revenue, ($billion), 2012-2016
Figure 8.10 Amgen Inc., Product Segments Share (%), 2016
Figure 8.11 Amgen Inc., Geographical Presence Share (%), 2016
Figure 8.12 Bristol-Myers Squibb, Revenue, ($billion), 2012-2016
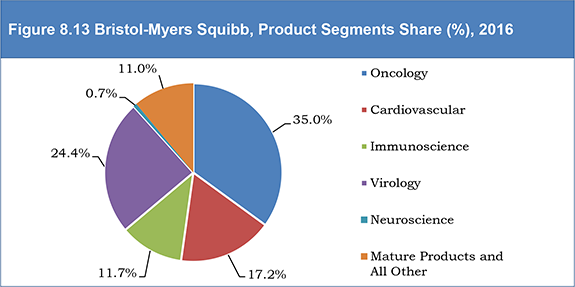
Figure 8.13 Bristol-Myers Squibb, Product Segments Share (%), 2016
Figure 8.14 Bristol-Myers Squibb, Geographical Presence Share (%), 2016
Figure 8.15 GlaxoSmithKline PLC, Historical Revenue, ($billion), 2012-2016
Figure 8.16 GlaxoSmithKline PLC, Product Segments Share (%), 2016
Figure 8.17 GlaxoSmithKline PLC, Geographical Presence Share (%), 2016
Figure 8.18 Johnson & Johnson, Historical Revenue, ($Billion), 2012-2016
Figure 8.19 Johnson & Johnson, Product Segments Share (%), 2016
Figure 8.20 Johnson & Johnson, Geographical Presence Share (%), 2016
Figure 8.21 F. Hoffmann-La Roche, Historical Revenue, ($Billion), 2012-2016
Figure 8.22 F. Hoffmann-La Roche, Product Segments Share (%), 2016
Figure 8.23 F. Hoffmann-La Roche, Geographical Presence Share (%), 2016
Figure 8.24 Eli Lilly and Company, Historical Revenue, ($billion), 2012-2016
Figure 8.25 Eli Lilly and Company, Product Segments Share (%), 2016
Figure 8.26 Eli Lilly and Company, Geographical Presence Share (%), 2016
Figure 8.27 Celgene Corporation, Historical Revenue, ($billion), 2012-2016
Figure 9.1 Top 25 Anti-Cancer Drugs: Revenues ($bn), 2016
Figure 9.2 Global Cancer Drug Market by Geography: Revenues ($bn), 2017-2027
Figure 9.3 Global Cancer Drug Market by Therapy Type: Revenues ($bn), 2017-2027