Industries > Pharma > Top 25 Anaesthesia Drugs Manufacturers 2020
Top 25 Anaesthesia Drugs Manufacturers 2020
Novartis, Mylan, Teva, Merck and Other Companies
The global anaesthesia drugs market is expected to reach $11.8bn in 2024 and is estimated to grow at a CAGR of 3.9% from 2019-2024. The local anaesthesia segment accounted for the largest share in the anaesthesia drugs market in 2018.
How this report will benefit you
Read on to discover how you can exploit the future business opportunities emerging in this sector.
In this brand new 155-page report you will receive 67 tables and 83 figures– all unavailable elsewhere.
The 155-page report provides clear detailed insight into the top 25 anaesthesia drugs manufacturers. Discover the key drivers and challenges affecting the market.
Report Scope
• Profiles of leading anaesthesia drugs manufacturers:
• Abbott Laboratories
• AbbVie
• Aspen Pharmacare
• AstraZeneca
• B. Braun Melsungen AG
• Baxter International
• Boehringer Ingelheim
• Eisai
• Endo International
• Fresenius Kabi AG
• GlaxoSmithKline
• Hikma Pharmaceuticals
• Jiangsu Hengrui Pharmaceutical Co., Ltd.
• Johnson & Johnson
• Lannett
• Merck
• Other companies
• The report provides information and discussion on:
• Company overview & analysis
• Product offerings
• Financial information
• Strategic developments
• This report discusses factors that drive and challenge the anaesthesia drugs market. Moreover, this report discusses the trends in anaesthesia drugs market.
• This report discusses the leading drugs and potential molecules in the pipeline.
• Key questions answered by this report:
• What are the drivers and restraints of the anaesthesia drugs market?
• Who are the leading anaesthesia drugs manufacturers?
• What are their products, developmental candidates and therapeutic applications?
• What is the status of the clinical trials they are undergoing?
• What are the latest news and developments from those companies?
Visiongain’s study is intended for anyone requiring commercial analyses for the Top 25 Anaesthesia Drugs Manufacturers 2020. You find data, trends and predictions.
Buy our report today Top 25 Anaesthesia Drugs Manufacturers 2020: Novartis, Mylan, Teva, Merck and Other Companies.
Visiongain is a trading partner with the US Federal Government
CCR Ref number: KD4R6
Do you have any custom requirements we can help you with? Any need for specific country, geo region, market segment or specific company information? Contact us today, we can discuss your needs and see how we can help: sara.peerun@visiongain.com
1. Report Overview
1.1 Why You Should Read This Report
1.2 How This Report Delivers
1.3 Key Questions Answered by This Analytical Report Include:
1.4 Who is This Report For?
1.5 Methodology
1.5.1 Primary Research
1.5.2 Secondary Research
1.5.3 Market Evaluation & Forecasting Methodology
1.6 Frequently Asked Questions (FAQ)
1.7 Associated Visiongain Reports
1.8 About Visiongain
2. Introduction to Anaesthetic Drugs
2.1 What is an Anaesthesia?
2.1.1 Types of Anaesthetics
2.1.1.1 General Anaesthetics
2.1.1.2 Local Anaesthetics
2.1.1.3 Sedation
2.2 What are the Risk and Side Effects of Anaesthesia Drugs?
2.2.1 Localized side effects
2.2.2 General side effects
2.3 Epidemiology of Anaesthetic Drugs
2.4 Humanistic and Economic Burden
2.4.1 Mortality
2.4.2 Morbidity
2.4.3 Economic Impact
3. Introduction to the Global Anaesthesia Drugs Market
4. Leading Drugs in the Global Anaesthesia Drugs Market
4.1 Propofol (Diprivan)
4.2 Sevoflurane (Sojourn, Ultane)
4.3 Remifentanil
4.4 Midazolam
4.5 Lidocaine
4.6 Ropivacaine
5. Market Growth Drivers
5.1 Increasing incidence of surgeries
5.2 Increasing cosmetic surgeries
5.3 Designated ICD-10 Code
5.4 Demand for general anaesthesia drugs
5.5 Increased investment in R&D
5.6 Advancements in medical power supply products
5.7 Rise in Geriatric population
6. Market Challenges
6.1 Healthcare consolidation
6.2 Stringent Regulatory Guidelines
6.3 Paucity of large, prospective and collaborative outcome studies
7. Market Trends
7.1 Advances in modern technologies
7.2 Strategic alliances among key players in the market
7.3 Expansion of healthcare sector in developing countries due to growing investments by major players
7.4 Advancements in drug delivery methods
7.5 Paucity of new drugs to change the practice of operating room Anaesthesia
7.6 Expect improved safety statistics regarding anaesthesia mortality and morbidity
7.7 Rising trend of home healthcare
8. Pipeline Molecules
8.1 Promising Potential Pipeline Molecules
8.1.1 Phase IV Molecules
8.1.1.1 Exparel (Bupivacaine Liposome)
8.1.2 Phase III Molecules
8.1.2.1 Remimazolam (CNS 7056)
8.1.3 Phase I Molecules
8.1.3.1 Cyclopropyl-methoxycarbonyl metomidate (ABP-700)
8.1.3.2 Carboetomidate
8.1.3.3 JM-1232 (-) (MR04A3)
8.1.3.4 Propofol
8.1.3.5 PF0713
8.1.3.6 Fospropofol
8.1.3.7 AZD-3043 (TD4756)
9. Leading Companies in Global Anaesthetic Drugs Market, 2018
9.1. Novartis AG
9.1.1. Company overview
9.1.2. Company snapshot
9.1.3. Operating business segments
9.1.4. Product portfolio
9.1.5. Business performance
9.2. Mylan N.V.
9.2.1. Company overview
9.2.2. Company snapshot
9.2.3. Operating business segments
9.2.4. Product portfolio
9.2.5. Business performance
9.3. Teva Pharmaceuticals Industries Limited AG
9.3.1. Company overview
9.3.2. Company snapshot
9.3.3. Operating business segments
9.3.4. Product portfolio
9.3.5. Business performance
9.4. Merck & Co., Inc.
9.4.1. Company overview
9.4.2. Company snapshot
9.4.3. Operating business segments
9.4.4. Product portfolio
9.4.5. Business performance
9.5. Pacira Pharmaceuticals, Inc.,
9.5.1. Company overview
9.5.2. Company snapshot
9.5.3. Product portfolio
9.5.4. Business performance
9.6. Hikma Pharmaceuticals. plc
9.6.1. Company overview
9.6.2. Company snapshot
9.6.3. Operating business segments
9.6.4. Product portfolio
9.6.5. Business performance
9.7. Glaxosmithkine plc
9.7.1. Company overview
9.7.2. Company snapshot
9.7.3. Operating business segments
9.7.4. Product portfolio
9.7.5. Business performance
9.8. Aspen Pharmacare Holdings Limited
9.8.1. Company overview
9.8.2. Company snapshot
9.8.3. Operating business segments
9.8.4. Product portfolio
9.8.5. Business performance
9.8.6. Key strategic moves and development
9.9. Endo International plc (Endo International)
9.9.1. Company overview
9.9.2. Company snapshot
9.9.3. Operating business segments
9.9.4. Product portfolio
9.9.5. Business performance
9.10. Nuvo Pharmaceuticals
9.10.1. Company overview
9.10.2. Company snapshot
9.10.3. Product portfolio
9.10.4. Business performance
9.11. Lannett
9.11.1. Company overview
9.11.2. Company snapshot
9.11.3. Operating business segment
9.11.4. Product portfolio
9.11.5. Business performance
9.12. Nichi-Iko Pharmaceutical Co., Ltd (Sagent Pharmaceuticals)
9.12.1. Company overview
9.12.2. Company snapshot
9.12.3. Operating business segment
9.12.4. Product portfolio
9.12.5. Business performance
9.13. Jiangsu Hengrui Medicine
9.13.1. Company overview
9.13.2. Company snapshot
9.13.3. Operating business segment
9.13.4. Product portfolio
9.13.5. Business performance
9.14. Mydent International
9.14.1. Company overview
9.14.2. Company snapshot
9.14.3. Operating business segment
9.14.4. Product portfolio
9.14.5. Business performance
9.15. Primex Pharmaceuticals AG
9.15.1. Company overview
9.15.2. Company snapshot
9.15.3. Product portfolio
9.15.4. Business performance
9.16. Fresenius Kabi AG
9.16.1. Company overview
9.16.2. Company snapshot
9.16.3. Operating business segments
9.16.4. Product portfolio
9.16.5. Business performance
9.17. Johnson and Johnson
9.17.1. Company overview
9.17.2. Company snapshot
9.17.3. Operating business segments
9.17.4. Product portfolio
9.17.5. Business performance
9.17.6. Key strategic move and development
9.18. Baxter International Inc.
9.18.1. Company overview
9.18.2. Company snapshot
9.18.3. Operating business segments
9.18.4. Product portfolio
9.18.5. Business performance
9.19. Abbott Laboratories
9.19.1. Company overview
9.19.2. Company snapshot
9.19.3. Operating business segments
9.19.4. Product portfolio
9.19.5. Business performance
9.20. AstraZeneca plc
9.20.1. Company overview
9.20.2. Company snapshot
9.20.3. Operating business segments
9.20.4. Product portfolio
9.20.5. Business performance
9.20.6. Key strategic move and development
9.21. F. Hoffman-La Roche AG
9.21.1. Company overview
9.21.2. Company snapshot
9.21.3. Operating business segments
9.21.4. Product portfolio
9.21.5. Business performance
9.22. AbbVie Inc.
9.22.1. Company overview
9.22.2. Company snapshot
9.22.3. Operating business segments
9.22.4. Product portfolio
9.22.5. Business performance
9.23. B. Braun Melsungen AG
9.23.1. Company overview
9.23.2. Company snapshot
9.23.3. Operating business segments
9.23.4. Product portfolio
9.23.5. Business performance
9.23.6. Key stratregic move and development
9.24. Eisai Co., Ltd.
9.24.1. Company overview
9.24.2. Company snapshot
9.24.3. Operating business segments
9.24.4. Product portfolio
9.24.5. Business performance
9.25. Boehringer Ingelheim GmbH
9.25.1. Company overview
9.25.2. Company snapshot
9.25.3. Operating business segments
9.25.4. Product portfolio
9.25.5. Business performance
10. Conclusions
Visiongain Report Sales Order Form
Associated Visiongain Reports
About Visiongain
Visiongain report evaluation form
List of Tables
Table 2.1 Type of Surgeries performed in 2010 and 2020 (%)
Table 8.1 Active Pipeline Molecules under Development for Anaesthesia Drugs
Table 9.1. Novartis: Company Snapshot
Table 9.2. Novartis: Operating Segments
Table 9.3. Novartis: Product Portfolio
Table 9.4. Mylan N.V.: Company Snapshot
Table 9.5. Mylan N.V.: Operating Segments
Table 9.6. Mylan N.V.: Product Portfolio
Table 9.7. Teva Pharmaceuticals Industries Limited: Company Snapshot
Table 9.8. Teva Pharmaceuticals Industries Limited: Operating Segments
Table 9.9. Teva Pharmaceuticals Industries Limited: Product Portfolio
Table 9.10. Merck: Company Snapshot
Table 9.11. Merck: Operating Segments
Table 9.12. Merck: Product Portfolio
Table 9.13. Pacira: Company Snapshot
Table 9.14. Pacira: Product Portfolio
Table 9.15. Hikma: Company Snapshot
Table 9.16. Hikma: Operating Segments
Table 9.17. Hikma: Product Portfolio
Table 9.18. GSK: Company Snapshot
Table 9.19. GSK: Operating Segments
Table 9.20. GSK: Product Portfolio
Table 9.21. Aspen: Company Snapshot
Table 9.22. Aspen: Main Operating Segments
Table 9.23. Aspen: Product Portfolio
Table 9.24. Endo International: Company Snapshot
Table 9.25. Endo International: Operating Segments
Table 9.26. Endo International: Product Portfolio
Table 9.27. Nuvo: Company Snapshot
Table 9.28. Nuvo: Product Portfolio
Table 9.29. Lannett: Company Snapshot
Table 9.30. Lannett: Product Portfolio
Table 9.31. Nichi: Company Snapshot
Table 9.32. Nichi: Product Portfolio
Table 9.33. Jiangsu: Company Snapshot
Table 9.34. Jiangsu: Product Portfolio
Table 9.35. Mydent: Company Snapshot
Table 9.36. Mydent: Product Portfolio
Table 9.37. Primex: Company Snapshot
Table 9.38. Primex: Product Portfolio
Table 9.39. Fresenius: Company Snapshot
Table 9.40. Fresenius: Operating Segments
Table 9.41. Fresenius: Product Portfolio
Table 9.42. Johnson and Johnson: Company Snapshot
Table 9.43. Johnson and Johnson: Operating Segments
Table 9.44. Johnson and Johnson: Product Portfolio
Table 9.45. Baxter: Company Snapshot
Table 9.46. Baxter: Operating Segments
Table 9.47. Baxter: Product Portfolio
Table 9.48. Abbott: Company Snapshot
Table 9.49. Abbott: Operating Segments
Table 9.50. Abbott: Product Portfolio
Table 9.51. AstraZeneca: Company Snapshot
Table 9.52. AstraZeneca: Product Portfolio
Table 9.53. Roche: Company Snapshot
Table 9.54. Roche: Operating Segments
Table 9.55. Roche: Product Portfolio
Table 9.56. AbbVie: Company Snapshot
Table 9.57. AbbVie: Product Portfolio
Table 9.58. B. Braun: Company Snapshot
Table 9.59. B. Braun: Operating Segments
Table 9.60. B. Braun: Product Portfolio
Table 9.61. Eisai: Company Snapshot
Table 9.62. Eisai: Product Portfolio
Table 9.63. Boehringer: Company Snapshot
Table 9.64. Boehringer: Operating Segments
Table 9.65. Boehringer: Product Portfolio
List of Figures
Figure 9.1. Novartis: Net Sales, 2016–2018 ($Million)
Figure 9.2. Novartis: Revenue Share by Segment, 2018 (%)
Figure 9.3. Novartis: Revenue Share by Geography, 2018 (%)
Figure 9.4. Novartis: SWOT Analysis
Figure 9.5. Mylan N.V.: Net Sales, 2015–2017 ($Million)
Figure 9.6. Mylan N.V.: Revenue Share by Geography, 2017 (%)
Figure 9.7. Mylan N.V.: SWOT Analysis
Figure 9.8. Teva Pharmaceuticals Industries Limited: Net Sales, 2015–2017 ($Million)
Figure 9.9. Teva Pharmaceuticals Industries Limited: Revenue Share by Segment, 2017 (%)
Figure 9.10. Teva Pharmaceuticals Industries Limited: Revenue Share by Geography, 2017 (%)
Figure 9.11. Teva Pharmaceuticals Industries Limited: SWOT Analysis
Figure 9.12. Merck: Net Sales, 2015–2017 ($Million)
Figure 9.13. Merck: Revenue Share by Segment, 2017 (%)
Figure 9.14. Merck: Revenue Share by Geography, 2017 (%)
Figure 9.15. Merck: SWOT Analysis
Figure 9.16. Pacira: Net Sales, 2015–2017 ($Million)
Figure 9.17. Pacira: Revenue Share by Geography, 2017 (%)
Figure 9.18. Pacira: SWOT Analysis
Figure 9.19. Hikma: Net Sales, 2015–2017 ($Million)
Figure 9.20. Hikma: Revenue Share by Geography, 2017 (%)
Figure 9.21. Hikma: SWOT Analysis
Figure 9.22. GSK: Net Sales, 2015–2017 ($Million)
Figure 9.23. GSK: Revenue Share by Segment, 2017 (%)
Figure 9.24. GSK: Revenue Share by Geography, 2017 (%)
Figure 9.25. GSK: SWOT Analysis
Figure 9.26. Aspen: Net Sales, 2017–2018 ($Million)
Figure 9.27. Aspen: Revenue Share by Segment, 2018 (%)
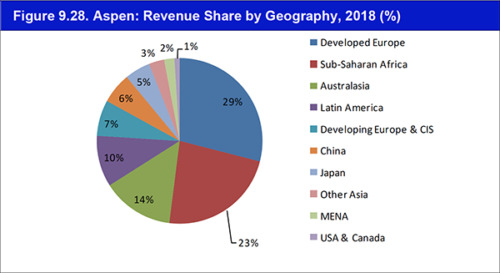
Figure 9.28. Aspen: Revenue Share by Geography, 2018 (%)
Figure 9.29. Aspen: SWOT Analysis
Figure 9.30. Endo International: Net Sales, 2016–2018 ($Million)
Figure 9.31. Endo International: Revenue Share by Segment, 2018 (%)
Figure 9.32. Endo International: SWOT Analysis
Figure 9.33. Nuvo: Net Sales, 2016–2017 ($Million)
Figure 9.34. Nuvo: Revenue Share by Geography, 2017 (%)
Figure 9.35. Nuvo: SWOT Analysis
Figure 9.36. Lannett: Net Sales, 2016–2018 ($Million)
Figure 9.37. Lannett: SWOT Analysis
Figure 9.38. Nichi: Net Sales, 2017–2018 ($Million)
Figure 9.39. Nichi: SWOT Analysis
Figure 9.40. Jiangsu: SWOT Analysis
Figure 9.41. Mydent: SWOT Analysis
Figure 9.42. Primex: SWOT Analysis
Figure 9.43. Fresenius: Net Sales, 2015–2017 ($Million)
Figure 9.44. Fresenius: Revenue Share by Segment, 2017 (%)
Figure 9.45. Fresenius: Revenue Share by Geography, 2017 (%)
Figure 9.46. Fresenius: SWOT Analysis
Figure 9.47. Johnson and Johnson: Net Sales, 2016–2018 ($Million)
Figure 9.48. Johnson and Johnson: Revenue Share by Segment, 2018 (%)
Figure 9.49. Johnson and Johnson: Revenue Share by Geography, 2018 (%)
Figure 9.50. Johnson and Johnson: SWOT Analysis
Figure 9.51. Baxter: Net Sales, 2016–2018 ($Million)
Figure 9.52. Baxter: Revenue Share by Segment, 2018 (%)
Figure 9.53. Baxter: Revenue Share by Geography, 2018 (%)
Figure 9.54. Baxter: SWOT Analysis
Figure 9.55. Abbott: Net Sales, 2016–2018 ($Million)
Figure 9.56. Abbott: Revenue Share by Segment, 2018 (%)
Figure 9.57. Abbott: Revenue Share by Geography, 2018 (%)
Figure 9.58. Abbott: SWOT Analysis
Figure 9.59. AstraZeneca: Net Sales, 2016–2018 ($Million)
Figure 9.60. AstraZeneca: Revenue Share by Segment, 2018 (%)
Figure 9.61. AstraZeneca: Revenue Share by Geography, 2018 (%)
Figure 9.62. AstraZeneca: SWOT Analysis
Figure 9.63. Roche: Net Sales, 2016–2018 ($Million)
Figure 9.64. Roche: Revenue Share by Segment, 2018 (%)
Figure 9.65. Roche: Revenue Share by Geography, 2018 (%)
Figure 9.66. Roche: SWOT Analysis
Figure 9.67. AbbVie: Net Sales, 2016–2018 ($Million)
Figure 9.68. AbbVie: Revenue Share by Segment, 2018 (%)
Figure 9.69. AbbVie: Revenue Share by Geography, 2018 (%)
Figure 9.70. Abbvie: SWOT Analysis
Figure 9.71. B. Braun: Net Sales, 2015–2017 ($Million)
Figure 9.72. B. Braun: Revenue Share by Segment, 2017 (%)
Figure 9.73. B. Braun: Revenue Share by Geography, 2017 (%)
Figure 9.74. B. Braun: SWOT Analysis
Figure 9.75. Eisai: Net Sales, 2016–2018 ($Million)
Figure 9.76. Eisai: Revenue Share by Geography, 2017 (%)
Figure 9.77. Eisai: SWOT Analysis
Figure 9.78. Boehringer: Net Sales, 2016–2017 ($Million)
Figure 9.79. Boehringer: Revenue Share by Segment, 2017 (%)
Figure 9.80. Boehringer: Revenue Share by Geography, 2017 (%)
Figure 9.81. Boehringer: SWOT Analysis
Figure 10.1 Anaesthesia market, by type (% share 2016 & 2028)
Figure 10.2 Anaesthesia market by route of administration (% share 2016 & 2028)
Abbott Laboratories
AbbVie
Aspen Pharmacare Holdings Limited (Aspen)
AstraZeneca
B. Braun Melsungen AG
Baxter International Inc.
Boehringer Ingelheim GmbH
DePuy Synthes
Eisai Co., Ltd.
Endo International plc
Fresenius Kabi AG
GlaxoSmithKline plc (GSK)
Hikma Pharmaceuticals PLC
International Society of Aesthetic Plastic Surgery (ISAPS)
Janssen Pharmaceuticals
Jiangsu Hengrui Pharmaceutical Co., Ltd.
Johnson & Johnson
Lannett
Merck & Co., Inc.
Mydent International, Inc.
Mylan
National Institute of Health (NIH)
Nichi-Iko Pharmaceutical Co., Ltd.
Novartis
Nuvo Pharmaceuticals Inc.
Nuvo Research Inc.
Pacira Pharmaceuticals
Primex Pharmaceuticals AG
Roche
Siamab Therapeutics, Inc.
Teva Pharmaceuticals
Thermo Fisher Scientific
World Health Organization
Download sample pages
Complete the form below to download your free sample pages for Top 25 Anaesthesia Drugs Manufacturers 2020
Related reports
-
Medical Device Leader Series: Top Pre-Filled Injection Device Manufacturers 2019-2029
The Pre-Filled Device Manufacturing market is estimated to reach $8.3bn in 2024, growing at a CAGR of 9.5% throughout the...Full DetailsPublished: 30 August 2019 -

Global Pre-Filled Syringes Market Forecast 2019-2029
The global pre-filled syringes market was valued at $9.8bn in 2018. This market is estimated to grow at a CAGR...
Full DetailsPublished: 31 January 2019 -

Top 25 Biosimilar Drug Manufacturers 2019
Visiongain forecasts that the biosimilar drugs market will grow with a CAGR of 40% from 2018 to 2028.
...Full DetailsPublished: 17 April 2019 -

Global Biosimilars and Follow-On Biologics Market 2019-2029
The global biosimilars and follow-on biologics market is estimated to have reached $10.7bn in 2018 and expected to grow at...
Full DetailsPublished: 21 March 2019 -

Global Surgical Sutures Market 2020-2030
The global surgical sutures market is expected to reach $6.4bn in 2024 and is estimated to grow at a CAGR...
Full DetailsPublished: 08 October 2019
Download sample pages
Complete the form below to download your free sample pages for Top 25 Anaesthesia Drugs Manufacturers 2020
Do you have any custom requirements we can help you with?
Any specific country, geo region, market segment or specific company information?
Email us today, we can discuss your needs and see how we can help: jamie.roberts@visiongain.com
Would you like a free report overview of the report of your choice?
If so, please drop an email to Jamie Roberts stating your chosen report title to jamie.roberts@visiongain.com
Visiongain’s reports are based on comprehensive primary and secondary research. Those studies provide global market forecasts (sales by drug and class, with sub-markets and leading nations covered) and analyses of market drivers and restraints (including SWOT analysis) and current pipeline developments. To find out more about our reports methodology, please email jamie.roberts@visiongain.com
“Thank you for this Gene Therapy R&D Market report and for how easy the process was. Your colleague was very helpful and the report is just right for my purpose. This is the 2nd good report from Visiongain and a good price.”
Dr Luz Chapa Azuella, Mexico
American Association of Colleges of Pharmacy
American College of Clinical Pharmacy
American Pharmacists Association
American Society for Pharmacy Law
American Society of Consultant Pharmacists
American Society of Health-System Pharmacists
Association of Special Pharmaceutical Manufacturers
Australian College of Pharmacy
Biotechnology Industry Organization
Canadian Pharmacists Association
Canadian Society of Hospital Pharmacists
Chinese Pharmaceutical Association
College of Psychiatric and Neurologic Pharmacists
Danish Association of Pharmaconomists
European Association of Employed Community Pharmacists in Europe
European Medicines Agency
Federal Drugs Agency
General Medical Council
Head of Medicines Agency
International Federation of Pharmaceutical Manufacturers & Associations
International Pharmaceutical Federation
International Pharmaceutical Students’ Federation
Medicines and Healthcare Products Regulatory Agency
National Pharmacy Association
Norwegian Pharmacy Association
Ontario Pharmacists Association
Pakistan Pharmacists Association
Pharmaceutical Association of Mauritius
Pharmaceutical Group of the European Union
Pharmaceutical Society of Australia
Pharmaceutical Society of Ireland
Pharmaceutical Society Of New Zealand
Pharmaceutical Society of Northern Ireland
Professional Compounding Centers of America
Royal Pharmaceutical Society
The American Association of Pharmaceutical Scientists
The BioIndustry Association
The Controlled Release Society
The European Federation of Pharmaceutical Industries and Associations
The European Personalised Medicine Association
The Institute of Clinical Research
The International Society for Pharmaceutical Engineering
The Pharmaceutical Association of Israel
The Pharmaceutical Research and Manufacturers of America
The Pharmacy Guild of Australia
The Society of Hospital Pharmacists of Australia
Latest Pharma news
Visiongain Publishes Drug Delivery Technologies Market Report 2024-2034
The global Drug Delivery Technologies market is estimated at US$1,729.6 billion in 2024 and is projected to grow at a CAGR of 5.5% during the forecast period 2024-2034.
23 April 2024
Visiongain Publishes Cell Therapy Technologies Market Report 2024-2034
The cell therapy technologies market is estimated at US$7,041.3 million in 2024 and is projected to grow at a CAGR of 10.7% during the forecast period 2024-2034.
18 April 2024
Visiongain Publishes Automation in Biopharma Industry Market Report 2024-2034
The global Automation in Biopharma Industry market is estimated at US$1,954.3 million in 2024 and is projected to grow at a CAGR of 7% during the forecast period 2024-2034.
17 April 2024
Visiongain Publishes Anti-obesity Drugs Market Report 2024-2034
The global Anti-obesity Drugs market is estimated at US$11,540.2 million in 2024 and is expected to register a CAGR of 21.2% from 2024 to 2034.
12 April 2024
