Industries > Cyber > Top 20 Machine to Machine (M2M) Companies 2018
Top 20 Machine to Machine (M2M) Companies 2018
Leaders in the Internet of Things (IoT), Connected Health, Car, Home, Aircraft & Industrial, Automotive, Retail, Energy, Utility & Security Applications
The latest report from business intelligence provider visiongain offers comprehensive analysis of the global M2M market leaders. Visiongain assesses that the machine to Machine (M2M) market will generate revenues of $38 billion in 2018.
How this report will benefit you
Read on to discover how you can exploit the future business opportunities emerging in the M2M sector. Visiongain’s new study tells you and tells you now
In this brand new report you find 135 in-Depth tables, charts and graphs – all unavailable elsewhere. The 171 page report provides clear detailed insight into the global M2M market and competitive landscape. Discover the key drivers and challenges affecting the market.
By ordering and reading our brand new report today you stay better informed and ready to act.
Report Scope
• Global M2M revenue forecasts
• Global M2M connections forecasts
• Profiles, M2M revenues, M2M connections, and market share and ranking and of the leading 20 M2M companies by revenues, and by connections.
– Aeris
– AT&T Inc
– Bharti Airtel
– China Mobile
– China Unicom
– Deutsche Telekom
– Koninklijke KPN
– Kore Telematics
– NTT DoCoMo
– Numerex
– Orange
– Rogers
– Sprint Corporation
– Telecom Italia
– Telefónica S.A.
– Telenor Group
– Verizon Communications
– VimpelCom
– Vodafone Group Plc
– Wyless
• Analysis of the key factors driving growth in the global, regional and country level M2M markets in the short and medium term
How will you benefit from this report?
• Keep your M2M knowledge base up to speed. Don’t get left behind
• Reinforce your strategic decision-making with definitive and reliable M2M market data
• Learn how to exploit new M2M technological trends
• Realise your company’s full potential within the M2M market
• Understand the M2M competitive landscape and identify potential new business opportunities & partnerships
Who should read this report?
• Anyone within the M2M and IoT value chain.
• CEO’s
• COO’s
• CIO’s
• Business development managers
• Marketing managers
• Application developers
• Mobile advertising executives
• Mobile network operators
• Technologists
• Suppliers
• Investors
• Banks
• Government agencies
• Contractors
Visiongain’s study is intended for anyone requiring commercial analyses for the M2M market and leading companies. You find data, trends and predictions.
Buy our report today Top 20 Machine to Machine (M2M) Companies 2018: Leaders in the Internet of Things (IoT), Connected Health, Car, Home, Aircraft & Industrial, Automotive, Retail, Energy, Utility & Security Applications
Avoid missing out by staying informed – get our report now.
Visiongain is a trading partner with the US Federal Government
CCR Ref number: KD4R6
1. Report Overview
1.1 Global M2M Market Overview
1.2 Global M2M Market Structure
1.3 Why You Should Read This Report
1.4 How This Report Delivers
1.5 Key Questions Answered by This Analytical Report Include:
1.6 Who is This Report For?
1.7 Methodology
1.8 Frequently Asked Questions (FAQ)
1.9 Associated Visiongain Reports
1.10 About Visiongain
2. Introduction to the M2M Market
2.1 What Does M2M Signify?
2.2 M2M History and Recent Developments
2.3 Benefits of M2M
2.4 M2M Applications by Industry
2.5 Market Definitions
2.5.1 Sizing the M2M Market
2.5.2 Differentiating between M2M and the Internet of Things
2.6 The Global M2M Market Forecast 2018-2028
2.6.1 Global M2M 2016 Service Revenue Forecast
2.7 M2M Global Connections Forecast 2016-2027
3. Competitors Positioning in the M2M Market
3.1 Leading 20 Companies in the M2M Market
3.2 Addressing YoY Market Share Shifts: How are the Top 20 M2M
Companies Reflective of Industry Changes
3.3 Concentration of M2M Leaders in the World’s Regions
3.3.1 Regional Revenue Distribution of the Top 20 M2M Companies2017
4. Individual Analyses for the Leading 20 Companies in the Global M2M Market
4.1 Aeris Overview
4.1.1 Aeris M2M Connections
4.1.2 Aeris M2M Revenue and Market Share
4.2 AT&T Inc. Company Overview
4.2.1 AT&T Inc.M2M Connections
4.2.2 AT&T Inc.Total M2M Revenues
4.2.3 How is AT&T Maximising Their Service Delivery Potential?
4.2.4 AT&T Business Aims
4.2.5 AT&T Position in the Market
4.3 Bharti Airtel Overview
4.3.1 Bharti Airtel M2M Connections
4.3.2 Bharti Airtel M2M Revenue
4.4 China Mobile Company Overview
4.4.1 China Mobile Total M2M Connections
4.4.2 China Mobile Total M2M Revenues
4.4.3 China Mobile M2M Offerings
4.5 China Unicom Overview
4.5.1 China Unicom M2M Connections
4.5.2China Unicom Total M2M Revenues
4.5.3 China Unicom M2M Projects and Initiatives
4.5.4 Partnerships at the Heart of Unicom’s M2M Business
4.6 Deutsche Telekom Company Overview
4.6.1 Deutsche TelekomTotal M2M Connections
4.6.2 Deutsche TelekomM2M Revenue
4.6.3 Deutsche TelekomM2M Offerings
4.6.4 Deutsche Telekom M2M Recent Developments
4.7 Koninklijke KPN NV Overview
4.7.1 Koninklijke KPN NV Total M2M Connections
4.7.2 Koninklijke KPN NV Total M2M Revenues
4.8 Kore Telematics Overview
4.8.1 Kore Telematics M2M Connections
4.8.2 Kore Telematics M2M Revenue
4.8.3 Kore Telematics Offerings
4.8.4 M2M Carrier Partners
4.8.5 KORE Partnerships and Strategy Overview
4.8.6 Expanding the Global Connect Service Footprint
4.9 NTT DoCoMo Overview
4.9.1 NTT DoCoMo Total M2M Connections
4.9.2 NTT DoCoMo Total M2M Revenues
4.9.3 NTT DoCoMo M2M Offerings
4.9.4 Recent Developments
4.10 Numerex Overview
4.10.1Numerex M2M Connections
4.10.2 Numerex Total M2M Revenues
4.10.3 Numerex M2M Offerings
4.10.4 Activities in a Diversity of Industries
4.11 Orange S.A Overview
4.11.1 Orange S.A total M2M Connections
4.11.2Orange Total M2M Revenues
4.11.3 Orange M2M Offerings
4.12 Rogers Communications Overview
4.12.1 Rogers CommunicationsM2M Connections& Global Share
4.12.2 Rogers Communications Inc. Total M2M Revenues
4.13 Sprint Corporation Overview
4.13.1 Sprint CorporationTotal M2Mconnection
4.13.2 Sprint CorporationTotal M2M Revenues
4.13.3 Sprint’s Assets, Strengths, and Strategy
4.13.4 Sprint M2M Partner Ecosystem
4.14 Telecom Italia SpA Overview
4.14.1 Telecom Italia SpA Total M2M Connections
4.14.2 Telecom Italia SpA Total M2M Revenues
4.14.3 Telecom Italia SpA M2M Strategy
4.14.4 Pushing for Seamless Global Customer Experience
4.14.5 What are Telecom Italia’s Key Partnerships and What Steps is the Company Taking towards Building the M2M Ecosystem?
4.14.6 How has Telecom Italia Approached Providing M2M acrossVarious Verticals?
4.15 Telefónica S.A Overview
4.15.1Telefónica S.A total M2M Connections
4.15.2 Telefónica S.A Total M2M Revenues
4.15.3Telefónica S.AM2M Products
4.16 Telenor Group Overview
4.16.1 Telenor Group Total M2M Connections
4.16.2Telenor Group Total M2M Revenues
4.17 Verizon Communications Overview
4.17.1Verizon Communications Total M2M Connections
4.17.2 Verizon Communications Total M2M Revenues
4.17.3 Verizon’s M2M Solutions and Overall Strategy
4.17.4 Verizon’s Focus on Automotive Industry
4.18 VimpelCom Overview
4.18.1 VimpelCom Total M2M Connections
4.18.2 VimpelCom M2M Revenues
4.19 Vodafone Group Plc Overview
4.19.1 Vodafone Group Plc Total M2Mconnections
4.19.2 Vodafone Group Plc M2M Revenues
4.19.3 Vodafone Group M2M Offerings
4.19.4 Integration with Broader IoT Concepts and Plans
4.20 Wyless Overview
4.20.1 Wyless M2M Connections in 2016
4.20.2 Wyless M2M Revenue 2017
4.20.3 Wyless M2M Offerings
4.20.4 Growing Opportunities in the Developing LATAM Market
4.21 Other Players in the M2M Market
5. Conclusions
5.1 The Global M2M Market in 2017
5.2 Who is Leading the M2M Market?
5.3 How M2M Industry Leadership is Forged
5.4 What Are Crucial Components Among M2M Leaders?
5.5 Outlook for M2M Industry Leadership
6. Glossary
Associated Visiongain Reports
Visiongain Report Sales Order Form
Appendix A
Appendix B
Visiongain report evaluation form
List of Figures
Figure 1.1: M2M Market Structure Overview
Figure 1.2: Relationship between M2M, IoT, and IoE
Figure 3.1: Leading 20 Companies in the M2M Market 2017 (Market Share %)
Figure 3.2: Leading 20 Companies in the M2M Market 2017 (Connections Share %)
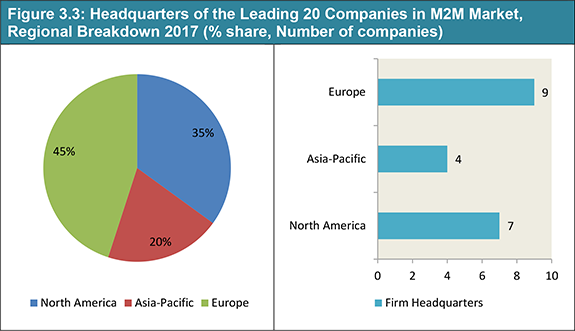
Figure 3.3: Headquarters of the Leading 20 Companies in M2M Market, Regional Breakdown 2017 (% share, Number of companies)
Figure 3.4: Revenue Breakdown Of The Leading 20 Companies in M2Mmarket, Regional Breakdown 2017 (% Share, Revenues in $ billions)
Figure 4.1: Aeris M2M Connections 2013-2017 (millions, AGR %)
Figure 4.2: Aeris M2M Share of Wireless Connections 2014-2016(%)
Figure 4.3: Aeris Total Revenues 2013-2017 ($ bn, AGR%)
Figure 4.4: Aeris M2M Share of Global Revenues 2016-2017(%)
Figure 4.5:AT&T Total Connections 2013-2016 (M2M & Other Connections in Millions, M2M AGR%)
Figure 4.6:AT&T M2M Share of Wireless Connections 2016-2017 (%)
Figure 4.7:AT&T M2M Share of Global Revenues 2016-2017(%)
Figure 4.8:AT&T M2M Revenues 2015-2016 ($ billion)
Figure 4.9: Bharti Airtel M2M Connections 2016-2017 (millions)
Figure 4.10: Bharti Airtel Share of Global M2M Connections 2016-2017 (%)
Figure 4.11: Bharti Airtel M2M Revenue 2016-2017 ($ bn)
Figure 4.12: Bharti Airtel Share of Global M2M Connections 2016-2017 (%)
Figure 4.13: China Mobile M2M connections 2013-2016 (million connections, AGR %)
Figure 4.14: China Mobile M2M Share of Wireless Connections 2016-2017(%)
Figure 4.15: China Mobile Total Revenues 2015-2016 ($ billion)
Figure 4.16: China Mobile M2M Share of Global Revenues 2014-2016 (%)
Figure 4.17: China Unicom M2M and Total Wireless Connections 2012-2015 (million connections, AGR %)
Figure 4.18: China Unicom M2M Share of Wireless Connections 2016-2017 (%)
Figure 4.19: China Unicom Total Revenues 2016-2017 ($ bn, AGR %)
Figure 4.20 China Unicom M2M Share of Global Revenues(%)
Figure 4.21: Deutsche Telekom M2M and Wireless Connections 2012-2016 (million connections, AGR %)
Figure 4.22: Deutsche Telekom Share of Global M2M Connections 2016-2017 (%)
Figure 4.23: Deutsche Telekom Total Revenues 2015-2016 (M2M & Other Revenues in Billions, AGR %)
Figure 4.24: Deutsche Telekom Share of Global M2M Revenue 2016-2017(%)
Figure 4.25: KPN Total Connections 2012-2016 (M2M & Other Connections in Millions, AGR %)
Figure 4.26: KPN Share of Global M2M Connections 2016-2017(%)
Figure 4.27: KPN M2M and Wireless Revenue 2012-2016 ($ bn, AGR %)
Figure 4.28: KPN Share of Global M2M Revenue 2016-2017(%)
Figure 4.29: Kore Telematics M2M Connections, 2013-2017 (million connections)
Figure 4.30: Kore Telematics Share of Global M2M Connections 2016-2017(%)
Figure 4.31: Kore Telematics M2M Revenue 2016-2017 ($ bn)
Figure 4.32: Kore Telematics M2M Share of Global Revenues 2016-2017(%)
Figure 4.33:NTT DoCoMo Total Connections 2011-2016 (M2M and Other Connections in Millions, AGR %)
Figure 4.34:NTT DoCoMo M2M and Other Revenues 2012-2016 ($ bn, AGR %)
Figure 4.35: NTT DoCoMoM2M Share of Company Revenue 2012-2016(%)
Figure 4.36:NTT DoCoMo Share of Global M2M Revenues 2016-2017(%)
Figure 4.37: Numerex M2M Connections 2013-2017 (millions, AGR %)
Figure 4.38: Numerex Share of Global M2Mconnections 2016-2017(%)
Figure 4.39: Numerex M2M Revenue 2013-2016 ($ bn, AGR %)
Figure 4.40: Numerex Revenue Share from Hardware and Services (%)
Figure 4.41: Numerex Share of Global M2M Revenue 2016-2017(%)
Figure 4.42: Orange Total Connections 2013-2016 (M2M & Other Connections in Millions, M2M AGR%)
Figure 4.43: Orange Share of Global M2M Connections 2016-2017 (%)
Figure 4.44: Orange M2M Share of Wireless Connections 2013-2016 (%)
Figure 4.45: Orange Total Revenues 2013-2016 (M2M and Other Revenues in $ bn, AGR %)
Figure 4.46: Orange M2M Share of Total Revenue 2013-2016 (%)
Figure 4.47: Orange Share of Global M2M Revenue(%)
Figure 4.48: Rogers Communication Share of Global M2M Connections 2014-2016(%)
Figure 4.49: Rogers M2M Connection Share by Service 2013-2016 (%)
Figure 4.50: Rogers M2M Revenue 2015-2016 ($ bn)
Figure 4.51: Rogers CommunicationM2M Share of Wireless Connections 2016-2017(%)
Figure 4.52: Sprint M2M Share of Wireless Connections 2012-2016 (%)
Figure 4.53: Sprint M2M and Wireless Connections 2012-2016 (millions, AGR %)
Figure 4.54: Sprint Share of Global M2M Connections 2014-2016 (%)
Figure 4.55: Sprint M2M Revenue 2016-2017 ($ bn, AGR %)
Figure 4.56: Sprints Share of Global M2M Revenues201 -2016(%)
Figure 4.57: Telecom Italia SpA Total Connections 2011-2015 (M2M, Brazilian and Italian Mobile Connections in Millions, AGR %)
Figure 4.58: Telecom Italia M2M Share of Wireless Connections 2013-2016 (%)
Figure 4.59:Brazilian M2M Connections Forecast 2015-2020 (Connections in Millions, AGR %)
Figure 4.60: Telecom Italia Share of Global M2M Connections 2016-2017 (%)
Figure 4.61: Telecom Italia SpA Total Revenues 2016-2017 (M2M and Other Revenues in $ bn, AGR %)
Figure 4.62: Telecom Italia Share of Global M2M Revenue 2016-2017 (%)
Figure 4.63: Telefónica Total Connections 2013-2016 (M2M Connections in Millions, AGR %)
Figure 4.64: Telefónica M2M Share of Wireless Connections 2012-2016 (%)
Figure 4.65: Telefónica Share of Global M2M Connections 2016-2017 (%)
Figure 4.66: LATAM M2M Connections Forecast 2016-2020 (Connections in Millions, AGR %)
Figure 4.67: Telefónica M2M Revenues 2015-2016 ($ bn)
Figure 4.68: Telefónica Share of Global M2M Revenue(%)
Figure 4.69: Telenor M2M Share of Wireless Connections 2012-2016 (%)
Figure 4.70: Telenor M2M 2013-2016 (millions, AGR %)
Figure 4.71: Telenor Share of Global M2M Connections 2016-2017 (%)
Figure 4.72: Telenor M2M Revenues 2015-2016 ($ bn)
Figure 4.73: Telenor Share of Global M2M Revenues(%)
Figure 4.74: Verizon Total Connections 2011-2014 (M2M, Fixed and Mobile Connections in Millions, AGR %)
Figure 4.75: Verizon M2M Share of Wireless Connections 2013-2016 (%)
Figure 4.76: Verizon Share of Global M2M Connections 2016-20106 (%)
Figure 4.77: Verizon M2M Revenues 2016-2017 ($ bn)
Figure 4.78: Verizon Share of Global M2M Revenue 2016-2017 (%)
Figure 4.79: VimpelCom M2M and Wireless Connections 2012-2016 (millions, AGR %)
Figure 4.80: VimpelCom Share of Global M2M Connections 2014-2016(%)
Figure 4.81: VimpelCom M2M Share of Wireless Connections 2012-2016 (%)
Figure 4.82: VimpelCom M2M Revenues 2012-2015 (M2M & Other Revenues in $ bn, AGR %)
Figure 4.83: VimpelCom Share of Global M2M Revenues 2016-2017 (%)
Figure 4.84: Vodafone Total Connections 2013-2016 (M2M in Millions, AGR %)
Figure 4.85: Vodafone M2M Share of Wireless Connections 2012-2016 (%)
Figure 4.86: Vodafone Share of Global M2M Connections 2014-2016 (%)
Figure 4.87 : Vodafone M2M Revenue 2016-2017 ($ bn)
Figure 4.88: Vodafone Share of Global M2M Revenue 2016-2017 (%)
Figure 4.89: Wyless Total M2M Connections 2015-2016(million connections, AGR %)
Figure 4.90: Wyless Share of GlobalM2M Connections 2014-2016(%)
Figure 4.91: Wyless Total M2M Revenues 2016-2017($ bn)
Figure 4.92: Wyless Share of Global M2M Revenue 2016-2017(%)
List of Tables
Table 2.1: Benefits of M2M
Table 2.2: M2M Applications by Industry or Field
Table 2.3: Global M2M Service Revenue Forecast 2017-2027 ($ billion, AGR %, CAGR %)
Table 2.2: M2M Global Connections Forecast 2018-2028 (millions, AGR %, CAGR %, gross additions)
Table 3.1 Leading 20 Companies in the M2M Market 2017 (Market Ranking, Revenues From M2M $bn, YoY Increase/Decrease, Share of Global Revenues %, M2M Connections in Millions, Share of Global Connections %, Capex)
Table 4.1 : Aeris Company Overview 2016 (M2M Revenue 2017, Global M2M Market Share, Total M2M Subscriptions M, Global M2M Connections Share %, Employees, CEO, HQ, Website)
Table 4.2: AT&T Inc. Company Overview 2017 (Revenue from M2M 2016, Global M2M Market Share, million M2M connections, Global M2M Connections Share %,Total Employees, CEO, HQ, Ticker, and Website)
Table 4.3: AT&T M2M Solution, Assets, and Advantages
Table 4.4: Bharti Airtel Company Overview 2017 (Revenue from M2M 2017, Global M2M Market Share, million M2M connections, Global M2M Connections Share %,Total Employees, CEO, HQ, Ticker, and Website)
Table 4.5: China Mobile Company Overview 2016 (Total Revenue 2017, Revenue from M2M 2016, Net Profit, % Revenue From M2M, Total Company Net Income, Global M2M Market Share, million M2M connections, Global M2M Connections Share %, Employees, CEO, HQ, Ticker, and Website)
Table 4.6: China Mobile M2M Solutions and Leading Verticals
Table 4.7 : China Unicom Overview 2017 (Revenue From M2M, Global M2M Market Share, M2M Connections, Global M2M Connection Share %, Employees, CEO, HQ, Ticker, Contact, Website)
Table 4.8: Deutsche Telekom Company 2017(Revenue from M2M 2017, Global M2M Market Share, million M2M connections, Global M2M Connections Share %,Total Employees, CEO, HQ, Ticker, and Website)
Table 4.9: Deutsche Telekom M2M Solution
Table 4.10:Koninklijke KPN NV Company Overview 2016 (M2M Revenue, Global M2M Market Share %, million M2M connections, Global M2M Connections Share %, Total Employees, CEO, HQ, Ticker, and Website)
Table 4.11: Kore Telematics Overview 2017 (Global M2M Market Share, Total M2M Subscriptions M, Global M2M Connections Share %, Employees, CEO, HQ, Website)
Table 4.12: KORE Telematics M2M Connectivity Services
Table 4.13: NTT DoCoMo Overview 2017 Revenue from M2M 2016$ bn, Global M2M Market Share, million M2M connections, Global M2M Connections Share %, Total Employees, CEO, HQ, Ticker, and Website)
Table 4.14: NTT DoCoMo M2M Offerings
Table 4.15:Numerex Company Overview 2017 (M2M Revenue 2016 $ bn, Global M2M Market Share %, million M2M connections, Global M2M Connections Share %, Total Employees, CEO, HQ, Ticker, and Website)
Table 4.16: Orange Overview 2017 (Revenue From M2M,Global M2M Market Share, M2M Connections, Global M2M Connection Share %, Employees, CEO, HQ, Ticker, Contact, Website)
Table 4.17: Orange M2M Use Cases
Table 4.18: Rogers Communication Company Overview 2017 (Revenue From M2M, Global M2M Market Share, M2M Connections, Global M2M Connection Share %, Employees, CEO, HQ, Ticker, Contact, Website)
Table 4.19: Sprint Corporation Overview 2017 (M2M Revenue, Global M2M Market Share, million M2M connections, Global M2M Connections Share %, Total Employees, CEO, HQ, Ticker, and Website)
Table 4.20: Sprint M2M Solutions and Leading Verticals
Table 4.21: Telecom Italia SpA Telecommunications Company Overview 2017 (Revenue from M2M 2017, $ bn, Global M2M Market Share, million M2M connections, Global M2M Connections Share %, Total Employees, CEO, HQ, Ticker, and Website)
Table 4.22: Telefónica S.A. Overview 2017 (Revenue from M2M 2016, Global M2M Market Share, million M2M connections, Global M2M Connections Share %, Total Employees, CEO, HQ, Ticker, and Website)
Table 4.23: Telefónica M2M Leading Products and Solutions
Table 4.24: Telenor Group Overview 2017 (Revenue from M2M 2017, Global M2M Market Share, million M2M connections, Global M2M Connections Share %, Total Employees, CEO, HQ, Ticker, and Website)
Table 4.25: Verizon Communications Overview 2017 (Revenue from M2M 2017, Global M2M Market Share, million M2M connections, Global M2M Connections Share %, Total Employees, CEO, HQ, Ticker, and Website)
Table 4.26: Verizon’s M2M Solutions
Table 4.27: VimpelCom Overview 2017 (Revenue from M2M 2016, Global M2M Market Share, M2M Connections, Global M2M Connection Share %, Employees, CEO, HQ, Ticker, Contact, Website)
Table 4.28: Vodafone Group Plc Overview 2017 (Revenue From M2M, Global M2M Market Share, Total M2M Subscriptions M, % Share of Global M2M Connections, Employees, CEO, HQ, Ticker, Website)
Table 4.29: Key Features and Benefits of Vodafone’s M2M Solution
Table 4.30: Wyless Group Overview 2017 (Revenue from M2M 2017, Global M2M Market Share, Total M2M Subscriptions, Global M2M Connections Share %, Employees, CEO, HQ, Website)
Table 4.31: Other Leading Companies in the M2M Market 2016
Table 4.31: Other Leading Companies in the M2M Market 2016
Table 5.1: M2M Drivers and Restraints
7 Layers
Aeris
Aeroscout
Alcatel-Lucent
Alien Technology
Arkessa
ARM
Arrayent
AT&T
AT&T Inc
Atos Origin SA
Augusta Systems
AVIDwireless
Berkeley Varitronics Systems
Best Buy
Bharti Airtel
CalAmp
CETECOM
China Mobile
China Unicom
Cinterion
Cisco
Clearconnex
Comtrol
Connect One
Connected Development
Coronis
DataOnline
DataRemote
Deutsche Telekom
Digi International
Docomo
Dust Networks
Echelon
eDevice
ei3
Ember
Enfora
Ericsson
Eseye
Esprida
Eurotech
Everything Everywhere (EE)
Exosite
Feeney Wireless
GE
Gemalto
Globalstar
Honeywell International
Huawei
IBM
ILS Technology
iMetrik Solutions
Inilex
Inmarsat
Intel
Iridium Communications
Itron
iWOW
Janus Remote Communications
Jasper Wireless
Kore Telematics
KPN
Laird Technologies
Lantronix
LG
M2M Communications
M2M DataSmart
Marvell
MEMSIC
Microchip Technology
Microsoft
Millenial Net
Mocana
Morey
Motorola
MOXA
Neoway
Nokia Solutions & Networks
Novatel Wireless
nPhase
NTT DoCoMo
Numerex
Omnilink Systems
Oracle
Orange
ORBCOMM
Palantiri Systems
Panasonic
Perle Systems
Precidia Technologies
Qualcomm
Quectel
Red Bend Software
RF Code Inc.
RF Monolithics
Rogers
Rogers Communications
Sagemcom
Savi Technology
SENA Technologies
SensorLogic
Sierra Wireless
Sigma Designs
SIMcom Wireless Solutions
Sixnet
SkyTel
Sony
Sprint
Sprint Corporation
Swisscom
Synchronoss Technologies
Telecom Italia
Telefónica S.A.
Telefonics
Telenor
Telenor Group
Telit Wireless Solutions
Telular
TELUS Mobility
Texas Instruments
ThingMagic
Tridium
Trimble
Tyntec
Ublox
V2COM
Verizon
Verizon Communications
VimpelCom
Vodafone Group Plc
WebTech Wireless
Wilson Electronics
Wyless
List of Organizations
European Telecommunications Standards Institute (ETSI)
UK’s Department for Energy and Climate Change (DECC)
Download sample pages
Complete the form below to download your free sample pages for Top 20 Machine to Machine (M2M) Companies 2018
Related reports
-

Machine-to-Machine (M2M) Market Report 2017-2027
Our 202-page report provides 160 tables, charts, and graphs. Read on to discover the most lucrative areas in the industry...
Full DetailsPublished: 31 October 2017 -

Internet of Things (IoT) in Aerospace & Defence Market Forecast 2017-2027
Developments in IoT have had a significant impact on the aerospace and defence market. Visiongain’s report on this sector gives...
Full DetailsPublished: 13 June 2017 -

Internet of Things (IoT) Security Market Report 2019-2029
The latest report from business intelligence provider Visiongain offers comprehensive analysis of the global Internet of Things security market. Visiongain...
Full DetailsPublished: 19 November 2018 -

Industrial Control Systems (ICS) Market Report 2018-2028
The industry developments at the HANNOVER MESSE 2017 trade fair has led Visongain to publish this timely report. The $126.2...
Full DetailsPublished: 29 January 2018 -

Connected Home Market Forecast 2017-2027
Developments in connected home have had a significant impact on the consumer electronics and wider IT market. Visiongain’s report on...
Full DetailsPublished: 24 August 2017 -

Industrial Internet of Things (IIoT) World Market to 2030
The latest demand in IIOT has led Visiongain to publish this unique report, which is crucial to your companies improved...Full DetailsPublished: 23 December 2019 -

Industrial Internet of Things (IIoT) Market Report 2018-2028
Visiongain has produced an in-Depth market research report studying the Industrial Internet of Things, analysing the rapid growth of this...
Full DetailsPublished: 01 May 2018 -

Connected Car Market Report 2017-2027
Visiongain’s definitive new report assesses that the connected car market will reach $29.9bn in 201 with considerable prospects for expansion...Full DetailsPublished: 04 July 2017 -

Top 20 Internet of Things (IoT) Companies 2018
The global Top 20 Internet of Things Companies report provides the reader with a thorough overview of the competitive landscape...
Full DetailsPublished: 19 July 2018 -

Connected Aircraft Market Report 2018-2028
Industry professionals: cut through media hype and exaggeration by reading an objective dispassionate Visiongain report on the connected aircraft market....
Full DetailsPublished: 22 May 2018
Download sample pages
Complete the form below to download your free sample pages for Top 20 Machine to Machine (M2M) Companies 2018
Do you have any custom requirements we can help you with?
Any specific country, geo region, market segment or specific company information?
Email us today, we can discuss your needs and see how we can help: jamie.roberts@visiongain.com
Would you like a free report overview of the report of your choice?
If so, please drop an email to Jamie Roberts stating your chosen report title to jamie.roberts@visiongain.com
Visiongain cyber reports are compiled using a broad and rich mixture of both primary and secondary information to produce an overall industry outlook. In order to provide our clients with the best product possible product, Visiongain analysts reach out to market-leading vendors and industry experts but also review a wealth of financial data and product information from a vast range of sources. To find out more about our reports methodology, please email jamie.roberts@visiongain.com
“A quick thanks for the IoT Security Report 2021 received yesterday. It’s well put together and just what I wanted. The whole buying process was quick, as was the delivery. I’ll definitely buy more from Visiongain. Good price too.”
Jack Schuster, Intertek
Latest Cyber news
Quantum Sensors Market
The global Quantum Sensors market is projected to grow at a CAGR of 15.3% by 2034
10 June 2024
Quantum Communication Market
The global Quantum Communication market is projected to grow at a CAGR of 25.7% by 2034
05 June 2024
Predictive Analytics Market
The global predictive analytics market was valued at US$13.69 billion in 2023 and is projected to grow at a CAGR of 21.7% during the forecast period 2024-2034.
29 May 2024
Cloud Security Market
The global Cloud Security market was valued at US$41.15 billion in 2023 and is projected to grow at a CAGR of 12.7% during the forecast period 2024-2034.
24 May 2024
