Industries > Electronics > Industrial Control Systems (ICS) Market Report 2018-2028
Industrial Control Systems (ICS) Market Report 2018-2028
Forecasts by Solution (SCADA, PLC, DCS, MES, PLM, HMI), by Hardware (Control Valves, Control Devices, Robots, Sensors, Enclosures, Accessories), by End-use Vertical (Utility, Automobile, Food & Beverages, Pharmaceuticals, Electric Power Generation, Aerospace & Defence) Plus Analysis of Top Companies Developing Industry 4.0, Smart Factory, Big Data, Advanced Analytics, Cloud Computing, IoT & M2M
• Do you need definitive Industrial Control System market data?
• Succinct Industrial Control System market analysis?
• Technological insight?
• Clear competitor analysis?
• Actionable business recommendations?
Read on to discover how this definitive report can transform your own research and save you time.
The industry developments at the HANNOVER MESSE 2017 trade fair has led Visongain to publish this timely report. The $126.2 Bn industrial control system market is expected to flourish in the next few years because of increasing adoption industry 4.0 and penetration across multiple industry verticals with high rates in biotechnology and pharmaceutical industries are expected to feed through in the latter part of the decade driving growth to new heights. If you want to be part of this growing industry, then read on to discover how you can maximise your investment potential.
Report highlights
• 177 Quantitative Tables, Charts, And Graphs
• Analysis Of Key Players In Industrial Control Systems
• ABB Ltd
• Emerson Electric Company
• Schneider Electric
• Rockwell Automation, Inc.
• Mitsubishi Electric Corporation
• Siemens AG
• Honeywell International Inc.
• Global Industrial Control Systems Market Analysis From 2018-2028
• Industrial Control Systems End-Use Vertical Forecasts And Analysis From 2018-2028
• Utility Forecast 2018-2028
• Automobiles Forecast 2018-2028
• Food & beverage Forecast 2018-2028
• Pharmaceuticals Forecast 2018-2028
• Electrical power generation Forecast 2018-2028
• Aerospace & Defence Forecast 2018-2028
• Mining & Metals Forecast 2018-2028
• Others Forecast 2018-2028
• Industrial Control Systems Solution Projections, Analysis And Potential From 2018-2028
• Supervisory Control And Data Acquisition (SCADA) Forecast 2018-2028
• Programmable Logic Controller (PLC), Forecast 2018-2028
• Distributed Control Systems (DCS), Forecast 2018-2028
• Manufacturing Executive System (MES) Forecast 2018-2028
• Product Lifecycle Management (PLM), Forecast 2018-2028
• Human Machine Interface (HMI)) Forecast 2018-2028
• Industrial Control Systems Hardware Forecasts, Analysis And Outlook From 2018-2028
• Control Valves Forecast 2018-2028
• Control Devices Forecast 2018-2028
• Robots Forecast 2018-2028
• Sensors Forecast 2018-2028
• Enclosures Forecast 2018-2028
• Accessories Forecast 2018-2028
• Regional Industrial Control Systems Forecasts From 2018-2028
• Americas Industrial Control Systems Forecasts 2018-2028
• Europe Industrial Control Systems Forecasts 2018-2028
• MEA Industrial Control Systems Forecasts 2018-2028
• APAC Industrial Control Systems Forecasts 2018-2028
• Key Questions Answered
• What does the future hold for the Industrial control systems industry?
• Where should you target your business strategy?
• Which applications should you focus upon?
• Which disruptive technologies should you invest in?
• Which companies should you form strategic alliances with?
• Which company is likely to success and why?
• What business models should you adopt?
• What industry trends should you be aware of?
• Target Audience
• Industrial control system companies
• Electronic sensor suppliers
• Software developers
• Industrial Internet of Things specialists
• Automation & control systems companies
• Manufacturers
• Technologists
• Systems engineers
• R&D staff
• Consultants
• Analysts
• Senior executives
• Business development managers
• Investors
• Governments
• Industry organisations
• Banks
• Governments & Agencies
Visiongain is a trading partner with the US Federal Government
CCR Ref number: KD4R6
1. Report Overview
1.1. Industrial Control Systems Market Definition and Research Scope
1.2. Why You Should Read This Report
1.3. How This Report Delivers
1.3.1. Key Questions Answered by This Analytical Report Include:
1.4. Who is This Report For?
1.5. Methodology
1.6. Frequently Asked Questions (FAQ)
1.7. Associated Visiongain Reports.
1.8. About Visiongain.
2. Introduction to the Industrial Control System Market
2.1. Value Chain Analysis
2.2. Market Dynamics
2.2.1. Drivers.
2.2.2. Trends
2.2.3. Restraints
2.2.4. Challenges
3. Global Industrial Control System Market, 2018–2028
3.1. Global Industrial Control System Market Forecast 2018–2028
3.2. Global Industrial Control System Market Forecast 2018–2028
4. Global Industrial Control System Market, By Component 2018-2028
4.1. Global Industrial Control System Market Forecast, By Component 2018–2028
5. Global Industrial Control System Market, By Solution 2018-2028
5.1. Global Industrial Control System Market Forecast, By Solution 2018–2028
5.1.1 SCADA Submarket Forecast 2018-2028.
5.1.2. PLC Submarket Forecast 2018-2028.
5.1.3. DCS Submarket Forecast 2018-2028.
5.1.4. MES Submarket Forecast 2018-2028.
5.1.5. HMI Submarket Forecast 2018-2028.
5.1.6. PLM Submarket Forecast 2018-2028.
6. Global Industrial Control System Market, By Hardware 2018-2028
6.1. Global Industrial Control System Market Forecast, By Hardware 2018–2028
6.1.1. Control Devices Submarket Forecast 2018-2028
6.1.2. Control Valves Submarket Forecast 2018-2028
6.1.3. Robots Submarket Forecast 2018-2028
6.1.4. Sensors Submarket Forecast 2018-2028.
6.1.5. Enclosures Submarket Forecast 2018-2028
6.1.6. Accessories Submarket Forecast 2018-2028
7. Global Industrial Control System Market Forecast, By End-Use Vertical 2018-2028
7.1. Global Industrial Control System Market Forecast, By End-Use Vertical 2018-2028.
7.1.1. Utility Submarket Forecast 2018-2028
7.1.2. Automobiles Submarket Forecast 2018-2028
7.1.3. Mining & Metals Submarket Forecast 2018-2028.
7.1.4. Food & Beverages Submarket Forecast 2018-2028
7.1.5. Pharmaceuticals Submarket Forecast 2018-2028
7.1.6. Electrical Power Generation Submarket Forecast 2018-2028
7.1.7. Aerospace & Defence Submarket Forecast 2018-2028
7.1.8. Others Submarket Forecast 2018-2028
8. Global Industrial Control System Market, by Geography 2018–2028
8.1. Americas Industrial Control System Market Forecast 2018-2028
8.1.1. Americas Industrial Control System Market Forecast, By Component 2018-2028
8.1.2. Americas Industrial Control System Market Forecast, By Solution 2018-2028
8.1.3. Americas industrial control system market Forecast, By Hardware 2018-2028
8.1.4. Americas Industrial Control System Market Forecast, By End Use Industry 2018-2028.
8.2. Europe Industrial Control System Market Forecast 2018-2028
8.2.1. Europe Industrial Control System Market Forecast, By Component 2018-2028.
8.2.2. Europe Industrial Control System Market Forecast, By Solution 2018-2028
8.2.3. Europe Industrial Control System Market Forecast, By Hardware 2018-2028
8.2.4. Europe Industrial Control System Market Forecast, By End-Use Industry 2018-2028
8.3. APAC Industrial Control System Market Forecast 2018-2028
8.3.1. APAC Industrial Control System Market Forecast, By Component 2018-2028
8.3.2. APAC Industrial Control System Market Forecast, By Solution 2018-2028
8.3.3. APAC Industrial Control System Market Forecast, By Hardware 2018-2028
8.3.4. APAC Industrial Control System Market Forecast, By End-Use Industry 2018-2028
8.4. MEA Industrial Control System Market Forecast 2018-2028
8.4.1. MEA Industrial Control System Market Forecast, By Component 2018-2028
8.4.2. MEA Industrial Control System Market Forecast, By Solution 2018-2028
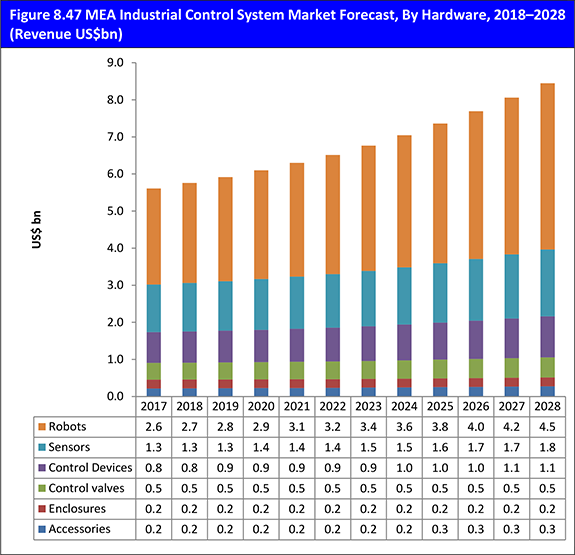
8.4.3. MEA Industrial Control System Market Forecast, By Hardware 2018-2028
8.4.4. MEA Industrial Control System Market Forecast, By End-Use Industry 2018-2028
9. Competition Landscape
9.1. ABB.
9.1.1. ABB Recent Developments (2016-2017)
9.1.2. ABB Total Company Sales 2011-2016
9.1.3. ABB Total Sales, By Geography 2012-2016
9.1.4. ABB Primary Market Competitors 2017
9.2. Emerson Electric Co.
9.2.1. Emerson Electric Co. Recent Developments (2016-2017)
9.2.2. Emerson Electric Co. Total Company Sales 2011-2016
9.2.3. Emerson Electric Co. Sales by Geography 2013-2016
9.2.4. Emerson Electric Co. Primary Market Competitors 2017
9.3. Schneider Electric SE.
9.3.1. Schneider Electric SE Recent Developments 2016-2017
9.3.2. Schneider Electric SE Total Company Sales 2011-2016
9.3.3. Schneider Electric SE Sales by Geography 2013-2016
9.3.4. Schneider Electric SE Primary Market Competitors 2017
9.4. Rockwell Automation, Inc. (A subsidiary of Samsung Electronics Co., Ltd)
9.4.1. Rockwell Automation, Inc. Recent Developments 2014-2017
9.4.2. Rockwell Automation, Inc. Total Company Sales 2011-2016
9.4.3. Rockwell Automation, Inc. Sales by Geography 2013-2016
9.4.4. Rockwell Automation, Inc. Primary Market Competitors 2017
9.5. Honeywell International, Inc.
9.5.1. Honeywell International Inc. Recent Developments 2016-2017
9.5.2. Honeywell International Inc. Total Company Sales 2011-2016
9.5.3. Honeywell International Inc. Sales by Geography 2013-2016
9.5.4. Honeywell International Inc. Primary Market Competitors 2017
9.6. Siemens AG.
9.6.1. Siemens AG Recent Developments 2017
9.6.2. Siemens AG Total Company Sales 2011-2016
9.6.3. Siemens AG Sales by Geography 2013-2016
9.6.4. Siemens AG Primary Market Competitors 2017
9.7. Mitsubishi Electric Corporation.
9.7.1. Mitsubishi Electric Corporation - Company Overview
9.7.2. Mitsubishi Electric Corporation Recent Developments 2016-2017
9.7.3. Mitsubishi Electric Corporation Total Company Sales 2014-2016
9.7.4. Mitsubishi Electric Corporation Primary Market Competitors 2017
10. Conclusions and Recommendations
10.1. Key Research Finding 2018-2028
10.2. Conclusion by Geography
10.3. Conclusion by Component 2018-2028
10.4. Conclusion by Application 2018-2028
10.5. Strategic Recommendations
10.5.1 What Is The Present Market Scenario?
10.5.2 Which Regions Should Be Targeted?
11. Glossary
List of Tables
Table 1.1 industrial Control Systems Market: Report Segmentation
Table 3.1: Global Industrial Control System Market Forecast 2018–2028 (US$ bn, AGR %, CAGR %)
Table 4.1: Global Industrial Control System Market Forecast by Component, 2018–2028 (US$ Bn, AGR %, CAGR %)
Table 5.1: Global Industrial Control System Market Forecast by Solution, 2018–2028 (US$ Bn, AGR %, CAGR %)
Table 6.1: Global Industrial Control System Market Forecast by Hardware, 2018–2028 (US$ Bn, AGR %, CAGR %)
Table 7.1: Global Industrial Control System Market Forecast 2018–2028(US$ Bn, AGR %, CAGR %), By End-use Vertical
Table 8.1: Global Industrial Control System Market Forecast by Geography 2018–2028 (US$ Bn, AGR %, CAGR %)
Table 8.2: Americas Industrial Control System Market Forecast, By Component, 2018–2028 (US$ Bn, AGR %, CAGR %)
Table 8.3: Americas Industrial Control System Market Forecast, By Solution, 2018–2028 (US$ Bn, AGR %, CAGR %)
Table 8.4: Americas Industrial Control System Market Forecast, By Hardware, 2018–2028 (US$ Bn, AGR %, CAGR %)
Table 8.5: Americas Industrial Control System Market Forecast, By End-use Industry, 2018–2028 (US$ Bn, AGR %, CAGR %)
Table 8.6: Europe Industrial Control System Market Forecast, By Component, 2018–2028 (US$ Bn, AGR %, CAGR %)
Table 8.7: Europe Industrial Control System Market Forecast, By Solution, 2018–2028 (US$ Bn, AGR %, CAGR %)
Table 8.8: Europe Industrial Control System Market Forecast, By Hardware, 2018–2028 (US$ Bn, AGR %, CAGR %)
Table 8.9: Europe Industrial Control System Market Forecast, By End-Use Industry, 2018–2028 (US$ Bn, AGR %, CAGR %)
Table 8.10: APAC Industrial Control System Market Forecast, By Component, 2018–2028 (US$ Bn, AGR %, CAGR %)
Table 8.11: APAC Industrial Control System Market Forecast, By Solution 2018–2028 (US$ Bn, AGR %, CAGR %)
Table 8.12: APAC Industrial Control System Market Forecast, By Hardware, 2018–2028 (US$ Bn, AGR %, CAGR %)
Table 8.13: APAC Industrial Control System Market Forecast, By End-Use Industry, 2018–2028 (US$ Bn, AGR %, CAGR %)
Table 8.14: MEA Industrial Control System Market Forecast, By Component, 2018–2028 (US$ Bn, AGR %, CAGR %)
Table 8.15: MEA Industrial Control System Market Forecast, By Solution, 2018–2028 (US$ Bn, AGR %, CAGR %)
Table 8.16: MEA Industrial Control System Market Forecast, By Hardware, 2018–2028 (US$ Bn, AGR %, CAGR %)
Table 8.17: MEA Industrial Control System Market Forecast, By End-use Industry, 2018–2028 (US$ Bn, AGR %, CAGR %)
Table 9.1 ABB Profile 2016 (CEO, Total Company Sales US$m, Sales from company division that includes ICS in US$m, Net Income US$m, Strongest Business Region, HQ, Founded, No. of Employees, IR Contact, Ticker, Website)
Table 9.2 ABB Recent Developments
Table 9.3 ABB Total Company Sales 2011-2016 (US$bn, AGR %)
Table 9.4 Emerson Electric Co. 2016 (CEO, Total Company Sales US$m, Net Income US$m, Net Capital Expenditure US$m, Strongest Business Region, HQ, Founded, No. of Employees 2016, IR Contact, Ticker, Website)
Table 9.5 Emerson Electric Co. Recent Developments
Table 9.6 Emerson Electric Co. Total Company Sales 2012-2016 (US$ Bn, AGR %)
Table 9.7 Schneider Electric SE Profile 2016 (CEO, Total Company Sales US$m, Sales from company division that includes ICS (US$m), Net Income / Loss US$m, Net Capital Expenditure US$m, Strongest Business Region, HQ, Founded, No. of Employees, IR Contact, Ticker, Website)
Table 9.8 Schneider Electric SE Recent Developments
Table 9.9 Schneider Electric SE Total Company Sales 2011-2016 (US$m, AGR %)
Table 9.10 Rockwell Automation, Inc. 2016 (CEO, Total Company Sales US$m, Sales from company division that includes ICS (US$ bn), Strongest Business Region, HQ, Founded, No. of Employees, IR Contact, Website)
Table 9.11 Rockwell Automation, Inc. Recent Developments
Table 9.12 Rockwell Automation, Inc. Total Company Sales 2011-2016 (US$m, AGR %)
Table 9.13 Honeywell International Inc. Profile 2016 (CEO, Total Company Sales US$m, Sales from company division that includes ICS (US$m), Net Income US$m, Net Capital Expenditure US$m, Strongest Business Region, HQ, Founded, No. of Employees, IR Contact, Ticker, Website)
Table 9.14 Honeywell International Inc. Recent Developments
Table 9.15 Honeywell International Inc. Total Company Sales 2011-2016 (US$m, AGR %)
Table 9.16 Siemens AG Profile 2016 (CEO, Total Company Sales US$m, Sales from company division that includes ICS (US$m), Net Income US$m, Net Capital Expenditure US$m, Strongest Business Region, HQ, Founded, No. of Employees, IR Contact, Ticker, Website)
Table 9.17 Siemens AG Recent Developments
Table 9.18 Siemens AG Total Company Sales 2011-2016 (US$m, AGR %)
Table 9.19: Mitsubishi Electric Corporation Profile 2016 (Chairman, Total Company Sales US$m, Business Segment in the Market, Submarket Involvement, HQ, Founded, No. of Employees, Website)
Table 9.20 Mitsubishi Electric Corporation Recent Developments
Table 9.21 Mitsubishi Electric Corporation Total Company Sales 2014-2016 (US$m)
Table 10.1 Global Industrial Control System Market 2018–2028
Table 10.2 Conclusion by Geography 2018–2028
Table 10.3 Conclusion by Component 2018–2028
Table 10.4 Conclusion by Application 2018–2028
List of Figures
Figure 2.1 Value Chain Analyses
Figure 2.2 Number of Recent ICS Attacks Over The Past Three Years; 2013-2016
Figure 3.1: Global Industrial Control System Market Forecast 2018–2028 (US$ bn, AGR %)
Figure 4.1: Global Industrial Control System Market AGR Forecast by Component 2018 2028 (AGR %)
Figure 4.2: Global Industrial Control System Market Forecast by Component 2018–2028 (Revenue US$Bn)
Figure 4.3: Global Industrial Control System Market Share Forecast by Component 2018 (% Share)
Figure 4.4: Global Industrial Control System Market Share Forecast by Component 2023 (% Share)
Figure 4.5: Global Industrial Control System Market Share Forecast by Component 2028 (% Share)
Figure 5.1: Global Industrial Control System Market AGR Forecast by Solution 2018–2028 (AGR %)
Figure 5.2: Global Industrial Control System Market Forecast by Solution 2018–2028 (Revenue US$Bn)
Figure 5.3: Global Industrial Control System Market Share Forecast by Solution 2018 (% Share)
Figure 5.4: Global Industrial Control System Market Share Forecast by Solution 2023 (% Share)
Figure 5.5: Global Industrial Control System Market Share Forecast by Solution 2028 (% Share)
Figure 5.7: Global Industrial Control System Market Share Forecast By SCADA, 2018 (% Share)
Figure 5.8: Global Industrial Control System Market Share Forecast By SCADA, 2028 (% Share)
Figure 5.9: Global Industrial Control System Market Share Forecast By PLC, 2018 (% Share)
Figure 5.10: Global Industrial Control System Market Share Forecast By PLC, 2028 (% Share)
Figure 5.11: Global Industrial Control System Market Share Forecast By DCS, 2018 (% Share)
Figure 5.12: Global Industrial Control System Market Share Forecast By DCS, 2028 (% Share)
Figure 5.13: Global Industrial Control System Market Share Forecast By MES, 2018 (% Share)
Figure 5.14: Global Industrial Control System Market Share Forecast By MES, 2028 (% Share)
Figure 5.15: Global Industrial Control System Market Share Forecast By HMI, 2018 (% Share)
Figure 5.16: Global Industrial Control System Market Share Forecast By HMI, 2028 (% Share)
Figure 5.17: Global Industrial Control System Market Share Forecast By PLM, 2018 (% Share)
Figure 5.18: Global Industrial Control System Market Share Forecast By PLM, 2028 (% Share)
Figure 6.1: Global Industrial Control System Market Forecast by Hardware 2018–2028(Revenue US$bn)
Figure 6.2: Global Industrial Control System Market Share Forecast By Control Devices, 2018 (% Share)
Figure 6.3: Global Industrial Control System Market Share Forecast By Control Devices, 2028 (% Share)
Figure 6.4: Global Industrial Control System Market Share Forecast By Control Valves, 2018 (% Share)
Figure 6.5: Global Industrial Control System Market Share Forecast By Control Valves, 2028 (% Share)
Figure 6.6: Global Industrial Control System Market Share Forecast By Robots, 2018 (% Share)
Figure 6.7: Global Industrial Control System Market Share Forecast By Robots, 2028 (% Share)
Figure 6.8: Global Industrial Control System Market Share Forecast By Sensors, 2028 (% Share)
Figure 6.9: Global Industrial Control System Market Share Forecast By Sensors, 2028 (% Share)
Figure 6.10: Global Industrial Control System Market Share Forecast By Enclosures, 2018 (% Share)
Figure 6.11: Global Industrial Control System Market Share Forecast By Enclosures, 2028 (% Share)
Figure 6.12: Global Industrial Control System Market Share Forecast By Accessories, 2018 (% Share)
Figure 6.13: Global Industrial Control System Market Share Forecast By Accessories, 2028 (% Share)
Figure 7.1 Global Industrial Control System Market Forecast by End-use Industry 2018–2028(US$ bn)
Figure 7.2: Global Industrial Control System Market Share Forecast By Utility, 2018 (% Share)
Figure 7.3: Global Industrial Control System Market Share Forecast By Utility, 2028 (% Share)
Figure 7.4: Global Industrial Control System Market Share Forecast By Automobiles, 2018 (% Share)
Figure 7.5: Global Industrial Control System Market Share Forecast By Automobiles, 2028 (% Share)
Figure 7.6: Global Industrial Control System Market Share Forecast By Mining & Metals, 2018 (% Share)
Figure 7.7: Global Industrial Control System Market Share Forecast By Mining & Metals, 2028 (% Share)
Figure 7.8: Global Industrial Control System Market Share Forecast By Food & Beverages, 2018 (% Share)
Figure 7.9 Global Industrial Control System Market Share Forecast By Food & Beverages, 2028 (% Share)
Figure 7.10 Global Industrial Control System Market Share Forecast By Pharmaceuticals, 2018 (% Share)
Figure 7.11 Global Industrial Control System Market Share Forecast By Pharmaceuticals, 2028 (% Share)
Figure 7.12 Global Industrial Control System Market Share Forecast By Electrical Power Generation, 2018 (% Share)
Figure 7.13 Global Industrial Control System Market Share Forecast By Electrical Power Generation, 2028 (% Share)
Figure 7.14 Global Industrial Control System Market Share Forecast By Aerospace & Defence, 2018 (% Share)
Figure 7.15 Global Industrial Control System Market Share Forecast By Aerospace & Defence, 2028 (% Share)
Figure 7.16 Global Industrial Control System Market Share Forecast By Others, 2018 (% Share)
Figure 7.17 Global Industrial Control System Market Share Forecast By Others, 2028 (% Share)
Figure 8.1: Global Industrial Control System Market AGR Forecast by Geography 2018–2028 (AGR %)
Figure 8.2: Global Industrial Control System Market AGR Forecast by Geography 2018–2028 (AGR %)
Figure 8.3: Global Industrial Control System Market Share Forecast by Geography 2018 (% Share)
Figure 8.4: Global Industrial Control System Market Share Forecast by Geography 2028 (% Share)
Figure 8.5: Americas Industrial Control System Market Forecast, By Component, 2018–2028(Revenue US$bn)
Figure 8.6: Americas Industrial Control System Market Forecast, By Component, 2018 (% Share)
Figure 8.7: Americas Industrial Control System Market Forecast, By Component, 2028 (% Share)
Figure 8.8: Americas Industrial Control System Market Forecast, By Solution 2018–2028(Revenue US$bn)
Figure 8.9: Americas Industrial Control System Market Share, By Solution, 2018 (% Share)
Figure 8.10: Americas Industrial Control System Market Share, By Solution, 2028 (% Share)
Figure 8.11: Americas Industrial Control System Market Forecast, By Hardware, 2018–2028(AGR %)
Figure 8.12: Americas Industrial Control System Market Share, By Hardware, 2018 (% Share)
Figure 8.13: Americas Industrial Control System Market Share, By Hardware, 2028 (% Share)
Figure 8.14: Americas Industrial Control System Market Forecast, By End-Use Industry, 2018–2028(AGR %)
Figure 8.15: Americas Industrial Control System Market Share, By End-Use Industry, 2018 (% Share)
Figure 8.16: Americas Industrial Control System Market Share, By End-Use Industry, 2028 (% Share)
Figure 8.17: Europe Industrial Control System Market Forecast, By Component, 2018–2028 (Revenue US$bn)
Figure 8.18: Europe Industrial Control System Market Share, By Component, 2018 (% Share)
Figure 8.19: Europe Industrial Control System Market Share, By Component, 2028 (% Share)
Figure 8.20: Europe Industrial Control System Market Forecast, By Solution, 2018–2028 (Revenue US$bn)
Figure 8.21: Europe Industrial Control System Market Share, By Solution, 2018 (% Share)
Figure 8.22: Europe Industrial Control System Market Share, By Solution, 2028 (% Share)
Figure 8.23: Europe Industrial Control System Market Forecast, By Hardware, 2018–2028 (Revenue US$ bn)
Figure 8.24: Europe Industrial Control System Market Share, By Hardware, 2018 (% Share)
Figure 8.25: Europe Industrial Control System Market Share, By Hardware, 2028 (% Share)
Figure 8.26: Europe Industrial Control System Market Forecast, By End-Use Industry, 2018–2028 (AGR %)
Figure 8.27: Europe Industrial Control System Market Share, By End-use Industry, 2018 (% Share)
Figure 8.28: Europe Industrial Control System Market Share, By End-use Industry, 2028 (% Share)
Figure 8.29: APAC Industrial Control System Market Forecast, By Component, 2018–2028 (Revenue US$bn)
Figure 8.20: APAC Industrial Control System Market Share, By Component, 2018 (% Share)
Figure 8.31 APAC Industrial Control System Market Share, By Component, 2028 (% Share)
Figure 8.32: APAC Industrial Control System Market Forecast, By Solution, 2018–2028 (Revenue US$bn)
Figure 8.33: APAC Industrial Control System Market Share, By Solution, 2018 (% Share)
Figure 8.34: APAC Industrial Control System Market Share, By Solution, 2028 (% Share)
Figure 8.35: APAC Industrial Control System Market Forecast, By End-Use Industry, 2018–2028(AGR %)
Figure 8.36: APAC Industrial Control System Market Share, By End-Use Industry, 2018 (% Share)
Figure 8.37 APAC Industrial Control System Market Share, By End-Use Industry, 2028 (% Share)
Figure 8.38: MEA Industrial Control System Market Forecast, By Component, 2018–2028 (Revenue US$bn)
Figure 8.39: MEA Industrial Control System Market Share, By Component, 2018 (% Share)
Figure 8.40: MEA Industrial Control System Market Share, By Component, 2028 (% Share)
Figure 8.41: MEA Industrial Control System Market Forecast, By Component 2018–2028 (Revenue US$bn)
Figure 8.42: MEA Industrial Control System Market Share, By Component 2018 (% Share)
Figure 8.43: MEA Industrial Control System Market Share, By Component 2028 (% Share)
Figure 8.44: MEA Industrial Control System Market Forecast, By Solution, 2018–2028 (Revenue US$bn)
Figure 8.45: MEA Industrial Control System Market Share, By Solution, 2018 (% Share)
Figure 8.46: MEA Industrial Control System Market Share, By Solution, 2028 (% Share)
Figure 8.47: MEA Industrial Control System Market Forecast, By Hardware, 2018–2028 (Revenue US$bn)
Figure 8.48: MEA Industrial Control System Market Share, By Hardware, 2018 (% Share)
Figure 8.49: APAC Industrial Control System Market Share, By Hardware, 2028 (% Share)
Figure 8.50: MEA Industrial Control System Market Forecast, By End-Use Industry, 2018–2028 (Revenue US$bn)
Figure 8.51: MEA Industrial Control System Market Share, By End-Use Industry, 2018 (% Share)
Figure 8.52: APAC Industrial Control System Market Share, By End-Use Industry, 2028 (% Share)
Figure 9.1 ABB Total Company Sales 2011-2016 (US$m)
Figure 9.2 ABB Sales by Geography 2012-2016 (US$m)
Figure 9.3: ABB Primary Market Competitors 2017
Figure 9.4 Emerson Electric Co. Total Company Sales 2011-2016 (US$ Bn)
Figure 9.5 Emerson Electric Co. Sales by Geography 2012-2015 (US$ Bn)
Figure 9.6: Emerson Electric Co. Primary Market Competitors 2017
Figure 9.7 Schneider Electric SE Total Company Sales 2011-2016 (US$m)
Figure 9.8 Schneider Electric SE Sales by Geography 2013-2016 (US$m, Total Company Sales)
Figure 9.9: Schneider Electric SE Primary Market Competitors 2017
Figure 9.10 Rockwell Automation, Inc. Total Company Sales 2011-2016 (US$m)
Figure 9.11 Rockwell Automation, Inc. Sales by Geography 2013-2016 (US$m)
Figure 9.12: Rockwell Automation, Inc. Primary Market Competitors 2017
Figure 9.13 Honeywell International Inc. Total Company Sales 2011-2016 (US$m)
Figure 9.14 Honeywell International Inc. Sales by Geography 2013-2016 (US$m)
Figure 9.15: Honeywell International Inc. Primary Market Competitors 2017
Figure 9.17 Siemens AG Total Company Sales 2011-2016 (US$m)
Figure 9.18 Siemens AG Sales by Geography 2013-2016 (US$m, Total Company Sales)
Figure 9.19 Siemens AG Primary Market Competitors 2017
Figure 9.20 Mitsubishi Electric Corporation Total Company Sales 2014-2016 (US$m)
Figure 9.21: Mitsubishi Electric Corporation Primary Market Competitors 2017
3M Co
ABB
Accenture Plc.
Acclaim Lighting
Acuity Brands Lighting, Inc
ADT Corporation
Amphenol Corporation
Analogic Corporation
Angleur
Autodesk Inc
B&R (Bernecker + Rainer Industrie-Elektronik GmbH)
Beersel
Bre Synopsys, Inc.
Celestica Inc
Cisco
Daimler AG
Eaton Corporation Plc
EM Microelectronic SA
Emerson
Emerson Automation Solutions
Emerson Electric Company
ENGIE
Espoo
European Energy
Flex inc.
Flint Hills Resources
Foxconn
Fuji Electric
GE Intelligent Platforms
General Electric
Gutor Electronic LLC
Honeywell
Honeywell (China) Co., Ltd.
Honeywell Japan Inc. (Japan)
Honeywell Korea, Ltd. (Korea)
Honeywell Limited (Australia)
Illinois Tool Works Inc
Intel Corporation
Invensys
Johnson Controls International plc
KPPC
Luminous Power Technologies Pvt Ltd
Mahindra and Mahindra Limited
Massy
Mercedes-Benz
Mercury Systems Inc
Metso
Microsoft Corporation
Mitsubishi
Mitsubishi Electric Corporation
Mitsubishi Electric Europe
MYNAH Technologies
Omron
Pacific Gas and Electric Company (PG&E)
Panasonic Corporation
PAS Global
Power Company
Renault-Nissan Alliance
Robert Bosch
Rockwell Automation Inc.
Samsung Electronics Co., Ltd
Samtech France SAS
Samtech SA
SAP AG
Schneider Electric SE
Siemens
Siemens Building Technologies
Siemens Healthcare Oy
Siemens PLM software
Siemens S.A
SmartThings Inc.
SolveIT Software
Symantec
Tata Motors Limited
Telemecanique
Universal Display Corporation
Volkswagen
Wahl Clipper Corporation
Yokogawa
Organisations Mentioned
Cuyahoga Community College (Tri-C)
National Council For Advanced Manufacturing (NACFAM)
Ranken Technical College
The San Francisco Public Utilities Commission
US Justice Department
Download sample pages
Complete the form below to download your free sample pages for Industrial Control Systems (ICS) Market Report 2018-2028
Related reports
-

Machine-to-Machine (M2M) Market Report 2017-2027
Our 202-page report provides 160 tables, charts, and graphs. Read on to discover the most lucrative areas in the industry...
Full DetailsPublished: 31 October 2017 -

Industrial Internet of Things (IIoT) World Market to 2030
The latest demand in IIOT has led Visiongain to publish this unique report, which is crucial to your companies improved...Full DetailsPublished: 23 December 2019 -

Top 20 Internet of Things (IoT) Companies 2018
The global Top 20 Internet of Things Companies report provides the reader with a thorough overview of the competitive landscape...
Full DetailsPublished: 19 July 2018 -

Internet of Things (IoT) in Aerospace & Defence Market Forecast 2017-2027
Developments in IoT have had a significant impact on the aerospace and defence market. Visiongain’s report on this sector gives...
Full DetailsPublished: 13 June 2017 -

Internet of Things (IoT) Security Market Report 2019-2029
The latest report from business intelligence provider Visiongain offers comprehensive analysis of the global Internet of Things security market. Visiongain...
Full DetailsPublished: 19 November 2018 -

Internet of Things (IoT) Market Report 2018-2028
The latest report from business intelligence provider Visiongain offers comprehensive analysis of the global Internet of Things market. Visiongain assesses...
Full DetailsPublished: 13 April 2018 -

Industrial Internet of Things (IIoT) Market Report 2018-2028
Visiongain has produced an in-Depth market research report studying the Industrial Internet of Things, analysing the rapid growth of this...
Full DetailsPublished: 01 May 2018 -

Connected Home Market Forecast 2017-2027
Developments in connected home have had a significant impact on the consumer electronics and wider IT market. Visiongain’s report on...
Full DetailsPublished: 24 August 2017 -

Connected Car Market Report 2017-2027
Visiongain’s definitive new report assesses that the connected car market will reach $29.9bn in 201 with considerable prospects for expansion...Full DetailsPublished: 04 July 2017 -

Connected Aircraft Market Report 2018-2028
Industry professionals: cut through media hype and exaggeration by reading an objective dispassionate Visiongain report on the connected aircraft market....
Full DetailsPublished: 22 May 2018
Download sample pages
Complete the form below to download your free sample pages for Industrial Control Systems (ICS) Market Report 2018-2028
Do you have any custom requirements we can help you with?
Any specific country, geo region, market segment or specific company information?
Email us today, we can discuss your needs and see how we can help: jamie.roberts@visiongain.com
Would you like a free report overview of the report of your choice?
If so, please drop an email to Jamie Roberts stating your chosen report title to jamie.roberts@visiongain.com
Visiongain electronics related reports are compiled using a broad and rich mixture of both primary and secondary information to produce an overall industry outlook. In order to provide our clients with the best product possible product, Visiongain analysts reach out to market-leading vendors and industry experts but also review a wealth of financial data and product information from a vast range of sources. To find out more about our reports methodology, please email jamie.roberts@visiongain.com
Would you like to get the latest Visiongain electronics reports catalogue?
What are the dynamic growth sectors? where are the regional business opportunities?
Which technologies will prevail and who are the leading companies succeeding in these sectors and why?
If you want definitive answers to business critical questions, discover Visiongain’s full range of business intelligence reports.
If so, please email Jamie Roberts on jamie.roberts@visiongain.com or call her today on +44 207 336 6100
Latest Electronics news
Visiongain Publishes Printed Electronics Market Report 2023-2033
The global Printed Electronics market was valued at US$9.94 million in 2022 and is projected to grow at a CAGR of 15.5% during the forecast period 2023-2033.
27 March 2023
Visiongain Publishes Smart TV Market Report 2023-2033
The global Smart TV market was valued at US$224 billion in 2022 and is projected to grow at a CAGR of 10.9% during the forecast period 2023-2033. And in terms of volume the market is projected to reach 320.4 million units by 2033.
08 March 2023
Visiongain Publishes Smart Manufacturing Market Report 2023-2033
The global Smart Manufacturing market was valued at US$97.81 billion in 2022 and is projected to grow at a CAGR of 14.7% during the forecast period 2023-2033.
24 January 2023
Visiongain Publishes Smart Sensors Market Report 2023-2033
The global Smart Sensors market was valued at US$57.77 billion in 2022 and is projected to grow at a CAGR of 20.5% during the forecast period 2023-2033.
23 December 2022
