Industries > Cyber > Connected Home Market Forecast 2017-2027
Connected Home Market Forecast 2017-2027
Forecasts by Component, by Application, by Connectivity Technology, and by Geography (Americas, Europe, APAC, MEA), including Energy Tracking, Smart Appliance, Multimedia Control, Connectivity Technology, and Access Control, Among Others
Developments in connected home have had a significant impact on the consumer electronics and wider IT market. Visiongain’s report on this sector gives a detailed overview of the market, creating an accurate picture that will offer clarity to anyone involved in the connected technologies market. Importantly, the report also delivers a forecast of the market, giving you an insight into the future opportunities that exist in the connected home market. Visiongain understands that this market will be worth $56.9bn in 2017 alone.
This report offers a global forecast, which is then broken down by the following regional markets:
• Americas
– By Component
– By Application
– By Connectivity Technology
• Europe
– By Component
– By Application
– By Connectivity Technology
• APAC
– By Component
– By Application
– By Connectivity Technology
• MEA
– By Component
– By Application
– By Connectivity Technology
As well as the following submarkets:
By Component:
• Software
• Hardware
• Services
By Application:
• Safety & Security
– Video Surveillance
– Access Control
– Smoke & Leak Detectors
– Others
• Utility Management
– HVAC
– Lighting Control
– Energy Tracking
– Smart Meter
• Smart Appliance
– Connected Washer/Dryer/Dishwasher
– Connected Refrigerator
– Connected Stove/Oven
• Smart Entertainment
– Multimedia Control
– Home Theatre Control Systems
– Others
• Wellness Monitoring
By Connectivity Technology:
• Cellular
– CDMA
– GSM/HSPA
– LTE
• Non-cellular
– Z-Wave
– ZigBee
– Wi-Fi
– Bluetooth
– Others
In order to offer an accurate snapshot of the current market, visiongain has also profiled the following leading companies:
• Control4 Corporation
• Johnson Controls International plc
• SmartThings Inc. (A subsidiary of Samsung Electronics Co., Ltd)
• Legrand
• Honeywell International, Inc.
• Siemens AG
• Schneider Electric SE
• Philips N.V.
• Silver Spring Networks
With 180 tables and charts and a total length of 167 pages, this report is a fantastic opportunity to increase your knowledge of this sector. Visiongain’s data-rich approach provides greater insight into this market, with year by year forecasts for a wide variety of submarkets.
Visiongain is a trading partner with the US Federal Government
CCR Ref number: KD4R6
1. Report Overview
1.1. Connected Home Market Definition and Research Scope
1.2. Why You Should Read This Report
1.3. How This Report Delivers
1.4. Key Questions Answered by This Analytical Report Include:
1.5. Who is This Report For?
1.6. Methodology
1.7. Frequently Asked Questions (FAQ)
1.8. Associated Visiongain Reports
1.9. About Visiongain
2. Introduction to the Connected Home Market
2.1. What Does Connected Home Signify?
2.2. The Connected Home Architecture
2.3. Value Chain Analysis
2.4. Market Dynamics
2.5. Difference between Automated Home and Connected Home
2.6. Customer Expectation from Connected Home
2.7. Recent Developments in the Europe and North American Connected Home Markets
3. Global Connected Home Market, 2017–2027
3.1. Global Connected Home Market Forecast 2017–2027
3.2. Global Connected Home Market Forecast 2017–2027
4. Global Connected Home Market, By Component
4.1. Global Connected Home Market Forecast, By Component 2017–2027
5. Global Connected Home Market, By Application
5.1. Global Connected Home Market Forecast, By Application 2017–2027
5.2. Global Connected Home Submarket Forecast, By Application Segments
5.2.1. Global Connected Home Market Forecast, By Safety & Security Application
5.2.1.1. Video Surveillance
5.2.1.2. Access Control
5.2.1.3. Smoke & Leak Detectors
5.2.1.4. Others
5.2.2. Global Connected Home Market Forecast, By Utility Management Application
5.2.2.1. HVAC
5.2.2.2. Lighting Control
5.2.2.3. Energy Tracking
5.2.2.4. Smart Meter
5.2.3. Global Connected Home Market Forecast, By Smart Appliance Application
5.2.3.1. Connected Washer/Dryer/Dishwasher
5.2.3.2. Connected Refrigerator
5.2.3.3. Connected Stove/Oven
5.2.4. Global Connected Home Market Forecast, By Smart Entertainment Application
5.2.4.1. Multimedia Control
5.2.4.2. Home Theatre Control Systems
5.2.4.3. Others
6. Global Connected Home Market, By Connectivity Technology
6.1. Global Connected Home Market Forecast, By Connectivity Technology 2017–2027
6.2. Global Connected Home Sub-market Forecast, By Connectivity Technology Segments
6.2.1. Global Connected Home Market Forecast, By Cellular Network Technology
6.2.1.1. CDMA
6.2.1.2. GSM/HSPA
6.2.1.3. LTE
6.2.2. Global Connected Home Market Forecast, By Non-cellular Network Technology
6.2.2.1. Z-Wave
6.2.2.2. ZigBee
6.2.2.3. Wi-Fi
6.2.2.4. Bluetooth
6.2.2.5. Others
7. Global Connected Home Market, by Geography 2017–2027
7.1. Americas Connected Home Market Forecast
7.1.1. Americas Connected Home Market Forecast, By Component
7.1.2. Americas Connected Home Market Forecast, By Application
7.1.3. Americas Connected Home Market Forecast, By Connectivity Technology
7.2. Europe Connected Home Market Forecast
7.2.1. Europe Connected Home Market Forecast, By Component
7.2.2. Europe Connected Home Market Forecast, By Application
7.2.3. Europe Connected Home Market Forecast, By Connectivity Technology
7.3. APAC Connected Home Market Forecast
7.3.1. APAC Connected Home Market Forecast, By Component
7.3.2. APAC Connected Home Market Forecast, By Application
7.3.3. APAC Connected Home Market Forecast, By Connectivity Technology
7.4. MEA Connected Home Market Forecast
7.4.1. MEA Connected Home Market Forecast, By Component
7.4.2. MEA Connected Home Market Forecast, By Application
7.4.3. MEA Connected Home Market Forecast, By Connectivity Technology
8. Competition Landscape
8.1. Control4 Corporation
8.1.1. Control4 Corporation Recent Developments (2016-2017)
8.1.2. Control4 Corporation Total Company Sales 2011-2016
8.1.3. Control4 Corporation Total Company Sales, By Geography 2013-2016
8.1.4. Control4 Corporation Primary Market Competitors 2017
8.2. Johnson Controls International plc
8.2.1. Johnson Controls International plc. Recent Developments (2016-2017)
8.2.2. Johnson Controls International plc. Total Company Sales 2012-2016
8.2.3. Johnson Controls International plc. Sales by Geography 2013-2016
8.2.4. Johnson Controls International plc. Primary Market Competitors 2017
8.3. SmartThings Inc. (A subsidiary of Samsung Electronics Co., Ltd)
8.3.1. SmartThings Inc. Recent Developments 2014-2017
8.3.2. SmartThings Inc. Primary Market Competitors 2017
8.4. Legrand
8.4.1. Legrand Recent Developments (2016-2017)
8.4.2. Legrand Total Company Sales 2012-2016
8.4.3. Legrand Sales by Geography 2013-2016
8.4.4. Legrand Primary Market Competitors 2017
8.5. Honeywell International, Inc.
8.5.1. Honeywell International Inc. Recent Developments 2016-2017
8.5.2. Honeywell International Inc. Total Company Sales 2011-2016
8.5.3. Honeywell International Inc. Sales by Geography 2013-2016
8.5.4. Honeywell International Inc. Primary Market Competitors 2017
8.6. Siemens AG
8.6.1. Siemens AG Recent Developments 2017
8.6.2. Siemens AG Total Company Sales 2011-2016
8.6.3. Siemens AG Sales by Geography 2013-2016
8.6.4. Siemens AG Primary Market Competitors 2017
8.7. Schneider Electric SE
8.7.1. Schneider Electric SE Recent Developments 2016-2017
8.7.2. Schneider Electric SE Total Company Sales 2011-2016
8.7.3. Schneider Electric SE Sales by Geography 2013-2016
8.7.4. Schneider Electric SE Primary Market Competitors 2017
8.8. Philips N.V.
8.8.1. Philips N.V. - Company Overview
8.8.2. Philips N.V. Recent Developments 2016-2017
8.8.3. Philips N.V. Total Company Sales 2014-2016
8.8.4. Philips N.V. Primary Market Competitors 2017
8.9. Silver Spring Networks
8.9.1. Silver Spring Networks Total Company Revenue 2012-2016
8.9.2. Silver Spring Networks Recent Developments 2016-2017
8.9.3. Silver Spring Networks Primary Market Competitors 2017
8.10. Other Companies Involved in the Connected Home Market 2017
9. Conclusions and Recommendations
9.1 Key Research finding
9.2 Conclusion by Geography
9.3 Conclusion by Component
9.4 Conclusion by Application
9.5 Strategic Recommendations
10. Glossary
Associated Visiongain Reports
Visiongain Report Sales Order Form
Appendix A
About Visiongain
Appendix B
Visiongain report evaluation form
List of Tables
Table 3.1: Global Connected Home Market Forecast 2017-2027 (US$ bn, AGR %, CAGR %)
Table 4.1: Global Connected Home Submarket Forecast by Component, 2017-2027 (US$ Bn, AGR %, CAGR %)
Table 5.1: Global Connected Home Submarket Forecast by Application, 2017-2027 (US$ Bn, AGR %, CAGR %)
Table 5.2: Global Connected Home Market Forecast 2017-2027 (US$ Bn, AGR %, CAGR %), By Safety & Security Application
Table 5.3: Global Connected Home Market Forecast 2017-2027 (US$ Bn, AGR %, CAGR %), By Utility Management Application
Table 5.4: Global Connected Home Market Forecast 2017-2027 (US$ Bn, AGR %, CAGR %), By Smart Appliance Application
Table 5.5: Global Connected Home Market Forecast 2017-2027 (US$ Bn, AGR %, CAGR %), By Smart Entertainment Application
Table 6.1: Global Connected Home Market Forecast by Connectivity Technology, 2017-2027 (US$ Bn, AGR %, CAGR %)
Table 6.2: Global Connected Home Market Forecast 2017-2027 (US$ Bn, AGR %, CAGR %), By Cellular Network Technology
Table 6.3: Global Connected Home Market Forecast 2017-2027 (US$ Bn, AGR %, CAGR %), By Non-cellular Network Technology
Table 7.1: Global Connected Home Market Forecast by Geography 2017-2027 (US$ Bn, AGR %, CAGR %)
Table 7.2: Americas Connected Home Market Forecast, By Component, 2017-2027 (US$ Bn, AGR %, CAGR %)
Table 7.3: Americas Connected Home Market Forecast, By Application, 2017-2027 (US$ Bn, AGR %, CAGR %)
Table 7.4: Americas Connected Home Market Forecast, By Connectivity Technology, 2017-2027 (US$ Bn, AGR %, CAGR %)
Table 7.5: Europe Connected Home Market Forecast, By Component, 2017-2027 (US$ Bn, AGR %, CAGR %)
Table 7.6: Europe Connected Home Market Forecast, By Application, 2017-2027 (US$ Bn, AGR %, CAGR %)
Table 7.7: Europe Connected Home Market Forecast, By Connectivity Technology, 2017-2027 (US$ Bn, AGR %, CAGR %)
Table 7.8: APAC Connected Home Market Forecast, By Component, 2017-2027 (US$ Bn, AGR %, CAGR %)
Table 7.9: APAC Connected Home Market Forecast, By Application, 2017-2027 (US$ Bn, AGR %, CAGR %)
Table 7.10: APAC Connected Home Market Forecast, By Connectivity Technology, 2017-2027 (US$ Bn, AGR %, CAGR %)
Table 7.11: MEA Connected Home Market Forecast, By Component, 2017-2027 (US$ Bn, AGR %, CAGR %)
Table 7.12: MEA Connected Home Market Forecast, By Application, 2017-2027 (US$ Bn, AGR %, CAGR %)
Table 7.13: MEA Connected Home Market Forecast, By Connectivity Technology, 2017-2027 (US$ Bn, AGR %, CAGR %)
Table 8.1 Control4 Corporation Profile 2016 (CEO, Total Company Sales US$m, Sales in the Market US$m, Net Income US$m, Net Capital Expenditure US$m, Strongest Business Region, HQ, Founded, No. of Employees, IR Contact, Ticker, Website)
Table 8.2 Control4 Corporation Recent Developments
Table 8.3 Control4 Corporation Total Company Sales 2011-2016 (US$m, AGR %)
Table 8.4 Johnson Controls International plc. 2016 (CEO, Total Company Sales US$m, Net Income US$m, Net Capital Expenditure US$m, Strongest Business Region, HQ, Founded, No. of Employees 2016, IR Contact, Ticker, Website)
Table 8.5 Johnson Controls International plc. Recent Developments
Table 8.6 Johnson Controls International plc. Total Company Sales 2012-2016 (US$ Bn, AGR %)
Table 8.7 SmartThings Inc. 2016 (CEO, Total Company Sales US$m, Sales in the Market US$m, Strongest Business Region, HQ, Founded, No. of Employees, IR Contact, Website)
Table 8.8 SmartThings Inc. Recent Developments
Table 8.9 Legrand 2016 (CEO, Total Company Sales US$m, Net Income US$m, Net Capital Expenditure US$m, Strongest Business Region, HQ, Founded, No. of Employees, IR Contact, Ticker, Website)
Table 8.10 Legrand Recent Developments
Table 8.11 Legrand Total Company Sales 2012-2016 (US$ Bn, AGR %)
Table 8.12 Honeywell International Inc. Profile 2016 (CEO, Total Company Sales US$m, Sales in the Market US$m, Net Income US$m, Net Capital Expenditure US$m, Strongest Business Region, HQ, Founded, No. of Employees, IR Contact, Ticker, Website)
Table 8.13 Honeywell International Inc. Recent Developments
Table 8.14 Honeywell International Inc. Total Company Sales 2011-2016 (US$m, AGR %)
Table 8.15 Siemens AG Profile 2016 (CEO, Total Company Sales US$m, Sales in the Market US$m, Net Income US$m, Net Capital Expenditure US$m, Strongest Business Region, HQ, Founded, No. of Employees, IR Contact, Ticker, Website)
Table 8.16 Siemens AG Recent Developments
Table 8.17 Siemens AG Total Company Sales 2011-2016 (US$m, AGR %)
Table 8.18 Schneider Electric SE Profile 2016 (CEO, Total Company Sales US$m, Sales in the Market US$m, Share of Company Sales from Conn home Market %, Net Income / Loss US$m, Net Capital Expenditure US$m, Strongest Business Region, HQ, Founded, No. of Employees, IR Contact, Ticker, Website)
Table 8.19 Schneider Electric SE Recent Developments
Table 8.20 Schneider Electric SE Total Company Sales 2011-2016 (US$m, AGR %)
Table 8.21: Philips N.V. Profile 2016 (Chairman, Total Company Sales US$m, Business Segment in the Market, Submarket Involvement, HQ, Founded, No. of Employees, Website)
Table 8.22 Philips N.V. Recent Developments
Table 8.23 Philips N.V. Total Company Sales 2014-2016 (US$m)
Table 8.24: Silver Spring Networks Profile 2016 (Chairman, Total Company Sales US$m, Business Segment in the Market, Submarket Involvement, HQ, Founded, No. of Employees, Website)
Table 8.25: Silver Spring Networks Market Products / Services (Product Segment, Products)
Table 8.26 Silver Spring Networks Total Company Revenue 2012-2016 (US$m)
Table 8.27 Silver Spring Networks Recent Developments
Table 8.28 Other Companies Involved in the Connected Home Market 2017 (Company, Submarket Involvement, Location)
List of Figures
Figure 3.1: Global Connected Home Market Forecast 2017-2027 (US$ bn, AGR %)
Figure 4.1: Global Connected Home Market AGR Forecast by Component 2017-2027 (AGR %)
Figure 4.2: Global Connected Home Submarket Forecast by Component 2017-2027 (Revenue US$Bn)
Figure 4.3: Global Connected Home Market Share Forecast by Component 2017 (% Share)
Figure 4.4: Global Connected Home Market Share Forecast by Component 2022 (% Share)
Figure 4.5: Global Connected Home Submarket Share Forecast by Component 2027 (% Share)
Figure 5.1: Global Connected Home Market AGR Forecast by Application 2017-2027 (AGR %)
Figure 5.2: Global Connected Home Submarket Forecast by Application 2017-2027 (Revenue US$Bn)
Figure 5.3: Global Connected Home Market Share Forecast by Application 2017 (% Share)
Figure 5.4: Global Connected Home Market Share Forecast by Application 2022 (% Share)
Figure 5.5: Global Connected Home Market Share Forecast by Application 2027 (% Share)
Figure 5.6 Global Connected Home Market Forecast by Safety & Security Application 2017-2027 (US$ bn)
Figure 5.7: Global Connected Home Market Share Forecast By Video Surveillance, 2017 (% Share)
Figure 5.8: Global Connected Home Market Share Forecast By Video Surveillance, 2027 (% Share)
Figure 5.9: Global Connected Home Market Share Forecast By Access Control, 2017 (% Share)
Figure 5.10: Global Connected Home Market Share Forecast By Access Control, 2027 (% Share)
Figure 5.11: Global Connected Home Market Share Forecast By Smoke & Leak Detectors, 2017 (% Share)
Figure 5.12: Global Connected Home Market Share Forecast By Smoke & Leak Detectors, 2027 (% Share)
Figure 5.13: Global Connected Home Market Share Forecast By Others, 2017 (% Share)
Figure 5.14: Global Connected Home Market Share Forecast By Others, 2027 (% Share)
Figure 5.15 Global Connected Home Market Forecast by Utility Management Application 2017-2027 (US$ bn)
Figure 5.16: Global Connected Home Market Share Forecast By HVAC, 2017 (% Share)
Figure 5.17: Global Connected Home Market Share Forecast By HVAC, 2027 (% Share)
Figure 5.18: Global Connected Home Market Share Forecast By Lighting Control, 2017 (% Share)
Figure 5.19: Global Connected Home Market Share Forecast By Lighting Control, 2027 (% Share)
Figure 5.20: Global Connected Home Market Share Forecast By Energy Tracking, 2017 (% Share)
Figure 5.21: Global Connected Home Market Share Forecast By Energy Tracking, 2027 (% Share)
Figure 5.22: Global Connected Home Market Share Forecast By Smart Meter, 2017 (% Share)
Figure 5.23: Global Connected Home Market Share Forecast By Smart Meter, 2027 (% Share)
Figure 5.24: Global Connected Home Market Forecast by Smart Appliance Application 2017-2027 (US$ bn)
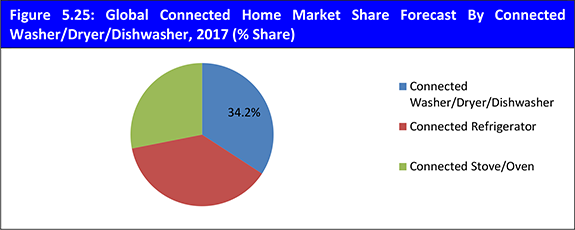
Figure 5.25: Global Connected Home Market Share Forecast By Connected Washer/Dryer/Dishwasher, 2017 (% Share)
Figure 5.26: Global Connected Home Market Share Forecast By Connected Washer/Dryer/Dishwasher, 2027 (% Share)
Figure 5.27: Global Connected Home Market Share Forecast By Connected Refrigerator, 2017 (% Share)
Figure 5.28: Global Connected Home Market Share Forecast By Connected Refrigerator, 2027 (% Share)
Figure 5.29 Global Connected Home Market Share Forecast By Connected Stove/Oven, 2017 (% Share)
Figure 5.30: Global Connected Home Market Share Forecast By Connected Stove/Oven, 2027 (% Share)
Figure 5.31: Global Connected Home Market Forecast by Smart Entertainment Application 2017-2027 (US$ bn)
Figure 5.32: Global Connected Home Market Share Forecast By Multimedia Control, 2017 (% Share)
Figure 5.33: Global Connected Home Market Share Forecast By Multimedia Control, 2027 (% Share)
Figure 5.34: Global Connected Home Market Share Forecast By Home Theatre Control System, 2017 (% Share)
Figure 5.35: Global Connected Home Market Share Forecast By Home Theatre Control System, 2027 (% Share)
Figure 5.36: Global Connected Home Market Share Forecast By Others, 2017 (% Share)
Figure 5.37: Global Connected Home Market Share Forecast By Others, 2027 (% Share)
Figure 6.1: Global Connected Home Submarket Forecast by Application 2017-2027 (Revenue US$bn)
Figure 6.2: Global Connected Home Market Share Forecast by Application 2017 (% Share)
Figure 6.3: Global Connected Home Market Share Forecast by Application 2022 (% Share)
Figure 6.4: Global Connected Home Submarket Share Forecast by Application 2027 (% Share)
Figure 6.5 Global Connected Home Market Forecast by Cellular Network Technology 2017-2027 (US$ bn)
Figure 6.6: Global Connected Home Market Share Forecast By CDMA, 2017 (% Share)
Figure 6.7: Global Connected Home Market Share Forecast By CDMA, 2027 (% Share)
Figure 6.8: Global Connected Home Market Share Forecast By GSM/HSPA, 2017 (% Share)
Figure 6.9: Global Connected Home Market Share Forecast By GSM/HSPA, 2027 (% Share)
Figure 6.10: Global Connected Home Market Share Forecast By LTE, 2017 (% Share)
Figure 6.11: Global Connected Home Market Share Forecast By LTE, 2027 (% Share)
Figure 6.12: Global Connected Home Market Forecast by Non-cellular Network Technology 2017-2027 (US$ bn)
Figure 6.13: Global Connected Home Market Share Forecast By Z-wave, 2017 (% Share)
Figure 6.14: Global Connected Home Market Share Forecast By Z-wave, 2027 (% Share)
Figure 6.15: Global Connected Home Market Share Forecast By ZigBee, 2017 (% Share)
Figure 6.16: Global Connected Home Market Share Forecast By ZigBee, 2027 (% Share)
Figure 6.17: Global Connected Home Market Share Forecast By Wi-Fi, 2017 (% Share)
Figure 6.18: Global Connected Home Market Share Forecast By Wi-Fi, 2027 (% Share)
Figure 6.19: Global Connected Home Market Share Forecast By Bluetooth, 2017 (% Share)
Figure 6.20: Global Connected Home Market Share Forecast By Bluetooth, 2027 (% Share)
Figure 6.21: Global Connected Home Market Share Forecast By Others, 2017 (% Share)
Figure 6.22: Global Connected Home Market Share Forecast By Others, 2027 (% Share)
Figure 7.1: Global Connected Home Market AGR Forecast by Geography 2017-2027 (AGR %)
Figure 7.2: Global Connected Home Market AGR Forecast by Geography 2017-2027 (AGR %)
Figure 7.3: Global Connected Home Market Share Forecast by Geography 2017 (% Share)
Figure 7.4: Global Connected Home Market Share Forecast by Geography 2027 (% Share)
Figure 7.5: Americas Connected Home Market Forecast, By Component, 2017-2027 (Revenue US$bn)
Figure 7.6: Americas Connected Home Market Forecast, By Component, 2017 (% Share)
Figure 7.7: Americas Connected Home Market Forecast, By Component, 2027 (% Share)
Figure 7.8: Americas Connected Home Market Forecast, By Application, 2017-2027 (Revenue US$bn)
Figure 7.9: Americas Connected Home Market Share, By Application, 2017 (% Share)
Figure 7.10: Americas Connected Home Market Share, By Application, 2027 (% Share)
Figure 7.11: Americas Connected Home Market Forecast, By Connectivity Technology, 2017-2027 (AGR %)
Figure 7.12: Americas Connected Home Market Share, By Connectivity Technology, 2017 (% Share)
Figure 7.13: Americas Connected Home Market Share, By Connectivity Technology, 2027 (% Share)
Figure 7.14: Europe Connected Home Market Forecast, By Component, 2017-2027 (Revenue US$bn)
Figure 7.15: Europe Connected Home Market Share, By Component, 2017 (% Share)
Figure 7.16: Europe Connected Home Market Share, By Component, 2027 (% Share)
Figure 7.17: Europe Connected Home Market Forecast, By Application, 2017-2027 (Revenue US$bn)
Figure 7.18: Europe Connected Home Market Share, By Application, 2017 (% Share)
Figure 7.19: Europe Connected Home Market Share, By Application, 2027 (% Share)
Figure 7.20: Europe Connected Home Market Forecast, By Connectivity Technology, 2017-2027 (Revenue US$bn)
Figure 7.21: Europe Connected Home Market Share, By Connectivity Technology, 2017 (% Share)
Figure 7.22: Europe Connected Home Market Share, By Connectivity Technology, 2027 (% Share)
Figure 7.23: APAC Connected Home Market Forecast, By Component, 2017-2027 (Revenue US$bn)
Figure 7.24: APAC Connected Home Market Share, By Component, 2017 (% Share)
Figure 7.25: APAC Connected Home Market Share, By Component, 2027 (% Share)
Figure 7.26: APAC Connected Home Market Forecast, By Application, 2017-2027 (Revenue US$bn)
Figure 7.27: APAC Connected Home Market Share, By Application, 2017 (% Share)
Figure 7.28: APAC Connected Home Market Share, By Application, 2027 (% Share)
Figure 7.29: APAC Connected Home Market Forecast, By Connectivity Technology, 2017-2027 (Revenue US$bn)
Figure 7.30: APAC Connected Home Market Share, By Connectivity Technology, 2017 (% Share)
Figure 7.31: APAC Connected Home Market Share, By Connectivity Technology, 2027 (% Share)
Figure 7.32: MEA Connected Home Market Forecast, By Component, 2017-2027 (Revenue US$bn)
Figure 7.33: MEA Connected Home Market Share, By Component, 2017 (% Share)
Figure 7.34: MEA Connected Home Market Share, By Component, 2027 (% Share)
Figure 7.35: MEA Connected Home Market Forecast, By Application, 2017-2027 (Revenue US$bn)
Figure 7.36: MEA Connected Home Market Share, By Application, 2017 (% Share)
Figure 7.37: MEA Connected Home Market Share, By Application, 2027 (% Share)
Figure 7.38: MEA Connected Home Market Forecast, By Connectivity Technology, 2017-2027 (Revenue US$bn)
Figure 7.39: MEA Connected Home Market Share, By Connectivity Technology, 2017 (% Share)
Figure 7.40: MEA Connected Home Market Share, By Connectivity Technology, 2027 (% Share)
Figure 8.1 Control4 Corporation Total Company Sales 2011-2016 (US$m)
Figure 8.2 Control4 Corporation Sales by Geography 2013-2016 (US$m)
Figure 8.3: Control4 Corporation Primary Market Competitors 2017
Figure 8.4 Johnson Controls International plc. Total Company Sales 2014-2016 (US$ Bn)
Figure 8.5 Johnson Controls International plc. Sales by Geography 2013-2016 (US$ Bn)
Figure 8.6: Johnson Controls International plc. Primary Market Competitors 2017
Figure 8.7: SmartThings Inc. Primary Market Competitors 2017
Figure 8.8 Legrand Total Company Sales 2012-2016 (US$ Bn)
Figure 8.9 Legrand Sales by Geography 2013-2016 (US$ Bn)
Figure 8.10: Legrand Primary Market Competitors 2017
Figure 8.11 Honeywell International Inc. Total Company Sales 2011-2016 (US$m)
Figure 8.12 Siemens AG Sales by Geography 2013-2016 (US$m)
Figure 8.13: Honeywell International Inc. Primary Market Competitors 2017
Figure 8.14 Siemens AG Total Company Sales 2011-2016 (US$m)
Figure 8.15 Siemens AG Sales by Geography 2013-2016 (US$m, Total Company Sales)
Figure 8.16 Siemens AG Primary Market Competitors 2017
Figure 8.17 Schneider Electric SE Total Company Sales 2011-2016 (US$m)
Figure 8.18 Schneider Electric SE Sales by Geography 2013-2016 (US$m, Total Company Sales)
Figure 8.19: Schneider Electric SE Primary Market Competitors 2017
Figure 8.20 Philips N.V. Total Company Sales 2014-2016 (US$m)
Figure 8.21: Philips N.V. Primary Market Competitors 2017
Figure 8.22: Silver Spring Networks Total Company Revenue 2012-2016
Figure 8.23: Silver Spring Networks Market Revenue By Region, 2014-2016
Figure 8.24: Silver Spring Networks Primary Market Competitors 2017
ABB Ltd
Accenture Plc.
Acuity Brands, Inc
Amazon
AMDOCS
Ameresco, Inc.
Amerlux
Arrayent, Inc.
AT&T
Atos Corporation
August Home
AXA
Broadlink
Canary Connect, Inc.
Control4 Corporation
Crestron Electronics, Inc
Dubai Electricity & Water Authority (DEWA)
Eaton Corporation Plc
eInfochips
Emerson
ENGIE
Essence
Glue AB
Golden Valley Electric Association (GVEA)
Google
HaCon
HomeSeer Smart Home Systems
Honeywell International, Inc.
Huawei Technologies
Ingersoll Rand PLC
IOTAS
Itron Inc.
Johnson Controls International plc
KPN
Kuvee
Latch
Legrand
Leviton Manufacturing Co., Inc.
Lowe's
Lutron Caséta
Mentor Graphics Inc.
Nest Labs Inc.
Netatmo
Notion
NRTC
Oklahoma Gas & Electric (OG&E)
Original Cast Lighting, Inc.
Orvibo
Panasonic Corporation
Petnet
Philips N.V.
Reply
Revolv
ROCKETHOME GmbH
Rockwell Automation, Inc.
Samsung Electronics Co., Ltd
Savant Systems LLC
Schneider Electric SE
Siemens AG
Siemens Building Technologies
Silver Spring Networks
Smartenit, Inc.
SmartThings Inc.
Solarfective
Sonos
Triad Speakers
Troy-CSL Lighting
Tyco
United Technologies Corporation
Vera Control, Ltd
VOLANSYS TECHNOLOGIES PVT. LTD.
Walmart
WINK LABS INC
Xiaomi
Download sample pages
Complete the form below to download your free sample pages for Connected Home Market Forecast 2017-2027
Related reports
-

Internet of Things (IoT) Market Report 2018-2028
The latest report from business intelligence provider Visiongain offers comprehensive analysis of the global Internet of Things market. Visiongain assesses...
Full DetailsPublished: 13 April 2018 -

Internet of Things (IoT) in Aerospace & Defence Market Forecast 2017-2027
Developments in IoT have had a significant impact on the aerospace and defence market. Visiongain’s report on this sector gives...
Full DetailsPublished: 13 June 2017 -

Connected Aircraft Market Report 2018-2028
Industry professionals: cut through media hype and exaggeration by reading an objective dispassionate Visiongain report on the connected aircraft market....
Full DetailsPublished: 22 May 2018 -

Machine-to-Machine (M2M) Market Report 2017-2027
Our 202-page report provides 160 tables, charts, and graphs. Read on to discover the most lucrative areas in the industry...
Full DetailsPublished: 31 October 2017 -

Top 20 Internet of Things (IoT) Companies 2018
The global Top 20 Internet of Things Companies report provides the reader with a thorough overview of the competitive landscape...
Full DetailsPublished: 19 July 2018 -

Connected Car Market Report 2017-2027
Visiongain’s definitive new report assesses that the connected car market will reach $29.9bn in 201 with considerable prospects for expansion...Full DetailsPublished: 04 July 2017 -

Top 20 Machine to Machine (M2M) Companies 2018
The latest report from business intelligence provider visiongain offers comprehensive analysis of the global M2M market leaders. Visiongain assesses that...
Full DetailsPublished: 26 March 2018 -

Industrial Control Systems (ICS) Market Report 2018-2028
The industry developments at the HANNOVER MESSE 2017 trade fair has led Visongain to publish this timely report. The $126.2...
Full DetailsPublished: 29 January 2018 -

Industrial Internet of Things (IIoT) Market Report 2018-2028
Visiongain has produced an in-Depth market research report studying the Industrial Internet of Things, analysing the rapid growth of this...
Full DetailsPublished: 01 May 2018
Download sample pages
Complete the form below to download your free sample pages for Connected Home Market Forecast 2017-2027
Do you have any custom requirements we can help you with?
Any specific country, geo region, market segment or specific company information?
Email us today, we can discuss your needs and see how we can help: jamie.roberts@visiongain.com
Would you like a free report overview of the report of your choice?
If so, please drop an email to Jamie Roberts stating your chosen report title to jamie.roberts@visiongain.com
Visiongain cyber reports are compiled using a broad and rich mixture of both primary and secondary information to produce an overall industry outlook. In order to provide our clients with the best product possible product, Visiongain analysts reach out to market-leading vendors and industry experts but also review a wealth of financial data and product information from a vast range of sources. To find out more about our reports methodology, please email jamie.roberts@visiongain.com
“A quick thanks for the IoT Security Report 2021 received yesterday. It’s well put together and just what I wanted. The whole buying process was quick, as was the delivery. I’ll definitely buy more from Visiongain. Good price too.”
Jack Schuster, Intertek
Latest Cyber news
Visiongain Publishes Green Data Centre Market Report 2024-2034
The global Green Data Centre market was valued at US$56.9 billion in 2023 and is projected to grow at a CAGR of 16.5% during the forecast period 2024-2034.
08 April 2024
Visiongain Publishes Military Cyber Security Market Report 2024-2034
The global Military Cyber Security market was valued at US$28.4 billion in 2023 and is projected to grow at a CAGR of 7.6% during the forecast period 2024-2034.
04 April 2024
Visiongain Publishes Cyber Security Market Report 2023-2033
The global Cyber Security market was valued at US$184.3 billion in 2022 and is projected to grow at a CAGR of 11% during the forecast period 2023-2033.
19 September 2023
Visiongain Publishes Threat Intelligence Market Report 2023-2033
The global Threat Intelligence market was valued at US$8.67 billion in 2022 and is projected to grow at a CAGR of 15.1% during the forecast period 2023-2033.
30 June 2023
