• Do you need Top 20 Internet of Things Companies market data?
• Succinct Top 20 Internet of Things Companies analysis?
• Technological insight?
• Clear competitor analysis?
• Actionable business recommendations?
Read on to discover how this definitive Internet of Things report can transform your own research and save you time.
The global Top 20 Internet of Things Companies report provides the reader with a thorough overview of the competitive landscape in the Internet of Things market and to identify key growth areas and business opportunities. The report is valuable for anyone who wants to understand the dynamics of the Internet of Things industry and the implementation and adoption of Internet of Things services. It will be useful for existing players, new entrants and businesses who wish to expand into this sector or explore a new area for market development.
Report highlights
• Over 100+ tables, charts, and graphs
• Market Share Analysis, Revenues And Ranking Of The Top 20 Companies Within The Internet Of Things Ecosystem
• Amazon
• Apple Inc.
• AT&T
• China Mobile
• Cisco
• Fitbit, Inc.
• GE
• Google
• HP
• IBM
• Intel Corporation
• Microsoft
• Oracle Corporation
• Philips N.V.
• Qualcomm
• Robert Bosch GmbH
• Samsung Electronics Co., Ltd.
• Schneider Electric SE
• Verizon Communications, Inc.
• Vodafone
To provide context for the leading companies within the Internet of Things ecosystem, the report also provides IoT market forecasts and connections data
• Global Internet of Things Market Forecast 2018 – 2028 ($bn)
• Global Internet of Things Connections Forecast 2018 – 2028 (Connections)
• Qualitative Analysis of Recent Developments in the IoT Market
• SWOT Analysis Of Factors Affecting The Market
• Key questions answered
• What does the future hold for the companies in the global Internet of Things market?
• Where should you target your business strategy?
• Which applications should you focus upon?
• Which disruptive technologies should you invest in?
• Which companies should you form strategic alliances with?
• Which company is likely to succeed and why?
• What business models should you adopt?
• What industry trends should you be aware of?
Target audience
• Internet of Things solution providers
• IT companies
• Networking specialists
• Electronics companies
• Telecoms companies
• Software developers
• Cyber security specialists
• IT Contractors
• Technologists
• Consultants
• Market analysts
• CEO’s
• CIO’s
• COO’s
• Business development managers
• Investors
• Governments
• Agencies
• ICT and Semiconductor Industry organisations
Visiongain is a trading partner with the US Federal Government
CCR Ref number: KD4R6
1. Report Overview
1.1. Internet of Things Market Set for Explosive Growth
1.2. Benefits Derived from Internet of Things
1.3. Internet of Things Growth Drivers
1.4. 5G, LTE and IoT Uptake
1.5. Aim of the Report
1.6. Structure of the Report
1.7. Report Scope
1.8. Highlights in the report include:
1.9. Who is This Report for?
1.10. Questions Answered by this Report
1.11. Benefits of This Report
1.12. Methodology
2. Introduction to the Internet of Things Market
2.1. What Defines the Internet of Things?
2.2. M2M Technology is the Backbone behind the Massive Potential in the Internet of Things Market
2.3. M2M History and Recent Developments
2.4. A Range of Benefits Derived from Internet of Things
2.5. IoT Applications by Industry
2.6. Cloud to Play Pivotal Role in the Internet of Things Industry Boom
2.7. Big-Data to Explode with the Rise in Internet of Things Market
2.8. Growth in the Wireless Sector
3. Global Internet of Things Market Forecasts
3.1. Market Definition
3.2. Global Internet of Things Market Forecast 2018-2028
3.3. Global Internet of Things Connections Forecast 2018-2028
4. Competitor Positioning in the Internet of Things Market
4.1. Leading 20 Company Revenues in the Internet of Things Market
5. Leading 20 Companies in the Internet of Things Market
5.1. Verizon Communications, Inc. Company Overview
5.1.1. Verizon Communications, Inc. Financials
5.1.2. Verizon Communications, Inc. IoT Key Developments
5.2. Vodafone Group Plc. Company Overview
5.2.1. Vodafone Group Plc. Financials
5.2.2. Vodafone Group Plc. IoT Key Developments
5.3. Oracle Corporation Company Overview
5.3.1. Oracle Corporation Financials
5.3.2. Oracle Corporation IoT Key Developments
5.4. China Mobile Ltd. Company Overview
5.4.1. China Mobile Ltd. Financials
5.4.2. China Mobile Ltd. IoT Key Developments
5.5. Fitbit, Inc. Company Overview
5.5.1. Fitbit, Inc. Financials
5.5.2. Fitbit, Inc. IoT Key Developments
5.6. Samsung Electronics Co., Ltd. Company Overview
5.6.1. Samsung Electronics Co., Ltd. Financials
5.6.2. Samsung Electronics Co., Ltd. IoT Key Developments
5.7. IBM Company Overview
5.7.1. IBM Financials
5.7.2. IBM IoT Key Developments
5.8. GE Company Overview
5.8.1. GE Financials
5.8.2. GE IoT Key Developments
5.9. AT&T Company Overview
5.9.1. AT&T Financials
5.9.2. AT&T Business Aims
5.9.3. AT&T Position in the Market
5.9.4. AT&T IoT Key Developments
5.10. Microsoft Company Overview
5.10.1. Retail
5.10.2. Healthcare
5.10.3. Automotive
5.10.4. Microsoft Financials
5.10.5. Microsoft IoT Key Developments
5.11. Google Company Overview
5.11.1. Google Financials
5.11.2. Google IoT Key Developments
5.12. Apple Inc. Company Overview
5.12.1. Apple Inc. Financials
5.12.2. Apple Inc. IoT Key Developments
5.13. Cisco Company Overview
5.13.1. Cisco Financials
5.13.2. Cisco IoT Key Developments
5.14. Intel Corporation Company Overview
5.14.1. Intel Corporation Financials
5.14.2. Intel Corporation IoT Key Developments
5.15. Qualcomm Company Overview
5.15.1. Qualcomm Financials
5.15.2. Qualcomm IoT Key Developments
5.16. Amazon Company Overview
5.16.1. Amazon Financials
5.16.2. Amazon IoT Key Developments
5.17. HP Company Overview
5.17.1. HP Financials
5.17.2. HP IoT Key Developments
5.18. Silver Springs Networks Company Overview
5.18.1.1. Silver Springs Networks Financials
5.18.2. Silver Springs Networks IoT Key Developments
5.19. Schneider Electric SE Company Overview
5.19.1. Schneider Electric SE Financials
5.19.2. Schneider Electric SE IoT Key Developments
5.20. Philips N.V. Company Overview
5.20.1. Philips N.V. Financials
5.20.2. Philips N.V. IoT Key Developments
6. Other Companies in the Internet of Things (IoT) Market 2018
7. SWOT Analysis of the Internet of Things Market
7.1. Strengths
7.1.1 Cost savings
7.1.2 Creating New Revenue Streams
7.1.3 Connected Devices Growing Rapidly
7.2. Weaknesses
7.2.1 IoT Solutions Can Be Expensive
7.2.2 Technical Problems
7.2.3 Limited 3G Infrastructure
7.2.4 Limited Awareness
7.3. Opportunities
7.3.1 IoT Gaining Popularity
7.3.2 Enhanced Market Segmentation
7.3.3 IoT can be Expanded to Any Vertical
7.4. Threats
7.4.1 Security Concerns
7.4.2 Highly Fragmented Market Place
7.4.3 Unclear Business Models
8. Internet of Things Technical Ecosystem Analysis
8.1. Network Concerns for M2M
8.2. Requirements to Solve M2M Deployment Issues
8.3. Data Security a Big Concern for Internet of Things Adoption
8.4. GPRS / SMS / CDMA / LTE
8.5. Two-Way Communication
8.6.Support for More than One Communication Type
8.7. Ensuring Minimum Downtime
8.8. Cost Effective
8.9. Utilising the Right Toolsets
8.10. Optimised Billing
8.11.Business Case for IoT
8.12. Smart Services for IoT
8.13. Smart Service Business Plan for OEMs
8.14. IoT in the Future
8.15. System Awareness
8.16. Business Case for System Awareness
8.17. M2M Platform Requirements and Opportunities
8.18. Internet of Things in the LTE Era
8.19. Switching from 3G to LTE
8.20. Impact of Switch from 3G to LTE on M2M
8.21. Internet Protocol Version 6 – IPv6
8.22. Potential Impact of IPv6 on IoT
8.23. Successful IoT Migration to IPv6
8.24. IPv6 to Benefit IoT
8.25. IoT Standards and Standards Bodies
9. Conclusions
9.1. Internet of Things Market Drivers
9.2. Network Coverage
9.3. Telematics and Telemetry Increasing Efficiency
9.4. Service Providers Need to Expand Offerings
9.5. Telematics Initiatives
9.6. IPv6 Will Increase IoT Opportunities
9.7. M2M Creating Scope for Development of New Applications
9.8. Internet of Things Market Restraints
9.9. Fragmented Value Chain
9.10. Lack of Universal Standards
9.11. Marketing Challenges
9.12. Roaming
9.13. Security Concerns
9.14. Opportunities with the Internet of Things
9.15. E-health
9.16. Smart Grid
9.17. Connected Appliances
9.18. Connected Home
9.19. Way Forward
9.19.1. Increase in M2M Partnerships
9.19.2. Standardisation
9.19.3. Measuring Data
9.19.4. New Business Models
10. Glossary
List of Tables
Table 2.1 IoT Applications by Industry
Table 3.1 Global Internet of Things Market Forecast 2017-2028 ($ billion, AGR %, CAGR%, Cumulative)
Table 3.2 Global Internet of Things Connections Forecast 2017-2028 (billion, AGR %, CAGR%, Cumulative)
Table 4.1 Leading 20 Internet of Things Companies 2018 (Market Ranking, Total Revenue, IoT Revenue, Market Share %)
Table 5.1 Verizon Communications, Inc. Company Overview 2017 (Total Revenue, Revenue from Internet of Things, % Revenue from Internet of Things, Global Market Share %, HQ, Contact, Website)
Table 5.2: Verizon Communications, Inc. IoT Market Key Developments
Table 5.3 Vodafone Group Plc. Company Overview 2017 (Total Revenue, Revenue from Internet of Things, % Revenue from Internet of Things, Global Market Share %, HQ, Ticker, Website)
Table 5.4 Key Features and Benefits of Vodafone’s M2M Solution
Table 5.5: Vodafone Group Plc. IoT Market Key Developments
Table 5.6 Oracle Corporation Company Overview 2017 (Total Revenue, Revenue from Internet of Things, % Revenue from Internet of Things, Global Market Share %, HQ, Website)
Table 5.7: Oracle Corporation IoT Market Key Developments
Table 5.8 China Mobile Ltd. Company Overview 2017 (Total Revenue, Revenue from Internet of Things, % Revenue from Internet of Things, Global Market Share %, HQ, Ticker, Website)
Table 5.9: China Mobile Ltd. IoT Market Key Developments 2016-2018
Table 5.10 Fitbit, Inc. Company Overview 2017 (Total Revenue, Revenue from Internet of Things, % Revenue from Internet of Things, Global Market Share %, HQ, Ticker, Contact, Website)
Table 5.11: Fitbit, Inc. IoT Market Key Developments
Table 5.12 Samsung Electronics Co., Ltd. Company Overview 2017 (Total Revenue, Revenue from Internet of Things, % Revenue from Internet of Things, Global Market Share %, HQ, Ticker, Contact, Website)
Table 5.13: Samsung Electronics Co., Ltd. IoT Market Key Developments 2017-2018
Table 5.14 IBM Company Overview 2017 (Total Revenue, Revenue from Internet of Things, % Revenue from Internet of Things, Global Market Share %, HQ, Contact, Website)
Table 5.15 IBM Adept Performance Management Solution Focus Areas
Table 5.16: IBM IoT Market Key Developments
Table 5.17 GE Company Overview 2017 (Total Revenue, Revenue from Internet of Things, % Revenue from Internet of Things, Global Market Share %, HQ, Contact, Website)
Table 5.18: GE IoT Market Key Developments
Table 5.19 AT&T Company Overview 2017 (Total Revenue, Revenue from Internet of Things, % Revenue from Internet of Things, Global Market Share %, HQ, Contact, Website)
Table 5.20 AT&T M2M Solution, Assets, and Advantages
Table 5.21: AT&T IoT Market Key Developments
Table 5.22 Microsoft Company Overview 2017 (Total Revenue, Revenue from Internet of Things, % Revenue from Internet of Things, Global Market Share %, HQ, Ticker, Contact, Website)
Table 5.23 Windows Embedded Product Portfolio
Table 5.24: Microsoft IoT Market Key Developments
Table 5.25 Google Company Overview 2017 (Total Revenue, Revenue from Internet of Things, % Revenue from Internet of Things, Global Market Share %, HQ, Ticker, Contact, Website)
Table 5.26: Google IoT Market Key Developments
Table 5.27 Apple Inc. Company Overview 2017 (Total Revenue, Revenue from Internet of Things, % Revenue from Internet of Things, Global Market Share %, HQ, Ticker, Contact, Website)
Table 5.28: Apple Inc. IoT Market Key Developments
Table 5.29 Cisco Company Overview 2017 (Total Revenue, Revenue from Internet of Things, % Revenue from Internet of Things, Global Market Share %, HQ, Ticker, Contact, Website)
Table 5.30: Cisco IoT Market Key Developments
Table 5.31 Intel Corporation Company Overview 2017 (Total Revenue, Revenue from Internet of Things, % Revenue from Internet of Things, Global Market Share %, HQ, Ticker, Contact, Website)
Table 5.32: Intel Corporation IoT Market Key Developments
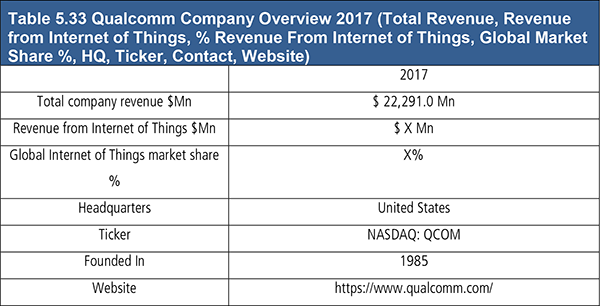
Table 5.33 Qualcomm Company Overview 2017 (Total Revenue, Revenue from Internet of Things, % Revenue from Internet of Things, Global Market Share %, HQ, Ticker, Contact, Website)
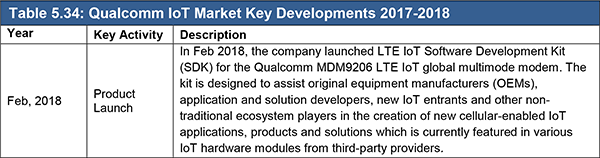
Table 5.34: Qualcomm IoT Market Key Developments
Table 5.35 Amazon Company Overview 2017 (Total Revenue, Revenue from Internet of Things, % Revenue from Internet of Things, Global Market Share %, HQ, Ticker, Contact, Website)
Table 5.36: Amazon IoT Market Key Developments
Table 5.37 HP Company Overview 2017 (Total Revenue, Revenue from Internet of Things, % Revenue from Internet of Things, Global Market Share %, HQ, Ticker, Contact, Website)
Table 5.38: HP IoT Market Key Developments
Table 5.39 Robert Bosch GmbH Company Overview 2017 (Total Revenue, Revenue from Internet of Things, % Revenue from Internet of Things, Global Market Share %, HQ, Ticker, Contact, Website)
Table 5.40: Robert Bosch GmbH Market Products / Services (Product Segment, Products)
Table 5.41: Robert Bosch GmbH IoT Market Key Developments
Table 5.42 Schneider Electric SE Company Overview 2017 (Total Revenue, Revenue from Internet of Things, % Revenue from Internet of Things, Global Market Share %, HQ, Ticker, Contact, Website)
Table 5.43: Schneider Electric SE IoT Market Key Developments
Table 5.44 Philips N.V. Company Overview 2017 (Total Revenue, Revenue from Internet of Things, % Revenue from Internet of Things, Global Market Share %, HQ, Ticker, Contact, Website)
Table 5.45: Philips N.V. IoT Market Key Developments
Table 6.1 Other Companies In The Internet of Things Market 2018
Table 7.1 SWOT Analysis of the Internet of Things Market 2018
Table 8.1 IoT Standards Bodies
Table 8.2 IoT Industry and Sector Opportunities
List of Figures
Figure 3.1 Global Internet of Things Market Definition Flowchart
Figure 3.2 Global Internet of Things Market Forecast 2018-2028($ billion, AGR %)
Figure 3.3 Global Internet of Things Connections Forecast 2018-2028(billion, AGR %)
Figure 4.1 Leading Internet of Things Companies Market Share 2017 (%)
Figure 5.1 Verizon Communications, Inc. Financial Analysis 2015 - 2017
Figure 5.2 Verizon Communications, Inc. Financial Analysis 2015 - 2017 by Region and by Business Segment 2017
Figure 5.3 Vodafone Group Plc. Financial Analysis 2015 - 2017
Figure 5.4 Vodafone Group Plc. Financial Analysis 2015 - 2017 by Region and by Business Segment 2017
Figure 5.5 Oracle Corporation Financial Analysis 2015 - 2017
Figure 5.6 Oracle Corporation Financial Analysis 2015 - 2017 by Region and by Business Segment 2017
Figure 5.7 China Mobile Ltd. Financial Analysis 2015 - 2017
Figure 5.8 China Mobile Ltd. Financial Analysis 2015 - 2017 by Region and by Business Segment 2017
Figure 5.9 Fitbit, Inc. Financial Analysis 2015 - 2017
Figure 5.10 Fitbit, Inc. Financial Analysis 2015 - 2017 by Region and by Business Segment 2017
Figure 5.11 Samsung Electronics Co., Ltd. Financial Analysis 2015 - 2017
Figure 5.12 Samsung Electronics Co., Ltd. Financial Analysis 2015 - 2017 By Region and By Business Segment 2017
Figure 5.13 IBM MessageSight System
Figure 5.14 IBM Financial Analysis 2015 - 2017
Figure 5.15 IBM Financial Analysis 2015 - 2017 by Region and by Business Segment 2017
Figure 5.16 GE Financial Analysis 2015 - 2017
Figure 5.17 GE Financial Analysis 2015 - 2017 by Region and by Business Segment 2017
Figure 5.18 AT&T Financial Analysis 2015 - 2017
Figure 5.19 AT&T Financial Analysis 2015 - 2017 by Region and by Business Segment 2017
Figure 5.20 Microsoft Azure Intel Corporationligent Systems
Figure 5.21 Microsoft Financial Analysis 2015 - 2017
Figure 5.22 Microsoft Financial Analysis 2015 - 2017 by Region and by Business Segment 2017
Figure 5.23 Google Financial Analysis 2015 - 2017
Figure 5.24 Google Financial Analysis 2015 - 2017 by Region
Figure 5.25 Apple Inc. Financial Analysis 2015 - 2017
Figure 5.26 Apple Inc. Financial Analysis 2015 - 2017 by Region and by Business Segment 2017
Figure 5.27 Cisco Financial Analysis 2015 - 2017
Figure 5.28 Cisco Financial Analysis 2015 - 2017 by Region and by Business Segment 2017
Figure 5.29 Intel Corporation Financial Analysis 2015 - 2017
Figure 5.30 Intel Corporation Financial Analysis 2015 - 2017 by Region and by Business Segment 2017
Figure 5.31 Qualcomm Financial Analysis 2015 - 2017
Figure 5.32 Qualcomm Financial Analysis 2015 - 2017 by Region and by Business Segment 2017
Figure 5.33 Amazon Financial Analysis 2015 - 2017
Figure 5.34 Amazon Financial Analysis 2015 - 2017 by Region and by Business Segment 2017
Figure 5.35 HP Financial Analysis 2015 - 2017
Figure 5.36 HP Financial Analysis 2015 - 2017 by Region and by Business Segment 2017
Figure 5.37: Robert Bosch GmbH Total Company Revenue 2012-2016
Figure 5.38 Robert Bosch GmbH Financial Analysis 2015 - 2017 by Region and by Business Segment 2017
Figure 5.39 Schneider Electric SE Financial Analysis 2015 - 2017
Figure 5.40 Schneider Electric SE Financial Analysis 2015 - 2017 by Region and by Business Segment 2017
Figure 5.41 Philips N.V. Financial Analysis 2015 - 2017
Figure 5.42 Philips N.V. Financial Analysis 2015 - 2017 by Region and by Business Segment 2017
Figure 8.1 OEM Revenues from Services vs. Other Revenues 2018 (%)
Figure 8.2 OEM Margin Contributions from Services vs. Other Revenues 2014 (%)
Figure 8.3 Smart Service Business Plan for OEMs
Figure 8.4 M2M Benefits