Industries > Energy > Oil & Gas Subsea Umbilicals, Risers & Flowlines (SURF) Market Report 2022-2032
 Market Report 2022-2032")
Oil & Gas Subsea Umbilicals, Risers & Flowlines (SURF) Market Report 2022-2032
Forecasts by Risers (Steel Catenary Risers (SCR), Flexible Catenary Risers (FCR), Other), by Product (Umbilicals, Risers, Flowlines, Cables, Other), by Services (Flexible Flowline/Riser Installation & Recovery, Power Cable Installation & Recovery, Umbilical Installation & Recovery, Subsea Structure Installation, Jumper and Tie-in Spool Installation, Other), by Water Depth (Shallow, Deep, Ultra-deep, Other) AND Regional and Leading National Market Analysis PLUS Analysis of Leading Companies AND COVID-19 Recovery Scenarios
The Oil & Gas Subsea Umbilicals, Risers & Flowlines (SURF) Market Report 2022-2032: This report will prove invaluable to leading firms striving for new revenue pockets if they wish to better understand the industry and its underlying dynamics. It will be useful for companies that would like to expand into different industries or to expand their existing operations in a new region.
Umbilical Demand Is Expected To Skyrocket Over The Next Few Years
The COVID-19 epidemic and its impact on global energy investments are likely to hurt subsea purchases, with demand for umbilicals expected to drop by 32% to 713 km (443 mi) in 2020, down from 1,041 km (647 mi) last year. Despite material cost savings, the consultant predicts that umbilical demand will not match or exceed 2019 levels until beyond 2023. To put these figures in context, before the pandemic, demand for umbilicals was expected to fall somewhat this year compared to 2019, but then rebound and surpass last year’s levels starting in 2021. Without taking into consideration the negative impact of a worldwide economic crisis, the consultant forecasts a 5% cost reduction in the umbilicals category from 2020 to 2022.
What Are These Questions You Should Ask Before Buying A Market Research Report?
• How is the oil & gas subsea umbilicals, risers & flowlines (SURF) market evolving?
• What is driving and restraining the oil & gas subsea umbilicals, risers & flowlines (SURF) market?
• How will each oil & gas subsea umbilicals, risers & flowlines (SURF) submarket segment grow over the forecast period and how much revenue will these submarkets account for in 2032?
• How will the market shares for each oil & gas subsea umbilicals, risers & flowlines (SURF) submarket develop from 2022 to 2032?
• What will be the main driver for the overall market from 2022 to 2032?
• Will leading oil & gas subsea umbilicals, risers & flowlines (SURF) markets broadly follow the macroeconomic dynamics, or will individual national markets outperform others?
• How will the market shares of the national markets change by 2032 and which geographical region will lead the market in 2032?
• Who are the leading players and what are their prospects over the forecast period?
• What are the oil & gas subsea umbilicals, risers & flowlines (SURF) projects for these leading companies?
• How will the industry evolve during the period between 2020 and 2032?What are the implication of oil & gas subsea umbilicals, risers & flowlines (SURF) projects taking place now and over the next 10 years?
• Is there a greater need for product commercialisation to further scale the oil & gas subsea umbilicals, risers & flowlines (SURF) market?
• Where is the oil & gas subsea umbilicals, risers & flowlines (SURF) market heading? And how can you ensure you are at the forefront of the market?
• What can be the best investment options for new product and service lines?
• What are the key prospects for moving companies into a new growth path? C-suite?
You need to discover how this will impact the oil & gas subsea umbilicals, risers & flowlines (SURF) market today, and over the next 10 years:
• Our 558-page report provides 425 tables and 420 charts/graphs exclusively to you.
• The report highlights key lucrative areas in the industry so you can target them – NOW.
• Contains in-depth analyse of global, regional and national sales and growth
• Highlights for you the key successful trends, changes and revenue projections made by your competitors
This report tells you TODAY how the oil & gas subsea umbilicals, risers & flowlines (SURF) market will develop in the next 10 years, and in-line with the variations in COVID-19 economic recession and bounce. This market is more critical now than at any point over the last 10 years.
Delivers exclusive COVID-19 variations economic data specific to your market.
To access the data contained in this document please email contactus@visiongain.com
Forecasts to 2032 and other analyses reveal the commercial prospects
• In addition to revenue forecasting to 2032, our new study provides you with recent results, growth rates, and market shares.
• You find original analyses, with business outlooks and developments.
• Discover qualitative analyses (including market dynamics, drivers, opportunities, restraints and challenges), cost structure, impact of rising oil & gas subsea umbilicals, risers & flowlines (SURF) prices and recent developments.
This report includes data analysis and invaluable insight into how COVID-19 will affect the industry and your company. Four COVID-19 recovery patterns and their impact, namely, V, L, W and U are discussed in this report.
Global Oil & Gas Subsea Umbilicals, Risers & Flowlines (SURF) Market (COVID Impact Analysis) by Risers
• Steel Catenary Risers (SCR)
• Flexible Catenary Risers (FCR)
• Other Risers
Global Oil & Gas Subsea Umbilicals, Risers & Flowlines (SURF) Market (COVID Impact Analysis) by Product
• Umbilicals
• Risers
• Flowlines
• Cables
• Other products
Global Oil & Gas Subsea Umbilicals, Risers & Flowlines (SURF) Market (COVID Impact Analysis) by Services
• Flexible Flowline/Riser Installation & Recovery
• Power Cable Installation & Recovery
• Umbilical Installation & Recovery
• Subsea Structure Installation
• Jumper And Tie-In Spool Installation
• Other Services
Global Oil & Gas Subsea Umbilicals, Risers & Flowlines (SURF) Market (COVID Impact Analysis) by Water Depth
• Shallow Water
• Deep Water
• Ultradeep Water
• Other Water Depth

In addition to the revenue predictions for the overall world market and segments, you will also find revenue forecasts for 4 regional and 20 leading national markets:
• Americas Oil & Gas Subsea Umbilicals, Risers & Flowlines (SURF) Market, 2022 to 2032 Market Outlook
• Alaska Oil & Gas Subsea Umbilicals, Risers & Flowlines (SURF) Market, 2022 to 2032 Market Forecast & COVID Impact Analysis
• Canada Oil & Gas Subsea Umbilicals, Risers & Flowlines (SURF) Market, 2022 to 2032 Market Forecast & COVID Impact Analysis
• Trinidad and Tobago Oil & Gas Subsea Umbilicals, Risers & Flowlines (SURF) Market, 2022 to 2032 Market Forecast & COVID Impact Analysis
• Brazil Oil & Gas Subsea Umbilicals, Risers & Flowlines (SURF) Market, 2022 to 2032 Market Forecast & COVID Impact Analysis
• Rest of Americas Oil & Gas Subsea Umbilicals, Risers & Flowlines (SURF) Market, 2022 to 2032 Market Forecast & COVID Impact Analysis
• Eurasia Middle East Oil & Gas Subsea Umbilicals, Risers & Flowlines (SURF) Market, 2022 to 2032 Market Outlook
• Black Sea Oil & Gas Subsea Umbilicals, Risers & Flowlines (SURF) Market, 2022 to 2032 Market Forecast & COVID Impact Analysis
• Caspian Sea Oil & Gas Subsea Umbilicals, Risers & Flowlines (SURF) Market, 2022 to 2032 Market Forecast & COVID Impact Analysis
• Persian Gulf Oil & Gas Subsea Umbilicals, Risers & Flowlines (SURF) Market, 2022 to 2032 Market Forecast & COVID Impact Analysis
• Russian Arctic Oil & Gas Subsea Umbilicals, Risers & Flowlines (SURF) Market, 2022 to 2032 Market Forecast & COVID Impact Analysis
• Rest of Eurasia Middle East Oil & Gas Subsea Umbilicals, Risers & Flowlines (SURF) Market, 2022 to 2032 Market Forecast & COVID Impact Analysis
• Asia Pacific Oil & Gas Subsea Umbilicals, Risers & Flowlines (SURF) Market, 2022 to 2032 Market Outlook
• Australia Oil & Gas Subsea Umbilicals, Risers & Flowlines (SURF) Market, 2022 to 2032 Market Forecast & COVID Impact Analysis
• Brunei Oil & Gas Subsea Umbilicals, Risers & Flowlines (SURF) Market, 2022 to 2032 Market Forecast & COVID Impact Analysis
• China Oil & Gas Subsea Umbilicals, Risers & Flowlines (SURF) Market, 2022 to 2032 Market Forecast & COVID Impact Analysis
• India Oil & Gas Subsea Umbilicals, Risers & Flowlines (SURF) Market, 2022 to 2032 Market Forecast & COVID Impact Analysis
• Indonesia Oil & Gas Subsea Umbilicals, Risers & Flowlines (SURF) Market, 2022 to 2032 Market Forecast & COVID Impact Analysis
• Rest of Asia Pacific Oil & Gas Subsea Umbilicals, Risers & Flowlines (SURF) Market, 2022 to 2032 Market Forecast & COVID Impact Analysis
• Europe Oil & Gas Subsea Umbilicals, Risers & Flowlines (SURF) Market, 2022 to 2032 Market Outlook
• Denmark Oil & Gas Subsea Umbilicals, Risers & Flowlines (SURF) Market, 2022 to 2032 Market Forecast & COVID Impact Analysis
• Ireland Oil & Gas Subsea Umbilicals, Risers & Flowlines (SURF) Market, 2022 to 2032 Market Forecast & COVID Impact Analysis
• Mediterranean Sea Oil & Gas Subsea Umbilicals, Risers & Flowlines (SURF) Market, 2022 to 2032 Market Forecast & COVID Impact Analysis
• Netherlands Oil & Gas Subsea Umbilicals, Risers & Flowlines (SURF) Market, 2022 to 2032 Market Forecast & COVID Impact Analysis
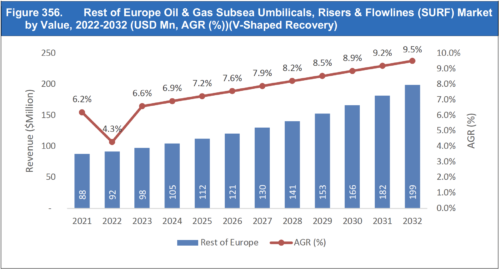
• Rest of Europe Oil & Gas Subsea Umbilicals, Risers & Flowlines (SURF) Market, 2022 to 2032 Market Forecast & COVID Impact Analysis
Need industry data? Please contact us today.
The report also includes profiles and for some of the leading companies in the Oil & Gas Subsea Umbilicals, Risers & Flowlines (SURF) Market, 2022 to 2032, with a focus on this segment of these companies’ operations.
Leading companies and the potential for market growth
• Abb Group
• Airborne Oil & Gas B.V
• Aker Solutions
• Baker Hughes
• Cameron International Corporation
• Dril-Quip, Inc
• General Electric Company
• Kongsberg Gruppen Asa
• McDermott International, Inc.
• National Oilwell Varco, Inc.
• Nexans SA
• Oceaneering International, Inc.
• Orient Cable
• Parker Hannifin
• Prysmian S.p.A.
• Saipem SpA
• Siemens AG
• Subsea 7
• TechnipFMC Plc
• Vallourec
Overall world revenue for Oil & Gas Subsea Umbilicals, Risers & Flowlines (SURF) Market, 2022 to 2032 in terms of value the market will surpass US$xx million in 2022, our work calculates. We predict strong revenue growth through to 2032. Our work identifies which organizations hold the greatest potential. Discover their capabilities, progress, and commercial prospects, helping you stay ahead.
How the Oil & Gas Subsea Umbilicals, Risers & Flowlines (SURF) Market, 2022 to 2032 Market report helps you?
In summary, our 560+ page report provides you with the following knowledge:
• Revenue forecasts to 2032 for Oil & Gas Subsea Umbilicals, Risers & Flowlines (SURF) Market, 2022 to 2032 Market, with forecasts for risers, products, services, water depth each forecasted at a global and regional level– discover the industry’s prospects, finding the most lucrative places for investments and revenues
• Revenue forecasts to 2032 for 4 regional and 20 key national markets – See forecasts for the Oil & Gas Subsea Umbilicals, Risers & Flowlines (SURF) Market, 2022 to 2032 market in North America, Europe, Asia-Pacific and LAMEA. Also forecasted is the market in the Alaska, Canada, Denmark, Brazil, Ireland, Mediterranean Sea, China, India, and Australia among other prominent economies.
• Prospects for established firms and those seeking to enter the market– including company profiles for 20 of the major companies involved in the Oil & Gas Subsea Umbilicals, Risers & Flowlines (SURF) Market, 2022 to 2032 Market.
Find quantitative and qualitative analyses with independent predictions. Receive information that only our report contains, staying informed with this invaluable business intelligence.
Information found nowhere else
With our newly report title, you are less likely to fall behind in knowledge or miss out on opportunities. See how our work could benefit your research, analyses, and decisions. Visiongain’s study is for everybody needing commercial analyses for the Oil & Gas Subsea Umbilicals, Risers & Flowlines (SURF) Market, 2022 to 2032 Market and leading companies. You will find data, trends and predictions.
To access the data contained in this document please email contactus@visiongain.com
Buy our report today Oil & Gas Subsea Umbilicals, Risers & Flowlines (SURF) Market Report 2022-2032: Forecasts by Risers (Steel Catenary Risers (SCR), Flexible Catenary Risers (FCR), Other), by Product (Umbilicals, Risers, Flowlines, Cables, Other), by Services (Flexible Flowline/Riser Installation & Recovery, Power Cable Installation & Recovery, Umbilical Installation & Recovery, Subsea Structure Installation, Jumper and Tie-in Spool Installation, Other), by Water Depth (Shallow, Deep, Ultra-deep, Other) AND Regional and Leading National Market Analysis PLUS Analysis of Leading Companies AND COVID-19 Recovery Scenarios. Avoid missing out by staying informed – order our report now.
Visiongain is a trading partner with the US Federal Government
CCR Ref number: KD4R6
Do you have any custom requirements we can help you with? Any need for a specific country, geo region, market segment or specific company information? Contact us today, we can discuss your needs and see how we can help: sara.peerun@visiongain.com
1.1 Introduction to Oil & Gas Subsea Umbilicals, Risers & Flowlines (SURF) Market
1.1.1 Subsea Umblicals
1.1.2 Risers
1.1.3 Flowlines
1.2 Global Oil & Gas Subsea Umbilicals, Risers & Flowlines (SURF) Market Overview
1.3 What are the Objectives of this Report?
1.4 What is the Scope of the Report?
1.5 Why You Should Read This Report
1.6 What This Report Delivers
1.7 Key Questions Answered By This Analytical Report Include:
1.8 Who is This Report for?
1.9 Research Methodology
1.9.1 Primary Research
1.9.2 Secondary Research
1.9.3 Market Evaluation & Forecasting Methodology
1.10 Frequently Asked Questions (FAQs)
1.11 Associated Visiongain Reports
1.12 About Visiongain
2 Executive Summary
3 Global Market Dynamics
3.1 COVID- 19 Impact On Global Market
3.2 Current Trends in the Global Market
3.3 Market Driving Factors
3.3.1 Umbilical Demand Is Expected To Skyrocket Over The Next Few Years.
3.3.2 Rapid Advancement In Subsea Production Systems
3.3.3 Increasing Oil And Gas Exploration Investment In Developing Countries
3.3.4 The Market Will Be Fueled By New Oil Field Discoveries.
3.3.4.1 Gulf Of Mexico
3.3.4.2 Mexico
3.3.4.3 Norway
3.3.4.4 Guyana
3.3.4.5 Malaysia
3.3.4.6 Indonesia
3.4 Market Restraining Factors
3.4.1 Condition The Crude Oil Sector Is Recognised As One Of The Largest Sources Of VOC Emission Into The Environment
3.4.2 Focus On Renewable Energy Generation
3.4.3 High Cost Associated With Offshore Drilling
3.5 Opportunities in the Global Market
3.5.1 Developments In The World Of Risers
3.5.1.1 Riser Condition Assessment
3.5.1.2 Thermoplastic Composite Pipe
3.5.1.3 Riser Damping Model
3.5.1.4 Management Of Life Cycle
3.5.1.5 High-Motion Vessels
3.5.2 Shifting Public Opinion Towards Oil & Gas Infrastructures
3.5.3 An Industry On The Seach For New Growth Areas
3.6 Challenges in the Global Market
3.6.1 Challenges For Oilfield Services And Equipment Suppliers
3.6.1.1 Increasing National Content Requirements
3.6.1.2 Commoditization Of Technology
3.6.1.3 Increasingly Complicated Supply Chains
3.6.1.4 Skill Shortages
3.6.1.5 Capacity Restrictions And Rising Material Costs
3.6.2 Investments In Oil & Gas Pipeline Increasingly Being Challenged
3.7 SWOT Analysis:
3.8 PEST Analysis
3.9 Porter’s Five Forces
3.9.1 Competitive Rivalry
3.9.2 Bargaining Power of Buyers
3.9.3 Bargaining Power of Suppliers
3.9.4 Threat of Substitutes
3.9.5 The Threat Of New Entrants
4 Global Oil & Gas Subsea Umbilicals, Risers & Flowlines (SURF) Market Analysis
4.1 Global Market Outlook
4.1.1 Exploration And Production Of Oil And Gas Reserves In Various Sea Depths Is Currently A Challenge For The Offshore Industry
4.2 Global Market Size Estimation and Forecast
4.2.1 Pre-COVID-19 Market Scenario
4.2.2 Post-COVID-19 Market Scenarios (V, W, U, L-Shaped Recovery Analysis)
5 Global Oil & Gas Subsea Umbilicals, Risers & Flowlines (SURF) Market Analysis By Region
5.1 Africa
5.2 Asia-Pacific
5.3 Eurasia/Middle East
5.4 Americas
5.5 Europe
5.6 Regional Market Size Estimation and Forecast
5.6.1 Pre-COVID-19 Market Scenario
5.6.2 Post-COVID-19 Market Scenarios (V, W, U, L-Shaped Recovery Analysis)
6 Global Oil & Gas Subsea Umbilicals, Risers & Flowlines (SURF) Market Analysis by By Risers
6.1 Steel Catenary Risers (SCR)
6.2 Flexible Catenary Risers (FCR)
6.3 Global Market Size Estimation and Forecast By Risers
6.3.1 Pre-COVID-19 Market Scenario
6.3.2 Post-COVID-19 Market Scenarios (V, W, U, L-Shaped Recovery Analysis)
7 Global Oil & Gas Subsea Umbilicals, Risers & Flowlines (SURF) Market Analysis By Product
7.1 Umbilicals
7.2 Risers
7.3 Flowlines
7.4 Cables
7.5 Global Market Size Estimation and Forecast By Product
7.5.1 Pre-COVID-19 Market Scenario
7.5.2 Post-COVID-19 Market Scenarios (V, W, U, L-Shaped Recovery Analysis)
8 Global Oil & Gas Subsea Umbilicals, Risers & Flowlines (SURF) Market Analysis By Services
8.1 Flexible Flowline/Riser Installation & Recovery
8.2 Power Cable Installation & Recovery
8.3 Umbilical Installation & Recovery
8.4 Subsea Structure Installation
8.5 Jumper And Tie-In Spool Installation
8.6 Global Market Size Estimation and Forecast By Services
8.6.1 Pre-COVID-19 Market Scenario
8.6.2 Post-COVID-19 Market Scenarios (V, W, U, L-Shaped Recovery Analysis)
9 Global Oil & Gas Subsea Umbilicals, Risers & Flowlines (SURF) Market Analysis By Water Depth
9.1 Shallow Water
9.2 Deep Water
9.3 Ultradeep Water
9.4 Global Market Size Estimation and Forecast By Water Depth
9.4.1 Pre-COVID-19 Market Scenario
9.4.2 Post-COVID-19 Market Scenarios (V, W, U, L-Shaped Recovery Analysis)
10 Africa Oil & Gas Subsea Umbilicals, Risers & Flowlines (SURF) Market Analysis
10.1 Crude Oil Exploration Is A Key Source Of Money In Africa.
10.2 MDL Wins West Africa SURF Project
10.3 Africa Market Size Estimation and Forecast
10.3.1 Pre-COVID-19 Market Scenario
10.3.2 Post-COVID-19 Market Scenarios (V, W, U, L-Shaped Recovery Analysis)
10.4 Country Market Size Estimation and Forecast
10.4.1 Pre-COVID-19 Market Scenario
10.4.2 Post-COVID-19 Market Scenarios (V, W, U, L-Shaped Recovery Analysis)
10.5 Africa Market Size Estimation and Forecast By Risers
10.5.1 Pre-COVID-19 Market Scenario
10.5.2 Post-COVID-19 Market Scenarios (V, W, U, L-Shaped Recovery Analysis)
10.6 Africa Market Size Estimation and Forecast By Product
10.6.1 Pre-COVID-19 Market Scenario
10.6.2 Post-COVID-19 Market Scenarios (V, W, U, L-Shaped Recovery Analysis)
10.7 Africa Market Size Estimation and Forecast By Services
10.7.1 Pre-COVID-19 Market Scenario
10.7.2 Post-COVID-19 Market Scenarios (V, W, U, L-Shaped Recovery Analysis)
10.8 Africa Market Size Estimation and Forecast By Water Depth
10.8.1 Pre-COVID-19 Market Scenario
10.8.2 Post-COVID-19 Market Scenarios (V, W, U, L-Shaped Recovery Analysis)
10.9 Angola Oil & Gas Subsea Umbilicals, Risers & Flowlines (SURF) Market Analysis
10.9.1 MDL SURF Spread At Work Offshore Angola
10.9.2 Kaombo Offshore Field Development
10.9.3 Pre-COVID-19 Market Scenario
10.9.4 Post-COVID-19 Market Scenarios (V, W, U, L-Shaped Recovery Analysis)
10.10 Cameroon Oil & Gas Subsea Umbilicals, Risers & Flowlines (SURF) Market Analysis
10.10.1 Despite The Impact Of Covid-19, Foreign Direct Investment In Major Oil And Gas Projects Continues In Cameroon.
10.10.2 Pre-COVID-19 Market Scenario
10.10.3 Post-COVID-19 Market Scenarios (V, W, U, L-Shaped Recovery Analysis)
10.11 Congo-Brazzaville Oil & Gas Subsea Umbilicals, Risers & Flowlines (SURF) Market Analysis
10.11.1 Congo-Brazzaville Oil Find Presents New Challenges
10.11.2 Pre-COVID-19 Market Scenario
10.11.3 Post-COVID-19 Market Scenarios (V, W, U, L-Shaped Recovery Analysis)
10.12 Egypt Oil & Gas Subsea Umbilicals, Risers & Flowlines (SURF) Market Analysis
10.12.1 Egypt To Invest $1.4bn Into New Offshore Exploration Projects
10.12.2 Pre-COVID-19 Market Scenario
10.12.3 Post-COVID-19 Market Scenarios (V, W, U, L-Shaped Recovery Analysis)
10.13 Equatorial Guinea Oil & Gas Subsea Umbilicals, Risers & Flowlines (SURF) Market Analysis
10.13.1 Equatorial Guinea: Revitalizing The Oil And Gas Sector
10.13.2 Pre-COVID-19 Market Scenario
10.13.3 Post-COVID-19 Market Scenarios (V, W, U, L-Shaped Recovery Analysis)
10.14 Gabon Oil & Gas Subsea Umbilicals, Risers & Flowlines (SURF) Market Analysis
10.14.1 BW Energy's Gabon Offshore Oil Find Smaller Than Expected
10.14.2 Pre-COVID-19 Market Scenario
10.14.3 Post-COVID-19 Market Scenarios (V, W, U, L-Shaped Recovery Analysis)
10.15 Ghana Oil & Gas Subsea Umbilicals, Risers & Flowlines (SURF) Market Analysis
10.15.1 GE Oil & Gas Announces $850M Order With Eni And Partners For Offshore Cape Three Points Block, Ghana
10.15.2 Pre-COVID-19 Market Scenario
10.15.3 Post-COVID-19 Market Scenarios (V, W, U, L-Shaped Recovery Analysis)
10.16 Mozambique Oil & Gas Subsea Umbilicals, Risers & Flowlines (SURF) Market Analysis
10.16.1 Technipfmc, Van Oord Land Mozambique Project Work
10.16.2 Pre-COVID-19 Market Scenario
10.16.3 Post-COVID-19 Market Scenarios (V, W, U, L-Shaped Recovery Analysis)
10.17 Namibia Oil & Gas Subsea Umbilicals, Risers & Flowlines (SURF) Market Analysis
10.17.1 Namibia Sees 11 Billion Barrels In Offshore Oil Reserves
10.17.2 Qatar Petroleum To Farm Into Namibia Blocks
10.17.3 Pre-COVID-19 Market Scenario
10.17.4 Post-COVID-19 Market Scenarios (V, W, U, L-Shaped Recovery Analysis)
10.18 Nigeria Oil & Gas Subsea Umbilicals, Risers & Flowlines (SURF) Market Analysis
10.18.1 Nigeria To Lead Oil & Gas Surf Market With New Developing Fields
10.18.2 Pre-COVID-19 Market Scenario
10.18.3 Post-COVID-19 Market Scenarios (V, W, U, L-Shaped Recovery Analysis)
10.19 South Africa Oil & Gas Subsea Umbilicals, Risers & Flowlines (SURF) Market Analysis
10.19.1 Eni To Terminate Oil Exploration Plan In South Africa Amid Tech Challenges
10.19.2 Pre-COVID-19 Market Scenario
10.19.3 Post-COVID-19 Market Scenarios (V, W, U, L-Shaped Recovery Analysis)
10.20 Tanzania Oil & Gas Subsea Umbilicals, Risers & Flowlines (SURF) Market Analysis
10.20.1 Tanzania Races To Develop Natural Gas Reserves
10.20.2 Pre-COVID-19 Market Scenario
10.20.3 Post-COVID-19 Market Scenarios (V, W, U, L-Shaped Recovery Analysis)
10.21 Rest of Africa Oil & Gas Subsea Umbilicals, Risers & Flowlines (SURF) Market Analysis
10.21.1 Pre-COVID-19 Market Scenario
10.21.2 Post-COVID-19 Market Scenarios (V, W, U, L-Shaped Recovery Analysis)
11 Asia-Pacific Oil & Gas Subsea Umbilicals, Risers & Flowlines (SURF) Market Analysis
11.1 Asia-Pacific Is Home To Various Fast Developing Large Economies
11.2 Asia Pacific At The Centre Of Mcdermott’s ‘Engine Room’
11.3 Asia-Pacific Market Size Estimation and Forecast
11.3.1 Pre-COVID-19 Market Scenario
11.3.2 Post-COVID-19 Market Scenarios (V, W, U, L-Shaped Recovery Analysis)
11.4 Country Market Size Estimation and Forecast
11.4.1 Pre-COVID-19 Market Scenario
11.4.2 Post-COVID-19 Market Scenarios (V, W, U, L-Shaped Recovery Analysis)
11.5 Asia-Pacific Market Size Estimation and Forecast By Risers
11.5.1 Pre-COVID-19 Market Scenario
11.5.2 Post-COVID-19 Market Scenarios (V, W, U, L-Shaped Recovery Analysis)
11.6 Asia-Pacific Market Size Estimation and Forecast By Product
11.6.1 Pre-COVID-19 Market Scenario
11.6.2 Post-COVID-19 Market Scenarios (V, W, U, L-Shaped Recovery Analysis)
11.7 Asia-Pacific Market Size Estimation and Forecast By Services
11.7.1 Pre-COVID-19 Market Scenario
11.7.2 Post-COVID-19 Market Scenarios (V, W, U, L-Shaped Recovery Analysis)
11.8 Asia-Pacific Market Size Estimation and Forecast By Water Depth
11.8.1 Pre-COVID-19 Market Scenario
11.8.2 Post-COVID-19 Market Scenarios (V, W, U, L-Shaped Recovery Analysis)
11.9 Australia Oil & Gas Subsea Umbilicals, Risers & Flowlines (SURF) Market Analysis
11.9.1 Subsea 7 Secures Major Contract For Barossa Project In Australia
11.9.2 Sydney Residents Protest Proposed Offshore Oil Drilling On NSW Coast
11.9.3 Pre-COVID-19 Market Scenario
11.9.4 Post-COVID-19 Market Scenarios (V, W, U, L-Shaped Recovery Analysis)
11.10 Brunei Oil & Gas Subsea Umbilicals, Risers & Flowlines (SURF) Market Analysis
11.10.1 Subsea 7 Provides Offshore Construction Update
11.10.2 Pre-COVID-19 Market Scenario
11.10.3 Post-COVID-19 Market Scenarios (V, W, U, L-Shaped Recovery Analysis)
11.11 China Oil & Gas Subsea Umbilicals, Risers & Flowlines (SURF) Market Analysis
11.11.1 MDL Wraps Up SURF Lay Project Offshore China
11.11.2 Pre-COVID-19 Market Scenario
11.11.3 Post-COVID-19 Market Scenarios (V, W, U, L-Shaped Recovery Analysis)
11.12 India Oil & Gas Subsea Umbilicals, Risers & Flowlines (SURF) Market Analysis
11.12.1 ONGC Draws Early First Gas From KG-DWN-98/2 Project In India
11.12.2 Pre-COVID-19 Market Scenario
11.12.3 Post-COVID-19 Market Scenarios (V, W, U, L-Shaped Recovery Analysis)
11.13 Indonesia Oil & Gas Subsea Umbilicals, Risers & Flowlines (SURF) Market Analysis
11.13.1 SOV Completes SURF Project At Indonesian Gas Field
11.13.2 Pre-COVID-19 Market Scenario
11.13.3 Post-COVID-19 Market Scenarios (V, W, U, L-Shaped Recovery Analysis)
11.14 Rest of Asia-Pacific Oil & Gas Subsea Umbilicals, Risers & Flowlines (SURF) Market Analysis
11.14.1 Pre-COVID-19 Market Scenario
11.14.2 Post-COVID-19 Market Scenarios (V, W, U, L-Shaped Recovery Analysis)
12 Eurasia/Middle East Oil & Gas Subsea Umbilicals, Risers & Flowlines (SURF) Market Analysis
12.1 Offshore Oil And Gas Capex Expected To Reach $63.1 Billion
12.2 Eurasia/Middle East Market Size Estimation and Forecast
12.2.1 Pre-COVID-19 Market Scenario
12.2.2 Post-COVID-19 Market Scenarios (V, W, U, L-Shaped Recovery Analysis)
12.3 Country Market Size Estimation and Forecast
12.3.1 Pre-COVID-19 Market Scenario
12.3.2 Post-COVID-19 Market Scenarios (V, W, U, L-Shaped Recovery Analysis)
12.4 Eurasia/Middle East Market Size Estimation and Forecast By Risers
12.4.1 Pre-COVID-19 Market Scenario
12.4.2 Post-COVID-19 Market Scenarios (V, W, U, L-Shaped Recovery Analysis)
12.5 Eurasia/Middle East Market Size Estimation and Forecast By Product
12.5.1 Pre-COVID-19 Market Scenario
12.5.2 Post-COVID-19 Market Scenarios (V, W, U, L-Shaped Recovery Analysis)
12.6 Eurasia/Middle East Market Size Estimation and Forecast By Services
12.6.1 Pre-COVID-19 Market Scenario
12.6.2 Post-COVID-19 Market Scenarios (V, W, U, L-Shaped Recovery Analysis)
12.7 Eurasia/Middle East Market Size Estimation and Forecast By Water Depth
12.7.1 Pre-COVID-19 Market Scenario
12.7.2 Post-COVID-19 Market Scenarios (V, W, U, L-Shaped Recovery Analysis)
12.8 Black Sea Oil & Gas Subsea Umbilicals, Risers & Flowlines (SURF) Market Analysis
12.8.1 Sakarya Gas Field Development, Black Sea, Turkey
12.8.2 Pre-COVID-19 Market Scenario
12.8.3 Post-COVID-19 Market Scenarios (V, W, U, L-Shaped Recovery Analysis)
12.9 Caspian Sea Oil & Gas Subsea Umbilicals, Risers & Flowlines (SURF) Market Analysis
12.9.1 Caspian Consortium To Manage Absheron Subsea Engineering
12.9.2 Pre-COVID-19 Market Scenario
12.9.3 Post-COVID-19 Market Scenarios (V, W, U, L-Shaped Recovery Analysis)
12.10 Persian Gulf Oil & Gas Subsea Umbilicals, Risers & Flowlines (SURF) Market Analysis
12.10.1 Reshadat Oil Field Redevelopment, Persian Gulf
12.10.2 Pre-COVID-19 Market Scenario
12.10.3 Post-COVID-19 Market Scenarios (V, W, U, L-Shaped Recovery Analysis)
12.11 Russian Arctic Oil & Gas Subsea Umbilicals, Risers & Flowlines (SURF) Market Analysis
12.11.1 Russian Arctic Oil Races Against Time
12.11.2 Pre-COVID-19 Market Scenario
12.11.3 Post-COVID-19 Market Scenarios (V, W, U, L-Shaped Recovery Analysis)
12.12 Rest of Eurasia/Middle East Oil & Gas Subsea Umbilicals, Risers & Flowlines (SURF) Market Analysis
12.12.1 Pre-COVID-19 Market Scenario
12.12.2 Post-COVID-19 Market Scenarios (V, W, U, L-Shaped Recovery Analysis)
13 Americas Oil & Gas Subsea Umbilicals, Risers & Flowlines (SURF) Market Analysis
13.1 Upcoming Deepwater Exploration And Production Projects In Brazil, Argentina, And Other Nations Is To Drive The Market
13.2 Americas Market Size Estimation and Forecast
13.2.1 Pre-COVID-19 Market Scenario
13.2.2 Post-COVID-19 Market Scenarios (V, W, U, L-Shaped Recovery Analysis)
13.3 Country Market Size Estimation and Forecast
13.3.1 Pre-COVID-19 Market Scenario
13.3.2 Post-COVID-19 Market Scenarios (V, W, U, L-Shaped Recovery Analysis)
13.4 Americas Market Size Estimation and Forecast By Risers
13.4.1 Pre-COVID-19 Market Scenario
13.4.2 Post-COVID-19 Market Scenarios (V, W, U, L-Shaped Recovery Analysis)
13.5 Americas Market Size Estimation and Forecast By Product
13.5.1 Pre-COVID-19 Market Scenario
13.5.2 Post-COVID-19 Market Scenarios (V, W, U, L-Shaped Recovery Analysis)
13.6 Americas Market Size Estimation and Forecast By Services
13.6.1 Pre-COVID-19 Market Scenario
13.6.2 Post-COVID-19 Market Scenarios (V, W, U, L-Shaped Recovery Analysis)
13.7 Americas Market Size Estimation and Forecast By Water Depth
13.7.1 Pre-COVID-19 Market Scenario
13.7.2 Post-COVID-19 Market Scenarios (V, W, U, L-Shaped Recovery Analysis)
13.8 Alaska Oil & Gas Subsea Umbilicals, Risers & Flowlines (SURF) Market Analysis
13.8.1 Alaska Oil And Gas Exploration, Development And Permitting Project
13.8.2 Pre-COVID-19 Market Scenario
13.8.3 Post-COVID-19 Market Scenarios (V, W, U, L-Shaped Recovery Analysis)
13.9 Canada Oil & Gas Subsea Umbilicals, Risers & Flowlines (SURF) Market Analysis
13.9.1 E&P Activity Gains Momentum Offshore Eastern Canada
13.9.2 Pre-COVID-19 Market Scenario
13.9.3 Post-COVID-19 Market Scenarios (V, W, U, L-Shaped Recovery Analysis)
13.10 Trinidad and Tobago Oil & Gas Subsea Umbilicals, Risers & Flowlines (SURF) Market Analysis
13.10.1 Mcdermott Wins Ruby SURF Contract Offshore Trinidad And Tobago
13.10.2 Pre-COVID-19 Market Scenario
13.10.3 Post-COVID-19 Market Scenarios (V, W, U, L-Shaped Recovery Analysis)
13.11 Brazil Oil & Gas Subsea Umbilicals, Risers & Flowlines (SURF) Market Analysis
13.11.1 Saipem Scoops $940 Million Buzios SURF Prize From Petrobras
13.11.2 Pre-COVID-19 Market Scenario
13.11.3 Post-COVID-19 Market Scenarios (V, W, U, L-Shaped Recovery Analysis)
13.12 Rest of Americas Oil & Gas Subsea Umbilicals, Risers & Flowlines (SURF) Market Analysis
13.12.1 Pre-COVID-19 Market Scenario
13.12.2 Post-COVID-19 Market Scenarios (V, W, U, L-Shaped Recovery Analysis)
14 Europe Oil & Gas Subsea Umbilicals, Risers & Flowlines (SURF) Market Analysis
14.1 Demand Of Oil & Gas In Europe Will Drive The Market
14.2 Offshore Exploration In Greece: Deepwater Exploration And Drilling
14.3 Europe Market Size Estimation and Forecast
14.3.1 Pre-COVID-19 Market Scenario
14.3.2 Post-COVID-19 Market Scenarios (V, W, U, L-Shaped Recovery Analysis)
14.4 Country Market Size Estimation and Forecast
14.4.1 Pre-COVID-19 Market Scenario
14.4.2 Post-COVID-19 Market Scenarios (V, W, U, L-Shaped Recovery Analysis)
14.5 Europe Market Size Estimation and Forecast By Risers
14.5.1 Pre-COVID-19 Market Scenario
14.5.2 Post-COVID-19 Market Scenarios (V, W, U, L-Shaped Recovery Analysis)
14.6 Europe Market Size Estimation and Forecast By Product
14.6.1 Pre-COVID-19 Market Scenario
14.6.2 Post-COVID-19 Market Scenarios (V, W, U, L-Shaped Recovery Analysis)
14.7 Europe Market Size Estimation and Forecast By Services
14.7.1 Pre-COVID-19 Market Scenario
14.7.2 Post-COVID-19 Market Scenarios (V, W, U, L-Shaped Recovery Analysis)
14.8 Europe Market Size Estimation and Forecast By Water Depth
14.8.1 Pre-COVID-19 Market Scenario
14.8.2 Post-COVID-19 Market Scenarios (V, W, U, L-Shaped Recovery Analysis)
14.9 Denmark Oil & Gas Subsea Umbilicals, Risers & Flowlines (SURF) Market Analysis
14.9.1 Denmark Set To End All New Oil And Gas Exploration
14.9.2 Pre-COVID-19 Market Scenario
14.9.3 Post-COVID-19 Market Scenarios (V, W, U, L-Shaped Recovery Analysis)
14.10 Ireland Oil & Gas Subsea Umbilicals, Risers & Flowlines (SURF) Market Analysis
14.10.1 Ireland Lays Down “Symbolic” New Oil, Gas Extraction Ban
14.10.2 Pre-COVID-19 Market Scenario
14.10.3 Post-COVID-19 Market Scenarios (V, W, U, L-Shaped Recovery Analysis)
14.11 Mediterranean Sea Oil & Gas Subsea Umbilicals, Risers & Flowlines (SURF) Market Analysis
14.11.1 Energean Says Karish Gas Project On Track To Begin Production In Mid-2022
14.11.2 Pre-COVID-19 Market Scenario
14.11.3 Post-COVID-19 Market Scenarios (V, W, U, L-Shaped Recovery Analysis)
14.12 Netherlands Oil & Gas Subsea Umbilicals, Risers & Flowlines (SURF) Market Analysis
14.12.1 Gas Company NAM Aims To Sell Small Dutch Gas And Oil Fields
14.12.2 Pre-COVID-19 Market Scenario
14.12.3 Post-COVID-19 Market Scenarios (V, W, U, L-Shaped Recovery Analysis)
14.13 Rest of Europe Oil & Gas Subsea Umbilicals, Risers & Flowlines (SURF) Market Analysis
14.13.1 Pre-COVID-19 Market Scenario
14.13.2 Post-COVID-19 Market Scenarios (V, W, U, L-Shaped Recovery Analysis)
15 Leading Company Profiles
15.1 TechnipFMC Plc
15.1.1 Company Snapshot
15.1.2 Company Overview
15.1.3 Company Financial Profile
15.1.4 Company Product Benchmarking
15.1.5 Company Recent Developments
15.2 Saipem SpA
15.2.1 Company Snapshot
15.2.2 Company Overview
15.2.3 Company Financial Profile
15.2.4 Company Product Benchmarking
15.2.5 Company Recent Developments
15.3 Subsea 7
15.3.1 Company Snapshot
15.3.2 Company Overview
15.3.3 Company Financial Profile
15.3.4 Company Product Benchmarking
15.3.5 Company Recent Developments
15.4 Aker Solutions
15.4.1 Company Snapshot
15.4.2 Company Overview
15.4.3 Company Financial Profile
15.4.4 Company Product Benchmarking
15.4.5 Company Recent Developments
15.5 Siemens AG
15.5.1 Company Snapshot
15.5.2 Company Overview
15.5.3 Company Financial Profile
15.5.4 Company Product Benchmarking
15.5.5 Company Recent Developments
15.6 Kongsberg Gruppen Asa
15.6.1 Company Snapshot
15.6.2 Company Overview
15.6.3 Company Financial Profile
15.6.4 Company Product Benchmarking
15.6.5 Company Recent Developments
15.7 Abb Group
15.7.1 Company Snapshot
15.7.2 Company Overview
15.7.3 Company Financial Profile
15.7.4 Company Recent Developments
15.8 General Electric Company
15.8.1 Company Snapshot
15.8.2 Company Overview
15.8.3 Company Financial Profile
15.8.4 Company Recent Developments
15.9 Parker Hannifin
15.9.1 Company Snapshot
15.9.2 Company Overview
15.9.3 Company Financial Profile
15.9.4 Company Product Benchmarking
15.9.5 Company Recent Developments
15.10 Oceaneering International, Inc.
15.10.1 Company Snapshot
15.10.2 Company Overview
15.10.3 Company Financial Profile
15.10.4 Company Product Benchmarking
15.10.5 Company Recent Developments
15.11 Nexans SA
15.11.1 Company Snapshot
15.11.2 Company Overview
15.11.3 Company Financial Profile
15.11.4 Company Product Benchmarking
15.11.5 Company Recent Developments
15.12 Prysmian S.p.A.
15.12.1 Company Snapshot
15.12.2 Company Overview
15.12.3 Company Financial Profile
15.12.4 Company Product Benchmarking
15.12.5 Company Recent Developments
15.13 National Oilwell Varco, Inc.
15.13.1 Company Snapshot
15.13.2 Company Overview
15.13.3 Company Financial Profile
15.13.4 Company Product Benchmarking
15.13.5 Company Recent Developments
15.14 Vallourec
15.14.1 Company Snapshot
15.14.2 Company Overview
15.14.3 Company Financial Profile
15.14.4 Company Product Benchmarking
15.15 Dril-Quip, Inc
15.15.1 Company Snapshot
15.15.2 Company Overview
15.15.3 Company Financial Profile
15.15.4 Company Product Benchmarking
15.16 Baker Hughes
15.16.1 Company Snapshot
15.16.2 Company Overview
15.16.3 Company Product Benchmarking
15.16.4 Company Recent Developments
15.17 McDermott International, Inc.
15.17.1 Company Snapshot
15.17.2 Company Overview
15.17.3 Company Product Benchmarking
15.17.4 Company Recent Developments
15.18 Cameron International Corporation
15.18.1 Company Snapshot
15.18.2 Company Overview
15.18.3 Company Product Benchmarking
15.18.4 Company Recent Developments
15.19 Airborne Oil & Gas B.V
15.19.1 Company Snapshot
15.19.2 Company Overview
15.19.3 Company Product Benchmarking
15.19.4 Company Recent Developments
15.20 Orient Cable
15.20.1 Company Snapshot
15.20.2 Company Overview
15.20.3 Company Product Benchmarking
16 Conclusion
16.1 One Of The Most Important Aspects Of Prospective Advances In The Oil And Gas Sector Is SURF Engineering
16.2 SURF Advancements Are Critical To Lowering Extraction Costs And Keeping Oil Competitive With Alternate Energy Sources
16.3 Major Paradigm Shifts In Technological Advancement Necessitate The Implementation Of Industrial Policy.
17 Recommendations
17.1 Africa to Dominate the Market
17.2 Vertical Integration: One-Stop Shop
17.3 New Revenue Models: Sharing Financial Risks For Future Rewards
17.4 Consolidation: Increasing Concentration
17.5 New Equipment And Service Models: Design To Value
18 Glossary Terms
List of Tables
Table 1. Global Oil & Gas Subsea Umbilicals, Risers & Flowlines (SURF) Market Forecast, 2022-2032 (USD Mn, AGR (%), CAGR(%))
Table 2. Global Oil & Gas Subsea Umbilicals, Risers & Flowlines (SURF) Market Snapshot, 2022 & 2032 (US$million, CAGR %)
Table 3. Global Oil & Gas Subsea Umbilicals, Risers & Flowlines (SURF) Market SWOT Analysis 2022-2032
Table 4. Global Deepwater & Ultra Deepwater Exploration & Production (E&P) Market PEST Analysis 2021-2031
Table 5. Global Oil & Gas Subsea Umbilicals, Risers & Flowlines (SURF) Market Forecast, 2022-2032 (USD Mn, AGR (%), CAGR(%))
Table 6. Global Oil & Gas Subsea Umbilicals, Risers & Flowlines (SURF) Market Forecast, 2022-2032 (USD Mn, AGR (%), CAGR(%))(V-Shape Recovery)
Table 7. Global Oil & Gas Subsea Umbilicals, Risers & Flowlines (SURF) Market Forecast, 2022-2032 (USD Mn, AGR (%), CAGR(%))(W-Shape Recovery)
Table 8. Global Oil & Gas Subsea Umbilicals, Risers & Flowlines (SURF) Market Forecast, 2022-2032 (USD Mn, AGR (%), CAGR(%))(U-Shape Recovery)
Table 9. Global Oil & Gas Subsea Umbilicals, Risers & Flowlines (SURF) Market Forecast, 2022-2032 (USD Mn, AGR (%), CAGR(%))(L-Shape Recovery)
Table 10. Global Oil & Gas Subsea Umbilicals, Risers & Flowlines (SURF) Market by Region, 2022-2032 (USD Mn, AGR (%), CAGR(%))
Table 11. Global Oil & Gas Subsea Umbilicals, Risers & Flowlines (SURF) Market by Region, 2022-2032 (USD Mn, AGR (%), CAGR(%))(V-Shape Recovery)
Table 12. Global Oil & Gas Subsea Umbilicals, Risers & Flowlines (SURF) Market by Region, 2022-2032 (USD Mn, AGR (%), CAGR(%))(W-Shape Recovery)
Table 13. Global Oil & Gas Subsea Umbilicals, Risers & Flowlines (SURF) Market by Region, 2022-2032 (USD Mn, AGR (%), CAGR(%))(U-Shape Recovery)
Table 14. Global Oil & Gas Subsea Umbilicals, Risers & Flowlines (SURF) Market by Region, 2022-2032 (USD Mn, AGR (%), CAGR(%))(L-Shape Recovery)
Table 15. Global Oil & Gas Subsea Umbilicals, Risers & Flowlines (SURF) Market by Risers, 2022-2032 (USD Mn, AGR (%), CAGR(%))
Table 16. Global Oil & Gas Subsea Umbilicals, Risers & Flowlines (SURF) Market by Risers, 2022-2032 (USD Mn, AGR (%), CAGR(%))(V-Shape Recovery)
Table 17. Global Oil & Gas Subsea Umbilicals, Risers & Flowlines (SURF) Market by Risers, 2022-2032 (USD Mn, AGR (%), CAGR(%))(W-Shape Recovery)
Table 18. Global Oil & Gas Subsea Umbilicals, Risers & Flowlines (SURF) Market by Risers, 2022-2032 (USD Mn, AGR (%), CAGR(%))(U-Shape Recovery)
Table 19. Global Oil & Gas Subsea Umbilicals, Risers & Flowlines (SURF) Market by Risers, 2022-2032 (USD Mn, AGR (%), CAGR(%))(L-Shape Recovery)
Table 20. Global Oil & Gas Subsea Umbilicals, Risers & Flowlines (SURF) Market by Product, 2022-2032 (USD Mn, AGR (%), CAGR(%))
Table 21. Global Oil & Gas Subsea Umbilicals, Risers & Flowlines (SURF) Market by Product, 2022-2032 (USD Mn, AGR (%), CAGR(%))(V-Shape Recovery)
Table 22. Global Oil & Gas Subsea Umbilicals, Risers & Flowlines (SURF) Market by Product, 2022-2032 (USD Mn, AGR (%), CAGR(%))(W-Shape Recovery)
Table 23. Global Oil & Gas Subsea Umbilicals, Risers & Flowlines (SURF) Market by Product, 2022-2032 (USD Mn, AGR (%), CAGR(%))(U-Shape Recovery)
Table 24. Global Oil & Gas Subsea Umbilicals, Risers & Flowlines (SURF) Market by Product, 2022-2032 (USD Mn, AGR (%), CAGR(%))(L-Shape Recovery)
Table 25. Global Oil & Gas Subsea Umbilicals, Risers & Flowlines (SURF) Market by Services, 2022-2032 (USD Mn, AGR (%), CAGR(%))
Table 26. Global Oil & Gas Subsea Umbilicals, Risers & Flowlines (SURF) Market by Services, 2022-2032 (USD Mn, AGR (%), CAGR(%))(V-Shape Recovery)
Table 27. Global Oil & Gas Subsea Umbilicals, Risers & Flowlines (SURF) Market by Services, 2022-2032 (USD Mn, AGR (%), CAGR(%))(W-Shape Recovery)
Table 28. Global Oil & Gas Subsea Umbilicals, Risers & Flowlines (SURF) Market by Services, 2022-2032 (USD Mn, AGR (%), CAGR(%))(U-Shape Recovery)
Table 29. Global Oil & Gas Subsea Umbilicals, Risers & Flowlines (SURF) Market by Services, 2022-2032 (USD Mn, AGR (%), CAGR(%))(L-Shape Recovery)
Table 30. Global Oil & Gas Subsea Umbilicals, Risers & Flowlines (SURF) Market by Water Depth, 2022-2032 (USD Mn, AGR (%), CAGR(%))
Table 31. Global Oil & Gas Subsea Umbilicals, Risers & Flowlines (SURF) Market by Water Depth, 2022-2032 (USD Mn, AGR (%), CAGR(%))(V-Shape Recovery)
Table 32. Global Oil & Gas Subsea Umbilicals, Risers & Flowlines (SURF) Market by Water Depth, 2022-2032 (USD Mn, AGR (%), CAGR(%))(W-Shape Recovery)
Table 33. Global Oil & Gas Subsea Umbilicals, Risers & Flowlines (SURF) Market by Water Depth, 2022-2032 (USD Mn, AGR (%), CAGR(%))(U-Shape Recovery)
Table 34. Global Oil & Gas Subsea Umbilicals, Risers & Flowlines (SURF) Market by Water Depth, 2022-2032 (USD Mn, AGR (%), CAGR(%))(L-Shape Recovery)
Table 35. Africa Oil & Gas Subsea Umbilicals, Risers & Flowlines (SURF) Market by Value, 2022-2032 (USD Mn, AGR (%), CAGR(%))
Table 36. Africa Oil & Gas Subsea Umbilicals, Risers & Flowlines (SURF) Market by Value, 2022-2032 (USD Mn, AGR (%), CAGR(%))(V-Shape Recovery)
Table 37. Africa Oil & Gas Subsea Umbilicals, Risers & Flowlines (SURF) Market by Value, 2022-2032 (USD Mn, AGR (%), CAGR(%))(W-Shape Recovery)
Table 38. Africa Oil & Gas Subsea Umbilicals, Risers & Flowlines (SURF) Market by Value, 2022-2032 (USD Mn, AGR (%), CAGR(%))(U-Shape Recovery)
Table 39. Africa Oil & Gas Subsea Umbilicals, Risers & Flowlines (SURF) Market by Value, 2022-2032 (USD Mn, AGR (%), CAGR(%))(L-Shape Recovery)
Table 40. Africa Oil & Gas Subsea Umbilicals, Risers & Flowlines (SURF) Market by Country, 2022-2032 (USD Mn, AGR (%), CAGR(%))
Table 41. Africa Oil & Gas Subsea Umbilicals, Risers & Flowlines (SURF) Market by Country, 2022-2032 (USD Mn, AGR (%), CAGR(%))
Table 42. Africa Oil & Gas Subsea Umbilicals, Risers & Flowlines (SURF) Market by Country, 2022-2032 (USD Mn, AGR (%), CAGR(%))
Table 43. Africa Oil & Gas Subsea Umbilicals, Risers & Flowlines (SURF) Market by Country, 2022-2032 (USD Mn, AGR (%), CAGR(%))
Table 44. Africa Oil & Gas Subsea Umbilicals, Risers & Flowlines (SURF) Market by Country, 2022-2032 (USD Mn, AGR (%), CAGR(%))
Table 45. Africa Oil & Gas Subsea Umbilicals, Risers & Flowlines (SURF) Market by Risers, 2022-2032 (USD Mn, AGR (%), CAGR(%))
Table 46. Africa Oil & Gas Subsea Umbilicals, Risers & Flowlines (SURF) Market by Risers, 2022-2032 (USD Mn, AGR (%), CAGR(%))(V-Shape Recovery)
Table 47. Africa Oil & Gas Subsea Umbilicals, Risers & Flowlines (SURF) Market by Risers, 2022-2032 (USD Mn, AGR (%), CAGR(%))(W-Shape Recovery)
Table 48. Africa Oil & Gas Subsea Umbilicals, Risers & Flowlines (SURF) Market by Risers, 2022-2032 (USD Mn, AGR (%), CAGR(%))(U-Shape Recovery)
Table 49. Africa Oil & Gas Subsea Umbilicals, Risers & Flowlines (SURF) Market by Risers, 2022-2032 (USD Mn, AGR (%), CAGR(%))(L-Shape Recovery)
Table 50. Africa Oil & Gas Subsea Umbilicals, Risers & Flowlines (SURF) Market by Product, 2022-2032 (USD Mn, AGR (%), CAGR(%))
Table 51. Africa Oil & Gas Subsea Umbilicals, Risers & Flowlines (SURF) Market by Product, 2022-2032 (USD Mn, AGR (%), CAGR(%))(V-Shape Recovery)
Table 52. Africa Oil & Gas Subsea Umbilicals, Risers & Flowlines (SURF) Market by Product, 2022-2032 (USD Mn, AGR (%), CAGR(%))(W-Shape Recovery)
Table 53. Africa Oil & Gas Subsea Umbilicals, Risers & Flowlines (SURF) Market by Product, 2022-2032 (USD Mn, AGR (%), CAGR(%))(U-Shape Recovery)
Table 54. Africa Oil & Gas Subsea Umbilicals, Risers & Flowlines (SURF) Market by Product, 2022-2032 (USD Mn, AGR (%), CAGR(%))(L-Shape Recovery)
Table 55. Africa Oil & Gas Subsea Umbilicals, Risers & Flowlines (SURF) Market by Services, 2022-2032 (USD Mn, AGR (%), CAGR(%))
Table 56. Africa Oil & Gas Subsea Umbilicals, Risers & Flowlines (SURF) Market by Services, 2022-2032 (USD Mn, AGR (%), CAGR(%))(V-Shape Recovery)
Table 57. Africa Oil & Gas Subsea Umbilicals, Risers & Flowlines (SURF) Market by Services, 2022-2032 (USD Mn, AGR (%), CAGR(%))(W-Shape Recovery)
Table 58. Africa Oil & Gas Subsea Umbilicals, Risers & Flowlines (SURF) Market by Services, 2022-2032 (USD Mn, AGR (%), CAGR(%))(U-Shape Recovery)
Table 59. Africa Oil & Gas Subsea Umbilicals, Risers & Flowlines (SURF) Market by Services, 2022-2032 (USD Mn, AGR (%), CAGR(%))(L-Shape Recovery)
Table 60. Africa Oil & Gas Subsea Umbilicals, Risers & Flowlines (SURF) Market by Water Depth, 2022-2032 (USD Mn, AGR (%), CAGR(%))
Table 61. Africa Oil & Gas Subsea Umbilicals, Risers & Flowlines (SURF) Market by Water Depth, 2022-2032 (USD Mn, AGR (%), CAGR(%))(V-Shape Recovery)
Table 62. Africa Oil & Gas Subsea Umbilicals, Risers & Flowlines (SURF) Market by Water Depth, 2022-2032 (USD Mn, AGR (%), CAGR(%))(W-Shape Recovery)
Table 63. Africa Oil & Gas Subsea Umbilicals, Risers & Flowlines (SURF) Market by Water Depth, 2022-2032 (USD Mn, AGR (%), CAGR(%))(U-Shape Recovery)
Table 64. Africa Oil & Gas Subsea Umbilicals, Risers & Flowlines (SURF) Market by Water Depth, 2022-2032 (USD Mn, AGR (%), CAGR(%))(L-Shape Recovery)
Table 65. Angola Oil & Gas Subsea Umbilicals, Risers & Flowlines (SURF) Market by Value, 2022-2032 (USD Mn, AGR (%), CAGR(%))
Table 66. Angola Oil & Gas Subsea Umbilicals, Risers & Flowlines (SURF) Market by Value, 2022-2032 (USD Mn, AGR (%), CAGR(%))(V-Shape Recovery)
Table 67. Angola Oil & Gas Subsea Umbilicals, Risers & Flowlines (SURF) Market by Value, 2022-2032 (USD Mn, AGR (%), CAGR(%))(W-Shape Recovery)
Table 68. Angola Oil & Gas Subsea Umbilicals, Risers & Flowlines (SURF) Market by Value, 2022-2032 (USD Mn, AGR (%), CAGR(%))(U-Shape Recovery)
Table 69. Angola Oil & Gas Subsea Umbilicals, Risers & Flowlines (SURF) Market by Value, 2022-2032 (USD Mn, AGR (%), CAGR(%))(L-Shape Recovery)
Table 70. Cameroon Oil & Gas Subsea Umbilicals, Risers & Flowlines (SURF) Market by Value, 2022-2032 (USD Mn, AGR (%), CAGR(%))
Table 71. Cameroon Oil & Gas Subsea Umbilicals, Risers & Flowlines (SURF) Market by Value, 2022-2032 (USD Mn, AGR (%), CAGR(%))(V-Shape Recovery)
Table 72. Cameroon Oil & Gas Subsea Umbilicals, Risers & Flowlines (SURF) Market by Value, 2022-2032 (USD Mn, AGR (%), CAGR(%))(W-Shape Recovery)
Table 73. Cameroon Oil & Gas Subsea Umbilicals, Risers & Flowlines (SURF) Market by Value, 2022-2032 (USD Mn, AGR (%), CAGR(%))(U-Shape Recovery)
Table 74. Cameroon Oil & Gas Subsea Umbilicals, Risers & Flowlines (SURF) Market by Value, 2022-2032 (USD Mn, AGR (%), CAGR(%))(L-Shape Recovery)
Table 75. Congo-Brazzaville Oil & Gas Subsea Umbilicals, Risers & Flowlines (SURF) Market by Value, 2022-2032 (USD Mn, AGR (%), CAGR(%))
Table 76. Congo-Brazzaville Oil & Gas Subsea Umbilicals, Risers & Flowlines (SURF) Market by Value, 2022-2032 (USD Mn, AGR (%), CAGR(%))(V-Shape Recovery)
Table 77. Congo-Brazzaville Oil & Gas Subsea Umbilicals, Risers & Flowlines (SURF) Market by Value, 2022-2032 (USD Mn, AGR (%), CAGR(%))(W-Shape Recovery)
Table 78. Congo-Brazzaville Oil & Gas Subsea Umbilicals, Risers & Flowlines (SURF) Market by Value, 2022-2032 (USD Mn, AGR (%), CAGR(%))(U-Shape Recovery)
Table 79. Congo-Brazzaville Oil & Gas Subsea Umbilicals, Risers & Flowlines (SURF) Market by Value, 2022-2032 (USD Mn, AGR (%), CAGR(%))(L-Shape Recovery)
Table 80. Egypt Oil & Gas Subsea Umbilicals, Risers & Flowlines (SURF) Market by Value, 2022-2032 (USD Mn, AGR (%), CAGR(%))
Table 81. Egypt Oil & Gas Subsea Umbilicals, Risers & Flowlines (SURF) Market by Value, 2022-2032 (USD Mn, AGR (%), CAGR(%))(V-Shape Recovery)
Table 82. Egypt Oil & Gas Subsea Umbilicals, Risers & Flowlines (SURF) Market by Value, 2022-2032 (USD Mn, AGR (%), CAGR(%))(W-Shape Recovery)
Table 83. Egypt Oil & Gas Subsea Umbilicals, Risers & Flowlines (SURF) Market by Value, 2022-2032 (USD Mn, AGR (%), CAGR(%))(U-Shape Recovery)
Table 84. Egypt Oil & Gas Subsea Umbilicals, Risers & Flowlines (SURF) Market by Value, 2022-2032 (USD Mn, AGR (%), CAGR(%))(L-Shape Recovery)
Table 85. Equatorial Guinea Oil & Gas Subsea Umbilicals, Risers & Flowlines (SURF) Market by Value, 2022-2032 (USD Mn, AGR (%), CAGR(%))
Table 86. Equatorial Guinea Oil & Gas Subsea Umbilicals, Risers & Flowlines (SURF) Market by Value, 2022-2032 (USD Mn, AGR (%), CAGR(%))(V-Shape Recovery)
Table 87. Equatorial Guinea Oil & Gas Subsea Umbilicals, Risers & Flowlines (SURF) Market by Value, 2022-2032 (USD Mn, AGR (%), CAGR(%))(W-Shape Recovery)
Table 88. Equatorial Guinea Oil & Gas Subsea Umbilicals, Risers & Flowlines (SURF) Market by Value, 2022-2032 (USD Mn, AGR (%), CAGR(%))(U-Shape Recovery)
Table 89. Equatorial Guinea Oil & Gas Subsea Umbilicals, Risers & Flowlines (SURF) Market by Value, 2022-2032 (USD Mn, AGR (%), CAGR(%))(L-Shape Recovery)
Table 90. Gabon Oil & Gas Subsea Umbilicals, Risers & Flowlines (SURF) Market by Value, 2022-2032 (USD Mn, AGR (%), CAGR(%))
Table 91. Gabon Oil & Gas Subsea Umbilicals, Risers & Flowlines (SURF) Market by Value, 2022-2032 (USD Mn, AGR (%), CAGR(%))(V-Shape Recovery)
Table 92. Gabon Oil & Gas Subsea Umbilicals, Risers & Flowlines (SURF) Market by Value, 2022-2032 (USD Mn, AGR (%), CAGR(%))(W-Shape Recovery)
Table 93. Gabon Oil & Gas Subsea Umbilicals, Risers & Flowlines (SURF) Market by Value, 2022-2032 (USD Mn, AGR (%), CAGR(%))(U-Shape Recovery)
Table 94. Gabon Oil & Gas Subsea Umbilicals, Risers & Flowlines (SURF) Market by Value, 2022-2032 (USD Mn, AGR (%), CAGR(%))(L-Shape Recovery)
Table 95. Ghana Oil & Gas Subsea Umbilicals, Risers & Flowlines (SURF) Market by Value, 2022-2032 (USD Mn, AGR (%), CAGR(%))
Table 96. Ghana Oil & Gas Subsea Umbilicals, Risers & Flowlines (SURF) Market by Value, 2022-2032 (USD Mn, AGR (%), CAGR(%))(V-Shape Recovery)
Table 97. Ghana Oil & Gas Subsea Umbilicals, Risers & Flowlines (SURF) Market by Value, 2022-2032 (USD Mn, AGR (%), CAGR(%))(W-Shape Recovery)
Table 98. Ghana Oil & Gas Subsea Umbilicals, Risers & Flowlines (SURF) Market by Value, 2022-2032 (USD Mn, AGR (%), CAGR(%))(U-Shape Recovery)
Table 99. Ghana Oil & Gas Subsea Umbilicals, Risers & Flowlines (SURF) Market by Value, 2022-2032 (USD Mn, AGR (%), CAGR(%))(L-Shape Recovery)
Table 100. Mozambique Oil & Gas Subsea Umbilicals, Risers & Flowlines (SURF) Market by Value, 2022-2032 (USD Mn, AGR (%), CAGR(%))
Table 101. Mozambique Oil & Gas Subsea Umbilicals, Risers & Flowlines (SURF) Market by Value, 2022-2032 (USD Mn, AGR (%), CAGR(%))(V-Shape Recovery)
Table 102. Mozambique Oil & Gas Subsea Umbilicals, Risers & Flowlines (SURF) Market by Value, 2022-2032 (USD Mn, AGR (%), CAGR(%))(W-Shape Recovery)
Table 103. Mozambique Oil & Gas Subsea Umbilicals, Risers & Flowlines (SURF) Market by Value, 2022-2032 (USD Mn, AGR (%), CAGR(%))(U-Shape Recovery)
Table 104. Mozambique Oil & Gas Subsea Umbilicals, Risers & Flowlines (SURF) Market by Value, 2022-2032 (USD Mn, AGR (%), CAGR(%))(L-Shape Recovery)
Table 105. Namibia Oil & Gas Subsea Umbilicals, Risers & Flowlines (SURF) Market by Value, 2022-2032 (USD Mn, AGR (%), CAGR(%))
Table 106. Namibia Oil & Gas Subsea Umbilicals, Risers & Flowlines (SURF) Market by Value, 2022-2032 (USD Mn, AGR (%), CAGR(%))(V-Shape Recovery)
Table 107. Namibia Oil & Gas Subsea Umbilicals, Risers & Flowlines (SURF) Market by Value, 2022-2032 (USD Mn, AGR (%), CAGR(%))(W-Shape Recovery)
Table 108. Namibia Oil & Gas Subsea Umbilicals, Risers & Flowlines (SURF) Market by Value, 2022-2032 (USD Mn, AGR (%), CAGR(%))(U-Shape Recovery)
Table 109. Namibia Oil & Gas Subsea Umbilicals, Risers & Flowlines (SURF) Market by Value, 2022-2032 (USD Mn, AGR (%), CAGR(%))(L-Shape Recovery)
Table 110. Nigeria Oil & Gas Subsea Umbilicals, Risers & Flowlines (SURF) Market by Value, 2022-2032 (USD Mn, AGR (%), CAGR(%))
Table 111. Nigeria Oil & Gas Subsea Umbilicals, Risers & Flowlines (SURF) Market by Value, 2022-2032 (USD Mn, AGR (%), CAGR(%))(V-Shape Recovery)
Table 112. Nigeria Oil & Gas Subsea Umbilicals, Risers & Flowlines (SURF) Market by Value, 2022-2032 (USD Mn, AGR (%), CAGR(%))(W-Shape Recovery)
Table 113. Nigeria Oil & Gas Subsea Umbilicals, Risers & Flowlines (SURF) Market by Value, 2022-2032 (USD Mn, AGR (%), CAGR(%))(U-Shape Recovery)
Table 114. Nigeria Oil & Gas Subsea Umbilicals, Risers & Flowlines (SURF) Market by Value, 2022-2032 (USD Mn, AGR (%), CAGR(%))(L-Shape Recovery)
Table 115. South Africa Oil & Gas Subsea Umbilicals, Risers & Flowlines (SURF) Market by Value, 2022-2032 (USD Mn, AGR (%), CAGR(%))
Table 116. South Africa Oil & Gas Subsea Umbilicals, Risers & Flowlines (SURF) Market by Value, 2022-2032 (USD Mn, AGR (%), CAGR(%))(V-Shape Recovery)
Table 117. South Africa Oil & Gas Subsea Umbilicals, Risers & Flowlines (SURF) Market by Value, 2022-2032 (USD Mn, AGR (%), CAGR(%))(W-Shape Recovery)
Table 118. South Africa Oil & Gas Subsea Umbilicals, Risers & Flowlines (SURF) Market by Value, 2022-2032 (USD Mn, AGR (%), CAGR(%))(U-Shape Recovery)
Table 119. South Africa Oil & Gas Subsea Umbilicals, Risers & Flowlines (SURF) Market by Value, 2022-2032 (USD Mn, AGR (%), CAGR(%))(L-Shape Recovery)
Table 120. Tanzania Oil & Gas Subsea Umbilicals, Risers & Flowlines (SURF) Market by Value, 2022-2032 (USD Mn, AGR (%), CAGR(%))
Table 121. Tanzania Oil & Gas Subsea Umbilicals, Risers & Flowlines (SURF) Market by Value, 2022-2032 (USD Mn, AGR (%), CAGR(%))(V-Shape Recovery)
Table 122. Tanzania Oil & Gas Subsea Umbilicals, Risers & Flowlines (SURF) Market by Value, 2022-2032 (USD Mn, AGR (%), CAGR(%))(W-Shape Recovery)
Table 123. Tanzania Oil & Gas Subsea Umbilicals, Risers & Flowlines (SURF) Market by Value, 2022-2032 (USD Mn, AGR (%), CAGR(%))(U-Shape Recovery)
Table 124. Tanzania Oil & Gas Subsea Umbilicals, Risers & Flowlines (SURF) Market by Value, 2022-2032 (USD Mn, AGR (%), CAGR(%))(L-Shape Recovery)
Table 125. Rest of Africa Oil & Gas Subsea Umbilicals, Risers & Flowlines (SURF) Market by Value, 2022-2032 (USD Mn, AGR (%), CAGR(%))
Table 126. Rest of Africa Oil & Gas Subsea Umbilicals, Risers & Flowlines (SURF) Market by Value, 2022-2032 (USD Mn, AGR (%), CAGR(%))(V-Shape Recovery)
Table 127. Rest of Africa Oil & Gas Subsea Umbilicals, Risers & Flowlines (SURF) Market by Value, 2022-2032 (USD Mn, AGR (%), CAGR(%))(W-Shape Recovery)
Table 128. Rest of Africa Oil & Gas Subsea Umbilicals, Risers & Flowlines (SURF) Market by Value, 2022-2032 (USD Mn, AGR (%), CAGR(%))(U-Shape Recovery)
Table 129. Rest of Africa Oil & Gas Subsea Umbilicals, Risers & Flowlines (SURF) Market by Value, 2022-2032 (USD Mn, AGR (%), CAGR(%))(L-Shape Recovery)
Table 130. Asia-Pacific Oil & Gas Subsea Umbilicals, Risers & Flowlines (SURF) Market by Value, 2022-2032 (USD Mn, AGR (%), CAGR(%))
Table 131. Asia-Pacific Oil & Gas Subsea Umbilicals, Risers & Flowlines (SURF) Market by Value, 2022-2032 (USD Mn, AGR (%), CAGR(%))(V-Shape Recovery)
Table 132. Asia-Pacific Oil & Gas Subsea Umbilicals, Risers & Flowlines (SURF) Market by Value, 2022-2032 (USD Mn, AGR (%), CAGR(%))(W-Shape Recovery)
Table 133. Asia-Pacific Oil & Gas Subsea Umbilicals, Risers & Flowlines (SURF) Market by Value, 2022-2032 (USD Mn, AGR (%), CAGR(%))(U-Shape Recovery)
Table 134. Asia-Pacific Oil & Gas Subsea Umbilicals, Risers & Flowlines (SURF) Market by Value, 2022-2032 (USD Mn, AGR (%), CAGR(%))(L-Shape Recovery)
Table 135. Asia-Pacific Oil & Gas Subsea Umbilicals, Risers & Flowlines (SURF) Market by Country, 2022-2032 (USD Mn, AGR (%), CAGR(%))
Table 136. Asia-Pacific Oil & Gas Subsea Umbilicals, Risers & Flowlines (SURF) Market by Country, 2022-2032 (USD Mn, AGR (%), CAGR(%))
Table 137. Asia-Pacific Oil & Gas Subsea Umbilicals, Risers & Flowlines (SURF) Market by Country, 2022-2032 (USD Mn, AGR (%), CAGR(%))
Table 138. Asia-Pacific Oil & Gas Subsea Umbilicals, Risers & Flowlines (SURF) Market by Country, 2022-2032 (USD Mn, AGR (%), CAGR(%))
Table 139. Asia-Pacific Oil & Gas Subsea Umbilicals, Risers & Flowlines (SURF) Market by Country, 2022-2032 (USD Mn, AGR (%), CAGR(%))
Table 140. Asia-Pacific Oil & Gas Subsea Umbilicals, Risers & Flowlines (SURF) Market by Risers, 2022-2032 (USD Mn, AGR (%), CAGR(%))
Table 141. Asia-Pacific Oil & Gas Subsea Umbilicals, Risers & Flowlines (SURF) Market by Risers, 2022-2032 (USD Mn, AGR (%), CAGR(%))(V-Shape Recovery)
Table 142. Asia-Pacific Oil & Gas Subsea Umbilicals, Risers & Flowlines (SURF) Market by Risers, 2022-2032 (USD Mn, AGR (%), CAGR(%))(W-Shape Recovery)
Table 143. Asia-Pacific Oil & Gas Subsea Umbilicals, Risers & Flowlines (SURF) Market by Risers, 2022-2032 (USD Mn, AGR (%), CAGR(%))(U-Shape Recovery)
Table 144. Asia-Pacific Oil & Gas Subsea Umbilicals, Risers & Flowlines (SURF) Market by Risers, 2022-2032 (USD Mn, AGR (%), CAGR(%))(L-Shape Recovery)
Table 145. Asia-Pacific Oil & Gas Subsea Umbilicals, Risers & Flowlines (SURF) Market by Product, 2022-2032 (USD Mn, AGR (%), CAGR(%))
Table 146. Asia-Pacific Oil & Gas Subsea Umbilicals, Risers & Flowlines (SURF) Market by Product, 2022-2032 (USD Mn, AGR (%), CAGR(%))(V-Shape Recovery)
Table 147. Asia-Pacific Oil & Gas Subsea Umbilicals, Risers & Flowlines (SURF) Market by Product, 2022-2032 (USD Mn, AGR (%), CAGR(%))(W-Shape Recovery)
Table 148. Asia-Pacific Oil & Gas Subsea Umbilicals, Risers & Flowlines (SURF) Market by Product, 2022-2032 (USD Mn, AGR (%), CAGR(%))(U-Shape Recovery)
Table 149. Asia-Pacific Oil & Gas Subsea Umbilicals, Risers & Flowlines (SURF) Market by Product, 2022-2032 (USD Mn, AGR (%), CAGR(%))(L-Shape Recovery)
Table 150. Asia-Pacific Oil & Gas Subsea Umbilicals, Risers & Flowlines (SURF) Market by Services, 2022-2032 (USD Mn, AGR (%), CAGR(%))
Table 151. Asia-Pacific Oil & Gas Subsea Umbilicals, Risers & Flowlines (SURF) Market by Services, 2022-2032 (USD Mn, AGR (%), CAGR(%))(V-Shape Recovery)
Table 152. Asia-Pacific Oil & Gas Subsea Umbilicals, Risers & Flowlines (SURF) Market by Services, 2022-2032 (USD Mn, AGR (%), CAGR(%))(W-Shape Recovery)
Table 153. Asia-Pacific Oil & Gas Subsea Umbilicals, Risers & Flowlines (SURF) Market by Services, 2022-2032 (USD Mn, AGR (%), CAGR(%))(U-Shape Recovery)
Table 154. Asia-Pacific Oil & Gas Subsea Umbilicals, Risers & Flowlines (SURF) Market by Services, 2022-2032 (USD Mn, AGR (%), CAGR(%))(L-Shape Recovery)
Table 155. Asia-Pacific Oil & Gas Subsea Umbilicals, Risers & Flowlines (SURF) Market by Water Depth, 2022-2032 (USD Mn, AGR (%), CAGR(%))
Table 156. Asia-Pacific Oil & Gas Subsea Umbilicals, Risers & Flowlines (SURF) Market by Water Depth, 2022-2032 (USD Mn, AGR (%), CAGR(%))(V-Shape Recovery)
Table 157. Asia-Pacific Oil & Gas Subsea Umbilicals, Risers & Flowlines (SURF) Market by Water Depth, 2022-2032 (USD Mn, AGR (%), CAGR(%))(W-Shape Recovery)
Table 158. Asia-Pacific Oil & Gas Subsea Umbilicals, Risers & Flowlines (SURF) Market by Water Depth, 2022-2032 (USD Mn, AGR (%), CAGR(%))(U-Shape Recovery)
Table 159. Asia-Pacific Oil & Gas Subsea Umbilicals, Risers & Flowlines (SURF) Market by Water Depth, 2022-2032 (USD Mn, AGR (%), CAGR(%))(L-Shape Recovery)
Table 160. Australia Oil & Gas Subsea Umbilicals, Risers & Flowlines (SURF) Market by Value, 2022-2032 (USD Mn, AGR (%), CAGR(%))
Table 161. Australia Oil & Gas Subsea Umbilicals, Risers & Flowlines (SURF) Market by Value, 2022-2032 (USD Mn, AGR (%), CAGR(%))(V-Shape Recovery)
Table 162. Australia Oil & Gas Subsea Umbilicals, Risers & Flowlines (SURF) Market by Value, 2022-2032 (USD Mn, AGR (%), CAGR(%))(W-Shape Recovery)
Table 163. Australia Oil & Gas Subsea Umbilicals, Risers & Flowlines (SURF) Market by Value, 2022-2032 (USD Mn, AGR (%), CAGR(%))(U-Shape Recovery)
Table 164. Australia Oil & Gas Subsea Umbilicals, Risers & Flowlines (SURF) Market by Value, 2022-2032 (USD Mn, AGR (%), CAGR(%))(L-Shape Recovery)
Table 165. Brunei Oil & Gas Subsea Umbilicals, Risers & Flowlines (SURF) Market by Value, 2022-2032 (USD Mn, AGR (%), CAGR(%))
Table 166. Brunei Oil & Gas Subsea Umbilicals, Risers & Flowlines (SURF) Market by Value, 2022-2032 (USD Mn, AGR (%), CAGR(%))(V-Shape Recovery)
Table 167. Brunei Oil & Gas Subsea Umbilicals, Risers & Flowlines (SURF) Market by Value, 2022-2032 (USD Mn, AGR (%), CAGR(%))(W-Shape Recovery)
Table 168. Brunei Oil & Gas Subsea Umbilicals, Risers & Flowlines (SURF) Market by Value, 2022-2032 (USD Mn, AGR (%), CAGR(%))(U-Shape Recovery)
Table 169. Brunei Oil & Gas Subsea Umbilicals, Risers & Flowlines (SURF) Market by Value, 2022-2032 (USD Mn, AGR (%), CAGR(%))(L-Shape Recovery)
Table 170. China Oil & Gas Subsea Umbilicals, Risers & Flowlines (SURF) Market by Value, 2022-2032 (USD Mn, AGR (%), CAGR(%))
Table 171. China Oil & Gas Subsea Umbilicals, Risers & Flowlines (SURF) Market by Value, 2022-2032 (USD Mn, AGR (%), CAGR(%))(V-Shape Recovery)
Table 172. China Oil & Gas Subsea Umbilicals, Risers & Flowlines (SURF) Market by Value, 2022-2032 (USD Mn, AGR (%), CAGR(%))(W-Shape Recovery)
Table 173. China Oil & Gas Subsea Umbilicals, Risers & Flowlines (SURF) Market by Value, 2022-2032 (USD Mn, AGR (%), CAGR(%))(U-Shape Recovery)
Table 174. China Oil & Gas Subsea Umbilicals, Risers & Flowlines (SURF) Market by Value, 2022-2032 (USD Mn, AGR (%), CAGR(%))(L-Shape Recovery)
Table 175. India Oil & Gas Subsea Umbilicals, Risers & Flowlines (SURF) Market by Value, 2022-2032 (USD Mn, AGR (%), CAGR(%))
Table 176. India Oil & Gas Subsea Umbilicals, Risers & Flowlines (SURF) Market by Value, 2022-2032 (USD Mn, AGR (%), CAGR(%))(V-Shape Recovery)
Table 177. India Oil & Gas Subsea Umbilicals, Risers & Flowlines (SURF) Market by Value, 2022-2032 (USD Mn, AGR (%), CAGR(%))(W-Shape Recovery)
Table 178. India Oil & Gas Subsea Umbilicals, Risers & Flowlines (SURF) Market by Value, 2022-2032 (USD Mn, AGR (%), CAGR(%))(U-Shape Recovery)
Table 179. India Oil & Gas Subsea Umbilicals, Risers & Flowlines (SURF) Market by Value, 2022-2032 (USD Mn, AGR (%), CAGR(%))(L-Shape Recovery)
Table 180. Indonesia Oil & Gas Subsea Umbilicals, Risers & Flowlines (SURF) Market by Value, 2022-2032 (USD Mn, AGR (%), CAGR(%))
Table 181. Indonesia Oil & Gas Subsea Umbilicals, Risers & Flowlines (SURF) Market by Value, 2022-2032 (USD Mn, AGR (%), CAGR(%))(V-Shape Recovery)
Table 182. Indonesia Oil & Gas Subsea Umbilicals, Risers & Flowlines (SURF) Market by Value, 2022-2032 (USD Mn, AGR (%), CAGR(%))(W-Shape Recovery)
Table 183. Indonesia Oil & Gas Subsea Umbilicals, Risers & Flowlines (SURF) Market by Value, 2022-2032 (USD Mn, AGR (%), CAGR(%))(U-Shape Recovery)
Table 184. Indonesia Oil & Gas Subsea Umbilicals, Risers & Flowlines (SURF) Market by Value, 2022-2032 (USD Mn, AGR (%), CAGR(%))(L-Shape Recovery)
Table 185. Rest of Asia-Pacific Oil & Gas Subsea Umbilicals, Risers & Flowlines (SURF) Market by Value, 2022-2032 (USD Mn, AGR (%), CAGR(%))
Table 186. Rest of Asia-Pacific Oil & Gas Subsea Umbilicals, Risers & Flowlines (SURF) Market by Value, 2022-2032 (USD Mn, AGR (%), CAGR(%))(V-Shape Recovery)
Table 187. Rest of Asia-Pacific Oil & Gas Subsea Umbilicals, Risers & Flowlines (SURF) Market by Value, 2022-2032 (USD Mn, AGR (%), CAGR(%))(W-Shape Recovery)
Table 188. Rest of Asia-Pacific Oil & Gas Subsea Umbilicals, Risers & Flowlines (SURF) Market by Value, 2022-2032 (USD Mn, AGR (%), CAGR(%))(U-Shape Recovery)
Table 189. Rest of Asia-Pacific Oil & Gas Subsea Umbilicals, Risers & Flowlines (SURF) Market by Value, 2022-2032 (USD Mn, AGR (%), CAGR(%))(L-Shape Recovery)
Table 190. Eurasia/Middle East Oil & Gas Subsea Umbilicals, Risers & Flowlines (SURF) Market by Value, 2022-2032 (USD Mn, AGR (%), CAGR(%))
Table 191. Eurasia/Middle East Oil & Gas Subsea Umbilicals, Risers & Flowlines (SURF) Market by Value, 2022-2032 (USD Mn, AGR (%), CAGR(%))(V-Shape Recovery)
Table 192. Eurasia/Middle East Oil & Gas Subsea Umbilicals, Risers & Flowlines (SURF) Market by Value, 2022-2032 (USD Mn, AGR (%), CAGR(%))(W-Shape Recovery)
Table 193. Eurasia/Middle East Oil & Gas Subsea Umbilicals, Risers & Flowlines (SURF) Market by Value, 2022-2032 (USD Mn, AGR (%), CAGR(%))(U-Shape Recovery)
Table 194. Eurasia/Middle East Oil & Gas Subsea Umbilicals, Risers & Flowlines (SURF) Market by Value, 2022-2032 (USD Mn, AGR (%), CAGR(%))(L-Shape Recovery)
Table 195. Eurasia/Middle East Oil & Gas Subsea Umbilicals, Risers & Flowlines (SURF) Market by Country, 2022-2032 (USD Mn, AGR (%), CAGR(%))
Table 196. Eurasia/Middle East Oil & Gas Subsea Umbilicals, Risers & Flowlines (SURF) Market by Country, 2022-2032 (USD Mn, AGR (%), CAGR(%))
Table 197. Eurasia/Middle East Oil & Gas Subsea Umbilicals, Risers & Flowlines (SURF) Market by Country, 2022-2032 (USD Mn, AGR (%), CAGR(%))
Table 198. Eurasia/Middle East Oil & Gas Subsea Umbilicals, Risers & Flowlines (SURF) Market by Country, 2022-2032 (USD Mn, AGR (%), CAGR(%))
Table 199. Eurasia/Middle East Oil & Gas Subsea Umbilicals, Risers & Flowlines (SURF) Market by Country, 2022-2032 (USD Mn, AGR (%), CAGR(%))
Table 200. Eurasia/Middle East Oil & Gas Subsea Umbilicals, Risers & Flowlines (SURF) Market by Risers, 2022-2032 (USD Mn, AGR (%), CAGR(%))
Table 201. Eurasia/Middle East Oil & Gas Subsea Umbilicals, Risers & Flowlines (SURF) Market by Risers, 2022-2032 (USD Mn, AGR (%), CAGR(%))(V-Shape Recovery)
Table 202. Eurasia/Middle East Oil & Gas Subsea Umbilicals, Risers & Flowlines (SURF) Market by Risers, 2022-2032 (USD Mn, AGR (%), CAGR(%))(W-Shape Recovery)
Table 203. Eurasia/Middle East Oil & Gas Subsea Umbilicals, Risers & Flowlines (SURF) Market by Risers, 2022-2032 (USD Mn, AGR (%), CAGR(%))(U-Shape Recovery)
Table 204. Eurasia/Middle East Oil & Gas Subsea Umbilicals, Risers & Flowlines (SURF) Market by Risers, 2022-2032 (USD Mn, AGR (%), CAGR(%))(L-Shape Recovery)
Table 205. Eurasia/Middle East Oil & Gas Subsea Umbilicals, Risers & Flowlines (SURF) Market by Product, 2022-2032 (USD Mn, AGR (%), CAGR(%))
Table 206. Eurasia/Middle East Oil & Gas Subsea Umbilicals, Risers & Flowlines (SURF) Market by Product, 2022-2032 (USD Mn, AGR (%), CAGR(%))(V-Shape Recovery)
Table 207. Eurasia/Middle East Oil & Gas Subsea Umbilicals, Risers & Flowlines (SURF) Market by Product, 2022-2032 (USD Mn, AGR (%), CAGR(%))(W-Shape Recovery)
Table 208. Eurasia/Middle East Oil & Gas Subsea Umbilicals, Risers & Flowlines (SURF) Market by Product, 2022-2032 (USD Mn, AGR (%), CAGR(%))(U-Shape Recovery)
Table 209. Eurasia/Middle East Oil & Gas Subsea Umbilicals, Risers & Flowlines (SURF) Market by Product, 2022-2032 (USD Mn, AGR (%), CAGR(%))(L-Shape Recovery)
Table 210. Eurasia/Middle East Oil & Gas Subsea Umbilicals, Risers & Flowlines (SURF) Market by Services, 2022-2032 (USD Mn, AGR (%), CAGR(%))
Table 211. Eurasia/Middle East Oil & Gas Subsea Umbilicals, Risers & Flowlines (SURF) Market by Services, 2022-2032 (USD Mn, AGR (%), CAGR(%)(V-Shape Recovery)
Table 212. Eurasia/Middle East Oil & Gas Subsea Umbilicals, Risers & Flowlines (SURF) Market by Services, 2022-2032 (USD Mn, AGR (%), CAGR(%))(W-Shape Recovery)
Table 213. Eurasia/Middle East Oil & Gas Subsea Umbilicals, Risers & Flowlines (SURF) Market by Services, 2022-2032 (USD Mn, AGR (%), CAGR(%))(U-Shape Recovery)
Table 214. Eurasia/Middle East Oil & Gas Subsea Umbilicals, Risers & Flowlines (SURF) Market by Services, 2022-2032 (USD Mn, AGR (%), CAGR(%))(L-Shape Recovery)
Table 215. Eurasia/Middle East Oil & Gas Subsea Umbilicals, Risers & Flowlines (SURF) Market by Water Depth, 2022-2032 (USD Mn, AGR (%), CAGR(%))
Table 216. Eurasia/Middle East Oil & Gas Subsea Umbilicals, Risers & Flowlines (SURF) Market by Water Depth, 2022-2032 (USD Mn, AGR (%), CAGR(%))(V-Shape Recovery)
Table 217. Eurasia/Middle East Oil & Gas Subsea Umbilicals, Risers & Flowlines (SURF) Market by Water Depth, 2022-2032 (USD Mn, AGR (%), CAGR(%))(W-Shape Recovery)
Table 218. Eurasia/Middle East Oil & Gas Subsea Umbilicals, Risers & Flowlines (SURF) Market by Water Depth, 2022-2032 (USD Mn, AGR (%), CAGR(%))(U-Shape Recovery)
Table 219. Eurasia/Middle East Oil & Gas Subsea Umbilicals, Risers & Flowlines (SURF) Market by Water Depth, 2022-2032 (USD Mn, AGR (%), CAGR(%))(L-Shape Recovery)
Table 220. Black Sea Oil & Gas Subsea Umbilicals, Risers & Flowlines (SURF) Market by Value, 2022-2032 (USD Mn, AGR (%), CAGR(%))
Table 221. Black Sea Oil & Gas Subsea Umbilicals, Risers & Flowlines (SURF) Market by Value, 2022-2032 (USD Mn, AGR (%), CAGR(%))(V-Shape Recovery)
Table 222. Black Sea Oil & Gas Subsea Umbilicals, Risers & Flowlines (SURF) Market by Value, 2022-2032 (USD Mn, AGR (%), CAGR(%))(W-Shape Recovery)
Table 223. Black Sea Oil & Gas Subsea Umbilicals, Risers & Flowlines (SURF) Market by Value, 2022-2032 (USD Mn, AGR (%), CAGR(%))(U-Shape Recovery)
Table 224. Black Sea Oil & Gas Subsea Umbilicals, Risers & Flowlines (SURF) Market by Value, 2022-2032 (USD Mn, AGR (%), CAGR(%))(L-Shape Recovery)
Table 225. Caspian Sea Oil & Gas Subsea Umbilicals, Risers & Flowlines (SURF) Market by Value, 2022-2032 (USD Mn, AGR (%), CAGR(%))
Table 226. Caspian Sea Oil & Gas Subsea Umbilicals, Risers & Flowlines (SURF) Market by Value, 2022-2032 (USD Mn, AGR (%), CAGR(%))(V-Shape Recovery)
Table 227. Caspian Sea Oil & Gas Subsea Umbilicals, Risers & Flowlines (SURF) Market by Value, 2022-2032 (USD Mn, AGR (%), CAGR(%))(W-Shape Recovery)
Table 228. Caspian Sea Oil & Gas Subsea Umbilicals, Risers & Flowlines (SURF) Market by Value, 2022-2032 (USD Mn, AGR (%), CAGR(%))(U-Shape Recovery)
Table 229. Caspian Sea Oil & Gas Subsea Umbilicals, Risers & Flowlines (SURF) Market by Value, 2022-2032 (USD Mn, AGR (%), CAGR(%))(L-Shape Recovery)
Table 230. Persian Gulf Oil & Gas Subsea Umbilicals, Risers & Flowlines (SURF) Market by Value, 2022-2032 (USD Mn, AGR (%), CAGR(%))
Table 231. Persian Gulf Oil & Gas Subsea Umbilicals, Risers & Flowlines (SURF) Market by Value, 2022-2032 (USD Mn, AGR (%), CAGR(%))(V-Shape Recovery)
Table 232. Persian Gulf Oil & Gas Subsea Umbilicals, Risers & Flowlines (SURF) Market by Value, 2022-2032 (USD Mn, AGR (%), CAGR(%))(W-Shape Recovery)
Table 233. Persian Gulf Oil & Gas Subsea Umbilicals, Risers & Flowlines (SURF) Market by Value, 2022-2032 (USD Mn, AGR (%), CAGR(%))(U-Shape Recovery)
Table 234. Persian Gulf Oil & Gas Subsea Umbilicals, Risers & Flowlines (SURF) Market by Value, 2022-2032 (USD Mn, AGR (%), CAGR(%))(L-Shape Recovery)
Table 235. Russian Arctic Oil & Gas Subsea Umbilicals, Risers & Flowlines (SURF) Market by Value, 2022-2032 (USD Mn, AGR (%), CAGR(%))
Table 236. Russian Arctic Oil & Gas Subsea Umbilicals, Risers & Flowlines (SURF) Market by Value, 2022-2032 (USD Mn, AGR (%), CAGR(%))(V-Shape Recovery)
Table 237. Russian Arctic Oil & Gas Subsea Umbilicals, Risers & Flowlines (SURF) Market by Value, 2022-2032 (USD Mn, AGR (%), CAGR(%))(W-Shape Recovery)
Table 238. Russian Arctic Oil & Gas Subsea Umbilicals, Risers & Flowlines (SURF) Market by Value, 2022-2032 (USD Mn, AGR (%), CAGR(%))(U-Shape Recovery)
Table 239. Russian Arctic Oil & Gas Subsea Umbilicals, Risers & Flowlines (SURF) Market by Value, 2022-2032 (USD Mn, AGR (%), CAGR(%))(L-Shape Recovery)
Table 240. Rest of Eurasia/Middle East Oil & Gas Subsea Umbilicals, Risers & Flowlines (SURF) Market by Value, 2022-2032 (USD Mn, AGR (%), CAGR(%))
Table 241. Rest of Eurasia/Middle East Oil & Gas Subsea Umbilicals, Risers & Flowlines (SURF) Market by Value, 2022-2032 (USD Mn, AGR (%), CAGR(%))(V-Shape Recovery)
Table 242. Rest of Eurasia/Middle East Oil & Gas Subsea Umbilicals, Risers & Flowlines (SURF) Market by Value, 2022-2032 (USD Mn, AGR (%), CAGR(%))(W-Shape Recovery)
Table 243. Rest of Eurasia/Middle East Oil & Gas Subsea Umbilicals, Risers & Flowlines (SURF) Market by Value, 2022-2032 (USD Mn, AGR (%), CAGR(%))(U-Shape Recovery)
Table 244. Rest of Eurasia/Middle East Oil & Gas Subsea Umbilicals, Risers & Flowlines (SURF) Market by Value, 2022-2032 (USD Mn, AGR (%), CAGR(%))(L-Shape Recovery)
Table 245. Americas Oil & Gas Subsea Umbilicals, Risers & Flowlines (SURF) Market by Value, 2022-2032 (USD Mn, AGR (%), CAGR(%))
Table 246. Americas Oil & Gas Subsea Umbilicals, Risers & Flowlines (SURF) Market by Value, 2022-2032 (USD Mn, AGR (%), CAGR(%))(V-Shape Recovery)
Table 247. Americas Oil & Gas Subsea Umbilicals, Risers & Flowlines (SURF) Market by Value, 2022-2032 (USD Mn, AGR (%), CAGR(%))(W-Shape Recovery)
Table 248. Americas Oil & Gas Subsea Umbilicals, Risers & Flowlines (SURF) Market by Value, 2022-2032 (USD Mn, AGR (%), CAGR(%))(U-Shape Recovery)
Table 249. Americas Oil & Gas Subsea Umbilicals, Risers & Flowlines (SURF) Market by Value, 2022-2032 (USD Mn, AGR (%), CAGR(%))(L-Shape Recovery)
Table 250. Americas Oil & Gas Subsea Umbilicals, Risers & Flowlines (SURF) Market by Country, 2022-2032 (USD Mn, AGR (%), CAGR(%))
Table 251. Americas Oil & Gas Subsea Umbilicals, Risers & Flowlines (SURF) Market by Country, 2022-2032 (USD Mn, AGR (%), CAGR(%))
Table 252. Americas Oil & Gas Subsea Umbilicals, Risers & Flowlines (SURF) Market by Country, 2022-2032 (USD Mn, AGR (%), CAGR(%))
Table 253. Americas Oil & Gas Subsea Umbilicals, Risers & Flowlines (SURF) Market by Country, 2022-2032 (USD Mn, AGR (%), CAGR(%))
Table 254. Americas Oil & Gas Subsea Umbilicals, Risers & Flowlines (SURF) Market by Country, 2022-2032 (USD Mn, AGR (%), CAGR(%))
Table 255. Americas Oil & Gas Subsea Umbilicals, Risers & Flowlines (SURF) Market by Risers, 2022-2032 (USD Mn, AGR (%), CAGR(%))
Table 256. Americas Oil & Gas Subsea Umbilicals, Risers & Flowlines (SURF) Market by Risers, 2022-2032 (USD Mn, AGR (%), CAGR(%))(V-Shape Recovery)
Table 257. Americas Oil & Gas Subsea Umbilicals, Risers & Flowlines (SURF) Market by Risers, 2022-2032 (USD Mn, AGR (%), CAGR(%))(W-Shape Recovery)
Table 258. Americas Oil & Gas Subsea Umbilicals, Risers & Flowlines (SURF) Market by Risers, 2022-2032 (USD Mn, AGR (%), CAGR(%))(U-Shape Recovery)
Table 259. Americas Oil & Gas Subsea Umbilicals, Risers & Flowlines (SURF) Market by Risers, 2022-2032 (USD Mn, AGR (%), CAGR(%))(L-Shape Recovery)
Table 260. Americas Oil & Gas Subsea Umbilicals, Risers & Flowlines (SURF) Market by Product, 2022-2032 (USD Mn, AGR (%), CAGR(%))
Table 261. Americas Oil & Gas Subsea Umbilicals, Risers & Flowlines (SURF) Market by Product, 2022-2032 (USD Mn, AGR (%), CAGR(%))(V-Shape Recovery)
Table 262. Americas Oil & Gas Subsea Umbilicals, Risers & Flowlines (SURF) Market by Product, 2022-2032 (USD Mn, AGR (%), CAGR(%))(W-Shape Recovery)
Table 263. Americas Oil & Gas Subsea Umbilicals, Risers & Flowlines (SURF) Market by Product, 2022-2032 (USD Mn, AGR (%), CAGR(%))(U-Shape Recovery)
Table 264. Americas Oil & Gas Subsea Umbilicals, Risers & Flowlines (SURF) Market by Product, 2022-2032 (USD Mn, AGR (%), CAGR(%))(L-Shape Recovery)
Table 265. Americas Oil & Gas Subsea Umbilicals, Risers & Flowlines (SURF) Market by Services, 2022-2032 (USD Mn, AGR (%), CAGR(%))
Table 266. Americas Oil & Gas Subsea Umbilicals, Risers & Flowlines (SURF) Market by Services, 2022-2032 (USD Mn, AGR (%), CAGR(%))(V-Shape Recovery)
Table 267. Americas Oil & Gas Subsea Umbilicals, Risers & Flowlines (SURF) Market by Services, 2022-2032 (USD Mn, AGR (%), CAGR(%))(W-Shape Recovery)
Table 268. Americas Oil & Gas Subsea Umbilicals, Risers & Flowlines (SURF) Market by Services, 2022-2032 (USD Mn, AGR (%), CAGR(%))(U-Shape Recovery)
Table 269. Americas Oil & Gas Subsea Umbilicals, Risers & Flowlines (SURF) Market by Services, 2022-2032 (USD Mn, AGR (%), CAGR(%))(L-Shape Recovery)
Table 270. Americas Oil & Gas Subsea Umbilicals, Risers & Flowlines (SURF) Market by Water Depth, 2022-2032 (USD Mn, AGR (%), CAGR(%))
Table 271. Americas Oil & Gas Subsea Umbilicals, Risers & Flowlines (SURF) Market by Water Depth, 2022-2032 (USD Mn, AGR (%), CAGR(%))(V-Shape Recovery)
Table 272. Americas Oil & Gas Subsea Umbilicals, Risers & Flowlines (SURF) Market by Water Depth, 2022-2032 (USD Mn, AGR (%), CAGR(%))(W-Shape Recovery)
Table 273. Americas Oil & Gas Subsea Umbilicals, Risers & Flowlines (SURF) Market by Water Depth, 2022-2032 (USD Mn, AGR (%), CAGR(%))(U-Shape Recovery)
Table 274. Americas Oil & Gas Subsea Umbilicals, Risers & Flowlines (SURF) Market by Water Depth, 2022-2032 (USD Mn, AGR (%), CAGR(%))(L-Shape Recovery)
Table 275. Alaska Oil & Gas Subsea Umbilicals, Risers & Flowlines (SURF) Market by Value, 2022-2032 (USD Mn, AGR (%), CAGR(%))
Table 276. Alaska Oil & Gas Subsea Umbilicals, Risers & Flowlines (SURF) Market by Value, 2022-2032 (USD Mn, AGR (%), CAGR(%))(V-Shape Recovery)
Table 277. Alaska Oil & Gas Subsea Umbilicals, Risers & Flowlines (SURF) Market by Value, 2022-2032 (USD Mn, AGR (%), CAGR(%))(W-Shape Recovery)
Table 278. Alaska Oil & Gas Subsea Umbilicals, Risers & Flowlines (SURF) Market by Value, 2022-2032 (USD Mn, AGR (%), CAGR(%))(U-Shape Recovery)
Table 279. Alaska Oil & Gas Subsea Umbilicals, Risers & Flowlines (SURF) Market by Value, 2022-2032 (USD Mn, AGR (%), CAGR(%))(L-Shape Recovery)
Table 280. Canada Oil & Gas Subsea Umbilicals, Risers & Flowlines (SURF) Market by Value, 2022-2032 (USD Mn, AGR (%), CAGR(%))
Table 281. Canada Oil & Gas Subsea Umbilicals, Risers & Flowlines (SURF) Market by Value, 2022-2032 (USD Mn, AGR (%), CAGR(%))(V-Shape Recovery)
Table 282. Canada Oil & Gas Subsea Umbilicals, Risers & Flowlines (SURF) Market by Value, 2022-2032 (USD Mn, AGR (%), CAGR(%))(W-Shape Recovery)
Table 283. Canada Oil & Gas Subsea Umbilicals, Risers & Flowlines (SURF) Market by Value, 2022-2032 (USD Mn, AGR (%), CAGR(%))(U-Shape Recovery)
Table 284. Canada Oil & Gas Subsea Umbilicals, Risers & Flowlines (SURF) Market by Value, 2022-2032 (USD Mn, AGR (%), CAGR(%))(L-Shape Recovery)
Table 285. Trinidad and Tobago Oil & Gas Subsea Umbilicals, Risers & Flowlines (SURF) Market by Value, 2022-2032 (USD Mn, AGR (%), CAGR(%))
Table 286. Trinidad and Tobago Oil & Gas Subsea Umbilicals, Risers & Flowlines (SURF) Market by Value, 2022-2032 (USD Mn, AGR (%), CAGR(%))(V-Shape Recovery)
Table 287. Trinidad and Tobago Oil & Gas Subsea Umbilicals, Risers & Flowlines (SURF) Market by Value, 2022-2032 (USD Mn, AGR (%), CAGR(%))(W-Shape Recovery)
Table 288. Trinidad and Tobago Oil & Gas Subsea Umbilicals, Risers & Flowlines (SURF) Market by Value, 2022-2032 (USD Mn, AGR (%), CAGR(%))(U-Shape Recovery)
Table 289. Trinidad and Tobago Oil & Gas Subsea Umbilicals, Risers & Flowlines (SURF) Market by Value, 2022-2032 (USD Mn, AGR (%), CAGR(%))(L-Shape Recovery)
Table 290. Brazil Oil & Gas Subsea Umbilicals, Risers & Flowlines (SURF) Market by Value, 2022-2032 (USD Mn, AGR (%), CAGR(%))
Table 291. Brazil Oil & Gas Subsea Umbilicals, Risers & Flowlines (SURF) Market by Value, 2022-2032 (USD Mn, AGR (%), CAGR(%))(V-Shape Recovery)
Table 292. Brazil Oil & Gas Subsea Umbilicals, Risers & Flowlines (SURF) Market by Value, 2022-2032 (USD Mn, AGR (%), CAGR(%))(W-Shape Recovery)
Table 293. Brazil Oil & Gas Subsea Umbilicals, Risers & Flowlines (SURF) Market by Value, 2022-2032 (USD Mn, AGR (%), CAGR(%))(U-Shape Recovery)
Table 294. Brazil Oil & Gas Subsea Umbilicals, Risers & Flowlines (SURF) Market by Value, 2022-2032 (USD Mn, AGR (%), CAGR(%))(L-Shape Recovery)
Table 295. Rest of Americas Oil & Gas Subsea Umbilicals, Risers & Flowlines (SURF) Market by Value, 2022-2032 (USD Mn, AGR (%), CAGR(%))
Table 296. Rest of Americas Oil & Gas Subsea Umbilicals, Risers & Flowlines (SURF) Market by Value, 2022-2032 (USD Mn, AGR (%), CAGR(%))(V-Shape Recovery)
Table 297. Rest of Americas Oil & Gas Subsea Umbilicals, Risers & Flowlines (SURF) Market by Value, 2022-2032 (USD Mn, AGR (%), CAGR(%))(W-Shape Recovery)
Table 298. Rest of Americas Oil & Gas Subsea Umbilicals, Risers & Flowlines (SURF) Market by Value, 2022-2032 (USD Mn, AGR (%), CAGR(%))(U-Shape Recovery)
Table 299. Rest of Americas Oil & Gas Subsea Umbilicals, Risers & Flowlines (SURF) Market by Value, 2022-2032 (USD Mn, AGR (%), CAGR(%))(L-Shape Recovery)
Table 300. Europe Oil & Gas Subsea Umbilicals, Risers & Flowlines (SURF) Market by Value, 2022-2032 (USD Mn, AGR (%), CAGR(%))
Table 301. Europe Oil & Gas Subsea Umbilicals, Risers & Flowlines (SURF) Market by Value, 2022-2032 (USD Mn, AGR (%), CAGR(%))(V-Shape Recovery)
Table 302. Europe Oil & Gas Subsea Umbilicals, Risers & Flowlines (SURF) Market by Value, 2022-2032 (USD Mn, AGR (%), CAGR(%))(W-Shape Recovery)
Table 303. Europe Oil & Gas Subsea Umbilicals, Risers & Flowlines (SURF) Market by Value, 2022-2032 (USD Mn, AGR (%), CAGR(%))(U-Shape Recovery)
Table 304. Europe Oil & Gas Subsea Umbilicals, Risers & Flowlines (SURF) Market by Value, 2022-2032 (USD Mn, AGR (%), CAGR(%))(L-Shape Recovery)
Table 305. Europe Oil & Gas Subsea Umbilicals, Risers & Flowlines (SURF) Market by Country, 2022-2032 (USD Mn, AGR (%), CAGR(%))
Table 306. Europe Oil & Gas Subsea Umbilicals, Risers & Flowlines (SURF) Market by Country, 2022-2032 (USD Mn, AGR (%), CAGR(%))
Table 307. Europe Oil & Gas Subsea Umbilicals, Risers & Flowlines (SURF) Market by Country, 2022-2032 (USD Mn, AGR (%), CAGR(%))
Table 308. Europe Oil & Gas Subsea Umbilicals, Risers & Flowlines (SURF) Market by Country, 2022-2032 (USD Mn, AGR (%), CAGR(%))
Table 309. Europe Oil & Gas Subsea Umbilicals, Risers & Flowlines (SURF) Market by Country, 2022-2032 (USD Mn, AGR (%), CAGR(%))
Table 310. Europe Oil & Gas Subsea Umbilicals, Risers & Flowlines (SURF) Market by Risers, 2022-2032 (USD Mn, AGR (%), CAGR(%))
Table 311. Europe Oil & Gas Subsea Umbilicals, Risers & Flowlines (SURF) Market by Risers, 2022-2032 (USD Mn, AGR (%), CAGR(%))(V-Shape Recovery)
Table 312. Europe Oil & Gas Subsea Umbilicals, Risers & Flowlines (SURF) Market by Risers, 2022-2032 (USD Mn, AGR (%), CAGR(%))(W-Shape Recovery)
Table 313. Europe Oil & Gas Subsea Umbilicals, Risers & Flowlines (SURF) Market by Risers, 2022-2032 (USD Mn, AGR (%), CAGR(%))(U-Shape Recovery)
Table 314. Europe Oil & Gas Subsea Umbilicals, Risers & Flowlines (SURF) Market by Risers, 2022-2032 (USD Mn, AGR (%), CAGR(%))(L-Shape Recovery)
Table 315. Europe Oil & Gas Subsea Umbilicals, Risers & Flowlines (SURF) Market by Product, 2022-2032 (USD Mn, AGR (%), CAGR(%))
Table 316. Europe Oil & Gas Subsea Umbilicals, Risers & Flowlines (SURF) Market by Product, 2022-2032 (USD Mn, AGR (%), CAGR(%))(V-Shape Recovery)
Table 317. Europe Oil & Gas Subsea Umbilicals, Risers & Flowlines (SURF) Market by Product, 2022-2032 (USD Mn, AGR (%), CAGR(%))(W-Shape Recovery)
Table 318. Europe Oil & Gas Subsea Umbilicals, Risers & Flowlines (SURF) Market by Product, 2022-2032 (USD Mn, AGR (%), CAGR(%))(U-Shape Recovery)
Table 319. Europe Oil & Gas Subsea Umbilicals, Risers & Flowlines (SURF) Market by Product, 2022-2032 (USD Mn, AGR (%), CAGR(%))(L-Shape Recovery)
Table 320. Europe Oil & Gas Subsea Umbilicals, Risers & Flowlines (SURF) Market by Services, 2022-2032 (USD Mn, AGR (%), CAGR(%))
Table 321. Europe Oil & Gas Subsea Umbilicals, Risers & Flowlines (SURF) Market by Services, 2022-2032 (USD Mn, AGR (%), CAGR(%))(V-Shape Recovery)
Table 322. Europe Oil & Gas Subsea Umbilicals, Risers & Flowlines (SURF) Market by Services, 2022-2032 (USD Mn, AGR (%), CAGR(%))(W-Shape Recovery)
Table 323. Europe Oil & Gas Subsea Umbilicals, Risers & Flowlines (SURF) Market by Services, 2022-2032 (USD Mn, AGR (%), CAGR(%))(U-Shape Recovery)
Table 324. Europe Oil & Gas Subsea Umbilicals, Risers & Flowlines (SURF) Market by Services, 2022-2032 (USD Mn, AGR (%), CAGR(%))(L-Shape Recovery)
Table 325. Europe Oil & Gas Subsea Umbilicals, Risers & Flowlines (SURF) Market by Water Depth, 2022-2032 (USD Mn, AGR (%), CAGR(%))
Table 326. Europe Oil & Gas Subsea Umbilicals, Risers & Flowlines (SURF) Market by Water Depth, 2022-2032 (USD Mn, AGR (%), CAGR(%))(V-Shape Recovery)
Table 327. Europe Oil & Gas Subsea Umbilicals, Risers & Flowlines (SURF) Market by Water Depth, 2022-2032 (USD Mn, AGR (%), CAGR(%))(W-Shape Recovery)
Table 328. Europe Oil & Gas Subsea Umbilicals, Risers & Flowlines (SURF) Market by Water Depth, 2022-2032 (USD Mn, AGR (%), CAGR(%))(U-Shape Recovery)
Table 329. Europe Oil & Gas Subsea Umbilicals, Risers & Flowlines (SURF) Market by Water Depth, 2022-2032 (USD Mn, AGR (%), CAGR(%))(L-Shape Recovery)
Table 330. Denmark Oil & Gas Subsea Umbilicals, Risers & Flowlines (SURF) Market by Value, 2022-2032 (USD Mn, AGR (%), CAGR(%))
Table 331. Denmark Oil & Gas Subsea Umbilicals, Risers & Flowlines (SURF) Market by Value, 2022-2032 (USD Mn, AGR (%), CAGR(%))(V-Shape Recovery)
Table 332. Denmark Oil & Gas Subsea Umbilicals, Risers & Flowlines (SURF) Market by Value, 2022-2032 (USD Mn, AGR (%), CAGR(%))(W-Shape Recovery)
Table 333. Denmark Oil & Gas Subsea Umbilicals, Risers & Flowlines (SURF) Market by Value, 2022-2032 (USD Mn, AGR (%), CAGR(%))(U-Shape Recovery)
Table 334. Denmark Oil & Gas Subsea Umbilicals, Risers & Flowlines (SURF) Market by Value, 2022-2032 (USD Mn, AGR (%), CAGR(%))(L-Shape Recovery)
Table 335. Ireland Oil & Gas Subsea Umbilicals, Risers & Flowlines (SURF) Market by Value, 2022-2032 (USD Mn, AGR (%), CAGR(%))
Table 336. Ireland Oil & Gas Subsea Umbilicals, Risers & Flowlines (SURF) Market by Value, 2022-2032 (USD Mn, AGR (%), CAGR(%))(V-Shape Recovery)
Table 337. Ireland Oil & Gas Subsea Umbilicals, Risers & Flowlines (SURF) Market by Value, 2022-2032 (USD Mn, AGR (%), CAGR(%))(W-Shape Recovery)
Table 338. Ireland Oil & Gas Subsea Umbilicals, Risers & Flowlines (SURF) Market by Value, 2022-2032 (USD Mn, AGR (%), CAGR(%))(U-Shape Recovery)
Table 339. Ireland Oil & Gas Subsea Umbilicals, Risers & Flowlines (SURF) Market by Value, 2022-2032 (USD Mn, AGR (%), CAGR(%))(L-Shape Recovery)
Table 340. Mediterranean Sea Oil & Gas Subsea Umbilicals, Risers & Flowlines (SURF) Market by Value, 2022-2032 (USD Mn, AGR (%), CAGR(%))
Table 341. Mediterranean Sea Oil & Gas Subsea Umbilicals, Risers & Flowlines (SURF) Market by Value, 2022-2032 (USD Mn, AGR (%), CAGR(%))(V-Shape Recovery)
Table 342. Mediterranean Sea Oil & Gas Subsea Umbilicals, Risers & Flowlines (SURF) Market by Value, 2022-2032 (USD Mn, AGR (%), CAGR(%))(W-Shape Recovery)
Table 343. Mediterranean Sea Oil & Gas Subsea Umbilicals, Risers & Flowlines (SURF) Market by Value, 2022-2032 (USD Mn, AGR (%), CAGR(%))(U-Shape Recovery)
Table 344. Mediterranean Sea Oil & Gas Subsea Umbilicals, Risers & Flowlines (SURF) Market by Value, 2022-2032 (USD Mn, AGR (%), CAGR(%))(L-Shape Recovery)
Table 345. Netherlands Oil & Gas Subsea Umbilicals, Risers & Flowlines (SURF) Market by Value, 2022-2032 (USD Mn, AGR (%), CAGR(%))
Table 346. Netherlands Oil & Gas Subsea Umbilicals, Risers & Flowlines (SURF) Market by Value, 2022-2032 (USD Mn, AGR (%), CAGR(%))(V-Shape Recovery)
Table 347. Netherlands Oil & Gas Subsea Umbilicals, Risers & Flowlines (SURF) Market by Value, 2022-2032 (USD Mn, AGR (%), CAGR(%))(W-Shape Recovery)
Table 348. Netherlands Oil & Gas Subsea Umbilicals, Risers & Flowlines (SURF) Market by Value, 2022-2032 (USD Mn, AGR (%), CAGR(%))(U-Shape Recovery)
Table 349. Netherlands Oil & Gas Subsea Umbilicals, Risers & Flowlines (SURF) Market by Value, 2022-2032 (USD Mn, AGR (%), CAGR(%))(L-Shape Recovery)
Table 350. Rest of Europe Oil & Gas Subsea Umbilicals, Risers & Flowlines (SURF) Market by Value, 2022-2032 (USD Mn, AGR (%), CAGR(%))
Table 351. Rest of Europe Oil & Gas Subsea Umbilicals, Risers & Flowlines (SURF) Market by Value, 2022-2032 (USD Mn, AGR (%), CAGR(%))(V-Shape Recovery)
Table 352. Rest of Europe Oil & Gas Subsea Umbilicals, Risers & Flowlines (SURF) Market by Value, 2022-2032 (USD Mn, AGR (%), CAGR(%))(W-Shape Recovery)
Table 353. Rest of Europe Oil & Gas Subsea Umbilicals, Risers & Flowlines (SURF) Market by Value, 2022-2032 (USD Mn, AGR (%), CAGR(%))(U-Shape Recovery)
Table 354. Rest of Europe Oil & Gas Subsea Umbilicals, Risers & Flowlines (SURF) Market by Value, 2022-2032 (USD Mn, AGR (%), CAGR(%))(L-Shape Recovery)
Table 355. TechnipFMC Plc: Company Information
Table 356. TechnipFMC Plc: Company Revenue 2016-2020 (US$Mn, AGR %)
Table 357. TechnipFMC Plc: Company Product and Service Benchmarking
Table 358. TechnipFMC Plc: Company Recent Developments till Feb,2021
Table 359. Saipem SpA: Company Information
Table 360. Saipem SpA: Company Revenue 2016-2020 (US$Mn, AGR %)
Table 361. Saipem SpA: Company Product and Service Benchmarking
Table 362. Saipem SpA: Company Recent Developments
Table 363. Subsea 7: Company Information
Table 364. Subsea 7: Company Revenue 2016-2020 (US$Mn, AGR %)
Table 365. Subsea 7: Company Product and Service Benchmarking
Table 366. Subsea 7: Company Recent Developments
Table 367. Aker Solutions: Company Information
Table 368. Aker Solutions: Company Revenue 2016-2020 (US$Mn, AGR %)
Table 369. Aker Solutions: Company Product and Service Benchmarking
Table 370. Aker Solutions: Company Recent Developments
Table 371. Siemens AG: Company Information
Table 372. Siemens AG: Company Revenue 2016-2020 (US$Mn, AGR %)
Table 373. Siemens AG: Company Product and Service Benchmarking
Table 374. Siemens AG: Company Recent Developments till Feb,2021
Table 375. Kongsberg Gruppen Asa: Company Information
Table 376. Kongsberg Gruppen Asa: Company Revenue 2016-2020 (US$Mn, AGR %)
Table 377. Kongsberg Gruppen Asa: Company Product and Service Benchmarking
Table 378. Kongsberg Gruppen Asa: Company Recent Developments till Feb,2021
Table 379. Abb Group: Company Information
Table 380. Abb Group: Company Revenue 2016-2020 (US$Mn, AGR %)
Table 381. Abb Group: Company Recent Developments till Feb,2021
Table 382. General Electric Company: Company Information
Table 383. General Electric Company: Company Revenue 2016-2020 (US$Mn, AGR %)
Table 384. General Electric Company: Company Recent Developments till Feb,2021
Table 385. Parker Hannifin: Company Information
Table 386. Parker Hannifin: Company Revenue 2016-2020 (US$Mn, AGR %)
Table 387. Parker Hannifin: Company Product and Service Benchmarking
Table 388. Parker Hannifin: Company Recent Developments till Feb,2021
Table 389. Oceaneering International, Inc.: Company Information
Table 390. Oceaneering International, Inc.: Company Revenue 2016-2020 (US$Mn, AGR %)
Table 391. Oceaneering International, Inc.: Company Product and Service Benchmarking
Table 392. Oceaneering International, Inc.: Company Recent Developments till Feb,2021
Table 393. Nexans SA: Company Information
Table 394. Nexans SA: Company Revenue 2016-2020 (US$Mn, AGR %)
Table 395. Nexans SA: Company Product and Service Benchmarking
Table 396. Nexans SA: Company Recent Developments till Feb,2021
Table 397. Prysmian S.p.A.: Company Information
Table 398. Prysmian S.p.A.: Company Revenue 2016-2020 (US$Mn, AGR %)
Table 399. Prysmian S.p.A.: Company Product and Service Benchmarking
Table 400. Prysmian S.p.A.: Company Recent Developments till Feb,2021
Table 401. National Oilwell Varco, Inc.: Company Information
Table 402. National Oilwell Varco, Inc.: Company Revenue 2016-2020 (US$Mn, AGR %)
Table 403. National Oilwell Varco, Inc.: Company Product and Service Benchmarking
Table 404. National Oilwell Varco, Inc.: Company Recent Developments till Feb,2021
Table 405. Vallourec: Company Information
Table 406. Vallourec: Company Revenue 2016-2020 (US$Mn, AGR %)
Table 407. Vallourec: Company Product and Service Benchmarking
Table 408. Dril-Quip, Inc: Company Information
Table 409. Dril-Quip, Inc: Company Revenue 2016-2020 (US$Mn, AGR %)
Table 410. Dril-Quip, Inc: Company Product and Service Benchmarking
Table 411. Baker Hughes: Company Information
Table 412. Baker Hughes: Company Product and Service Benchmarking
Table 413. Baker Hughes: Company Recent Developments till Feb,2021
Table 414. McDermott International, Inc. : Company Information
Table 415. McDermott International, Inc. : Company Product and Service Benchmarking
Table 416. McDermott International, Inc. : Company Recent Developments till Feb,2021
Table 417. Cameron International Corporation: Company Information
Table 418. Cameron International Corporation: Company Product and Service Benchmarking
Table 419. Cameron International Corporation: Company Recent Developments till Feb,2021
Table 420. Airborne Oil & Gas B.V: Company Information
Table 421. Airborne Oil & Gas B.V: Company Product and Service Benchmarking
Table 422. Airborne Oil & Gas B.V: Company Recent Developments till Feb,2021
Table 423. Orient Cable: Company Information
Table 424. Orient Cable: Company Product and Service Benchmarking
List of Figures
Figure 1. Global Oil & Gas Subsea Umbilicals, Risers & Flowlines (SURF) Market Forecast, 2022-2032 (USD Mn, AGR (%))
Figure 2. Global Oil & Gas Subsea Umbilicals, Risers & Flowlines (SURF) Market Segmentation
Figure 3. Global Oil & Gas Subsea Umbilicals, Risers & Flowlines (SURF) Market Trends :
Figure 4. Porters Five Forces
Figure 5. Global Oil & Gas Subsea Umbilicals, Risers & Flowlines (SURF) Market Forecast, 2022-2032 (USD Mn, AGR (%))
Figure 6. Global Oil & Gas Subsea Umbilicals, Risers & Flowlines (SURF) Market Forecast, 2022-2032 (USD Mn, AGR (%))(V-Shape Recovery)
Figure 7. Global Oil & Gas Subsea Umbilicals, Risers & Flowlines (SURF) Market Forecast, 2022-2032 (USD Mn, AGR (%))(W-Shape Recovery)
Figure 8. Global Oil & Gas Subsea Umbilicals, Risers & Flowlines (SURF) Market Forecast, 2022-2032 (USD Mn, AGR (%))(U-Shape Recovery)
Figure 9. Global Oil & Gas Subsea Umbilicals, Risers & Flowlines (SURF) Market Forecast, 2022-2032 (USD Mn, AGR (%))(L-Shape Recovery)
Figure 10. Global Oil & Gas Subsea Umbilicals, Risers & Flowlines (SURF) Market Share Forecast by Region 2022, 2027, 2032(%)
Figure 11. Global Oil & Gas Subsea Umbilicals, Risers & Flowlines (SURF) Market by Region, 2022-2032 (USD Mn, AGR (%))
Figure 12. Global Oil & Gas Subsea Umbilicals, Risers & Flowlines (SURF) Market by Region, 2022-2032 (USD Mn, AGR (%))(V-Shape Recovery)
Figure 13. Global Oil & Gas Subsea Umbilicals, Risers & Flowlines (SURF) Market by Region, 2022-2032 (USD Mn, AGR (%))(W-Shape Recovery)
Figure 14. Global Oil & Gas Subsea Umbilicals, Risers & Flowlines (SURF) Market by Region, 2022-2032 (USD Mn, AGR (%))(U-Shape Recovery)
Figure 15. Global Oil & Gas Subsea Umbilicals, Risers & Flowlines (SURF) Market by Region, 2022-2032 (USD Mn, AGR (%))(L-Shape Recovery)
Figure 16. Global Oil & Gas Subsea Umbilicals, Risers & Flowlines (SURF) Market Share Forecast by Risers 2022, 2027, 2032(%)
Figure 17. Global Oil & Gas Subsea Umbilicals, Risers & Flowlines (SURF) Market by Risers, 2022-2032 (USD Mn, AGR (%))
Figure 18. Global Oil & Gas Subsea Umbilicals, Risers & Flowlines (SURF) Market by Risers, 2022-2032 (USD Mn, AGR (%))(V-Shape Recovery)
Figure 19. Global Oil & Gas Subsea Umbilicals, Risers & Flowlines (SURF) Market by Risers, 2022-2032 (USD Mn, AGR (%))(W-Shape Recovery)
Figure 20. Global Oil & Gas Subsea Umbilicals, Risers & Flowlines (SURF) Market by Risers, 2022-2032 (USD Mn, AGR (%))(U-Shape Recovery)
Figure 21. Global Oil & Gas Subsea Umbilicals, Risers & Flowlines (SURF) Market by Risers, 2022-2032 (USD Mn, AGR (%))(L-Shape Recovery)
Figure 22. Global Oil & Gas Subsea Umbilicals, Risers & Flowlines (SURF) Market Share Forecast by Type 2022, 2027, 2032(%)
Figure 23. Global Oil & Gas Subsea Umbilicals, Risers & Flowlines (SURF) Market by Product, 2022-2032 (USD Mn, AGR (%))
Figure 24. Global Oil & Gas Subsea Umbilicals, Risers & Flowlines (SURF) Market by Product, 2022-2032 (USD Mn, AGR (%))(V-Shape Recovery)
Figure 25. Global Oil & Gas Subsea Umbilicals, Risers & Flowlines (SURF) Market by Product, 2022-2032 (USD Mn, AGR (%))(W-Shape Recovery)
Figure 26. Global Oil & Gas Subsea Umbilicals, Risers & Flowlines (SURF) Market by Product, 2022-2032 (USD Mn, AGR (%))(U-Shape Recovery)
Figure 27. Global Oil & Gas Subsea Umbilicals, Risers & Flowlines (SURF) Market by Product, 2022-2032 (USD Mn, AGR (%))(L-Shape Recovery)
Figure 28. Global Oil & Gas Subsea Umbilicals, Risers & Flowlines (SURF) Market Share Forecast by Services 2022, 2027, 2032(%)
Figure 29. Global Oil & Gas Subsea Umbilicals, Risers & Flowlines (SURF) Market by Services, 2022-2032 (USD Mn, AGR (%))
Figure 30. Global Oil & Gas Subsea Umbilicals, Risers & Flowlines (SURF) Market by Services, 2022-2032 (USD Mn, AGR (%))(V-Shape Recovery)
Figure 31. Global Oil & Gas Subsea Umbilicals, Risers & Flowlines (SURF) Market by Services, 2022-2032 (USD Mn, AGR (%))(W-Shape Recovery)
Figure 32. Global Oil & Gas Subsea Umbilicals, Risers & Flowlines (SURF) Market by Services, 2022-2032 (USD Mn, AGR (%))(U-Shape Recovery)
Figure 33. Global Oil & Gas Subsea Umbilicals, Risers & Flowlines (SURF) Market by Services, 2022-2032 (USD Mn, AGR (%))(L-Shape Recovery)
Figure 34. Global Oil & Gas Subsea Umbilicals, Risers & Flowlines (SURF) Market Share Forecast by Water Depth 2022, 2027, 2032(%)
Figure 35. Global Oil & Gas Subsea Umbilicals, Risers & Flowlines (SURF) Market by Water Depth, 2022-2032 (USD Mn, AGR (%))
Figure 36. Global Oil & Gas Subsea Umbilicals, Risers & Flowlines (SURF) Market by Water Depth, 2022-2032 (USD Mn, AGR (%))(V-Shape Recovery)
Figure 37. Global Oil & Gas Subsea Umbilicals, Risers & Flowlines (SURF) Market by Water Depth, 2022-2032 (USD Mn, AGR (%))(W-Shape Recovery)
Figure 38. Global Oil & Gas Subsea Umbilicals, Risers & Flowlines (SURF) Market by Water Depth, 2022-2032 (USD Mn, AGR (%))(U-Shape Recovery)
Figure 39. Global Oil & Gas Subsea Umbilicals, Risers & Flowlines (SURF) Market by Water Depth, 2022-2032 (USD Mn, AGR (%))(L-Shape Recovery)
Figure 40. Africa Oil & Gas Subsea Umbilicals, Risers & Flowlines (SURF) Market by Value, 2022-2032 (USD Mn, AGR (%))
Figure 41. Africa Oil & Gas Subsea Umbilicals, Risers & Flowlines (SURF) Market by Value, 2022-2032 (USD Mn, AGR (%))(V-Shape Recovery)
Figure 42. Africa Oil & Gas Subsea Umbilicals, Risers & Flowlines (SURF) Market by Value, 2022-2032 (USD Mn, AGR (%))(W-Shape Recovery)
Figure 43. Africa Oil & Gas Subsea Umbilicals, Risers & Flowlines (SURF) Market by Value, 2022-2032 (USD Mn, AGR (%))(U-Shape Recovery)
Figure 44. Africa Oil & Gas Subsea Umbilicals, Risers & Flowlines (SURF) Market by Value, 2022-2032 (USD Mn, AGR (%))(L-Shape Recovery)
Figure 45. Africa Oil & Gas Subsea Umbilicals, Risers & Flowlines (SURF) Market by Country, 2022-2032 (USD Mn, AGR (%))
Figure 46. Africa Oil & Gas Subsea Umbilicals, Risers & Flowlines (SURF) Market by Country, 2022-2032 (USD Mn, AGR (%))(V-Shape Recovery)
Figure 47. Africa Oil & Gas Subsea Umbilicals, Risers & Flowlines (SURF) Market by Country, 2022-2032 (USD Mn, AGR (%))(W-Shape Recovery)
Figure 48. Africa Oil & Gas Subsea Umbilicals, Risers & Flowlines (SURF) Market by Country, 2022-2032 (USD Mn, AGR (%))(U-Shape Recovery)
Figure 49. Africa Oil & Gas Subsea Umbilicals, Risers & Flowlines (SURF) Market by Country, 2022-2032 (USD Mn, AGR (%))(L-Shape Recovery)
Figure 50. Africa Oil & Gas Subsea Umbilicals, Risers & Flowlines (SURF) Market by Risers, 2022-2032 (USD Mn, AGR (%))
Figure 51. Africa Oil & Gas Subsea Umbilicals, Risers & Flowlines (SURF) Market by Risers, 2022-2032 (USD Mn, AGR (%))(V-Shape Recovery)
Figure 52. Africa Oil & Gas Subsea Umbilicals, Risers & Flowlines (SURF) Market by Risers, 2022-2032 (USD Mn, AGR (%))(W-Shape Recovery)
Figure 53. Africa Oil & Gas Subsea Umbilicals, Risers & Flowlines (SURF) Market by Risers, 2022-2032 (USD Mn, AGR (%))(U-Shape Recovery)
Figure 54. Africa Oil & Gas Subsea Umbilicals, Risers & Flowlines (SURF) Market by Risers, 2022-2032 (USD Mn, AGR (%))(L-Shape Recovery)
Figure 55. Africa Oil & Gas Subsea Umbilicals, Risers & Flowlines (SURF) Market by Product, 2022-2032 (USD Mn, AGR (%))
Figure 56. Africa Oil & Gas Subsea Umbilicals, Risers & Flowlines (SURF) Market by Product, 2022-2032 (USD Mn, AGR (%))(V-Shape Recovery)
Figure 57. Africa Oil & Gas Subsea Umbilicals, Risers & Flowlines (SURF) Market by Product, 2022-2032 (USD Mn, AGR (%))(W-Shape Recovery)
Figure 58. Africa Oil & Gas Subsea Umbilicals, Risers & Flowlines (SURF) Market by Product, 2022-2032 (USD Mn, AGR (%))(U-Shape Recovery)
Figure 59. Africa Oil & Gas Subsea Umbilicals, Risers & Flowlines (SURF) Market by Product, 2022-2032 (USD Mn, AGR (%))(L-Shape Recovery)
Figure 60. Africa Oil & Gas Subsea Umbilicals, Risers & Flowlines (SURF) Market by Services, 2022-2032 (USD Mn, AGR (%))
Figure 61. Africa Oil & Gas Subsea Umbilicals, Risers & Flowlines (SURF) Market by Services, 2022-2032 (USD Mn, AGR (%))(V-Shape Recovery)
Figure 62. Africa Oil & Gas Subsea Umbilicals, Risers & Flowlines (SURF) Market by Services, 2022-2032 (USD Mn, AGR (%))(W-Shape Recovery)
Figure 63. Africa Oil & Gas Subsea Umbilicals, Risers & Flowlines (SURF) Market by Services, 2022-2032 (USD Mn, AGR (%))(U-Shape Recovery)
Figure 64. Africa Oil & Gas Subsea Umbilicals, Risers & Flowlines (SURF) Market by Services, 2022-2032 (USD Mn, AGR (%))(L-Shape Recovery)
Figure 65. Africa Oil & Gas Subsea Umbilicals, Risers & Flowlines (SURF) Market by Water Depth, 2022-2032 (USD Mn, AGR (%))
Figure 66. Africa Oil & Gas Subsea Umbilicals, Risers & Flowlines (SURF) Market by Water Depth, 2022-2032 (USD Mn, AGR (%))(V-Shape Recovery)
Figure 67. Africa Oil & Gas Subsea Umbilicals, Risers & Flowlines (SURF) Market by Water Depth, 2022-2032 (USD Mn, AGR (%))(W-Shape Recovery)
Figure 68. Africa Oil & Gas Subsea Umbilicals, Risers & Flowlines (SURF) Market by Water Depth, 2022-2032 (USD Mn, AGR (%))(U-Shape Recovery)
Figure 69. Africa Oil & Gas Subsea Umbilicals, Risers & Flowlines (SURF) Market by Water Depth, 2022-2032 (USD Mn, AGR (%))(L-Shape Recovery)
Figure 70. Angola Oil & Gas Subsea Umbilicals, Risers & Flowlines (SURF) Market by Value, 2022-2032 (USD Mn, AGR (%))
Figure 71. Angola Oil & Gas Subsea Umbilicals, Risers & Flowlines (SURF) Market by Value, 2022-2032 (USD Mn, AGR (%))(V-Shape Recovery)
Figure 72. Angola Oil & Gas Subsea Umbilicals, Risers & Flowlines (SURF) Market by Value, 2022-2032 (USD Mn, AGR (%))(W-Shape Recovery)
Figure 73. Angola Oil & Gas Subsea Umbilicals, Risers & Flowlines (SURF) Market by Value, 2022-2032 (USD Mn, AGR (%))(U-Shape Recovery)
Figure 74. Angola Oil & Gas Subsea Umbilicals, Risers & Flowlines (SURF) Market by Value, 2022-2032 (USD Mn, AGR (%))(L-Shape Recovery)
Figure 75. Cameroon Oil & Gas Subsea Umbilicals, Risers & Flowlines (SURF) Market by Value, 2022-2032 (USD Mn, AGR (%))
Figure 76. Cameroon Oil & Gas Subsea Umbilicals, Risers & Flowlines (SURF) Market by Value, 2022-2032 (USD Mn, AGR (%))(V-Shape Recovery)
Figure 77. Cameroon Oil & Gas Subsea Umbilicals, Risers & Flowlines (SURF) Market by Value, 2022-2032 (USD Mn, AGR (%))(W-Shape Recovery)
Figure 78. Cameroon Oil & Gas Subsea Umbilicals, Risers & Flowlines (SURF) Market by Value, 2022-2032 (USD Mn, AGR (%))(U-Shape Recovery)
Figure 79. Cameroon Oil & Gas Subsea Umbilicals, Risers & Flowlines (SURF) Market by Value, 2022-2032 (USD Mn, AGR (%))(L-Shape Recovery)
Figure 80. Congo-Brazzaville Oil & Gas Subsea Umbilicals, Risers & Flowlines (SURF) Market by Value, 2022-2032 (USD Mn, AGR (%))
Figure 81. Congo-Brazzaville Oil & Gas Subsea Umbilicals, Risers & Flowlines (SURF) Market by Value, 2022-2032 (USD Mn, AGR (%))(V-Shape Recovery)
Figure 82. Congo-Brazzaville Oil & Gas Subsea Umbilicals, Risers & Flowlines (SURF) Market by Value, 2022-2032 (USD Mn, AGR (%))(W-Shape Recovery)
Figure 83. Congo-Brazzaville Oil & Gas Subsea Umbilicals, Risers & Flowlines (SURF) Market by Value, 2022-2032 (USD Mn, AGR (%))(U-Shape Recovery)
Figure 84. Congo-Brazzaville Oil & Gas Subsea Umbilicals, Risers & Flowlines (SURF) Market by Value, 2022-2032 (USD Mn, AGR (%))(L-Shape Recovery)
Figure 85. Egypt Oil & Gas Subsea Umbilicals, Risers & Flowlines (SURF) Market by Value, 2022-2032 (USD Mn, AGR (%))
Figure 86. Egypt Oil & Gas Subsea Umbilicals, Risers & Flowlines (SURF) Market by Value, 2022-2032 (USD Mn, AGR (%))(V-Shape Recovery)
Figure 87. Egypt Oil & Gas Subsea Umbilicals, Risers & Flowlines (SURF) Market by Value, 2022-2032 (USD Mn, AGR (%))(W-Shape Recovery)
Figure 88. Egypt Oil & Gas Subsea Umbilicals, Risers & Flowlines (SURF) Market by Value, 2022-2032 (USD Mn, AGR (%))(U-Shape Recovery)
Figure 89. Egypt Oil & Gas Subsea Umbilicals, Risers & Flowlines (SURF) Market by Value, 2022-2032 (USD Mn, AGR (%))(L-Shape Recovery)
Figure 90. Equatorial Guinea Oil & Gas Subsea Umbilicals, Risers & Flowlines (SURF) Market by Value, 2022-2032 (USD Mn, AGR (%))
Figure 91. Equatorial Guinea Oil & Gas Subsea Umbilicals, Risers & Flowlines (SURF) Market by Value, 2022-2032 (USD Mn, AGR (%))(V-Shape Recovery)
Figure 92. Equatorial Guinea Oil & Gas Subsea Umbilicals, Risers & Flowlines (SURF) Market by Value, 2022-2032 (USD Mn, AGR (%))(W-Shape Recovery)
Figure 93. Equatorial Guinea Oil & Gas Subsea Umbilicals, Risers & Flowlines (SURF) Market by Value, 2022-2032 (USD Mn, AGR (%))(U-Shape Recovery)
Figure 94. Equatorial Guinea Oil & Gas Subsea Umbilicals, Risers & Flowlines (SURF) Market by Value, 2022-2032 (USD Mn, AGR (%))(L-Shape Recovery)
Figure 95. Gabon Oil & Gas Subsea Umbilicals, Risers & Flowlines (SURF) Market by Value, 2022-2032 (USD Mn, AGR (%))
Figure 96. Gabon Oil & Gas Subsea Umbilicals, Risers & Flowlines (SURF) Market by Value, 2022-2032 (USD Mn, AGR (%))(V-Shape Recovery)
Figure 97. Gabon Oil & Gas Subsea Umbilicals, Risers & Flowlines (SURF) Market by Value, 2022-2032 (USD Mn, AGR (%))(W-Shape Recovery)
Figure 98. Gabon Oil & Gas Subsea Umbilicals, Risers & Flowlines (SURF) Market by Value, 2022-2032 (USD Mn, AGR (%))(U-Shape Recovery)
Figure 99. Gabon Oil & Gas Subsea Umbilicals, Risers & Flowlines (SURF) Market by Value, 2022-2032 (USD Mn, AGR (%))(L-Shape Recovery)
Figure 100. Ghana Oil & Gas Subsea Umbilicals, Risers & Flowlines (SURF) Market by Value, 2022-2032 (USD Mn, AGR (%))
Figure 101. Ghana Oil & Gas Subsea Umbilicals, Risers & Flowlines (SURF) Market by Value, 2022-2032 (USD Mn, AGR (%))(V-Shape Recovery)
Figure 102. Ghana Oil & Gas Subsea Umbilicals, Risers & Flowlines (SURF) Market by Value, 2022-2032 (USD Mn, AGR (%))(W-Shape Recovery)
Figure 103. Ghana Oil & Gas Subsea Umbilicals, Risers & Flowlines (SURF) Market by Value, 2022-2032 (USD Mn, AGR (%))(U-Shape Recovery)
Figure 104. Ghana Oil & Gas Subsea Umbilicals, Risers & Flowlines (SURF) Market by Value, 2022-2032 (USD Mn, AGR (%))(L-Shape Recovery)
Figure 105. Mozambique Oil & Gas Subsea Umbilicals, Risers & Flowlines (SURF) Market by Value, 2022-2032 (USD Mn, AGR (%))
Figure 106. Mozambique Oil & Gas Subsea Umbilicals, Risers & Flowlines (SURF) Market by Value, 2022-2032 (USD Mn, AGR (%))(V-Shape Recovery)
Figure 107. Mozambique Oil & Gas Subsea Umbilicals, Risers & Flowlines (SURF) Market by Value, 2022-2032 (USD Mn, AGR (%))(W-Shape Recovery)
Figure 108. Mozambique Oil & Gas Subsea Umbilicals, Risers & Flowlines (SURF) Market by Value, 2022-2032 (USD Mn, AGR (%))(U-Shape Recovery)
Figure 109. Mozambique Oil & Gas Subsea Umbilicals, Risers & Flowlines (SURF) Market by Value, 2022-2032 (USD Mn, AGR (%))(L-Shape Recovery)
Figure 110. Namibia Oil & Gas Subsea Umbilicals, Risers & Flowlines (SURF) Market by Value, 2022-2032 (USD Mn, AGR (%))
Figure 111. Namibia Oil & Gas Subsea Umbilicals, Risers & Flowlines (SURF) Market by Value, 2022-2032 (USD Mn, AGR (%))(V-Shape Recovery)
Figure 112. Namibia Oil & Gas Subsea Umbilicals, Risers & Flowlines (SURF) Market by Value, 2022-2032 (USD Mn, AGR (%))(W-Shape Recovery)
Figure 113. Namibia Oil & Gas Subsea Umbilicals, Risers & Flowlines (SURF) Market by Value, 2022-2032 (USD Mn, AGR (%))(U-Shape Recovery)
Figure 114. Namibia Oil & Gas Subsea Umbilicals, Risers & Flowlines (SURF) Market by Value, 2022-2032 (USD Mn, AGR (%))(L-Shape Recovery)
Figure 115. Nigeria Oil & Gas Subsea Umbilicals, Risers & Flowlines (SURF) Market by Value, 2022-2032 (USD Mn, AGR (%))
Figure 116. Nigeria Oil & Gas Subsea Umbilicals, Risers & Flowlines (SURF) Market by Value, 2022-2032 (USD Mn, AGR (%))(V-Shape Recovery)
Figure 117. Nigeria Oil & Gas Subsea Umbilicals, Risers & Flowlines (SURF) Market by Value, 2022-2032 (USD Mn, AGR (%))(W-Shape Recovery)
Figure 118. Nigeria Oil & Gas Subsea Umbilicals, Risers & Flowlines (SURF) Market by Value, 2022-2032 (USD Mn, AGR (%))(U-Shape Recovery)
Figure 119. Nigeria Oil & Gas Subsea Umbilicals, Risers & Flowlines (SURF) Market by Value, 2022-2032 (USD Mn, AGR (%))(L-Shape Recovery)
Figure 120. South Africa Oil & Gas Subsea Umbilicals, Risers & Flowlines (SURF) Market by Value, 2022-2032 (USD Mn, AGR (%))
Figure 121. South Africa Oil & Gas Subsea Umbilicals, Risers & Flowlines (SURF) Market by Value, 2022-2032 (USD Mn, AGR (%))(V-Shape Recovery)
Figure 122. South Africa Oil & Gas Subsea Umbilicals, Risers & Flowlines (SURF) Market by Value, 2022-2032 (USD Mn, AGR (%))(W-Shape Recovery)
Figure 123. South Africa Oil & Gas Subsea Umbilicals, Risers & Flowlines (SURF) Market by Value, 2022-2032 (USD Mn, AGR (%))(U-Shape Recovery)
Figure 124. South Africa Oil & Gas Subsea Umbilicals, Risers & Flowlines (SURF) Market by Value, 2022-2032 (USD Mn, AGR (%))(L-Shape Recovery)
Figure 125. Tanzania Oil & Gas Subsea Umbilicals, Risers & Flowlines (SURF) Market by Value, 2022-2032 (USD Mn, AGR (%))
Figure 126. Tanzania Oil & Gas Subsea Umbilicals, Risers & Flowlines (SURF) Market by Value, 2022-2032 (USD Mn, AGR (%))(V-Shape Recovery)
Figure 127. Tanzania Oil & Gas Subsea Umbilicals, Risers & Flowlines (SURF) Market by Value, 2022-2032 (USD Mn, AGR (%))(W-Shape Recovery)
Figure 128. Tanzania Oil & Gas Subsea Umbilicals, Risers & Flowlines (SURF) Market by Value, 2022-2032 (USD Mn, AGR (%))(U-Shape Recovery)
Figure 129. Tanzania Oil & Gas Subsea Umbilicals, Risers & Flowlines (SURF) Market by Value, 2022-2032 (USD Mn, AGR (%))(L-Shape Recovery)
Figure 130. Rest of Africa Oil & Gas Subsea Umbilicals, Risers & Flowlines (SURF) Market by Value, 2022-2032 (USD Mn, AGR (%))
Figure 131. Rest of Africa Oil & Gas Subsea Umbilicals, Risers & Flowlines (SURF) Market by Value, 2022-2032 (USD Mn, AGR (%))(V-Shape Recovery)
Figure 132. Rest of Africa Oil & Gas Subsea Umbilicals, Risers & Flowlines (SURF) Market by Value, 2022-2032 (USD Mn, AGR (%))(W-Shape Recovery)
Figure 133. Rest of Africa Oil & Gas Subsea Umbilicals, Risers & Flowlines (SURF) Market by Value, 2022-2032 (USD Mn, AGR (%))(U-Shape Recovery)
Figure 134. Rest of Africa Oil & Gas Subsea Umbilicals, Risers & Flowlines (SURF) Market by Value, 2022-2032 (USD Mn, AGR (%))(L-Shape Recovery)
Figure 135. Asia-Pacific Oil & Gas Subsea Umbilicals, Risers & Flowlines (SURF) Market by Value, 2022-2032 (USD Mn, AGR (%))
Figure 136. Asia-Pacific Oil & Gas Subsea Umbilicals, Risers & Flowlines (SURF) Market by Value, 2022-2032 (USD Mn, AGR (%))(V-Shape Recovery)
Figure 137. Asia-Pacific Oil & Gas Subsea Umbilicals, Risers & Flowlines (SURF) Market by Value, 2022-2032 (USD Mn, AGR (%))(W-Shape Recovery)
Figure 138. Asia-Pacific Oil & Gas Subsea Umbilicals, Risers & Flowlines (SURF) Market by Value, 2022-2032 (USD Mn, AGR (%))(U-Shape Recovery)
Figure 139. Asia-Pacific Oil & Gas Subsea Umbilicals, Risers & Flowlines (SURF) Market by Value, 2022-2032 (USD Mn, AGR (%))(L-Shape Recovery)
Figure 140. Asia-Pacific Oil & Gas Subsea Umbilicals, Risers & Flowlines (SURF) Market by Country, 2022-2032 (USD Mn, AGR (%))
Figure 141. Asia-Pacific Oil & Gas Subsea Umbilicals, Risers & Flowlines (SURF) Market by Value, 2022-2032 (USD Mn, AGR (%))(V-Shape Recovery)
Figure 142. Asia-Pacific Oil & Gas Subsea Umbilicals, Risers & Flowlines (SURF) Market by Country, 2022-2032 (USD Mn, AGR (%))(W-Shape Recovery)
Figure 143. Asia-Pacific Oil & Gas Subsea Umbilicals, Risers & Flowlines (SURF) Market by Country, 2022-2032 (USD Mn, AGR (%))(U-Shape Recovery)
Figure 144. Asia-Pacific Oil & Gas Subsea Umbilicals, Risers & Flowlines (SURF) Market by Country, 2022-2032 (USD Mn, AGR (%))(L-Shape Recovery)
Figure 145. Asia-Pacific Oil & Gas Subsea Umbilicals, Risers & Flowlines (SURF) Market by Risers, 2022-2032 (USD Mn, AGR (%))
Figure 146. Asia-Pacific Oil & Gas Subsea Umbilicals, Risers & Flowlines (SURF) Market by Risers, 2022-2032 (USD Mn, AGR (%))(V-Shape Recovery)
Figure 147. Asia-Pacific Oil & Gas Subsea Umbilicals, Risers & Flowlines (SURF) Market by Risers, 2022-2032 (USD Mn, AGR (%))(W-Shape Recovery)
Figure 148. Asia-Pacific Oil & Gas Subsea Umbilicals, Risers & Flowlines (SURF) Market by Risers, 2022-2032 (USD Mn, AGR (%))(U-Shape Recovery)
Figure 149. Asia-Pacific Oil & Gas Subsea Umbilicals, Risers & Flowlines (SURF) Market by Risers, 2022-2032 (USD Mn, AGR (%))(L-Shape Recovery)
Figure 150. Asia-Pacific Oil & Gas Subsea Umbilicals, Risers & Flowlines (SURF) Market by Product, 2022-2032 (USD Mn, AGR (%))
Figure 151. Asia-Pacific Oil & Gas Subsea Umbilicals, Risers & Flowlines (SURF) Market by Product, 2022-2032 (USD Mn, AGR (%))(V-Shape Recovery)
Figure 152. Asia-Pacific Oil & Gas Subsea Umbilicals, Risers & Flowlines (SURF) Market by Product, 2022-2032 (USD Mn, AGR (%))(W-Shape Recovery)
Figure 153. Asia-Pacific Oil & Gas Subsea Umbilicals, Risers & Flowlines (SURF) Market by Product, 2022-2032 (USD Mn, AGR (%))(U-Shape Recovery)
Figure 154. Asia-Pacific Oil & Gas Subsea Umbilicals, Risers & Flowlines (SURF) Market by Product, 2022-2032 (USD Mn, AGR (%))(L-Shape Recovery)
Figure 155. Asia-Pacific Oil & Gas Subsea Umbilicals, Risers & Flowlines (SURF) Market by Services, 2022-2032 (USD Mn, AGR (%))
Figure 156. Asia-Pacific Oil & Gas Subsea Umbilicals, Risers & Flowlines (SURF) Market by Services, 2022-2032 (USD Mn, AGR (%))(V-Shape Recovery)
Figure 157. Asia-Pacific Oil & Gas Subsea Umbilicals, Risers & Flowlines (SURF) Market by Services, 2022-2032 (USD Mn, AGR (%))(W-Shape Recovery)
Figure 158. Asia-Pacific Oil & Gas Subsea Umbilicals, Risers & Flowlines (SURF) Market by Services, 2022-2032 (USD Mn, AGR (%))(U-Shape Recovery)
Figure 159. Asia-Pacific Oil & Gas Subsea Umbilicals, Risers & Flowlines (SURF) Market by Services, 2022-2032 (USD Mn, AGR (%))(L-Shape Recovery)
Figure 160. Asia-Pacific Oil & Gas Subsea Umbilicals, Risers & Flowlines (SURF) Market by Water Depth, 2022-2032 (USD Mn, AGR (%))
Figure 161. Asia-Pacific Oil & Gas Subsea Umbilicals, Risers & Flowlines (SURF) Market by Water Depth, 2022-2032 (USD Mn, AGR (%))(V-Shape Recovery)
Figure 162. Asia-Pacific Oil & Gas Subsea Umbilicals, Risers & Flowlines (SURF) Market by Water Depth, 2022-2032 (USD Mn, AGR (%))(W-Shape Recovery)
Figure 163. Asia-Pacific Oil & Gas Subsea Umbilicals, Risers & Flowlines (SURF) Market by Water Depth, 2022-2032 (USD Mn, AGR (%))(U-Shape Recovery)
Figure 164. Asia-Pacific Oil & Gas Subsea Umbilicals, Risers & Flowlines (SURF) Market by Water Depth, 2022-2032 (USD Mn, AGR (%))(L-Shape Recovery)
Figure 165. Australia Oil & Gas Subsea Umbilicals, Risers & Flowlines (SURF) Market by Value, 2022-2032 (USD Mn, AGR (%))
Figure 166. Australia Oil & Gas Subsea Umbilicals, Risers & Flowlines (SURF) Market by Value, 2022-2032 (USD Mn, AGR (%))(V-Shape Recovery)
Figure 167. Australia Oil & Gas Subsea Umbilicals, Risers & Flowlines (SURF) Market by Value, 2022-2032 (USD Mn, AGR (%))(W-Shape Recovery)
Figure 168. Australia Oil & Gas Subsea Umbilicals, Risers & Flowlines (SURF) Market by Value, 2022-2032 (USD Mn, AGR (%))(U-Shape Recovery)
Figure 169. Australia Oil & Gas Subsea Umbilicals, Risers & Flowlines (SURF) Market by Value, 2022-2032 (USD Mn, AGR (%))(L-Shape Recovery)
Figure 170. Brunei Oil & Gas Subsea Umbilicals, Risers & Flowlines (SURF) Market by Value, 2022-2032 (USD Mn, AGR (%))
Figure 171. Brunei Oil & Gas Subsea Umbilicals, Risers & Flowlines (SURF) Market by Value, 2022-2032 (USD Mn, AGR (%))(V-Shape Recovery)
Figure 172. Brunei Oil & Gas Subsea Umbilicals, Risers & Flowlines (SURF) Market by Value, 2022-2032 (USD Mn, AGR (%))(W-Shape Recovery)
Figure 173. Brunei Oil & Gas Subsea Umbilicals, Risers & Flowlines (SURF) Market by Value, 2022-2032 (USD Mn, AGR (%))(U-Shape Recovery)
Figure 174. Brunei Oil & Gas Subsea Umbilicals, Risers & Flowlines (SURF) Market by Value, 2022-2032 (USD Mn, AGR (%))(L-Shape Recovery)
Figure 175. China Oil & Gas Subsea Umbilicals, Risers & Flowlines (SURF) Market by Value, 2022-2032 (USD Mn, AGR (%))
Figure 176. China Oil & Gas Subsea Umbilicals, Risers & Flowlines (SURF) Market by Value, 2022-2032 (USD Mn, AGR (%))(V-Shape Recovery)
Figure 177. China Oil & Gas Subsea Umbilicals, Risers & Flowlines (SURF) Market by Value, 2022-2032 (USD Mn, AGR (%))(W-Shape Recovery)
Figure 178. China Oil & Gas Subsea Umbilicals, Risers & Flowlines (SURF) Market by Value, 2022-2032 (USD Mn, AGR (%))(U-Shape Recovery)
Figure 179. China Oil & Gas Subsea Umbilicals, Risers & Flowlines (SURF) Market by Value, 2022-2032 (USD Mn, AGR (%))(L-Shape Recovery)
Figure 180. India Oil & Gas Subsea Umbilicals, Risers & Flowlines (SURF) Market by Value, 2022-2032 (USD Mn, AGR (%))
Figure 181. India Oil & Gas Subsea Umbilicals, Risers & Flowlines (SURF) Market by Value, 2022-2032 (USD Mn, AGR (%))(V-Shape Recovery)
Figure 182. India Oil & Gas Subsea Umbilicals, Risers & Flowlines (SURF) Market by Value, 2022-2032 (USD Mn, AGR (%))(W-Shape Recovery)
Figure 183. India Oil & Gas Subsea Umbilicals, Risers & Flowlines (SURF) Market by Value, 2022-2032 (USD Mn, AGR (%))(U-Shape Recovery)
Figure 184. India Oil & Gas Subsea Umbilicals, Risers & Flowlines (SURF) Market by Value, 2022-2032 (USD Mn, AGR (%))(L-Shape Recovery)
Figure 185. Indonesia Oil & Gas Subsea Umbilicals, Risers & Flowlines (SURF) Market by Value, 2022-2032 (USD Mn, AGR (%))
Figure 186. Indonesia Oil & Gas Subsea Umbilicals, Risers & Flowlines (SURF) Market by Value, 2022-2032 (USD Mn, AGR (%))(V-Shape Recovery)
Figure 187. Indonesia Oil & Gas Subsea Umbilicals, Risers & Flowlines (SURF) Market by Value, 2022-2032 (USD Mn, AGR (%))(W-Shape Recovery)
Figure 188. Indonesia Oil & Gas Subsea Umbilicals, Risers & Flowlines (SURF) Market by Value, 2022-2032 (USD Mn, AGR (%))(U-Shape Recovery)
Figure 189. Indonesia Oil & Gas Subsea Umbilicals, Risers & Flowlines (SURF) Market by Value, 2022-2032 (USD Mn, AGR (%))(L-Shape Recovery)
Figure 190. Rest of Asia-Pacific Oil & Gas Subsea Umbilicals, Risers & Flowlines (SURF) Market by Value, 2022-2032 (USD Mn, AGR (%))
Figure 191. Rest of Asia-Pacific Oil & Gas Subsea Umbilicals, Risers & Flowlines (SURF) Market by Value, 2022-2032 (USD Mn, AGR (%))(V-Shape Recovery)
Figure 192. Rest of Asia-Pacific Oil & Gas Subsea Umbilicals, Risers & Flowlines (SURF) Market by Value, 2022-2032 (USD Mn, AGR (%))(W-Shape Recovery)
Figure 193. Rest of Asia-Pacific Oil & Gas Subsea Umbilicals, Risers & Flowlines (SURF) Market by Value, 2022-2032 (USD Mn, AGR (%))(U-Shape Recovery)
Figure 194. Rest of Asia-Pacific Oil & Gas Subsea Umbilicals, Risers & Flowlines (SURF) Market by Value, 2022-2032 (USD Mn, AGR (%))(L-Shape Recovery)
Figure 195. Eurasia/Middle East Oil & Gas Subsea Umbilicals, Risers & Flowlines (SURF) Market by Value, 2022-2032 (USD Mn, AGR (%))
Figure 196. Eurasia/Middle East Oil & Gas Subsea Umbilicals, Risers & Flowlines (SURF) Market by Value, 2022-2032 (USD Mn, AGR (%))(V-Shape Recovery)
Figure 197. Eurasia/Middle East Oil & Gas Subsea Umbilicals, Risers & Flowlines (SURF) Market by Value, 2022-2032 (USD Mn, AGR (%))(W-Shape Recovery)
Figure 198. Eurasia/Middle East Oil & Gas Subsea Umbilicals, Risers & Flowlines (SURF) Market by Value, 2022-2032 (USD Mn, AGR (%))(U-Shape Recovery)
Figure 199. Eurasia/Middle East Oil & Gas Subsea Umbilicals, Risers & Flowlines (SURF) Market by Value, 2022-2032 (USD Mn, AGR (%))(L-Shape Recovery)
Figure 200. Eurasia/Middle East Oil & Gas Subsea Umbilicals, Risers & Flowlines (SURF) Market by Country, 2022-2032 (USD Mn, AGR (%))
Figure 201. Eurasia/Middle East Oil & Gas Subsea Umbilicals, Risers & Flowlines (SURF) Market by Country, 2022-2032 (USD Mn, AGR (%))(V-Shape Recovery)
Figure 202. Eurasia/Middle East Oil & Gas Subsea Umbilicals, Risers & Flowlines (SURF) Market by Country, 2022-2032 (USD Mn, AGR (%))(W-Shape Recovery)
Figure 203. Eurasia/Middle East Oil & Gas Subsea Umbilicals, Risers & Flowlines (SURF) Market by Country, 2022-2032 (USD Mn, AGR (%))(U-Shape Recovery)
Figure 204. Eurasia/Middle East Oil & Gas Subsea Umbilicals, Risers & Flowlines (SURF) Market by Country, 2022-2032 (USD Mn, AGR (%))(L-Shape Recovery)
Figure 205. Eurasia/Middle East Oil & Gas Subsea Umbilicals, Risers & Flowlines (SURF) Market by Risers, 2022-2032 (USD Mn, AGR (%))
Figure 206. Eurasia/Middle East Oil & Gas Subsea Umbilicals, Risers & Flowlines (SURF) Market by Risers, 2022-2032 (USD Mn, AGR (%))(V-Shape Recovery)
Figure 207. Eurasia/Middle East Oil & Gas Subsea Umbilicals, Risers & Flowlines (SURF) Market by Risers, 2022-2032 (USD Mn, AGR (%))(W-Shape Recovery)
Figure 208. Eurasia/Middle East Oil & Gas Subsea Umbilicals, Risers & Flowlines (SURF) Market by Risers, 2022-2032 (USD Mn, AGR (%))(U-Shape Recovery)
Figure 209. Eurasia/Middle East Oil & Gas Subsea Umbilicals, Risers & Flowlines (SURF) Market by Risers, 2022-2032 (USD Mn, AGR (%))(L-Shape Recovery)
Figure 210. Eurasia/Middle East Oil & Gas Subsea Umbilicals, Risers & Flowlines (SURF) Market by Product, 2022-2032 (USD Mn, AGR (%))
Figure 211. Eurasia/Middle East Oil & Gas Subsea Umbilicals, Risers & Flowlines (SURF) Market by Product, 2022-2032 (USD Mn, AGR (%))(V-Shape Recovery)
Figure 212. Eurasia/Middle East Oil & Gas Subsea Umbilicals, Risers & Flowlines (SURF) Market by Product, 2022-2032 (USD Mn, AGR (%))(W-Shape Recovery)
Figure 213. Eurasia/Middle East Oil & Gas Subsea Umbilicals, Risers & Flowlines (SURF) Market by Product, 2022-2032 (USD Mn, AGR (%))(U-Shape Recovery)
Figure 214. Eurasia/Middle East Oil & Gas Subsea Umbilicals, Risers & Flowlines (SURF) Market by Product, 2022-2032 (USD Mn, AGR (%))(L-Shape Recovery)
Figure 215. Eurasia/Middle East Oil & Gas Subsea Umbilicals, Risers & Flowlines (SURF) Market by Services, 2022-2032 (USD Mn, AGR (%))
Figure 216. Eurasia/Middle East Oil & Gas Subsea Umbilicals, Risers & Flowlines (SURF) Market by Services, 2022-2032 (USD Mn, AGR (%))(V-Shape Recovery)
Figure 217. Eurasia/Middle East Oil & Gas Subsea Umbilicals, Risers & Flowlines (SURF) Market by Services, 2022-2032 (USD Mn, AGR (%))(W-Shape Recovery)
Figure 218. Eurasia/Middle East Oil & Gas Subsea Umbilicals, Risers & Flowlines (SURF) Market by Services, 2022-2032 (USD Mn, AGR (%))(U-Shape Recovery)
Figure 219. Eurasia/Middle East Oil & Gas Subsea Umbilicals, Risers & Flowlines (SURF) Market by Services, 2022-2032 (USD Mn, AGR (%))(L-Shape Recovery)
Figure 220. Eurasia/Middle East Oil & Gas Subsea Umbilicals, Risers & Flowlines (SURF) Market by Water Depth, 2022-2032 (USD Mn, AGR (%))
Figure 221. Eurasia/Middle East Oil & Gas Subsea Umbilicals, Risers & Flowlines (SURF) Market by Water Depth, 2022-2032 (USD Mn, AGR (%))(V-Shape Recovery)
Figure 222. Eurasia/Middle East Oil & Gas Subsea Umbilicals, Risers & Flowlines (SURF) Market by Water Depth, 2022-2032 (USD Mn, AGR (%))(W-Shape Recovery)
Figure 223. Eurasia/Middle East Oil & Gas Subsea Umbilicals, Risers & Flowlines (SURF) Market by Water Depth, 2022-2032 (USD Mn, AGR (%))(U-Shape Recovery)
Figure 224. Eurasia/Middle East Oil & Gas Subsea Umbilicals, Risers & Flowlines (SURF) Market by Water Depth, 2022-2032 (USD Mn, AGR (%))(L-Shape Recovery)
Figure 225. Black Sea Oil & Gas Subsea Umbilicals, Risers & Flowlines (SURF) Market by Value, 2022-2032 (USD Mn, AGR (%))
Figure 226. Black Sea Oil & Gas Subsea Umbilicals, Risers & Flowlines (SURF) Market by Value, 2022-2032 (USD Mn, AGR (%))(V-Shape Recovery)
Figure 227. Black Sea Oil & Gas Subsea Umbilicals, Risers & Flowlines (SURF) Market by Value, 2022-2032 (USD Mn, AGR (%))(W-Shape Recovery)
Figure 228. Black Sea Oil & Gas Subsea Umbilicals, Risers & Flowlines (SURF) Market by Value, 2022-2032 (USD Mn, AGR (%))(U-Shape Recovery)
Figure 229. Black Sea Oil & Gas Subsea Umbilicals, Risers & Flowlines (SURF) Market by Value, 2022-2032 (USD Mn, AGR (%))(L-Shape Recovery)
Figure 230. Caspian Sea Oil & Gas Subsea Umbilicals, Risers & Flowlines (SURF) Market by Value, 2022-2032 (USD Mn, AGR (%))
Figure 231. Caspian Sea Oil & Gas Subsea Umbilicals, Risers & Flowlines (SURF) Market by Value, 2022-2032 (USD Mn, AGR (%))(V-Shape Recovery)
Figure 232. Caspian Sea Oil & Gas Subsea Umbilicals, Risers & Flowlines (SURF) Market by Value, 2022-2032 (USD Mn, AGR (%))(W-Shape Recovery)
Figure 233. Caspian Sea Oil & Gas Subsea Umbilicals, Risers & Flowlines (SURF) Market by Value, 2022-2032 (USD Mn, AGR (%))(U-Shape Recovery)
Figure 234. Caspian Sea Oil & Gas Subsea Umbilicals, Risers & Flowlines (SURF) Market by Value, 2022-2032 (USD Mn, AGR (%))(L-Shape Recovery)
Figure 235. Persian Gulf Oil & Gas Subsea Umbilicals, Risers & Flowlines (SURF) Market by Value, 2022-2032 (USD Mn, AGR (%))
Figure 236. Persian Gulf Oil & Gas Subsea Umbilicals, Risers & Flowlines (SURF) Market by Value, 2022-2032 (USD Mn, AGR (%))(V-Shape Recovery)
Figure 237. Persian Gulf Oil & Gas Subsea Umbilicals, Risers & Flowlines (SURF) Market by Value, 2022-2032 (USD Mn, AGR (%))(W-Shape Recovery)
Figure 238. Persian Gulf Oil & Gas Subsea Umbilicals, Risers & Flowlines (SURF) Market by Value, 2022-2032 (USD Mn, AGR (%))(U-Shape Recovery)
Figure 239. Persian Gulf Oil & Gas Subsea Umbilicals, Risers & Flowlines (SURF) Market by Value, 2022-2032 (USD Mn, AGR (%))(L-Shape Recovery)
Figure 240. Russian Arctic Oil & Gas Subsea Umbilicals, Risers & Flowlines (SURF) Market by Value, 2022-2032 (USD Mn, AGR (%))
Figure 241. Russian Arctic Oil & Gas Subsea Umbilicals, Risers & Flowlines (SURF) Market by Value, 2022-2032 (USD Mn, AGR (%))(V-Shape Recovery)
Figure 242. Russian Arctic Oil & Gas Subsea Umbilicals, Risers & Flowlines (SURF) Market by Value, 2022-2032 (USD Mn, AGR (%))(W-Shape Recovery)
Figure 243. Russian Arctic Oil & Gas Subsea Umbilicals, Risers & Flowlines (SURF) Market by Value, 2022-2032 (USD Mn, AGR (%))(U-Shape Recovery)
Figure 244. Russian Arctic Oil & Gas Subsea Umbilicals, Risers & Flowlines (SURF) Market by Value, 2022-2032 (USD Mn, AGR (%))(L-Shape Recovery)
Figure 245. Rest of Eurasia/Middle East Oil & Gas Subsea Umbilicals, Risers & Flowlines (SURF) Market by Value, 2022-2032 (USD Mn, AGR (%))
Figure 246. Rest of Eurasia/Middle East Oil & Gas Subsea Umbilicals, Risers & Flowlines (SURF) Market by Value, 2022-2032 (USD Mn, AGR (%))(V-Shape Recovery)
Figure 247. Rest of Eurasia/Middle East Oil & Gas Subsea Umbilicals, Risers & Flowlines (SURF) Market by Value, 2022-2032 (USD Mn, AGR (%))(W-Shape Recovery)
Figure 248. Rest of Eurasia/Middle East Oil & Gas Subsea Umbilicals, Risers & Flowlines (SURF) Market by Value, 2022-2032 (USD Mn, AGR (%))(U-Shape Recovery)
Figure 249. Rest of Eurasia/Middle East Oil & Gas Subsea Umbilicals, Risers & Flowlines (SURF) Market by Value, 2022-2032 (USD Mn, AGR (%))(L-Shape Recovery)
Figure 250. Americas Oil & Gas Subsea Umbilicals, Risers & Flowlines (SURF) Market by Value, 2022-2032 (USD Mn, AGR (%))
Figure 251. Americas Oil & Gas Subsea Umbilicals, Risers & Flowlines (SURF) Market by Value, 2022-2032 (USD Mn, AGR (%))(V-Shape Recovery)
Figure 252. Americas Oil & Gas Subsea Umbilicals, Risers & Flowlines (SURF) Market by Value, 2022-2032 (USD Mn, AGR (%))(W-Shape Recovery)
Figure 253. Americas Oil & Gas Subsea Umbilicals, Risers & Flowlines (SURF) Market by Value, 2022-2032 (USD Mn, AGR (%))(U-Shape Recovery)
Figure 254. Americas Oil & Gas Subsea Umbilicals, Risers & Flowlines (SURF) Market by Value, 2022-2032 (USD Mn, AGR (%))(L-Shape Recovery)
Figure 255. Americas Oil & Gas Subsea Umbilicals, Risers & Flowlines (SURF) Market by Country, 2022-2032 (USD Mn, AGR (%))
Figure 256. Americas Oil & Gas Subsea Umbilicals, Risers & Flowlines (SURF) Market by Country, 2022-2032 (USD Mn, AGR (%))(V-Shape Recovery)
Figure 257. Americas Oil & Gas Subsea Umbilicals, Risers & Flowlines (SURF) Market by Country, 2022-2032 (USD Mn, AGR (%))(W-Shape Recovery)
Figure 258. Americas Oil & Gas Subsea Umbilicals, Risers & Flowlines (SURF) Market by Country, 2022-2032 (USD Mn, AGR (%))(U-Shape Recovery)
Figure 259. Americas Oil & Gas Subsea Umbilicals, Risers & Flowlines (SURF) Market by Country, 2022-2032 (USD Mn, AGR (%))(L-Shape Recovery)
Figure 260. Americas Oil & Gas Subsea Umbilicals, Risers & Flowlines (SURF) Market by Risers, 2022-2032 (USD Mn, AGR (%))
Figure 261. Americas Oil & Gas Subsea Umbilicals, Risers & Flowlines (SURF) Market by Risers, 2022-2032 (USD Mn, AGR (%))(V-Shape Recovery)
Figure 262. Americas Oil & Gas Subsea Umbilicals, Risers & Flowlines (SURF) Market by Risers, 2022-2032 (USD Mn, AGR (%))(W-Shape Recovery)
Figure 263. Americas Oil & Gas Subsea Umbilicals, Risers & Flowlines (SURF) Market by Risers, 2022-2032 (USD Mn, AGR (%))(U-Shape Recovery)
Figure 264. Americas Oil & Gas Subsea Umbilicals, Risers & Flowlines (SURF) Market by Risers, 2022-2032 (USD Mn, AGR (%))(L-Shape Recovery)
Figure 265. Americas Oil & Gas Subsea Umbilicals, Risers & Flowlines (SURF) Market by Product, 2022-2032 (USD Mn, AGR (%))
Figure 266. Americas Oil & Gas Subsea Umbilicals, Risers & Flowlines (SURF) Market by Product, 2022-2032 (USD Mn, AGR (%))(V-Shape Recovery)
Figure 267. Americas Oil & Gas Subsea Umbilicals, Risers & Flowlines (SURF) Market by Product, 2022-2032 (USD Mn, AGR (%))(W-Shape Recovery)
Figure 268. Americas Oil & Gas Subsea Umbilicals, Risers & Flowlines (SURF) Market by Product, 2022-2032 (USD Mn, AGR (%))(U-Shape Recovery)
Figure 269. Americas Oil & Gas Subsea Umbilicals, Risers & Flowlines (SURF) Market by Product, 2022-2032 (USD Mn, AGR (%))(L-Shape Recovery)
Figure 270. Americas Oil & Gas Subsea Umbilicals, Risers & Flowlines (SURF) Market by Services, 2022-2032 (USD Mn, AGR (%))
Figure 271. Americas Oil & Gas Subsea Umbilicals, Risers & Flowlines (SURF) Market by Services, 2022-2032 (USD Mn, AGR (%))(V-Shape Recovery)
Figure 272. Americas Oil & Gas Subsea Umbilicals, Risers & Flowlines (SURF) Market by Services, 2022-2032 (USD Mn, AGR (%))(W-Shape Recovery)
Figure 273. Americas Oil & Gas Subsea Umbilicals, Risers & Flowlines (SURF) Market by Services, 2022-2032 (USD Mn, AGR (%))(U-Shape Recovery)
Figure 274. Americas Oil & Gas Subsea Umbilicals, Risers & Flowlines (SURF) Market by Services, 2022-2032 (USD Mn, AGR (%))(L-Shape Recovery)
Figure 275. Americas Oil & Gas Subsea Umbilicals, Risers & Flowlines (SURF) Market by Water Depth, 2022-2032 (USD Mn, AGR (%))
Figure 276. Americas Oil & Gas Subsea Umbilicals, Risers & Flowlines (SURF) Market by Water Depth, 2022-2032 (USD Mn, AGR (%))(V-Shape Recovery)
Figure 277. Americas Oil & Gas Subsea Umbilicals, Risers & Flowlines (SURF) Market by Water Depth, 2022-2032 (USD Mn, AGR (%))(W-Shape Recovery)
Figure 278. Americas Oil & Gas Subsea Umbilicals, Risers & Flowlines (SURF) Market by Water Depth, 2022-2032 (USD Mn, AGR (%))(U-Shape Recovery)
Figure 279. Americas Oil & Gas Subsea Umbilicals, Risers & Flowlines (SURF) Market by Water Depth, 2022-2032 (USD Mn, AGR (%))(L-Shape Recovery)
Figure 280. Alaska Oil & Gas Subsea Umbilicals, Risers & Flowlines (SURF) Market by Value, 2022-2032 (USD Mn, AGR (%))
Figure 281. Alaska Oil & Gas Subsea Umbilicals, Risers & Flowlines (SURF) Market by Value, 2022-2032 (USD Mn, AGR (%))(V-Shape Recovery)
Figure 282. Alaska Oil & Gas Subsea Umbilicals, Risers & Flowlines (SURF) Market by Value, 2022-2032 (USD Mn, AGR (%))(W-Shape Recovery)
Figure 283. Alaska Oil & Gas Subsea Umbilicals, Risers & Flowlines (SURF) Market by Value, 2022-2032 (USD Mn, AGR (%))(U-Shape Recovery)
Figure 284. Alaska Oil & Gas Subsea Umbilicals, Risers & Flowlines (SURF) Market by Value, 2022-2032 (USD Mn, AGR (%))(L-Shape Recovery)
Figure 285. Canada Oil & Gas Subsea Umbilicals, Risers & Flowlines (SURF) Market by Value, 2022-2032 (USD Mn, AGR (%))
Figure 286. Canada Oil & Gas Subsea Umbilicals, Risers & Flowlines (SURF) Market by Value, 2022-2032 (USD Mn, AGR (%))(V-Shape Recovery)
Figure 287. Canada Oil & Gas Subsea Umbilicals, Risers & Flowlines (SURF) Market by Value, 2022-2032 (USD Mn, AGR (%))(W-Shape Recovery)
Figure 288. Canada Oil & Gas Subsea Umbilicals, Risers & Flowlines (SURF) Market by Value, 2022-2032 (USD Mn, AGR (%))(U-Shape Recovery)
Figure 289. Canada Oil & Gas Subsea Umbilicals, Risers & Flowlines (SURF) Market by Value, 2022-2032 (USD Mn, AGR (%))(L-Shape Recovery)
Figure 290. Trinidad and Tobago Oil & Gas Subsea Umbilicals, Risers & Flowlines (SURF) Market by Value, 2022-2032 (USD Mn, AGR (%))
Figure 291. Trinidad and Tobago Oil & Gas Subsea Umbilicals, Risers & Flowlines (SURF) Market by Value, 2022-2032 (USD Mn, AGR (%))(V-Shape Recovery)
Figure 292. Trinidad and Tobago Oil & Gas Subsea Umbilicals, Risers & Flowlines (SURF) Market by Value, 2022-2032 (USD Mn, AGR (%))(W-Shape Recovery)
Figure 293. Trinidad and Tobago Oil & Gas Subsea Umbilicals, Risers & Flowlines (SURF) Market by Value, 2022-2032 (USD Mn, AGR (%))(U-Shape Recovery)
Figure 294. Trinidad and Tobago Oil & Gas Subsea Umbilicals, Risers & Flowlines (SURF) Market by Value, 2022-2032 (USD Mn, AGR (%))(L-Shape Recovery)
Figure 295. Brazil Oil & Gas Subsea Umbilicals, Risers & Flowlines (SURF) Market by Value, 2022-2032 (USD Mn, AGR (%))
Figure 296. Brazil Oil & Gas Subsea Umbilicals, Risers & Flowlines (SURF) Market by Value, 2022-2032 (USD Mn, AGR (%))(V-Shape Recovery)
Figure 297. Brazil Oil & Gas Subsea Umbilicals, Risers & Flowlines (SURF) Market by Value, 2022-2032 (USD Mn, AGR (%))(W-Shape Recovery)
Figure 298. Brazil Oil & Gas Subsea Umbilicals, Risers & Flowlines (SURF) Market by Value, 2022-2032 (USD Mn, AGR (%))(U-Shape Recovery)
Figure 299. Brazil Oil & Gas Subsea Umbilicals, Risers & Flowlines (SURF) Market by Value, 2022-2032 (USD Mn, AGR (%))(L-Shape Recovery)
Figure 300. Rest of Americas Oil & Gas Subsea Umbilicals, Risers & Flowlines (SURF) Market by Value, 2022-2032 (USD Mn, AGR (%))
Figure 301. Rest of Americas Oil & Gas Subsea Umbilicals, Risers & Flowlines (SURF) Market by Value, 2022-2032 (USD Mn, AGR (%))(V-Shape Recovery)
Figure 302. Rest of Americas Oil & Gas Subsea Umbilicals, Risers & Flowlines (SURF) Market by Value, 2022-2032 (USD Mn, AGR (%))(W-Shape Recovery)
Figure 303. Rest of Americas Oil & Gas Subsea Umbilicals, Risers & Flowlines (SURF) Market by Value, 2022-2032 (USD Mn, AGR (%))(U-Shape Recovery)
Figure 304. Rest of Americas Oil & Gas Subsea Umbilicals, Risers & Flowlines (SURF) Market by Value, 2022-2032 (USD Mn, AGR (%))(L-Shape Recovery)
Figure 305. Europe Oil & Gas Subsea Umbilicals, Risers & Flowlines (SURF) Market by Value, 2022-2032 (USD Mn, AGR (%))
Figure 306. Europe Oil & Gas Subsea Umbilicals, Risers & Flowlines (SURF) Market by Value, 2022-2032 (USD Mn, AGR (%))(V-Shape Recovery)
Figure 307. Europe Oil & Gas Subsea Umbilicals, Risers & Flowlines (SURF) Market by Value, 2022-2032 (USD Mn, AGR (%))(W-Shape Recovery)
Figure 308. Europe Oil & Gas Subsea Umbilicals, Risers & Flowlines (SURF) Market by Value, 2022-2032 (USD Mn, AGR (%))(U-Shape Recovery)
Figure 309. Europe Oil & Gas Subsea Umbilicals, Risers & Flowlines (SURF) Market by Value, 2022-2032 (USD Mn, AGR (%))(L-Shape Recovery)
Figure 310. Europe Oil & Gas Subsea Umbilicals, Risers & Flowlines (SURF) Market by Country, 2022-2032 (USD Mn, AGR (%))
Figure 311. Europe Oil & Gas Subsea Umbilicals, Risers & Flowlines (SURF) Market by Country, 2022-2032 (USD Mn, AGR (%))(V-Shape Recovery)
Figure 312. Europe Oil & Gas Subsea Umbilicals, Risers & Flowlines (SURF) Market by Country, 2022-2032 (USD Mn, AGR (%))(W-Shape Recovery)
Figure 313. Europe Oil & Gas Subsea Umbilicals, Risers & Flowlines (SURF) Market by Country, 2022-2032 (USD Mn, AGR (%))(U-Shape Recovery)
Figure 314. Europe Oil & Gas Subsea Umbilicals, Risers & Flowlines (SURF) Market by Country, 2022-2032 (USD Mn, AGR (%))(L-Shape Recovery)
Figure 315. Europe Oil & Gas Subsea Umbilicals, Risers & Flowlines (SURF) Market by Risers, 2022-2032 (USD Mn, AGR (%))
Figure 316. Europe Oil & Gas Subsea Umbilicals, Risers & Flowlines (SURF) Market by Risers, 2022-2032 (USD Mn, AGR (%))(V-Shape Recovery)
Figure 317. Europe Oil & Gas Subsea Umbilicals, Risers & Flowlines (SURF) Market by Risers, 2022-2032 (USD Mn, AGR (%))(W-Shape Recovery)
Figure 318. Europe Oil & Gas Subsea Umbilicals, Risers & Flowlines (SURF) Market by Risers, 2022-2032 (USD Mn, AGR (%))(U-Shape Recovery)
Figure 319. Europe Oil & Gas Subsea Umbilicals, Risers & Flowlines (SURF) Market by Risers, 2022-2032 (USD Mn, AGR (%))(L-Shape Recovery)
Figure 320. Europe Oil & Gas Subsea Umbilicals, Risers & Flowlines (SURF) Market by Product, 2022-2032 (USD Mn, AGR (%))
Figure 321. Europe Oil & Gas Subsea Umbilicals, Risers & Flowlines (SURF) Market by Product, 2022-2032 (USD Mn, AGR (%))(V-Shape Recovery)
Figure 322. Europe Oil & Gas Subsea Umbilicals, Risers & Flowlines (SURF) Market by Product, 2022-2032 (USD Mn, AGR (%))(W-Shape Recovery)
Figure 323. Europe Oil & Gas Subsea Umbilicals, Risers & Flowlines (SURF) Market by Product, 2022-2032 (USD Mn, AGR (%))(U-Shape Recovery)
Figure 324. Europe Oil & Gas Subsea Umbilicals, Risers & Flowlines (SURF) Market by Product, 2022-2032 (USD Mn, AGR (%))(L-Shape Recovery)
Figure 325. Europe Oil & Gas Subsea Umbilicals, Risers & Flowlines (SURF) Market by Services, 2022-2032 (USD Mn, AGR (%))
Figure 326. Europe Oil & Gas Subsea Umbilicals, Risers & Flowlines (SURF) Market by Services, 2022-2032 (USD Mn, AGR (%))(V-Shape Recovery)
Figure 327. Europe Oil & Gas Subsea Umbilicals, Risers & Flowlines (SURF) Market by Services, 2022-2032 (USD Mn, AGR (%))(W-Shape Recovery)
Figure 328. Europe Oil & Gas Subsea Umbilicals, Risers & Flowlines (SURF) Market by Services, 2022-2032 (USD Mn, AGR (%))(U-Shape Recovery)
Figure 329. Europe Oil & Gas Subsea Umbilicals, Risers & Flowlines (SURF) Market by Services, 2022-2032 (USD Mn, AGR (%))(L-Shape Recovery)
Figure 330. Europe Oil & Gas Subsea Umbilicals, Risers & Flowlines (SURF) Market by Water Depth, 2022-2032 (USD Mn, AGR (%))
Figure 331. Europe Oil & Gas Subsea Umbilicals, Risers & Flowlines (SURF) Market by Water Depth, 2022-2032 (USD Mn, AGR (%))(V-Shape Recovery)
Figure 332. Europe Oil & Gas Subsea Umbilicals, Risers & Flowlines (SURF) Market by Water Depth, 2022-2032 (USD Mn, AGR (%))(W-Shape Recovery)
Figure 333. Europe Oil & Gas Subsea Umbilicals, Risers & Flowlines (SURF) Market by Water Depth, 2022-2032 (USD Mn, AGR (%))(U-Shape Recovery)
Figure 334. Europe Oil & Gas Subsea Umbilicals, Risers & Flowlines (SURF) Market by Water Depth, 2022-2032 (USD Mn, AGR (%))(L-Shape Recovery)
Figure 335. Denmark Oil & Gas Subsea Umbilicals, Risers & Flowlines (SURF) Market by Value, 2022-2032 (USD Mn, AGR (%))
Figure 336. Denmark Oil & Gas Subsea Umbilicals, Risers & Flowlines (SURF) Market by Value, 2022-2032 (USD Mn, AGR (%))(V-Shape Recovery)
Figure 337. Denmark Oil & Gas Subsea Umbilicals, Risers & Flowlines (SURF) Market by Value, 2022-2032 (USD Mn, AGR (%))(W-Shape Recovery)
Figure 338. Denmark Oil & Gas Subsea Umbilicals, Risers & Flowlines (SURF) Market by Value, 2022-2032 (USD Mn, AGR (%))(U-Shape Recovery)
Figure 339. Denmark Oil & Gas Subsea Umbilicals, Risers & Flowlines (SURF) Market by Value, 2022-2032 (USD Mn, AGR (%))(L-Shape Recovery)
Figure 340. Ireland Oil & Gas Subsea Umbilicals, Risers & Flowlines (SURF) Market by Value, 2022-2032 (USD Mn, AGR (%))
Figure 341. Ireland Oil & Gas Subsea Umbilicals, Risers & Flowlines (SURF) Market by Value, 2022-2032 (USD Mn, AGR (%))(V-Shape Recovery)
Figure 342. Ireland Oil & Gas Subsea Umbilicals, Risers & Flowlines (SURF) Market by Value, 2022-2032 (USD Mn, AGR (%))(W-Shape Recovery)
Figure 343. Ireland Oil & Gas Subsea Umbilicals, Risers & Flowlines (SURF) Market by Value, 2022-2032 (USD Mn, AGR (%))(U-Shape Recovery)
Figure 344. Ireland Oil & Gas Subsea Umbilicals, Risers & Flowlines (SURF) Market by Value, 2022-2032 (USD Mn, AGR (%))(L-Shape Recovery)
Figure 345. Mediterranean Sea Oil & Gas Subsea Umbilicals, Risers & Flowlines (SURF) Market by Value, 2022-2032 (USD Mn, AGR (%))
Figure 346. Mediterranean Sea Oil & Gas Subsea Umbilicals, Risers & Flowlines (SURF) Market by Value, 2022-2032 (USD Mn, AGR (%))(V-Shape Recovery)
Figure 347. Mediterranean Sea Oil & Gas Subsea Umbilicals, Risers & Flowlines (SURF) Market by Value, 2022-2032 (USD Mn, AGR (%))(W-Shape Recovery)
Figure 348. Mediterranean Sea Oil & Gas Subsea Umbilicals, Risers & Flowlines (SURF) Market by Value, 2022-2032 (USD Mn, AGR (%))(U-Shape Recovery)
Figure 349. Mediterranean Sea Oil & Gas Subsea Umbilicals, Risers & Flowlines (SURF) Market by Value, 2022-2032 (USD Mn, AGR (%))(L-Shape Recovery)
Figure 350. Netherlands Oil & Gas Subsea Umbilicals, Risers & Flowlines (SURF) Market by Value, 2022-2032 (USD Mn, AGR (%))
Figure 351. Netherlands Oil & Gas Subsea Umbilicals, Risers & Flowlines (SURF) Market by Value, 2022-2032 (USD Mn, AGR (%))(V-Shape Recovery)
Figure 352. Netherlands Oil & Gas Subsea Umbilicals, Risers & Flowlines (SURF) Market by Value, 2022-2032 (USD Mn, AGR (%))(W-Shape Recovery)
Figure 353. Netherlands Oil & Gas Subsea Umbilicals, Risers & Flowlines (SURF) Market by Value, 2022-2032 (USD Mn, AGR (%))(U-Shape Recovery)
Figure 354. Netherlands Oil & Gas Subsea Umbilicals, Risers & Flowlines (SURF) Market by Value, 2022-2032 (USD Mn, AGR (%))(L-Shape Recovery)
Figure 355. Rest of Europe Oil & Gas Subsea Umbilicals, Risers & Flowlines (SURF) Market by Value, 2022-2032 (USD Mn, AGR (%))
Figure 356. Rest of Europe Oil & Gas Subsea Umbilicals, Risers & Flowlines (SURF) Market by Value, 2022-2032 (USD Mn, AGR (%))(V-Shape Recovery)
Figure 357. Rest of Europe Oil & Gas Subsea Umbilicals, Risers & Flowlines (SURF) Market by Value, 2022-2032 (USD Mn, AGR (%))(W-Shape Recovery)
Figure 358. Rest of Europe Oil & Gas Subsea Umbilicals, Risers & Flowlines (SURF) Market by Value, 2022-2032 (USD Mn, AGR (%))(U-Shape Recovery)
Figure 359. Rest of Europe Oil & Gas Subsea Umbilicals, Risers & Flowlines (SURF) Market by Value, 2022-2032 (USD Mn, AGR (%))(L-Shape Recovery)
Figure 360. TechnipFMC Plc: Company Revenue 2016-2020 (US$Mn, AGR %)
Figure 361. TechnipFMC Plc: Company Operating Income 2016-2020 (US$Mn, AGR %)
Figure 362. TechnipFMC Plc: Company Net Income 2016-2020 (US$Mn, AGR %)
Figure 363. TechnipFMC Plc: Company EBITDA 2016-2020 (US$Mn, AGR %)
Figure 364. Saipem SpA: Company Revenue 2016-2020 (US$Mn, AGR %)
Figure 365. Saipem SpA: Company Operating Income 2016-2020 (US$Mn, AGR %)
Figure 366. Saipem SpA: Company Net Income 2016-2020 (US$Mn, AGR %)
Figure 367. Saipem SpA: Company EBITDA 2016-2020 (US$Mn, AGR %)
Figure 368. Subsea 7: Company Revenue 2016-2020 (US$Mn, AGR %)
Figure 369. Subsea 7: Company Operating Income 2016-2020 (US$Mn, AGR %)
Figure 370. Subsea 7: Company Net Income 2016-2020 (US$Mn, AGR %)
Figure 371. Subsea 7: Company EBITDA 2016-2020 (US$Mn, AGR %)
Figure 372. Aker Solutions: Company Revenue 2016-2020 (US$Mn, AGR %)
Figure 373. Aker Solutions: Company Operating Income 2016-2020 (US$Mn, AGR %)
Figure 374. Aker Solutions: Company Net Income 2016-2020 (US$Mn, AGR %)
Figure 375. Aker Solutions: Company EBITDA 2016-2020 (US$Mn, AGR %)
Figure 376. Siemens AG: Company Revenue 2016-2020 (US$Mn, AGR %)
Figure 377. Siemens AG: Company Operating Income 2016-2020 (US$Mn, AGR %)
Figure 378. Siemens AG: Company Net Income 2016-2020 (US$Mn, AGR %)
Figure 379. Siemens AG: Company EBITDA 2016-2020 (US$Mn, AGR %)
Figure 380. Kongsberg Gruppen Asa: Company Revenue 2016-2020 (US$Mn, AGR %)
Figure 381. Kongsberg Gruppen Asa: Company Operating Income 2016-2020 (US$Mn, AGR %)
Figure 382. Kongsberg Gruppen Asa: Company Net Income 2016-2020 (US$Mn, AGR %)
Figure 383. Kongsberg Gruppen Asa: Company EBITDA 2016-2020 (US$Mn, AGR %)
Figure 384. Abb Group: Company Revenue 2016-2020 (US$Mn, AGR %)
Figure 385. Abb Group: Company Operating Income 2016-2020 (US$Mn, AGR %)
Figure 386. Abb Group: Company Net Income 2016-2020 (US$Mn, AGR %)
Figure 387. Abb Group: Company EBITDA 2016-2020 (US$Mn, AGR %)
Figure 388. General Electric Company: Company Revenue 2016-2020 (US$Mn, AGR %)
Figure 389. General Electric Company: Company Operating Income 2016-2020 (US$Mn, AGR %)
Figure 390. General Electric Company: Company Net Income 2016-2020 (US$Mn, AGR %)
Figure 391. General Electric Company: Company EBITDA 2016-2020 (US$Mn, AGR %)
Figure 392. Parker Hannifin: Company Revenue 2016-2020 (US$Mn, AGR %)
Figure 393. Parker Hannifin: Company Operating Income 2016-2020 (US$Mn, AGR %)
Figure 394. Parker Hannifin: Company Net Income 2016-2020 (US$Mn, AGR %)
Figure 395. Parker Hannifin: Company EBITDA 2016-2020 (US$Mn, AGR %)
Figure 396. Oceaneering International, Inc.: Company Revenue 2016-2020 (US$Mn, AGR %)
Figure 397. Oceaneering International, Inc.: Company Operating Income 2016-2020 (US$Mn, AGR %)
Figure 398. Oceaneering International, Inc.: Company Net Income 2016-2020 (US$Mn, AGR %)
Figure 399. Oceaneering International, Inc.: Company EBITDA 2016-2020 (US$Mn, AGR %)
Figure 400. Nexans SA: Company Revenue 2016-2020 (US$Mn, AGR %)
Figure 401. Nexans SA: Company Operating Income 2016-2020 (US$Mn, AGR %)
Figure 402. Nexans SA: Company Net Income 2016-2020 (US$Mn, AGR %)
Figure 403. Nexans SA: Company EBITDA 2016-2020 (US$Mn, AGR %)
Figure 404. Prysmian S.p.A.: Company Revenue 2016-2020 (US$Mn, AGR %)
Figure 405. Prysmian S.p.A.: Company Operating Income 2016-2020 (US$Mn, AGR %)
Figure 406. Prysmian S.p.A.: Company Net Income 2016-2020 (US$Mn, AGR %)
Figure 407. Prysmian S.p.A.: Company EBITDA 2016-2020 (US$Mn, AGR %)
Figure 408. National Oilwell Varco, Inc.: Company Revenue 2016-2020 (US$Mn, AGR %)
Figure 409. National Oilwell Varco, Inc.: Company Operating Income 2016-2020 (US$Mn, AGR %)
Figure 410. National Oilwell Varco, Inc.: Company Net Income 2016-2020 (US$Mn, AGR %)
Figure 411. National Oilwell Varco, Inc.: Company EBITDA 2016-2020 (US$Mn, AGR %)
Figure 412. Vallourec: Company Revenue 2016-2020 (US$Mn, AGR %)
Figure 413. Vallourec: Company Operating Income 2016-2020 (US$Mn, AGR %)
Figure 414. Vallourec: Company Net Income 2016-2020 (US$Mn, AGR %)
Figure 415. Vallourec: Company EBITDA 2016-2020 (US$Mn, AGR %)
Figure 416. Dril-Quip, Inc: Company Revenue 2016-2020 (US$Mn, AGR %)
Figure 417. Dril-Quip, Inc: Company Operating Income 2016-2020 (US$Mn, AGR %)
Figure 418. Dril-Quip, Inc: Company Net Income 2016-2020 (US$Mn, AGR %)
Figure 419. Dril-Quip, Inc: Company EBITDA 2016-2020 (US$Mn, AGR %)
Figure 420. Global Oil & Gas Subsea Umbilicals, Risers & Flowlines (SURF) Market Share Forecast by Region 2022, 2027, 2032(%)
Abb Group
Airborne Oil & Gas B.V
Aker Solutions
Baker Hughes
Cameron International Corporation
Dril-Quip, Inc
General Electric Company
Kongsberg Gruppen Asa
McDermott International, Inc.
National Oilwell Varco, Inc.
Nexans SA
Oceaneering International, Inc.
Orient Cable
Parker Hannifin
Prysmian S.p.A.
Saipem SpA
Siemens AG
Subsea 7
TechnipFMC Plc
Vallourec
List of Other Companies Mentioned in the report
2H Offshore
Acteon Group
Air Products & Chemicals
Aker Solutions
Amerada Hess
Anadarko Petroleum Corporation
Apache
Aquaterra Energy
Ariosh
Australian Worldwide Exploration
BG Group
BG International
BHP Billiton
BP
Canadian Natural Resources
Centrica
Ceona
Chevron
China National Offshore Oil Corporation (CNOOC)
Chinook Energy
Claxton
Coastal Energy Malaysia
ConocoPhillips
Cuu Long Joint Operating Company (CLJOC)
Dana Petroleum
Deep Gulf Energy
DeepSea
DeepTrend
Delmar Systems Inc.
Det Norske
DOF
DONG Energy
E.ON
EGPC
EMAS AMC
Eni Norge AS
EnQuest
Equinor
ExxonMobil
Flexlife
FMC Technologies
Galoc Production Company
Galp Energia
Gaz de France
Gazprom
GDF Suez
GE Oil & Gas
Ghana National Petroleum Corporation
Harvest Natural Resources
Hess Corporation
Hess Exploration and Production Malaysia
Husky Energy
Husky Oil Operations
Husky-CNOOC Madura Limited (HCML)
Inpex
Ithaca Energy
ITP Interpipe
JDR Cable Systems
JX Nippon
Kangean Energy Indonesia (KEI)
Kosmos Energy
KrisEnergy
Kvaerner
Lagos Deep Offshore Logistics (LADOL)
LLOG
Lukoil
Lundin
M2 Subsea
Maersk Oil
Marathon Oil
McDermott
Murphy Exploration & Production Company
Murphy Oil
Nexans
Nexen
Nexus Energy
Noble
Ocean Installer
Oceaneering
Oil and Natural Gas Corporation (ONGC)
OMV Petrom
OneSubsea
ONGC
Ophir Energy
Parker Energy Products
Pemex
Petrobras
Petrofac
Petróleos de Venezuela SA (PDVSA)
Petróleos Mexicanos (Pemex)
Petronas
PetroVietnam
Premier Oil
Principia
Prysmian Group
PTTEP
PVEP
QGEP
Reliance Industries
Risertec
Roc Oil
Rosneft
Royal Niger Emerging Technologies
Sabre Oil and Gas
Saipem
Salamander Energy
Samsung Heavy Industries
Santos
SBM Offshore
Schlumberger
Shell (Enterprise Oil Limited)
Sinopec
Sonangol
Statoil
Stone Energy Corporation
Subsea 7
Subsea Riser Products
Sunbird Energy
Suncor Energy
Talisman Energy
TAQA
Technip
TNK Vietnam
TNK-BP
Total
Total Upstream Nigeria
Tullow Oil
Vallourec
Vietsovpetro (VSP)
Vitol Upstream
Wellstream
Wintershall Norge AS
Wood Group Kenny
Woodside Energy
Xstate Resources
Yinka Folawiyo Petroleum
Zarubezhneft
List of Associations Mentioned in the Report
Bureau of Ocean Energy Management (BOEM)
Bureau of Safety and Environmental Enforcement (BSEE)
Danish Energy Agency (DEA)
Drug Enforcement Administration (DEA)
Energy Information Administration (EIA)
International Atomic Energy Agency (IAEA)
International Monetary Fund (IMF)
National Petroleum Corporation (NNPC)
National Union for the Total Independence of Angola (UNITA)
Nigerian Content Development and Monitoring Board
Nigerian Ministry of Petroleum Resources
Popular Movement for the Liberation of Angola (MPLA)
Société Nationale des Hydrocarbures
State National Oil Corporation
The Angolan government
The Government of the Communist Party of Vietnam (CPV)
The Organization of the Petroleum Exporting Countries (OPEC)
The Russian Government
The Umbilical Manufacturers Federation
The US Government
The World Bank
UK Department of Energy & Climate Change (DECC)
Download sample pages
Complete the form below to download your free sample pages for Oil & Gas Subsea Umbilicals, Risers & Flowlines (SURF) Market Report 2022-2032Related reports
-
Floating Liquefied Natural Gas (FLNG) Market Report 2022-2032
The global floating liquefied natural gas (FLNG) market was valued at US$16,670 million in 2021 and is projected to grow...Full DetailsPublished: 14 September 2022 -
Oil Refinery Market Report 2022-2032
The major drivers of oil refinery are growing demand of petroleum product, more money is being invested in refinery construction,...Full DetailsPublished: 04 April 2022 -
Liquefied Petroleum Gas (LPG) Market Report 2022-2032
Biomethane, hydrogen, and gas with carbon capture could all play a role in helping countries and regions make the transition...Full DetailsPublished: 04 April 2022 -

Liquefied Natural Gas (LNG) Storage Tank Market Report 2021-2031
In many key markets, the fundamental principles for LNG growth – such as falling domestic supply and increased need for...Full DetailsPublished: 14 September 2021 -
Floating Liquefied Natural Gas (FLNG) Market Report 2021-2031
LNG terminals require a vast amount of capital to build: four projects approved in the previous few years, according to...Full DetailsPublished: 28 June 2021 -
Offshore Drilling Market Report 2021-2031
We believe that high opportunity remains in this fast-growing offshore drilling market. See how to use the existing and upcoming...Full DetailsPublished: 03 November 2021 -
Oil Refinery Catalyst Market Report 2022-2032
We predict strong revenue growth through to 2032. Our work identifies which organizations hold the greatest potential. Discover their capabilities,...Full DetailsPublished: 24 March 2022 -

Small Scale Liquefied Natural Gas (SSLNG) Market Report 2023-2033
The global Small Scale Liquefied Natural Gas (SSLNG) market is projected to grow at a CAGR of 9.0% by 2033...Full DetailsPublished: 08 March 2023 -

Oil & Gas Drill Bit Market Report 2021-2031
The demand for drill bit is expected to grow on account of the increasing oil & gas exploration and drilling...Full DetailsPublished: 27 October 2021 -
Onshore Oil & Gas Pipelines Market Report 2021-2031
Oil & gas pipelines are considered an important infrastructure for energy security in countries with low oil & gas reserves,...Full DetailsPublished: 03 August 2021
Download sample pages
Complete the form below to download your free sample pages for Oil & Gas Subsea Umbilicals, Risers & Flowlines (SURF) Market Report 2022-2032Do you have any custom requirements we can help you with?
Any specific country, geo region, market segment or specific company information?
Email us today, we can discuss your needs and see how we can help: jamie.roberts@visiongain.com
Would you like a free report overview of the report of your choice?
If so, please drop an email to Jamie Roberts stating your chosen report title to jamie.roberts@visiongain.com
Visiongain energy reports are compiled using a broad and rich mixture of both primary and secondary information to produce an overall industry outlook. In order to provide our clients with the best product possible product, we do not rely on any one single source of information. Visiongain analysts reach out to market-leading vendors and industry experts where possible but also review a wealth of financial data and product information from a vast range of sources. To find out more about our reports methodology, please email jamie.roberts@visiongain.com
Would you like to get the latest Visiongain energy reports catalogue?
What are the dynamic growth sectors? where are the regional business opportunities?
Which technologies will prevail and who are the leading companies succeeding in these sectors and why?
If you want definitive answers to business critical questions, discover Visiongain’s full range of business intelligence reports.
If so, please email Jamie Roberts on jamie.roberts@visiongain.com or call her today on +44 207 336 6100
“The Visiongain report was extremely insightful and helped us construct our basic go-to market strategy for our solution.”
H.
“F.B has used Visiongain to prepare two separate market studies on the ceramic proppants market over the last 12 months. These reports have been professionally researched and written and have assisted FBX greatly in developing its business strategy and investment plans.”
F.B
“We just received your very interesting report on the Energy Storage Technologies (EST) Market and this is a very impressive and useful document on that subject.”
I.E.N
“Visiongain does an outstanding job on putting the reports together and provides valuable insight at the right informative level for our needs. The EOR Visiongain report provided confirmation and market outlook data for EOR in MENA with the leading countries being Oman, Kuwait and eventually Saudi Arabia.”
E.S
“Visiongain produced a comprehensive, well-structured GTL Market report striking a good balance between scope and detail, global and local perspective, large and small industry segments. It is an informative forecast, useful for practitioners as a trusted and upto-date reference.”
Y.N Ltd
Association of Dutch Suppliers in the Oil & Gas Industry
Society of Naval Architects & Marine Engineers
Association of Diving Contractors
Association of Diving Contractors International
Associazione Imprese Subacquee Italiane
Australian Petroleum Production & Exploration Association
Brazilian Association of Offshore Support Companies
Brazilian Petroleum Institute
Canadian Energy Pipeline
Diving Medical Advisory Committee
European Diving Technology Committee
French Oil and Gas Industry Council
IMarEST – Institute of Marine Engineering, Science & Technology
International Association of Drilling Contractors
International Association of Geophysical Contractors
International Association of Oil & Gas Producers
International Chamber of Shipping
International Shipping Federation
International Marine Contractors Association
International Tanker Owners Pollution Federation
Leading Oil & Gas Industry Competitiveness
Maritime Energy Association
National Ocean Industries Association
Netherlands Oil and Gas Exploration and Production Association
NOF Energy
Norsk olje og gass Norwegian Oil and Gas Association
Offshore Contractors’ Association
Offshore Mechanical Handling Equipment Committee
Oil & Gas UK
Oil Companies International Marine Forum
Ontario Petroleum Institute
Organisation of the Petroleum Exporting Countries
Regional Association of Oil and Natural Gas Companies in Latin America and the Caribbean
Society for Underwater Technology
Society of Maritime Industries
Society of Petroleum Engineers
Society of Petroleum Enginners – Calgary
Step Change in Safety
Subsea UK
The East of England Energy Group
UK Petroleum Industry Association
All the events postponed due to COVID-19.
Don’t Miss Out!
Latest Energy news
Energy as a Service (EaaS) Market
The global Energy as a Service (EaaS) market is projected to grow at a CAGR of 12.6% by 2034
25 July 2024
Synthetic Fuels Market
The global Synthetic Fuels market is projected to grow at a CAGR of 23% by 2034
18 July 2024
Power-to-X (P2X) Market
The global Power-to-X (P2X) market is projected to grow at a CAGR of 10.6% by 2034
09 July 2024
Airborne Wind Energy Market
The global Airborne Wind Energy market is projected to grow at a CAGR of 9.7% by 2034
05 June 2024


