The Pharma Contract Sales Market Report 2022-2032: If leading businesses are looking for new sources of income and want to understand the market and its underlying dynamics, this report will be invaluable. It will be helpful for businesses looking to diversify into new markets or increase the scope of their current operations.
Increasing R&D in Pharmaceutical Companies Has Changed Outsourcing Dynamics
Many medium-sized and large pharmaceutical businesses are outsourcing their operations because it offers cost control, better results, and operational flexibility in response to rising R&D and other operating costs in the pharmaceutical industry. CSOs offer experience with market access, health authorities, and local account management, which has contributed to an increase in the number of CSOs in recent years and is anticipated to continue in the near future. CSOs in Europe account for about one-third of pharmaceutical officials. Few CSOs do, however, provide their potentially contentious sales and marketing services to diverse businesses operating in the same region.
Quality Abandonment in Pharmaceutical Sales and Services
The contract manufacturer’s attempt to secure orders from as many pharmaceutical companies as possible is the sole issue. As a result, it strives to receive as many orders from its computers each day as feasible. When anything reaches its potential, quality must inevitably suffer. After doing a thorough study, this anxiety can be reduced by getting in touch with the proper contract manufacturing business. Pharmaceutical quality is influenced by a variety of factors, some of which can compound one another, including raw ingredients, manufacturing procedures, packaging, transit, and storage conditions.
What Questions Should You Ask before Buying a Market Research Report?
• How is the pharma contract sales market evolving?
• What is driving and restraining the pharma contract sales market?
• How will each pharma contract sales submarket segment grow over the forecast period and how much revenue will these submarkets account for in 2032?
• How will the market shares for each pharma contract sales submarket develop from 2022 to 2032?
• What will be the main driver for the overall market from 2022 to 2032?
• Will leading pharma contract sales markets broadly follow the macroeconomic dynamics, or will individual national markets outperform others?
• How will the market shares of the national markets change by 2032 and which geographical region will lead the market in 2032?
• Who are the leading players and what are their prospects over the forecast period?
• What are the pharma contract sales projects for these leading companies?
• How will the industry evolve during the period between 2020 and 2032? What are the implications of pharma contract sales projects taking place now and over the next 10 years?
• Is there a greater need for product commercialization to further scale the pharma contract sales market?
• Where is the pharma contract sales market heading and how can you ensure you are at the forefront of the market?
• What are the best investment options for new product and service lines?
• What are the key prospects for moving companies into a new growth path and C-suite?
You need to discover how this will impact the pharma contract sales market today, and over the next 10 years:
• Our 365-page report provides 174 tables and 202 charts/graphs exclusively to you.
• The report highlights key lucrative areas in the industry so you can target them – NOW.
• It contains an in-depth analysis of global, regional and national sales and growth.
• It highlights for you the key successful trends, changes, and revenue projections made by your competitors.
This report tells you TODAY how the pharma contract sales market will develop in the next 10 years, and in line with the variations in COVID-19 economic recession and bounce. This market is more critical now than at any point over the last 10 years.
Forecasts to 2032 and other analyses reveal commercial prospects
• In addition to revenue forecasting to 2032, our new study provides you with recent results, growth rates, and market shares.
• You will find original analyses, with business outlooks and developments.
• Discover qualitative analyses (including market dynamics, drivers, opportunities, restraints and challenges), cost structure, impact of rising pharma contract sales prices and recent developments.
This report includes data analysis and invaluable insight into how COVID-19 will affect the industry and your company. Four COVID-19 recovery patterns and their impact, namely, “V”, “L”, “W” and “U” are discussed in this report.
Segments Covered in the Report
Market Segment by Type
• Personal Promotion
• Non-Personal Promotion
• Co-Promotion
Market Segment by Personal Promotion
• Standard Field Force Roles
• Sales Deployment
• Vacancy Coverage
• HCP Educational Programs
• Key Account Management
• Other Personal Promotion Services
Market Segment by Non-Personal Promotion
• Contact Center
• Tele-detailing
• Medical Call Centers
• Telesampling
• Online Services
Market Segment by Therapeutics
• Cardiovascular Disease
• Metabolic Disorders
• Oncology
• Alzheimer’s Disease
• Diabetes
• Other Therapeutics
Market Segment by Marketing Research and Consulting
• Product Commercialization
• Territory Optimization & Alignment
• Brand Management
• Mature Product Line Support
• Rest All CSO Services

In addition to the revenue predictions for the overall world market and segments, you will also find revenue forecasts for four regional and 20 leading national markets:
North America
• U.S.
• Canada
Europe
• Germany
• Spain
• United Kingdom
• France
• Italy
• Rest of Europe
Asia Pacific
• China
• Japan
• India
• Australia
• South Korea
• Rest of Asia Pacific
Latin America
• Brazil
• Mexico
• Rest of Latin America
Middle East & Africa
• Turkey
• Saudi Arabia
• South Africa
• Rest of Middle East & Africa
Need industry data? Please contact us today.
The report also includes profiles and for some of the leading companies in the Pharma Contract Sales Market, 2022 to 2032, with a focus on this segment of these companies’ operations.
Leading companies and the potential for market growth
• Amplity Health
• Apodi Healthcare Limited
• CMIC Holdings Co., Ltd
• Granard Pharmaceuticals
• GTS Solution
• IQVIA Holdings Inc.
• MaBiCo
• Marvecs GmbH
• OnCall LLC
• Publicis Groupe SA
• QFR Solutions
• Sales Partnerships Inc.
• Sofip SA
• Syneos Health Inc.
• UDG Healthcare PLC
• Vanguard Pharma
Overall world revenue for Pharma Contract Sales Market, 2022 to 2032 in terms of value the market will surpass US$5,589.4 million in 2022, our work calculates. We predict strong revenue growth through to 2032. Our work identifies which organizations hold the greatest potential. Discover their capabilities, progress, and commercial prospects, helping you stay ahead.
How will the Pharma Contract Sales Market, 2022 to 2032 report help you?
In summary, our 360+ page report provides you with the following knowledge:
• Revenue forecasts to 2032 for Pharma Contract Sales Market, 2022 to 2032 Market, with forecasts for type, Personal Promotion, non- Personal Promotion, Marketing Research and Consulting, Therapeutics and company size, each forecast at a global and regional level – discover the industry’s prospects, finding the most lucrative places for investments and revenues.
• Revenue forecasts to 2032 for four regional and 20 key national markets – See forecasts for the Pharma Contract Sales Market, 2022 to 2032 market in North America, Europe, Asia-Pacific and LAMEA. Also forecasted is the market in the US, Canada, Mexico, Brazil, Germany, France, UK, Italy, China, India, Japan, and Australia among other prominent economies.
• Prospects for established firms and those seeking to enter the market – including company profiles for 16 of the major companies involved in the Pharma Contract Sales Market, 2022 to 2032.
Find quantitative and qualitative analyses with independent predictions. Receive information that only our report contains, staying informed with invaluable business intelligence.
Information found nowhere else
With our new report, you are less likely to fall behind in knowledge or miss out on opportunities. See how our work could benefit your research, analyses, and decisions. Visiongain’s study is for everybody needing commercial analyses for the Pharma Contract Sales Market, 2022 to 2032, market-leading companies. You will find data, trends and predictions.
To access the data contained in this document please email contactus@visiongain.com
Buy our report today Pharma Contract Sales Market Report 2022-2032: Forecasts by Type (Personal Promotion, Non-Personal Promotion, Co-Promotion), by Personal Promotion (Standard Field Force Roles, Sales Deployment, Vacancy Coverage, HCP Educational Programs, Key Account Management, Other), by Non-Personal Promotion (Contact Centre, Tele-detailing, Medical Call Centres, Tele-sampling, Online Services), by Therapeutics (Cardiovascular Disease, Metabolic Disorders, Oncology, Alzheimer’s Disease, Diabetes, Other), by Marketing Research and Consulting (Product Commercialisation, Territory Optimisation & Alignment, Brand Management, Mature Product Line Support, Rest All CSO Services) AND Regional and Leading National Market Analysis PLUS Analysis of Leading Companies AND COVID-19 Impact and Recovery Pattern Analysis. Avoid missing out by staying informed – order our report now.
Visiongain is a trading partner with the US Federal Government
CCR Ref number: KD4R6
Do you have any custom requirements we can help you with? Any need for a specific country, geo region, market segment or specific company information? Contact us today, we can discuss your needs and see how we can help: contactus@visiongain.com
1. Report Overview
1.1 Objectives of the Study
1.2 Introduction to Pharma Contract Sales Market
1.3 What This Report Delivers
1.4 Why You Should Read This Report
1.5 Key Questions Answered by This Analytical Report
1.6 Who is This Report for?
1.7 Methodology
1.7.1 Market Definitions
1.7.2 Market Evaluation & Forecasting Methodology
1.7.3 Data Validation
1.8 Frequently Asked Questions (FAQs)
1.9 Associated Visiongain Reports
1.10 About Visiongain
2 Executive Summary
2.1 Geographical Snapshot: Global Pharma Contract Sales Market
2.2 Type Segment: Market Attractiveness Index
2.3 Personal Promotion Segment: Market Attractiveness Index
2.4 Non-Personal Promotion Segment: Market Attractiveness Index
2.5 Co-promotion Segment: Market Attractiveness Index
2.6 Therapeutics Segment: Market Attractiveness Index
3 Market Overview
3.1 Market Dynamics
3.1.1 Market Driving Factors
3.1.2 Market Restraining Factors
3.1.3 Market Opportunities
3.2 Value Chain
3.2.1 Primary Activities in Pharmaceutical Value Chain Analysis
3.2.2 Support Activities in the Analysis of the Pharmaceutical Value Chain
3.3 COVID-19 Impact Analysis
3.4 Porter’s Five Forces Analysis
3.4.1 Supplier Power (Moderate)
3.4.2 Buyer Power (High)
3.4.3 Competitive Rivalry (High)
3.4.4 Threat from Substitutes (Low)
3.4.5 Threat of New Entrants (Moderate)
4 Global Pharma Contract Sales Market Analysis by Type
4.1 Key Findings
4.2 Global Market Outlook
4.3 Type Segment Growth Prospects
4.4 Global Pharma Contract Sales Market Share by Type, 2022 & 2032
4.5 Global Pharma Contract Sales Market by Type
4.6 Personal Promotion
4.6.1 Global Personal Promotion Market Forecast, 2022-2032
4.6.2 Global Personal Promotion Market Forecast by Region, 2022-2032
4.7 Non-Personal Promotion
4.7.1 Global Non-Personal Promotion Market Forecast, 2022-2032
4.7.2 Global Non-Personal Promotion Market Forecast by Region, 2022-2032
4.8 Co-Promotion
4.8.1 Global Co-Promotion Market Forecast, 2022-2032
4.8.2 Global Co-Promotion Market Forecast by Region, 2022-2032
5 Global Pharma Contract Sales Market Analysis by Personal Promotion
5.1 Key Findings
5.2 Personal Promotion Segment Growth Prospects
5.3 Global Pharma Contract Sales Market Share by Personal Promotion, 2022 & 2032
5.4 Global Pharma Contract Sales Market by Personal Promotion
5.5 Standard Field Force Teams
5.5.1 Global Standard Field Force Roles Market Forecast, 2022-2032
5.5.2 Global Standard Field Force Roles Market by Region Forecast, 2022-2032
5.6 Sale Deployment
5.6.1 Global Sales Deployment Market Forecast, 2022-2032
5.6.2 Global Sales Deployment Market by Region Forecast, 2022-2032
5.7 Vacancy Coverage
5.7.1 Global Vacancy Coverage Market Forecast, 2022-2032
5.7.2 Global Vacancy Coverage Market by Region Forecast, 2022-2032
5.8 HCP Educational Programs
5.8.1 Global HCP Educational Programs Market Forecast, 2022-2032
5.8.2 Global HCP Educational Programs Market by Region Forecast, 2022-2032
5.9 Key Account Management
5.9.1 Global Key Account Management Market Forecast, 2022-2032
5.9.2 Global Key Account Management Market by Region Forecast, 2022-2032
5.10 Other Personal Promotion
5.10.1 Global Other Personal Promotion Services Market Forecast, 2022-2032
5.10.2 Global Other Personal Promotion Services Market by Region Forecast, 2022-2032
6 Global Pharma Contract Sales Market Analysis by Non-Personal Promotion
6.1 Key Findings
6.2 Segment Overview
6.3 Non-Personal Promotion Segment Growth Prospects
6.4 Global Pharma Contract Sales Market Share by Non-Personal Promotion, 2022 & 2032
6.5 Global Pharma Contract Sales Market by Non-Personal Promotion
6.6 Contact Center
6.6.1 Global Contact Centre Market Forecast, 2022-2032
6.6.2 Global Contact Centre Market by Region Forecast, 2022-2032
6.7 Tele-Detailing
6.7.1 Global Tele-detailing Market Forecast, 2022-2032
6.7.2 Global Tele-detailing Market by Region Forecast, 2022-2032
6.8 Medical Call Center
6.8.1 Global Medical Call Centres Market Forecast, 2022-2032
6.8.2 Global Medical Call Centres Market by Region Forecast, 2022-2032
6.9 Tele-sampling
6.9.1 Global Tele-sampling Market Forecast, 2022-2032
6.9.2 Global Tele-sampling Market by Region Forecast, 2022-2032
6.10 Online Services
6.10.1 Global Online Services Market Forecast, 2022-2032
6.10.2 Global Online Services Market by Region Forecast, 2022-2032
7 Global Pharma Contract Sales Market Analysis by Co-Promotion
7.1 Key Findings
7.2 Commercial Aspects
7.3 Co-Promotion Segment Growth Prospects
7.4 Global Pharma Contract Sales Market Share by Co-Promotion, 2022 & 2032
7.5 Global Pharma Contract Sales Market by Co-Promotion
7.6 Marketing Research and Consulting
7.6.1 Global Marketing Research and Consulting Market Forecast, 2022-2032
7.6.2 Global Marketing Research and Consulting Market by Region Forecast, 2022-2032
7.7 Product Commercialization
7.7.1 Global Product Commercialization Market Forecast, 2022-2032
7.7.2 Global Product Commercialization Market by Region Forecast, 2022-2032
7.8 Territory Optimization & Alignment
7.8.1 Global Territory Optimization & Alignment Market Forecast, 2022-2032
7.8.2 Global Territory Optimization & Alignment Market by Region Forecast, 2022-2032
7.9 Brand Management
7.9.1 Global Brand Management Market Forecast, 2022-2032
7.9.2 Global Brand Management Market by Region Forecast, 2022-2032
7.10 Mature Product Line Support
7.10.1 Global Mature Product Line Support Market Forecast, 2022-2032
7.10.2 Global Mature Product Line Support Market by Region Forecast, 2022-2032
7.11 Rest All CSO Services
7.11.1 Global Rest All CSO Services Market Forecast, 2022-2032
7.11.2 Global Rest All CSO Services Market by Region Forecast, 2022-2032
8 Global Pharma Contract Sales Market Analysis by Therapeutics
8.1 Key Findings
8.2 Commercial Aspects
8.3 Therapeutics Segment Growth Prospects
8.4 Global Pharma Contract Sales Market Share by Therapeutics, 2022 & 2032
8.5 Global Pharma Contract Sales Market by Therapeutics
8.6 Cardiovascular Disease
8.6.1 Global Cardiovascular Disease Market Forecast, 2022-2032
8.6.2 Global Cardiovascular Disease Market by Region Forecast, 2022-2032
8.7 Metabolic Disorders
8.7.1 Global Metabolic Disorders Market Forecast, 2022-2032
8.7.2 Global Metabolic Disorders Market by Region Forecast, 2022-2032
8.8 Oncology
8.8.1 Global Oncology Market Forecast, 2022-2032
8.8.2 Global Oncology Market by Region Forecast, 2022-2032
8.9 Alzheimer's Disease
8.9.1 Global Alzheimer's Disease Market Forecast, 2022-2032
8.9.2 Global Alzheimer's Disease Market by Region Forecast, 2022-2032
8.10 Diabetes
8.10.1 Global Diabetes Market Forecast, 2022-2032
8.10.2 Global Diabetes Market by Region Forecast, 2022-2032
8.11 Other Therapeutics
8.11.1 Global Other Therapeutics Market Forecast, 2022-2032
8.11.2 Global Other Therapeutics Market by Region Forecast, 2022-2032
9 Global Pharma Contract Sales Market Analysis, by Region
9.1 Key Findings
9.2 Global Market Outlook
9.3 Region Segment Growth Prospects
9.4 Global Pharma Contract Sales Market Share by Region, 2022 & 2032
9.5 Global Pharma Contract Sales Market Size Estimation and Forecast
9.5.1 Pre-COVID-19 Market Scenario
9.5.2 Post-COVID-19 Market Scenarios (V, W, U, L-Shaped Recovery Analysis)
9.6 Global Pharma Contract Sales Market Size Estimation and Forecast, by Region
9.6.1 Pre-COVID-19 Market Scenario
9.6.2 Post-COVID-19 Market Scenarios (V, W, U, L-Shaped Recovery Analysis)
10 North America Pharma Contract Sales Market Analysis
10.1 Key Findings
10.2 North America Pharma Contract Sales Market Attractiveness Index
10.3 North America Pharma Contract Sales Market Size Estimation and Forecast by Value
10.4 North America Pharma Contract Sales Market Size Estimation and Forecast by Country
10.5 North America Pharma Contract Sales Market Size Estimation and Forecast by Type
10.6 North America Pharma Contract Sales Market Size Estimation and Forecast by Personal Promotion
10.7 North America Pharma Contract Sales Market Size Estimation and Forecast by Non-Personal Promotion
10.8 North America Pharma Contract Sales Market Size Estimation and Forecast by Co-Promotion
10.9 North America Pharma Contract Sales Market Size Estimation and Forecast by Therapeutics
10.10 U.S.
10.10.1 U.S. Pharma Contract Sales Market by Value
10.11 Canada
10.11.1 Canada Pharma Contract Sales Market by Value
11 Europe Pharma Contract Sales Market Analysis
11.1 Key Findings
11.2 Europe Pharma Contract Sales Market Attractiveness Index
11.3 Europe Pharma Contract Sales Market Size Estimation and Forecast by Value
11.4 Europe Pharma Contract Sales Market Size Estimation and Forecast by Country
11.5 Europe Pharma Contract Sales Market Size Estimation and Forecast by Type
11.6 Europe Pharma Contract Sales Market Size Estimation and Forecast by Personal Promotion
11.7 Europe Pharma Contract Sales Market Size Estimation and Forecast by Non-Personal Promotion
11.8 Europe Pharma Contract Sales Market Size Estimation and Forecast by Co-Promotion
11.9 Europe Pharma Contract Sales Market Size Estimation and Forecast by Therapeutics
11.10 Germany
11.10.1 Germany Pharma Contract Sales Market by Value
11.11 UK
11.11.1 UK Pharma Contract Sales Market by Value
11.12 France
11.12.1 France Pharma Contract Sales Market by Value
11.13 Italy
11.13.1 Italy Pharma Contract Sales Market by Value
11.14 Spain
11.14.1 Spain Pharma Contract Sales Market by Value
11.15 Rest of Europe
11.15.1 Rest of Europe Pharma Contract Sales Market by Value
12 Asia-Pacific Pharma Contract Sales Market Analysis
12.1 Key Findings
12.2 Asia-Pacific Pharma Contract Sales Market Attractiveness Index
12.3 Asia-Pacific Pharma Contract Sales Market Size Estimation and Forecast by Value
12.4 Asia-Pacific Pharma Contract Sales Market Size Estimation and Forecast by Country
12.5 Asia-Pacific Pharma Contract Sales Market Size Estimation and Forecast by Type
12.6 Asia-Pacific Pharma Contract Sales Market Size Estimation and Forecast by Personal Promotion
12.7 Asia-Pacific Pharma Contract Sales Market Size Estimation and Forecast by Non-Personal Promotion
12.8 Asia-Pacific Pharma Contract Sales Market Size Estimation and Forecast by Co-Promotion
12.9 Asia-Pacific Pharma Contract Sales Market Size Estimation and Forecast by Therapeutics
12.10 China
12.10.1 China Pharma Contract Sales Market by Value
12.11 India
12.11.1 India Pharma Contract Sales Market by Value
12.12 Japan
12.12.1 Japan Pharma Contract Sales Market by Value
12.13 South Korea
12.13.1 South Korea Pharma Contract Sales Market by Value
12.14 Australia
12.14.1 Australia Pharma Contract Sales Market by Value
12.15 Rest of Asia-Pacific
12.15.1 Rest of Asia-Pacific Pharma Contract Sales Market by Value
13 Middle East & Africa Pharma Contract Sales Market Analysis
13.1 Key Findings
13.2 Middle East & Africa Pharma Contract Sales Market Attractiveness Index
13.3 Middle East & Africa Pharma Contract Sales Market Size Estimation and Forecast by Value
13.4 Middle East & Africa Pharma Contract Sales Market Size Estimation and Forecast by Country
13.5 Middle East & Africa Pharma Contract Sales Market Size Estimation and Forecast by Type
13.6 Middle East & Africa Pharma Contract Sales Market Size Estimation and Forecast by Personal Promotion
13.7 Middle East & Africa Pharma Contract Sales Market Size Estimation and Forecast by Non-Personal Promotion
13.8 Middle East & Africa Pharma Contract Sales Market Size Estimation and Forecast by Co-Promotion
13.9 Middle East & Africa Pharma Contract Sales Market Size Estimation and Forecast by Therapeutics
13.10 South Africa
13.10.1 South Africa Pharma Contract Sales Market by Value
13.11 Saudi Arabia
13.11.1 Saudi Arabia Pharma Contract Sales Market by Value
13.12 Turkey
13.12.1 Turkey Pharma Contract Sales Market by Value
13.13 Rest of MEA
13.13.1 Rest of MEA Pharma Contract Sales Market by Value
14 South America Pharma Contract Sales Market Analysis
14.1 Key Findings
14.2 South America Pharma Contract Sales Market Attractiveness Index
14.3 South America Pharma Contract Sales Market Size Estimation and Forecast by Value
14.4 South America Pharma Contract Sales Market Size Estimation and Forecast by Country
14.5 South America Pharma Contract Sales Market Size Estimation and Forecast by Type
14.6 South America Pharma Contract Sales Market Size Estimation and Forecast by Personal Promotion
14.7 South America Pharma Contract Sales Market Size Estimation and Forecast by Non-Personal Promotion
14.8 South America Pharma Contract Sales Market Size Estimation and Forecast by Co-Promotion
14.9 South America Pharma Contract Sales Market Size Estimation and Forecast by Therapeutics
14.10 Brazil
14.10.1 Brazil Pharma Contract Sales Market by Value
14.11 Mexico
14.11.1 Mexico Pharma Contract Sales Market by Value
14.12 Rest of South America
14.12.1 Rest of South America Pharma Contract Sales Market by Value
15 Competitive Landscape
15.1 Company Share Analysis
15.2 New Product/Service Launch as the Key Business Strategy in the Global Market
15.3 Acquisition as the Key Business Strategy in the Global Market
15.4 Partnership as the Key Business Strategy in the Global Market
15.5 Collaboration as the Key Business Strategy in the Global Market
15.6 Expansion as the Key Business Strategy in the Global Market
15.7 Agreement as the Key Business Strategy in the Global Market
15.8 Contract as the Key Business Strategy in the Global Market
16 Company Profiles
16.1 Apodi Healthcare Limited
16.1.1 Company Snapshot
16.1.2 Company Overview
16.1.3 Product Benchmarking
16.2 CMIC Holdings Co., Ltd
16.2.1 Company Snapshot
16.2.2 Company Overview
16.2.3 Financial Analysis
16.2.4 Product Benchmarking
16.2.5 Strategic Outlook
16.3 Syneos Health Inc.
16.3.1 Company Snapshot
16.3.2 Company Overview
16.3.3 Financial Analysis
16.3.4 Product Benchmarking
16.3.5 Strategic Outlook
16.4 IQVIA Holdings Inc.
16.4.1 Company Snapshot
16.4.2 Company Overview
16.4.3 Financial Analysis
16.4.4 Product Benchmarking
16.4.5 Strategic Outlook
16.5 Marvecs GmbH
16.5.1 Company Snapshot
16.5.2 Company Overview
16.5.3 Product Benchmarking
16.6 OnCall LLC
16.6.1 Company Snapshot
16.6.2 Company Overview
16.6.3 Product Benchmarking
16.7 Publicis Groupe SA
16.7.1 Company Snapshot
16.7.2 Company Overview
16.7.3 Financial Analysis
16.7.4 Product Benchmarking
16.7.5 Strategic Outlook
16.8 Sofip SA
16.8.1 Company Snapshot
16.8.2 Company Overview
16.8.3 Product Benchmarking
16.9 UDG Healthcare PLC
16.9.1 Company Snapshot
16.9.2 Company Overview
16.9.3 Financial Analysis
16.9.4 Product Benchmarking
16.9.5 Strategic Outlook
16.10 Amplity Health
16.10.1 Company Snapshot
16.10.2 Company Overview
16.10.3 Product Benchmarking
16.10.4 Strategic Outlook
16.11 Granard Pharmaceuticals
16.11.1 Company Snapshot
16.11.2 Company Overview
16.11.3 Product Benchmarking
16.12 Vanguard Pharma
16.12.1 Company Snapshot
16.12.2 Company Overview
16.12.3 Product Benchmarking
16.13 GTS Solution
16.13.1 Company Snapshot
16.13.2 Company Overview
16.13.3 Product Benchmarking
16.14 MaBiCo (Contract Sales Organization)
16.14.1 Company Snapshot
16.14.2 Company Overview
16.14.3 Product Benchmarking
16.15 Sales Partnerships Inc.
16.15.1 Company Snapshot
16.15.2 Company Overview
16.15.3 Product Benchmarking
16.16 QFR Solutions
16.16.1 Company Snapshot
16.16.2 Company Overview
16.16.3 Product Benchmarking
17 Conclusion and Recommendations
17.1 Concluding Remarks from Visiongain
17.2 Recommendations for Market Players
List of Tables
Table 1 Global Pharma Contract Sales Market Snapshot, 2022 & 2032 (US million, CAGR %)
Table 2 Global Pharma Contract Sales Market by Region, 2022-2032 (US$ Million, AGR (%), CAGR (%)) (V-Shaped Recovery Scenario)
Table 3 Global Pharma Contract Sales Market by Region, 2022-2032 (US$ Million, AGR (%), CAGR (%)) (U-Shaped Recovery Scenario)
Table 4 Global Pharma Contract Sales Market by Region, 2022-2032 (US$ Million, AGR (%), CAGR (%)) (W-Shaped Recovery Scenario)
Table 5 Global Pharma Contract Sales Market by Region, 2022-2032 (US$ Million, AGR (%), CAGR (%)) (L-Shaped Recovery Scenario)
Table 6 Global Pharma Contract Sales Market by Type, 2022-2032 (US$ Million, AGR (%), CAGR (%))
Table 7 Global Personal Promotion Market Forecast, 2022-2032 (US$ Million, AGR (%), CAGR (%))
Table 8 Global Personal Promotion Market by Region, 2022-2032 (US$ Million, AGR (%), CAGR (%))
Table 9 Global Non-Personal Promotion Market Forecast, 2022-2032 (US$ Million, AGR (%), CAGR (%))
Table 10 Global Non-Personal Promotion Market by Region, 2022-2032 (US$ Million, AGR (%), CAGR (%))
Table 11 Global Co-Promotion Market Forecast, 2022-2032 (US$ Million, AGR (%), CAGR (%))
Table 12 Global Co-Promotion Market by Region, 2022-2032 (US$ Million, AGR (%), CAGR (%))
Table 13 Global Pharma Contract Sales Market by Personal Promotion, 2022-2032 (US$ Million, AGR (%), CAGR (%))
Table 14 Global Standard Field Force Roles Market Forecast, 2022-2032 (US$ Million, AGR (%), CAGR (%))
Table 15 Global Standard Field Force Roles Market by Region, 2022-2032 (US$ Million, AGR (%), CAGR (%))
Table 16 Global Sales Deployment Market Forecast, 2022-2032 (US$ Million, AGR (%), CAGR (%))
Table 17 Global Sales Deployment Market by Region, 2022-2032 (US$ Million, AGR (%), CAGR (%))
Table 18 Global Vacancy Coverage Market Forecast, 2022-2032 (US$ Million, AGR (%), CAGR (%))
Table 19 Global Vacancy Coverage Market by Region, 2022-2032 (US$ Million, AGR (%), CAGR (%))
Table 20 Global HCP Educational Programs Market Forecast, 2022-2032 (US$ Million, AGR (%), CAGR (%))
Table 21 Global HCP Educational Programs Market by Region, 2022-2032 (US$ Million, AGR (%), CAGR (%))
Table 22 Global HCP Educational Programs Market by Region, 2022-2032 (US$ Million)
Table 23 Global Key Account Management Market Forecast, 2022-2032 (US$ Million, AGR (%), CAGR (%))
Table 24 Global Key Account Management Market by Region, 2022-2032 (US$ Million, AGR (%), CAGR (%))
Table 25 Global Other Personal Promotion Services Market Forecast, 2022-2032 (US$ Million, AGR (%), CAGR (%))
Table 26 Global Other Personal Promotion Services Market by Region, 2022-2032 (US$ Million, AGR (%), CAGR (%))
Table 27 Global Pharma Contract Sales Market by Non-Personal Promotion, 2022-2032 (US$ Million, AGR (%), CAGR (%))
Table 28 Global Contact Center Market Forecast, 2022-2032 (US$ Million, AGR (%), CAGR (%))
Table 29 Global Contact Center Market by Region, 2022-2032 (US$ Million, AGR (%), CAGR (%))
Table 30 Global Tele-detailing Market Forecast, 2022-2032 (US$ Million, AGR (%), CAGR (%))
Table 31 Global Tele-detailing Market by Region, 2022-2032 (US$ Million, AGR (%), CAGR (%))
Table 32 Global Medical Call Centers Market Forecast, 2022-2032 (US$ Million, AGR (%), CAGR (%))
Table 33 Global Medical Call Centers Market by Region, 2022-2032 (US$ Million, AGR (%), CAGR (%))
Table 34 Global Tele-sampling Market Forecast, 2022-2032 (US$ Million, AGR (%), CAGR (%))
Table 35 Global Tele-sampling Market by Region, 2022-2032 (US$ Million, AGR (%), CAGR (%))
Table 36 Global Online Services Market Forecast, 2022-2032 (US$ Million, AGR (%), CAGR (%))
Table 37 Global Online Services Market by Region, 2022-2032 (US$ Million, AGR (%), CAGR (%))
Table 38 Global Pharma Contract Sales Market by Co-promotion, 2022-2032 (US$ Million, AGR (%), CAGR (%))
Table 39 Global Marketing Research and Consulting Market Forecast, 2022-2032 (US$ Million, AGR (%), CAGR (%))
Table 40 Global Marketing Research and Consulting Market by Region, 2022-2032 (US$ Million, AGR (%), CAGR (%))
Table 41 Global Product Commercialization Market Forecast, 2022-2032 (US$ Million, AGR (%), CAGR (%))
Table 42 Global Product Commercialization Market by Region, 2022-2032 (US$ Million, AGR (%), CAGR (%))
Table 43 Global Territory Optimization & Alignment Market Forecast, 2022-2032 (US$ Million, AGR (%), CAGR (%))
Table 44 Global Territory Optimization & Alignment Market by Region, 2022-2032 (US$ Million, AGR (%), CAGR (%))
Table 45 Global Brand Management Market Forecast, 2022-2032 (US$ Million, AGR (%), CAGR (%))
Table 46 Global Brand Management Market by Region, 2022-2032 (US$ Million, AGR (%), CAGR (%))
Table 47 Global Mature Product Line Support Market Forecast, 2022-2032 (US$ Million, AGR (%), CAGR (%))
Table 48 Global Mature Product Line Support Market by Region, 2022-2032 (US$ Million, AGR (%), CAGR (%))
Table 49 Global Rest All CSO Services Market Forecast, 2022-2032 (US$ Million, AGR (%), CAGR (%))
Table 50 Global Rest All CSO Services Market by Region, 2022-2032 (US$ Million, AGR (%), CAGR (%))
Table 51 Global Pharma Contract Sales Market by Therapeutics, 2022-2032 (US$ Million, AGR (%), CAGR (%))
Table 52 Global Cardiovascular Disease Market Forecast, 2022-2032 (US$ Million, AGR (%), CAGR (%))
Table 53 Global Cardiovascular Disease Market by Region, 2022-2032 (US$ Million, AGR (%), CAGR (%))
Table 54 Global Metabolic Disorders Market Forecast, 2022-2032 (US$ Million, AGR (%), CAGR (%))
Table 55 Global Metabolic Disorders Market by Region, 2022-2032 (US$ Million, AGR (%), CAGR (%))
Table 56 Global Oncology Market Forecast, 2022-2032 (US$ Million, AGR (%), CAGR (%))
Table 57 Global Oncology Market by Region, 2022-2032 (US$ Million, AGR (%), CAGR (%))
Table 58 Global Alzheimer's Disease Market Forecast, 2022-2032 (US$ Million, AGR (%), CAGR (%))
Table 59 Global Alzheimer's Disease Market by Region, 2022-2032 (US$ Million, AGR (%), CAGR (%))
Table 60 Global Diabetes Market Forecast, 2022-2032 (US$ Million, AGR (%), CAGR (%))
Table 61 Global Diabetes Market by Region, 2022-2032 (US$ Million, AGR (%), CAGR (%))
Table 62 Global Other Therapeutics Market Forecast, 2022-2032 (US$ Million, AGR (%), CAGR (%))
Table 63 Global Other Therapeutics Market by Region, 2022-2032 (US$ Million, AGR (%), CAGR (%))
Table 64 Global Pharma Contract Sales Market Forecast, 2022-2032 (US$ Million, AGR (%), CAGR (%))
Table 65 Global Pharma Contract Sales Market Forecast, 2022-2032 (US$ Million, AGR (%), CAGR (%)) (V-Shaped Recovery Scenario)
Table 66 Global Pharma Contract Sales Market Forecast, 2022-2032 (US$ Million, AGR (%), CAGR (%)) (W-Shaped Recovery Scenario)
Table 67 Global Pharma Contract Sales Market Forecast, 2022-2032 (US$ Million, AGR (%), CAGR (%)) (U-Shaped Recovery Scenario)
Table 68 Global Pharma Contract Sales Market Forecast, 2022-2032 (US$ Million, AGR (%), CAGR (%)) (L-Shaped Recovery Scenario)
Table 69 Global Pharma Contract Sales Market by Region, 2022-2032 (US$ Million, AGR (%), CAGR (%))
Table 70 Global Pharma Contract Sales Market by Region, 2022-2032 (US$ Million, AGR (%), CAGR (%)) (V-Shaped Recovery Scenario)
Table 71 Global Pharma Contract Sales Market by Region, 2022-2032 (US$ Million, AGR (%), CAGR (%)) (W-Shaped Recovery Scenario)
Table 72 Global Pharma Contract Sales Market by Region, 2022-2032 (US$ Million, AGR (%), CAGR (%)) (U-Shaped Recovery Scenario)
Table 73 Global Pharma Contract Sales Market by Region, 2022-2032 (US$ Million, AGR (%), CAGR (%)) (L-Shaped Recovery Scenario)
Table 74 North America Pharma Contract Sales Market by Value, 2022-2032 (US$ Million, AGR (%), CAGR (%))
Table 75 North America Pharma Contract Sales Market by Country, 2022-2032 (US$ Million, AGR (%), CAGR (%))
Table 76 North America Pharma Contract Sales Market by Type, 2022-2032 (US$ Million, AGR (%), CAGR (%))
Table 77 North America Pharma Contract Sales Market by Personal Promotion, 2022-2032 (US$ Million, AGR (%), CAGR (%))
Table 78 North America Pharma Contract Sales Market by Non-Personal Promotion, 2022-2032 (US$ Million, AGR (%), CAGR (%))
Table 79 North America Pharma Contract Sales Market by Co-promotion, 2022-2032 (US$ Million, AGR (%), CAGR (%))
Table 80 North America Pharma Contract Sales Market by Therapeutics, 2022-2032 (US$ Million, AGR (%), CAGR (%))
Table 81 U.S. Pharma Contract Sales Market by Value, 2022-2032 (US$ Million, AGR (%), CAGR (%))
Table 82 Canada Pharma Contract Sales Market by Value, 2022-2032 (US$ Million, AGR (%), CAGR (%))
Table 83 Europe Pharma Contract Sales Market by Value, 2022-2032 (US$ Million, AGR (%), CAGR (%))
Table 84 Europe Pharma Contract Sales Market by Country, 2022-2032 (US$ Million, AGR (%), CAGR (%))
Table 85 Europe Pharma Contract Sales Market by Type, 2022-2032 (US$ Million, AGR (%), CAGR (%))
Table 86 Europe Pharma Contract Sales Market by Personal Promotion, 2022-2032 (US$ Million, AGR (%), CAGR (%))
Table 87 Europe Pharma Contract Sales Market by Non-Personal Promotion, 2022-2032 (US$ Million, AGR (%), CAGR (%))
Table 88 Europe Pharma Contract Sales Market by Co-promotion, 2022-2032 (US$ Million, AGR (%), CAGR (%))
Table 89 Europe Pharma Contract Sales Market by Therapeutics, 2022-2032 (US$ Million, AGR (%), CAGR (%))
Table 90 Germany Pharma Contract Sales Market by Value, 2022-2032 (US$ Million, AGR (%), CAGR (%))
Table 91 UK Pharma Contract Sales Market by Value, 2022-2032 (US$ Million, AGR (%), CAGR (%))
Table 92 France Pharma Contract Sales Market by Value, 2022-2032 (US$ Million, AGR (%), CAGR (%))
Table 93 Italy Pharma Contract Sales Market by Value, 2022-2032 (US$ Million, AGR (%), CAGR (%))
Table 94 Spain Pharma Contract Sales Market by Value, 2022-2032 (US$ Million, AGR (%), CAGR (%))
Table 95 Rest of Europe Pharma Contract Sales Market by Value, 2022-2032 (US$ Million, AGR (%), CAGR (%))
Table 96 Asia-Pacific Pharma Contract Sales Market by Value, 2022-2032 (US$ Million, AGR (%), CAGR (%))
Table 97 Asia-Pacific Pharma Contract Sales Market by Country, 2022-2032 (US$ Million, AGR (%), CAGR (%))
Table 98 Asia-Pacific Pharma Contract Sales Market by Type, 2022-2032 (US$ Million, AGR (%), CAGR (%))
Table 99 Asia-Pacific Pharma Contract Sales Market by Personal Promotion, 2022-2032 (US$ Million, AGR (%), CAGR (%))
Table 100 Asia-Pacific Pharma Contract Sales Market by Non-Personal Promotion, 2022-2032 (US$ Million, AGR (%), CAGR (%))
Table 101 Asia-Pacific Pharma Contract Sales Market by Co-promotion, 2022-2032 (US$ Million, AGR (%), CAGR (%))
Table 102 Asia-Pacific Pharma Contract Sales Market by Therapeutics, 2022-2032 (US$ Million, AGR (%), CAGR (%))
Table 103 China Pharma Contract Sales Market by Value, 2022-2032 (US$ Million, AGR (%), CAGR (%))
Table 104 India Pharma Contract Sales Market by Value, 2022-2032 (US$ Million, AGR (%), CAGR (%))
Table 105 Japan Pharma Contract Sales Market by Value, 2022-2032 (US$ Million, AGR (%), CAGR (%))
Table 106 South Korea Pharma Contract Sales Market by Value, 2022-2032 (US$ Million, AGR (%), CAGR (%))
Table 107 Australia Pharma Contract Sales Market by Value, 2022-2032 (US$ Million, AGR (%), CAGR (%))
Table 108 Rest of Asia-Pacific Pharma Contract Sales Market by Value, 2022-2032 (US$ Million, AGR (%), CAGR (%))
Table 109 Middle East & Africa Pharma Contract Sales Market by Value, 2022-2032 (US$ Million, AGR (%), CAGR (%))
Table 110 Middle East & Africa Pharma Contract Sales Market by Country, 2022-2032 (US$ Million, AGR (%), CAGR (%))
Table 111 Middle East & Africa Pharma Contract Sales Market by Type, 2022-2032 (US$ Million, AGR (%), CAGR (%))
Table 112 Middle East & Africa Pharma Contract Sales Market by Personal Promotion, 2022-2032 (US$ Million, AGR (%), CAGR (%))
Table 113 Middle East & Africa Pharma Contract Sales Market by Non-Personal Promotion, 2022-2032 (US$ Million, AGR (%), CAGR (%))
Table 114 Middle East & Africa Pharma Contract Sales Market by Co-promotion, 2022-2032 (US$ Million, AGR (%), CAGR (%))
Table 115 Middle East & Africa Pharma Contract Sales Market by Therapeutics, 2022-2032 (US$ Million, AGR (%), CAGR (%))
Table 116 South Africa Pharma Contract Sales Market by Value, 2022-2032 (US$ Million, AGR (%), CAGR (%))
Table 117 Saudi Arabia Pharma Contract Sales Market by Value, 2022-2032 (US$ Million, AGR (%), CAGR (%))
Table 118 Turkey Pharma Contract Sales Market by Value, 2022-2032 (US$ Million, AGR (%), CAGR (%))
Table 119 Rest of Middle East & Africa Pharma Contract Sales Market by Value, 2022-2032 (US$ Million, AGR (%), CAGR (%))
Table 120 South America Pharma Contract Sales Market by Value, 2022-2032 (US$ Million, AGR (%), CAGR (%))
Table 121 South America Pharma Contract Sales Market by Country, 2022-2032 (US$ Million, AGR (%), CAGR (%))
Table 122 South America Pharma Contract Sales Market by Type, 2022-2032 (US$ Million, AGR (%), CAGR (%))
Table 123 South America Pharma Contract Sales Market by Personal Promotion, 2022-2032 (US$ Million, AGR (%), CAGR (%))
Table 124 South America Pharma Contract Sales Market by Non-Personal Promotion, 2022-2032 (US$ Million, AGR (%), CAGR (%))
Table 125 South America Pharma Contract Sales Market by Co-promotion, 2022-2032 (US$ Million, AGR (%), CAGR (%))
Table 126 South America Pharma Contract Sales Market by Therapeutics, 2022-2032 (US$ Million, AGR (%), CAGR (%))
Table 127 Brazil Pharma Contract Sales Market by Value, 2022-2032 (US$ Million, AGR (%), CAGR (%))
Table 128 Mexico Pharma Contract Sales Market by Value, 2022-2032 (US$ Million, AGR (%), CAGR (%))
Table 129 Rest of South America Pharma Contract Sales Market by Value, 2022-2032 (US$ Million, AGR (%), CAGR (%))
Table 130 New Product Launch Business Strategies Adopted by Key Players in Global Pharma Contract Sales Market
Table 131 Acquisition Business Strategies Adopted by Key Players in Global Pharma Contract Sales Market
Table 132 Partnership Strategy Adopted by Key Players in Global Pharma Contract Sales Market, 2018-2021
Table 133 Collaboration Business Strategies Adopted by Key Players in Global Pharma Contract Sales Market
Table 134 Expansion Business Strategies Adopted by Key Players in Global Pharma Contract Sales Market
Table 135 Agreement Business Strategies Adopted by Key Players in Global Pharma Contract Sales Market
Table 136 Contract Business Strategies Adopted by Key Players in Global Pharma Contract Sales Market
Table 137 Apodi Healthcare Limited: Key Details, (CEO, HQ, Revenue, Founded, No. of Employees, Company Type, Website, Business Segment)
Table 138 Apodi Healthcare Limited: Product Benchmarking
Table 139 CMIC Holdings Co., Ltd: Key Details, (CEO, HQ, Revenue, Founded, No. of Employees, Company Type, Website, Business Segment)
Table 140 CMIC Holdings Co., Ltd: Product Benchmarking
Table 141 CMIC Holdings Co., Ltd: Strategic Outlook
Table 142 Syneos Health Inc.: Key Details, (CEO, HQ, Revenue, Founded, No. of Employees, Company Type, Website, Business Segment)
Table 143 Syneos Health Inc.: Product Benchmarking
Table 144 Syneos Health Inc.: Strategic Outlook
Table 145 IQVIA Holdings Inc.: Key Details, (CEO, HQ, Revenue, Founded, No. of Employees, Company Type, Website, Business Segment)
Table 146 IQVIA Holdings Inc.: Product Benchmarking
Table 147 IQVIA Holdings Inc.: Strategic Outlook
Table 148 Marvecs GmbH: Key Details, (CEO, HQ, Revenue, Founded, No. of Employees, Company Type, Website, Business Segment)
Table 149 Marvecs GmbH: Product Benchmarking
Table 150 OnCall LLC: Key Details, (CEO, HQ, Revenue, Founded, No. of Employees, Company Type, Website, Business Segment)
Table 151 OnCall LLC: Product Benchmarking
Table 152 Publicis Groupe SA: Key Details, (CEO, HQ, Revenue, Founded, No. of Employees, Company Type, Website, Business Segment)
Table 153 Publicis Groupe SA: Product Benchmarking
Table 154 Publicis Groupe SA: Strategic Outlook
Table 155 Sofip SA: Key Details, (CEO, HQ, Revenue, Founded, No. of Employees, Company Type, Website, Business Segment)
Table 156 Sofip SA: Product Benchmarking
Table 157 UDG Healthcare PLC: Key Details, (CEO, HQ, Revenue, Founded, No. of Employees, Company Type, Website, Business Segment)
Table 158 UDG Healthcare PLC: Product Benchmarking
Table 159 UDG Healthcare PLC: Strategic Outlook
Table 160 Amplity Health: Key Details, (CEO, HQ, Revenue, Founded, No. of Employees, Company Type, Website, Business Segment)
Table 161 Amplity Health: Product Benchmarking
Table 162 Amplity Health: Strategic Outlook
Table 163 Granard Pharmaceuticals: Key Details, (CEO, HQ, Revenue, Founded, No. of Employees, Company Type, Website, Business Segment)
Table 164 Granard Pharmaceuticals: Product Benchmarking
Table 165 Vanguard Pharma: Key Details, (CEO, HQ, Revenue, Founded, No. of Employees, Company Type, Website, Business Segment)
Table 166 Vanguard Pharma: Product Benchmarking
Table 167 GTS Solution: Key Details, (CEO, HQ, Revenue, Founded, No. of Employees, Company Type, Website, Business Segment)
Table 168 GTS Solution: Product Benchmarking
Table 169 MaBiCo (Contract Sales Organization): Key Details, (CEO, HQ, Revenue, Founded, No. of Employees, Company Type, Website, Business Segment)
Table 170 MaBiCo (Contract Sales Organization): Product Benchmarking
Table 171 Sales Partnerships Inc.: Key Details, (CEO, HQ, Revenue, Founded, No. of Employees, Company Type, Website, Business Segment)
Table 172 Sales Partnerships Inc.: Product Benchmarking
Table 173 QFR Solutions: Key Details, (CEO, HQ, Revenue, Founded, No. of Employees, Company Type, Website, Business Segment)
Table 174 QFR Solutions: Product Benchmarking
List of Figures
Figure 1 Global Pharma Contract Sales Market Segmentation
Figure 2 Global Pharma Contract Sales Market Forecast by Region: Market Attractiveness Index
Figure 3 Global Pharma Contract Sales Market by Type: Market Attractiveness Index
Figure 4 Global Pharma Contract Sales Market by Personal Promotion: Market Attractiveness Index
Figure 5 Global Pharma Contract Sales Market by Non-Personal Promotion: Market Attractiveness Index
Figure 6 Global Pharma Contract Sales Market by Co-promotion: Market Attractiveness Index
Figure 7 Global Pharma Contract Sales Market by Therapeutics: Market Attractiveness Index
Figure 8 Global Pharma Contract Sales Market: Market Dynamics
Figure 9 Global COVID Impact Analysis: Pharma Contract Sales Market Recovery Scenarios
Figure 10 Global Pharma Contract Sales Market by Region, 2022-2032 (US$ Million, AGR (%)): “V” Shaped Recovery
Figure 11 Global Pharma Contract Sales Market by Region, 2022-2032 (US$ Million, AGR (%)): “U” Shaped Recovery
Figure 12 Global Pharma Contract Sales Market by Region, 2022-2032 (US$ Million, AGR (%)): “W” Shaped Recovery
Figure 13 Global Pharma Contract Sales Market by Region, 2022-2032 (US$ Million, AGR (%)): “L” Shaped Recovery
Figure 14 Global Pharma Contract Sales Market: Porter’s Five Forces Analysis
Figure 15 Global Pharma Contract Sales Market Forecast by Type 2022, 2027, 2032 (Revenue, CAGR%)
Figure 16 Global Pharma Contract Sales Market Forecast by Type 2022, 2032 (Revenue, CAGR%)
Figure 17 Global Pharma Contract Sales Market by Type, 2022-2032 (US$ Million)
Figure 18 Global Personal Promotion Market Forecast, 2022-2032 (US$ Million)
Figure 19 Global Personal Promotion Market by Region, 2022-2032 (US$ Million)
Figure 20 Global Non-Personal Promotion Market Forecast, 2022-2032 (US$ Million)
Figure 21 Global Non-Personal Promotion Market by Region, 2022-2032 (US$ Million)
Figure 22 Global Co-Promotion Market Forecast, 2022-2032 (US$ Million)
Figure 23 Global Co-Promotion Market by Region, 2022-2032 (US$ Million)
Figure 24 Global Pharma Contract Sales Market Forecast by Personal Promotion 2022, 2027, 2032 (Revenue, CAGR%)
Figure 25 Global Pharma Contract Sales Market Forecast by Personal Promotion 2022, 2032 (Revenue, CAGR%)
Figure 26 Global Pharma Contract Sales Market by Personal Promotion, 2022-2032 (US$ Million)
Figure 27 Global Standard Field Force Roles Market Forecast, 2022-2032 (US$ Million)
Figure 28 Global Standard Field Force Roles Market by Region, 2022-2032 (US$ Million)
Figure 29 Global Sales Deployment Market Forecast, 2022-2032 (US$ Million)
Figure 30 Global Sales Deployment Market by Region, 2022-2032 (US$ Million)
Figure 31 Global Vacancy Coverage Market Forecast, 2022-2032 (US$ Million)
Figure 32 Global Vacancy Coverage Market by Region, 2022-2032 (US$ Million)
Figure 33 Global HCP Educational Programs Market Forecast, 2022-2032 (US$ Million)
Figure 34 Global HCP Educational Programs Market by Region, 2022-2032 (US$ Million)
Figure 35 Global Key Account Management Market Forecast, 2022-2032 (US$ Million)
Figure 36 Global Key Account Management Market by Region, 2022-2032 (US$ Million)
Figure 37 Global Other Personal Promotion Services Market Forecast, 2022-2032 (US$ Million)
Figure 38 Global Other Personal Promotion Services Market by Region, 2022-2032 (US$ Million)
Figure 39 Global Pharma Contract Sales Market Forecast by Non-Personal Promotion 2022, 2027, 2032 (Revenue, CAGR%)
Figure 40 Global Pharma Contract Sales Market Forecast by Non-Personal Promotion 2022, 2032 (Revenue, CAGR%)
Figure 41 Global Pharma Contract Sales Market by Non-Personal Promotion, 2022-2032 (US$ Million)
Figure 42 Global Contact Center Market Forecast, 2022-2032 (US$ Million)
Figure 43 Global Contact Center Market by Region, 2022-2032 (US$ Million)
Figure 44 Global Tele-detailing Market Forecast, 2022-2032 (US$ Million)
Figure 45 Global Tele-detailing Market by Region, 2022-2032 (US$ Million)
Figure 46 Global Medical Call Centers Market Forecast, 2022-2032 (US$ Million)
Figure 47 Global Medical Call Centers Market by Region, 2022-2032 (US$ Million)
Figure 48 Global Tele-sampling Market Forecast, 2022-2032 (US$ Million)
Figure 49 Global Tele-sampling Market by Region, 2022-2032 (US$ Million)
Figure 50 Global Online Services Market Forecast, 2022-2032 (US$ Million)
Figure 51 Global Online Services Market by Region, 2022-2032 (US$ Million)
Figure 52 Global Pharma Contract Sales Market Forecast by Co-Promotion 2022, 2027, 2032 (Revenue, CAGR%)
Figure 53 Global Pharma Contract Sales Market Forecast by Co-Promotion 2022, 2032 (Revenue, CAGR%)
Figure 54 Global Pharma Contract Sales Market by Co-Promotion, 2022-2032 (US$ Million)
Figure 55 Global Marketing Research and Consulting Market Forecast, 2022-2032 (US$ Million)
Figure 56 Global Marketing Research and Consulting Market by Region, 2022-2032 (US$ Million)
Figure 57 Global Product Commercialization Market Forecast, 2022-2032 (US$ Million)
Figure 58 Global Product Commercialization Market by Region, 2022-2032 (US$ Million)
Figure 59 Global Territory Optimization & Alignment Market Forecast, 2022-2032 (US$ Million)
Figure 60 Global Territory Optimization & Alignment Market by Region, 2022-2032 (US$ Million)
Figure 61 Global Brand Management Market Forecast, 2022-2032 (US$ Million)
Figure 62 Global Brand Management Market by Region, 2022-2032 (US$ Million)
Figure 63 Global Mature Product Line Support Market Forecast, 2022-2032 (US$ Million, AGR (%))
Figure 64 Global Mature Product Line Support Market by Region, 2022-2032 (US$ Million)
Figure 65 Global Rest All CSO Services Market Forecast, 2022-2032 (US$ Million, AGR (%))
Figure 66 Global Rest All CSO Services Market by Region, 2022-2032 (US$ Million)
Figure 67 Global Pharma Contract Sales Market Forecast by Therapeutics 2022, 2027, 2032 (Revenue, CAGR%)
Figure 68 Global Pharma Contract Sales Market Forecast by Therapeutics 2022, 2032 (Revenue, CAGR (%))
Figure 69 Global Pharma Contract Sales Market by Therapeutics, 2022-2032 (US$ Million)
Figure 70 Global Cardiovascular Disease Market Forecast, 2022-2032 (US$ Million)
Figure 71 Global Cardiovascular Disease Market by Region, 2022-2032 (US$ Million)
Figure 72 Global Metabolic Disorders Market Forecast, 2022-2032 (US$ Million)
Figure 73 Global Metabolic Disorders Market by Region, 2022-2032 (US$ Million)
Figure 74 Global Oncology Market Forecast, 2022-2032 (US$ Million)
Figure 75 Global Oncology Market by Region, 2022-2032 (US$ Million)
Figure 76 Global Alzheimer's Disease Market Forecast, 2022-2032 (US$ Million)
Figure 77 Global Alzheimer's Disease Market by Region, 2022-2032 (US$ Million)
Figure 78 Global Diabetes Market Forecast, 2022-2032 (US$ Million)
Figure 79 Global Diabetes Market by Region, 2022-2032 (US$ Million)
Figure 80 Global Other Therapeutics Market Forecast, 2022-2032 (US$ Million)
Figure 81 Global Other Therapeutics Market by Region, 2022-2032 (US$ Million)
Figure 82 Global Pharma Contract Sales Market Forecast by Region 2022, 2027, 2032 (Revenue, CAGR%)
Figure 83 Global Pharma Contract Sales Market Forecast by Region 2022, 2032 (Revenue, CAGR%)
Figure 84 Global Pharma Contract Sales Market Forecast, 2022-2032 (US$ Million, AGR (%))
Figure 85 Global Pharma Contract Sales Market Forecast, 2021-2031 (US$ Million, AGR (%)) (V-Shape Recovery)
Figure 86 Global Pharma Contract Sales Market Forecast, 2021-2031 (US$ Million, AGR (%)) (W-Shape Recovery)
Figure 87 Global Pharma Contract Sales Market Forecast, 2021-2031 (US$ Million, AGR (%)) (U-Shape Recovery)
Figure 88 Global Pharma Contract Sales Market Forecast, 2021-2031 (US$ Million, AGR (%)) (L-Shape Recovery)
Figure 89 Global Pharma Contract Sales Market by Region, 2022-2032 (US$ Million, AGR (%))
Figure 90 Global Pharma Contract Sales Market by Region, 2022-2032 (US$ Million, AGR (%)) (V-Shaped Recovery Scenario)
Figure 91 Global Pharma Contract Sales Market by Region, 2022-2032 (US$ Million, AGR (%)) (W-Shaped Recovery Scenario)
Figure 92 Global Pharma Contract Sales Market by Region, 2022-2032 (US$ Million, AGR (%)) (U-Shaped Recovery Scenario)
Figure 93 Global Pharma Contract Sales Market by Region, 2022-2032 (US$ Million, AGR (%)) (L-Shaped Recovery Scenario)
Figure 94 North America Pharma Contract Sales Market Attractiveness Index
Figure 95 North America Pharma Contract Sales Market by Value, 2022-2032 (US$ Million, AGR (%))
Figure 96 North America Pharma Contract Sales Market Forecast by Country, 2022-2032 (US$ Million, AGR %)
Figure 97 North America Pharma Contract Sales Market Share Forecast by Country, 2022 & 2032 (%)
Figure 98 North America Pharma Contract Sales Market Forecast by Type, 2022-2032 (US$ Million, AGR %)
Figure 99 North America Pharma Contract Sales Market Share Forecast by Type, 2022 & 2032 (%)
Figure 100 North America Pharma Contract Sales Market Forecast by Personal Promotion, 2022-2032 (US$ Million, AGR %)
Figure 101 North America Pharma Contract Sales Market Share Forecast by Personal Promotion, 2022 & 2032 (%)
Figure 102 North America Pharma Contract Sales Market Forecast by Non-Personal Promotion, 2022-2032 (US$ Million, AGR %)
Figure 103 North America Pharma Contract Sales Market Share Forecast by Non-Personal Promotion, 2022 & 2032 (%)
Figure 104 North America Pharma Contract Sales Market Forecast by Co-Promotion, 2022-2032 (US$ Million, AGR %)
Figure 105 North America Pharma Contract Sales Market Share Forecast by Co-Promotion, 2022 & 2032 (%)
Figure 106 North America Pharma Contract Sales Market Forecast by Therapeutics, 2022-2032 (US$ Million, AGR %)
Figure 107 North America Pharma Contract Sales Market Share Forecast by Therapeutics, 2022 & 2032 (%)
Figure 108 U.S. Pharma Contract Sales Market Forecast, 2022-2032 (US$ Million, AGR %)
Figure 109 Canada Pharma Contract Sales Market Forecast by Value, 2022-2032 (US$ Million, AGR %)
Figure 110 Europe Pharma Contract Sales Market Attractiveness Index
Figure 111 Europe Pharma Contract Sales Market by Value, 2022-2032 (US$ Million, AGR (%))
Figure 112 Europe Pharma Contract Sales Market Forecast by Country, 2022-2032 (US$ Million, AGR %)
Figure 113 Europe Pharma Contract Sales Market Share Forecast by Country, 2022 & 2032 (%)
Figure 114 Europe Pharma Contract Sales Market Forecast by Type, 2022-2032 (US$ Million, AGR %)
Figure 115 Europe Pharma Contract Sales Market Share Forecast by Type, 2022 & 2032 (%)
Figure 116 Europe Pharma Contract Sales Market Forecast by Personal Promotion, 2022-2032 (US$ Million, AGR %)
Figure 117 Europe Pharma Contract Sales Market Share Forecast by Personal Promotion, 2022 & 2032 (%)
Figure 118 Europe Pharma Contract Sales Market Forecast by Non-Personal Promotion, 2022-2032 (US$ Million, AGR %)
Figure 119 Europe Pharma Contract Sales Market Share Forecast by Non-Personal Promotion, 2022 & 2032 (%)
Figure 120 Europe Pharma Contract Sales Market Forecast by Co-Promotion, 2022-2032 (US$ Million, AGR %)
Figure 121 Europe Pharma Contract Sales Market Share Forecast by Co-Promotion, 2022 & 2032 (%)
Figure 122 North America Pharma Contract Sales Market Forecast by Therapeutics, 2022-2032 (US$ Million, AGR %)
Figure 123 Europe Pharma Contract Sales Market Share Forecast by Therapeutics, 2022 & 2032 (%)
Figure 124 Germany Pharma Contract Sales Market Forecast, 2022-2032 (US$ Million, AGR %)
Figure 125 UK Pharma Contract Sales Market Forecast by Value, 2022-2032 (US$ Million, AGR %)
Figure 126 France Pharma Contract Sales Market Forecast by Value, 2022-2032 (US$ Million, AGR %)
Figure 127 Italy Pharma Contract Sales Market Forecast by Value, 2022-2032 (US$ Million, AGR %)
Figure 128 Spain Pharma Contract Sales Market Forecast by Value, 2022-2032 (US$ Million, AGR %)
Figure 129 Rest of Europe Pharma Contract Sales Market Forecast by Value, 2022-2032 (US$ Million, AGR %)
Figure 130 Asia-Pacific Pharma Contract Sales Market Attractiveness Index
Figure 131 Asia-Pacific Pharma Contract Sales Market by Value, 2022-2032 (US$ Million, AGR (%))
Figure 132 Asia-Pacific Pharma Contract Sales Market Forecast by Country, 2022-2032 (US$ Million, AGR %)
Figure 133 Asia-Pacific Pharma Contract Sales Market Share Forecast by Country, 2022 & 2032 (%)
Figure 134 Asia-Pacific Pharma Contract Sales Market Forecast by Type, 2022-2032 (US$ Million, AGR %)
Figure 135 Asia-Pacific Pharma Contract Sales Market Share Forecast by Type, 2022 & 2032 (%)
Figure 136 Asia-Pacific Pharma Contract Sales Market Forecast by Personal Promotion, 2022-2032 (US$ Million, AGR %)
Figure 137 Asia-Pacific Pharma Contract Sales Market Share Forecast by Personal Promotion, 2022 & 2032 (%)
Figure 138 Asia-Pacific Pharma Contract Sales Market Forecast by Non-Personal Promotion, 2022-2032 (US$ Million, AGR %)
Figure 139 Asia-Pacific Pharma Contract Sales Market Share Forecast by Non-Personal Promotion, 2022 & 2032 (%)
Figure 140 Asia-Pacific Pharma Contract Sales Market Forecast by Co-Promotion, 2022-2032 (US$ Million, AGR %)
Figure 141 Asia-Pacific Pharma Contract Sales Market Share Forecast by Co-Promotion, 2022 & 2032 (%)
Figure 142 Asia-Pacific Pharma Contract Sales Market Forecast by Therapeutics, 2022-2032 (US$ Million, AGR %)
Figure 143 Asia-Pacific Pharma Contract Sales Market Share Forecast by Therapeutics, 2022 & 2032 (%)
Figure 144 China Pharma Contract Sales Market Forecast, 2022-2032 (US$ Million, AGR %)
Figure 145 India Pharma Contract Sales Market Forecast by Value, 2022-2032 (US$ Million, AGR %)
Figure 146 Japan Pharma Contract Sales Market Forecast by Value, 2022-2032 (US$ Million, AGR %)
Figure 147 South Korea Pharma Contract Sales Market Forecast by Value, 2022-2032 (US$ Million, AGR %)
Figure 148 Australia Pharma Contract Sales Market Forecast by Value, 2022-2032 (US$ Million, AGR %)
Figure 149 Rest of Asia-Pacific Pharma Contract Sales Market Forecast by Value, 2022-2032 (US$ Million, AGR %)
Figure 150 Middle East & Africa Pharma Contract Sales Market Attractiveness Index
Figure 151 Middle East & Africa Pharma Contract Sales Market by Value, 2022-2032 (US$ Million, AGR (%))
Figure 152 Middle East & Africa Pharma Contract Sales Market Forecast by Country, 2022-2032 (US$ Million, AGR %)
Figure 153 Middle East & Africa Pharma Contract Sales Market Share Forecast by Country, 2022 & 2032 (%)
Figure 154 Middle East & Africa Pharma Contract Sales Market Forecast by Type, 2022-2032 (US$ Million, AGR %)
Figure 155 Middle East & Africa Pharma Contract Sales Market Share Forecast by Type, 2022 & 2032 (%)
Figure 156 Middle East & Africa Pharma Contract Sales Market Forecast by Personal Promotion, 2022-2032 (US$ Million, AGR %)
Figure 157 Middle East & Africa Pharma Contract Sales Market Share Forecast by Personal Promotion, 2022 & 2032 (%)
Figure 158 Middle East & Africa Pharma Contract Sales Market Forecast by Non-Personal Promotion, 2022-2032 (US$ Million, AGR %)
Figure 159 Middle East & Africa Pharma Contract Sales Market Share Forecast by Non-Personal Promotion, 2022 & 2032 (%)
Figure 160 Middle East & Africa Pharma Contract Sales Market Forecast by Co-Promotion, 2022-2032 (US$ Million, AGR %)
Figure 161 Middle East & Africa Pharma Contract Sales Market Share Forecast by Co-Promotion, 2022 & 2032 (%)
Figure 162 Middle East & Africa Pharma Contract Sales Market Forecast by Therapeutics, 2022-2032 (US$ Million, AGR %)
Figure 163 Middle East & Africa Pharma Contract Sales Market Share Forecast by Therapeutics, 2022 & 2032 (%)
Figure 164 South Africa Pharma Contract Sales Market Forecast, 2022-2032 (US$ Million, AGR %)
Figure 165 Saudi Arabia Pharma Contract Sales Market Forecast by Value, 2022-2032 (US$ Million, AGR %)
Figure 166 Turkey Pharma Contract Sales Market Forecast by Value, 2022-2032 (US$ Million, AGR %)
Figure 167 Saudi Arabia Pharma Contract Sales Market Forecast by Value, 2022-2032 (US$ Million, AGR %)
Figure 168 South America Pharma Contract Sales Market Attractiveness Index
Figure 169 South America Pharma Contract Sales Market by Value, 2022-2032 (US$ Million, AGR (%))
Figure 170 South America Pharma Contract Sales Market Forecast by Country, 2022-2032 (US$ Million, AGR %)
Figure 171 South America Pharma Contract Sales Market Share Forecast by Country, 2022 & 2032 (%)
Figure 172 South America Pharma Contract Sales Market Forecast by Type, 2022-2032 (US$ Million, AGR %)
Figure 173 South America Pharma Contract Sales Market Share Forecast by Type, 2022 & 2032 (%)
Figure 174 South America Pharma Contract Sales Market Forecast by Personal Promotion, 2022-2032 (US$ Million, AGR %)
Figure 175 South America Pharma Contract Sales Market Share Forecast by Personal Promotion, 2022 & 2032 (%)
Figure 176 South America Pharma Contract Sales Market Forecast by Non-Personal Promotion, 2022-2032 (US$ Million, AGR %)
Figure 177 South America Pharma Contract Sales Market Share Forecast by Non-Personal Promotion, 2022 & 2032 (%)
Figure 178 South America Pharma Contract Sales Market Forecast by Co-Promotion, 2022-2032 (US$ Million, AGR %)
Figure 179 South America Pharma Contract Sales Market Share Forecast by Co-Promotion, 2022 & 2032 (%)
Figure 180 South America Pharma Contract Sales Market Forecast by Therapeutics, 2022-2032 (US$ Million, AGR %)
Figure 181 South America Pharma Contract Sales Market Share Forecast by Therapeutics, 2022 & 2032 (%)
Figure 182 Brazil Pharma Contract Sales Market Forecast, 2022-2032 (US$ Million, AGR %)
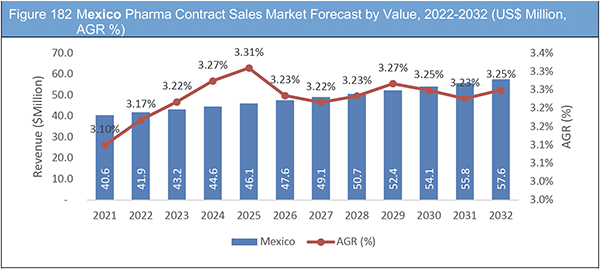
Figure 183 Mexico Pharma Contract Sales Market Forecast by Value, 2022-2032 (US$ Million, AGR %)
Figure 184 Rest of South America Pharma Contract Sales Market Forecast by Value, 2022-2032 (US$ Million, AGR %)
Figure 185 Global Pharma Contract Sales Market: Company Share Analysis, 2021
Figure 186 CMIC Holdings Co., Ltd: Net Revenue, 2017-2021 (US$ Million, AGR%)
Figure 187 CMIC Holdings Co., Ltd: Gross Profit, 2017-2021 (US$ Million, AGR%)
Figure 188 CMIC Holdings Co., Ltd: R&D, 2017-2021 (US$ Million, AGR%)
Figure 189 CMIC Holdings Co., Ltd: EBITDA, 2017-2021 (US$ Million, AGR%)
Figure 190 Syneos Health Inc.: Net Revenue, 2017-2021 (US$ Million, AGR%)
Figure 191 Syneos Health Inc.: Gross Profit, 2017-2021 (US$ Million, AGR%)
Figure 192 Syneos Health Inc.: EBITDA, 2017-2021 (US$ Million, AGR%)
Figure 193 IQVIA Holdings Inc.: Net Revenue, 2017-2021 (US$ Million, AGR%)
Figure 194 IQVIA Holdings Inc.: Gross Profit, 2017-2021 (US$ Million, AGR%)
Figure 195 IQVIA Holdings Inc.: EBITDA, 2017-2021 (US$ Million, AGR%)
Figure 196 Publicis Groupe SA: Net Revenue, 2017-2021 (US$ Million, AGR%)
Figure 197 Publicis Groupe SA: Gross Profit, 2017-2021 (US$ Million, AGR%)
Figure 198 Publicis Groupe SA: EBITDA, 2017-2021 (US$ Million, AGR%)
Figure 199 UDG Healthcare PLC: Net Revenue, 2017-2021 (US$ Million, AGR%)
Figure 200 UDG Healthcare PLC: Gross Profit, 2017-2021 (US$ Million, AGR%)
Figure 201 UDG Healthcare PLC: R&D, 2017-2021 (US$ Million, AGR%)
Figure 202 UDG Healthcare PLC: EBITDA, 2017-2021 (US$ Million, AGR%)
List of Companies Profiled in the report
Amplity Health
Apodi Healthcare Limited
CMIC Holdings Co., Ltd
Granard Pharmaceuticals
GTS Solution
IQVIA Holdings Inc.
MaBiCo
Marvecs GmbH
OnCall LLC
Publicis Groupe SA
QFR Solutions
Sales Partnerships Inc.
Sofip SA
Syneos Health Inc.
UDG Healthcare PLC
Vanguard Pharma
List of Other Companies Mentioned in the report
AbbVie Inc Company
Aenova Group Company
Ajinomoto Bio-Pharma Services Company
Alcami Corporation Company
Alkermes Biotechnology company
Almac Group Company
Aurobindo Pharma Ltd.
Avid Bioservices Inc.
Baxter Biopharma Solutions Company
Bayer AG Company
Biocon Limited Company
Biomay AG Company
Biophore India Pharmaceuticals Private Limited Company
Bora Pharmaceuticals Company
C.H. Boehringer Sohn AG & Ko. KG Company
Cambrex Corporation Company
Cardinal Health, Inc. Company
Catalent Pharma Solutions Inc.
Cepia Sanofi Company (Parental of Sanofi)
Charles River Laboratories International, Inc. Company
Consort Medical plc
Corden Pharma International Company
Daito Pharmaceutical Co., Ltd. Company
Delpharm SAS Company
Divi’s Laboratories Ltd
DPT Laboratories, Ltd. (Mylan N.V.) Company
Dr. Reddy’s Laboratories Company
Evonik Degussa Company
F. Hoffmann-La Roche Ltd
Famar S.A. Company
Fareva Pharmaceuticals Company
Fujifilm Diosynth Biotechnologies (Merck & co subsidiaries)
GlaxoSmithKline Pharmaceutical Company
Huapont Life Sciences Co Ltd Company
Koninklijke DSM N.V. (Royal DSM) Company
Lonza AG Company
Nipro Corporation
Pfizer Company
Recipharm AB Company
SAFC Biosciences (Merck KGaA Subsidiaries) Company
Samsung Biologics Company
Siegfried Holding Company
Strides Pharma Science Limited Company
Teva Pharmaceuticals Company
Therapure Biopharma, Inc. Company
Thermo Fisher Scientific Inc.
UPM Pharmaceuticals Company
Vetter Pharma Company
WuXi AppTec Company
Zhejiang Hisun Pharmaceutical Company
List of Associations Mentioned in the Report
Academy of Managed Care Pharmacy (AMCP)
Accreditation Council for Pharmacy Education
Alliance for Pharmacy Compounding
American Association of Colleges of Pharmacy (AACP)
American College of Apothecaries
American Herbal Pharmacopoeia
American Pharmacists Association (APhA)
American Society of Automation in Pharmacy
American Society of Consultant Pharmacists (ASCP)
American Society of Health-System Pharmacist (ASHP)
Australian College of Pharmacy
Board of Pharmaceutical Specialties
Chinese Pharmaceutical Association
Consumer Healthcare Products Association
Danish Association of Pharmaconomists
Drug Information Association
European Pharmaceutical Union
Healthcare Distribution Management Association
Institute for Safe Medication Practices
International Pharmaceutical Federation
National Alliance of State Pharmacy Association (NASPA)
National Association of Boards of Pharmacy (NABP)
National Association of Chain Drug Stores (NACDS)
National Association of State Controlled Substances Authorities
National Community Pharmacists Association (NCPA)
National Council for Prescription Drug Programs
Norwegian Pharmacy Association
Pakistan Pharmacists Society
Pharmaceutical Association of Israel
Pharmaceutical Group of the European Union
Pharmaceutical Research and Manufacturers of America
Pharmaceutical Society of New Zealand
Pharmacy Services Technical Advisory Coalition
Pharmacy Technician Certification Board
The Generic Pharmaceutical Association
United States Pharmacopeia