The Ophthalmic Drugs Market Report 2023-2033: This report will prove invaluable to leading firms striving for new revenue pockets if they wish to better understand the industry and its underlying dynamics. It will be useful for companies that would like to expand into different industries or to expand their existing operations in a new region.
Rising Frequency and Occurrence of Eye-related Conditions, Increasing Prevalence of Diabetes, and Presence of Strong Emerging Pipeline Drugs Are Driving the Market Growth
Some of the major forces propelling the ophthalmic drugs market include rising frequency and occurrence of eye-related conditions, increasing prevalence of diabetes, and presence of strong emerging pipeline drugs. As per the data provided by WHO (World Health Organization), globally over 2 billion people suffer from a near or distance vision impairment. Approximately 1 billion of these people’s vision damage have been neglected.
Furthermore, ophthalmic drugs market holds a great potential to flourish in the future as there is a great possibilities of new product approvals and launches as key players have high potential drugs in their pipeline. The companies are actively involving in creating awareness regarding the ophthalmic disorders and their treatment options. Along with this companies are taking advantage of digital marketing in a meaningful way to spread the awareness regarding their new products.
Patent Expiry of Blockbuster Drugs
The early developers and innovators of the pharmaceuticals benefit greatly from patent protection in terms of sales and earnings; in certain instances, the gross profit margins for the patent-protected drugs surpass 90%. The market introduction of generic competitors, however, presents difficulties for the original developer as a result of the patent expiration. Drug patent expiration enables producers other than the original creator to release less expensive generic versions. It has been noted that the generic versions of the pharmaceuticals cost roughly 20–30% less than the branded and trademarked products. It gives consumers the chance to save money by enabling them to purchase necessary medications for less money. This will impede market expansion.
What Questions Should You Ask before Buying a Market Research Report?
• How is the ophthalmic drugs market evolving?
• What is driving and restraining the ophthalmic drugs market?
• How will each ophthalmic drugs submarket segment grow over the forecast period and how much revenue will these submarkets account for in 2033?
• How will the market shares for each ophthalmic drugs submarket develop from 2023 to 2033?
• What will be the main driver for the overall market from 2023 to 2033?
• Will leading ophthalmic drugs markets broadly follow the macroeconomic dynamics, or will individual national markets outperform others?
• How will the market shares of the national markets change by 2033 and which geographical region will lead the market in 2033?
• Who are the leading players and what are their prospects over the forecast period?
• How will the industry evolve during the period between 2023 and 2033? What are the implications of ophthalmic drugs projects taking place now and over the next 10 years?
• Is there a greater need for product commercialisation to further scale the ophthalmic drugs market?
• Where is the ophthalmic drugs market heading and how can you ensure you are at the forefront of the market?
• What are the best investment options for new product and service lines?
• What are the key prospects for moving companies into a new growth path and C-suite?
You need to discover how this will impact the ophthalmic drugs market today, and over the next 10 years:
• Our 232-page report provides 104 tables and 168 charts/graphs exclusively to you.
• The report highlights key lucrative areas in the industry so you can target them – NOW.
• It contains in-depth analysis of global, regional and national sales and growth.
• It highlights for you the key successful trends, changes and revenue projections made by your competitors.
This report tells you TODAY how the ophthalmic drugs market will develop in the next 10 years, and in line with the variations in COVID-19 economic recession and bounce. This market is more critical now than at any point over the last 10 years.
The report delivers exclusive COVID-19 variations and economic data specific to your market.
To access the data contained in this document please email contactus@visiongain.com
Forecasts to 2033 and other analyses reveal commercial prospects
• In addition to revenue forecasting to 2033, our new study provides you with recent results, growth rates, and market shares.
• You will find original analyses, with business outlooks and developments.
• Discover qualitative analyses (including market dynamics, drivers, opportunities, restraints and challenges), cost structure, impact of rising ophthalmic drugs prices and recent developments.
This report includes data analysis and invaluable insight into how COVID-19 will affect the industry and your company. Four COVID-19 recovery patterns and their impact, namely, “V”, “L”, “W” and “U” are discussed in this report.
Segments Covered in the Report
Type
• Prescription Drugs
• OTC Drugs
Distribution Channel
• Hospital Pharmacies
• Drug Stores
• Online Pharmacies
Indications
• Retinal Disorders
• Infection/Inflammation/Allergy
• Dry Eye
• Glaucoma
Route of Administration
• Topical
• Parenteral

In addition to the revenue predictions for the overall world market and segments, you will also find revenue forecasts for four regional and 20 leading national markets:
North America
• U.S.
• Canada
Europe
• Germany
• Spain
• UK
• France
• Italy
• Rest of Europe
Asia Pacific
• China
• Japan
• India
• Australia
• South Korea
• Rest of Asia Pacific
Latin America
• Brazil
• Mexico
• Rest of Latin America
MEA
• GCC
• South Africa
• Rest of MEA
Need industry data? Please contact us today.
The report also includes profiles and for some of the leading companies in the Ophthalmic Drugs Market, 2023 to 2033, with a focus on this segment of these companies’ operations.
Leading companies and the potential for market growth
• AbbVie Inc.
• Bayer AG
• Bausch & Lomb Incorporated
• F. Hoffmann-La Roche Ltd
• Johnson & Johnson Services, Inc.
• Novartis AG
• Pfizer Inc.
• Regeneron Pharmaceuticals Inc.
• Santen Pharmaceutical Co., Ltd.
• Teva Pharmaceutical Industries Ltd.
Overall world revenue for ophthalmic drugs market, 2023 to 2033 in terms of value the market will surpass US$29 billion in 2022, our work calculates. We predict strong revenue growth through to 2033. Our work identifies which organizations hold the greatest potential. Discover their capabilities, progress, and commercial prospects, helping you stay ahead.
How will the ophthalmic drugs market, 2023 to 2033 report help you?
In summary, our 230+ page report provides you with the following knowledge:
• Revenue forecasts to 2033 for ophthalmic drugs market, 2023 to 2033 Market, with forecasts for type, indication, distribution channel, and route of administration each forecast at a global and regional level – discover the industry’s prospects, finding the most lucrative places for investments and revenues.
• Revenue forecasts to 2033 for five regions and 16 key national markets – See forecasts for the ophthalmic drugs Market, 2023 to 2033 market in North America, Europe, Asia-Pacific, Latin America and MEA. Also forecasted is the market in the US, Canada, Mexico, Brazil, Germany, France, UK, Italy, China, India, Japan, and Australia among other prominent economies.
• Prospects for established firms and those seeking to enter the market – including company profiles for 20 of the major companies involved in the ophthalmic drugs Market, 2023 to 2033.
Find quantitative and qualitative analyses with independent predictions. Receive information that only our report contains, staying informed with invaluable business intelligence.
Information found nowhere else
With our new report, you are less likely to fall behind in knowledge or miss out on opportunities. See how our work could benefit your research, analyses, and decisions. Visiongain’s study is for everybody needing commercial analyses for the ophthalmic drugs market, 2023 to 2033, market-leading companies. You will find data, trends and predictions.
To access the data contained in this document please email contactus@visiongain.com
Buy our report today Ophthalmic Drugs Market Report 2023-2033: Forecasts by Type (Prescription Drugs, OTC), by Distribution Channel (Hospital Pharmacies, Drug Stores, Online Pharmacies), by Indication (Retinal Disorders, Infection/Inflammation/Allergy, Dry Eye, Glaucoma), by Route of Administration (Topical, Parenteral) AND Regional and Leading National Market Analysis PLUS Analysis of Leading Companies AND COVID-19 Impact and Recovery Pattern Analysis. Avoid missing out by staying informed – order our report now.
Visiongain is a trading partner with the US Federal Government
CCR Ref number: KD4R6
Do you have any custom requirements we can help you with? Any need for a specific country, geo region, market segment or specific company information? Contact us today, we can discuss your needs and see how we can help: contactus@visiongain.com
1. Report Overview
1.1 Objectives of the Study
1.2 Introduction to Ophthalmic Drugs market
1.3 What This Report Delivers
1.4 Why You Should Read This Report
1.5 Key Questions Answered by This Analytical Report
1.6 Who is This Report for?
1.7 Methodology
1.7.1 Market Definitions
1.7.2 Market Evaluation & Forecasting Methodology
1.7.3 Data Validation
1.7.3.1 Primary Research
1.7.3.2 Secondary Research
1.8 Frequently Asked Questions (FAQs)
1.9 Associated Visiongain Reports
1.10 About Visiongain
2 Executive Summary
3 Market Overview
3.1 Key Findings
3.2 Market Dynamics
3.2.1 Market Driving Factors
3.2.1.1 Rising Frequency and Occurrence of Eye-related Conditions
3.2.1.2 Increasing Prevalence of Diabetes
3.2.1.3 Presence of Strong Emerging Pipeline Drugs
3.2.2 Market Restraining Factors
3.2.2.1 Lack of Health Insurance in the Developing Countries
3.2.2.2 Lack of Awareness Regarding the Available Treatment Options
3.2.2.3 Side Effects of Drugs
3.2.2.4 Patent Expiry of Blockbuster Drugs
3.2.3 Market Opportunities
3.2.3.1 Rise in Investment in Research and Development
3.2.3.2 Rise in Geriatric Population
3.3 COVID-19 Impact Analysis
3.4 Porter’s Five Forces Analysis
3.4.1 Bargaining Power of Suppliers
3.4.2 Bargaining Power of Buyers
3.4.3 Competitive Rivalry
3.4.4 Threat of Substitutes
3.4.5 Threat of New Entrants
3.5 PEST Analysis
4 Ophthalmic Drugs Market Analysis by Type
4.1 Key Findings
4.2 Type Segment Growth Prospects
4.3 Ophthalmic Drugs Market Size Estimation and Forecast by Type
4.4 Prescription Drugs
4.4.1 Market Size by Region, 2023-2033 (US$ bn)
4.4.2 Market Share by Region, 2023 & 2033 (%)
4.5 OTC
4.5.1 Market Size by Region, 2023-2033 (US$ bn)
4.5.2 Market Share by Region, 2023 & 2033 (%)
5 Ophthalmic Drugs Market Analysis by Distribution Channel
5.1 Key Findings
5.2 Distribution Channel Segment Growth Prospects
5.3 Ophthalmic Drugs Market Size Estimation and Forecast by Distribution Channel
5.4 Hospital Pharmacies
5.4.1 Market Size by Region, 2023-2033 (US$ bn)
5.4.2 Market Share by Region, 2023 & 2033 (%)
5.5 Drug Stores
5.5.1 Market Size by Region, 2023-2033 (US$ bn)
5.5.2 Market Share by Region, 2023 & 2033 (%)
5.6 Online Pharmacies
5.6.1 Market Size by Region, 2023-2033 (US$ bn)
5.6.2 Market Share by Region, 2023 & 2033 (%)
6 Ophthalmic Drugs Market Analysis by Indications
6.1 Key Findings
6.2 Indications Segment Growth Prospects
6.3 Ophthalmic Drugs Market Size Estimation and Forecast by Indications
6.4 Retinal Disorders
6.4.1 Market Size by Region, 2023-2033 (US$ bn)
6.4.2 Market Share by Region, 2023 & 2033 (%)
6.4.3 Retinal Disorders by Brands, 2023-2033 (US$ bn)
6.5 Infection/Inflammation/Allergy
6.5.1 Market Size by Region, 2023-2033 (US$ bn)
6.5.2 Market Share by Region, 2023 & 2033 (%)
6.5.3 Infection/Inflammation/Allergy by Brands, 2023-2033 (US$ bn)
6.6 Dry Eye
6.6.1 Market Size by Region, 2023-2033 (US$ bn)
6.6.2 Market Share by Region, 2023 & 2033 (%)
6.6.3 Dry Eye by Brands, 2023-2033 (US$ bn)
6.7 Glaucoma
6.7.1 Market Size by Region, 2023-2033 (US$ bn)
6.7.2 Market Share by Region, 2023 & 2033 (%)
6.7.3 Glaucoma by Brands, 2023-2033 (US$ bn)
7 Ophthalmic Drugs Market Analysis by Route of Administration
7.1 Key Findings
7.2 Route of Administration Segment Growth Prospects
7.3 Ophthalmic Drugs Market Size Estimation and Forecast by Indications
7.4 Topical
7.4.1 Market Size by Region, 2023-2033 (US$ bn)
7.4.2 Market Share by Region, 2023 & 2033 (%)
7.5 Parenteral
7.5.1 Market Size by Region, 2023-2033 (US$ bn)
7.5.2 Market Share by Region, 2023 & 2033 (%)
8 Ophthalmic Drugs Market Analysis by Region
8.1 Key Findings
8.2 Regional Market Size Estimation and Forecast
8.3 COVID-19 Impact Analysis: Recovery Scenarios (V, U, W, L)
9 North America Ophthalmic Drugs Market Analysis
9.1 Key Findings
9.2 North America Ophthalmic Drugs Market Attractiveness Index
9.3 North America Ophthalmic Drugs Market by Country, 2023, 2028 & 2033 (US$ bn)
9.4 North America Ophthalmic Drugs Market Size Estimation and Forecast by Country
9.5 North America Ophthalmic Drugs Market Size Estimation and Forecast by Type
9.6 North America Ophthalmic Drugs Market Size Estimation and Forecast by Distribution Channel
9.7 North America Ophthalmic Drugs Market Size Estimation and Forecast by Indications
9.8 North America Ophthalmic Drugs Market Size Estimation and Forecast by Route of Administration
9.9 U.S. Ophthalmic Drugs Market Analysis
9.10 Canada Ophthalmic Drugs Market Analysis
10 Europe Ophthalmic Drugs Market Analysis
10.1 Key Findings
10.2 Europe Ophthalmology drugs market Attractiveness Index
10.3 Europe Ophthalmic Drugs Market by Country, 2023, 2028 & 2033 (US$ bn)
10.4 Europe Ophthalmology drugs market Size Estimation and Forecast by Country
10.5 Europe Ophthalmic Drugs Market Size Estimation and Forecast by Type
10.6 Europe Ophthalmic Drugs Market Size Estimation and Forecast by Distribution Channel
10.7 Europe Ophthalmic Drugs Market Size Estimation and Forecast by Indications
10.8 Europe Ophthalmic Drugs Market Size Estimation and Forecast by Route of Administration
10.9 Germany Ophthalmic Drugs Market Analysis
10.10 France Ophthalmic Drugs Market Analysis
10.11 U.K. Ophthalmic Drugs Market Analysis
10.12 Italy Ophthalmic Drugs Market Analysis
10.13 Spain Ophthalmic Drugs Market Analysis
10.14 Rest of Europe Ophthalmic Drugs Market Analysis
11 Asia Pacific Ophthalmic Drugs Market Analysis
11.1 Key Findings
11.2 Asia Pacific Ophthalmic Drugs Market Attractiveness Index
11.3 Asia Pacific Ophthalmic Drugs Market by Country, 2023, 2028 & 2033 (US$ bn)
11.4 Asia Pacific Ophthalmology drugs market Size Estimation and Forecast by Country
11.5 Asia-Pacific Ophthalmic Drugs Market Size Estimation and Forecast by Type
11.6 Asia-Pacific Ophthalmic Drugs Market Size Estimation and Forecast by Distribution Channel
11.7 Asia-Pacific Ophthalmic Drugs Market Size Estimation and Forecast by Indications
11.8 Asia-Pacific Ophthalmic Drugs Market Size Estimation and Forecast by Route of Administration
11.9 Japan Ophthalmic Drugs Market Analysis
11.10 China Ophthalmic Drugs Market Analysis
11.11 India Ophthalmic Drugs Market Analysis
11.12 Australia Ophthalmic Drugs Market Analysis
11.13 South Korea Ophthalmic Drugs Market Analysis
11.14 Rest of Asia Pacific Ophthalmic Drugs Market Analysis
12 Latin America Ophthalmic Drugs Market Analysis
12.1 Key Findings
12.2 Latin America Ophthalmic Drugs Market Attractiveness Index
12.3 Latin America Ophthalmic Drugs Market by Country, 2023, 2028 & 2033 (US$ bn)
12.4 Latin America Ophthalmic Drugs Market Size Estimation and Forecast by Country
12.5 Latin America Ophthalmic Drugs Market Size Estimation and Forecast by Type
12.6 Latin America Ophthalmic Drugs Market Size Estimation and Forecast by Distribution Channel
12.7 Latin America Ophthalmic Drugs Market Size Estimation and Forecast by Indications
12.8 Latin America Ophthalmic Drugs Market Size Estimation and Forecast by Route of Administration
12.9 Brazil Ophthalmic Drugs Market Analysis
12.10 Mexico Ophthalmic Drugs Market Analysis
12.11 Rest of Latin America Ophthalmic Drugs Market Analysis
13 MEA Ophthalmic Drugs Market Analysis
13.1 Key Findings
13.2 MEA Ophthalmic Drugs Market Attractiveness Index
13.3 MEA Ophthalmic Drugs Market by Country, 2023, 2028 & 2033 (US$ bn)
13.4 MEA Ophthalmic Drugs Market Size Estimation and Forecast by Country
13.5 MEA Ophthalmic Drugs Market Size Estimation and Forecast by Type
13.6 MEA Ophthalmic Drugs Market Size Estimation and Forecast by Distribution Channel
13.7 MEA Ophthalmic Drugs Market Size Estimation and Forecast by Indications
13.8 MEA Ophthalmic Drugs Market Size Estimation and Forecast by Route of Administration
13.9 GCC Ophthalmic Drugs Market Analysis
13.10 South Africa Ophthalmic Drugs Market Analysis
13.11 Rest of MEA Ophthalmic Drugs Market Analysis
14 Company Profiles
14.1 Competitive Landscape, 2021
14.2 Novartis AG
14.2.1 Company Snapshot
14.2.2 Company Overview
14.2.3 Financial Analysis
14.2.3.1 Revenue, 2017-2021
14.2.3.2 Regional Market Shares, 2021 (%)
14.2.4 Product Benchmarking
14.2.5 Strategic Outlook
14.3 Bayer AG
14.3.1 Company Snapshot
14.3.2 Company Overview
14.3.3 Financial Analysis
14.3.3.1 Revenue, 2017-2021
14.3.3.2 R&D, 2017-2021
14.3.3.3 Regional Market Shares, 2021 (%)
14.3.4 Product Benchmarking
14.3.5 Strategic Outlook
14.4 Pfizer Inc.
14.4.1 Company Snapshot
14.4.2 Company Overview
14.4.3 Financial Analysis
14.4.3.1 Revenue, 2017-2021
14.4.3.2 R&D, 2017-2021
14.4.3.3 Regional Market Shares, 2021 (%)
14.4.4 Product Benchmarking
14.5 Bausch & Lomb Incorporated
14.5.1 Company Snapshot
14.5.2 Company Overview
14.5.3 Financial Analysis
14.5.3.1 Revenue, 2017-2021
14.5.3.2 R&D, 2017-2021
14.5.3.3 Regional Market Shares, 2021 (%)
14.5.4 Product Benchmarking
14.5.5 Strategic Outlook
14.6 Santen Pharmaceutical Co., Ltd.
14.6.1 Company Snapshot
14.6.2 Company Overview
14.6.3 Financial Analysis
14.6.3.1 Revenue, 2017-2021
14.6.3.2 R&D, 2017-2021
14.6.3.3 Business Segments Market Shares, 2021 (%)
14.6.4 Product Benchmarking
14.6.5 Strategic Outlook
14.7 Johnson & Johnson Private Limited
14.7.1 Company Snapshot
14.7.2 Company Overview
14.7.3 Financial Analysis
14.7.3.1 Revenue, 2017-2021
14.7.3.2 R&D, 2017-2021
14.7.3.3 Regional Market Shares, 2021 (%)
14.7.4 Product Benchmarking
14.7.5 Strategic Outlook
14.8 Regeneron Pharmaceuticals Inc.
14.8.1 Company Snapshot
14.8.2 Company Overview
14.8.3 Financial Analysis
14.8.3.1 Revenue, 2017-2021
14.8.3.2 R&D, 2017-2021
14.8.4 Product Benchmarking
14.9 AbbVie Inc.
14.9.1 Company Snapshot
14.9.2 Company Overview
14.9.3 Financial Analysis
14.9.3.1 Revenue, 2017-2021
14.9.3.2 R&D, 2017-2021
14.9.3.3 Regional Market Shares, 2021 (%)
14.9.4 Product Benchmarking
14.9.5 Strategic Outlook
14.10 F. Hoffmann-La Roche Ltd
14.10.1 Company Snapshot
14.10.2 Company Overview
14.10.3 Financial Analysis
14.10.3.1 Revenue, 2017-2021
14.10.3.2 R&D, 2017-2021
14.10.3.3 Regional Market Shares, 2021 (%)
14.10.4 Product Benchmarking
14.10.5 Strategic Outlook
14.11 Teva Pharmaceutical Industries Ltd.
14.11.1 Company Snapshot
14.11.2 Company Overview
14.11.3 Financial Analysis
14.11.3.1 Revenue, 2017-2021
14.11.3.2 R&D Expenses, 2017-2021
14.11.3.3 Regional Market Shares, 2021 (%)
14.11.4 Product Benchmarking
14.11.5 Strategic Outlook
15 Conclusion and Recommendations
15.1 Concluding Remarks from Visiongain
15.2 Recommendations for Market Players
List of Tables
Table 1 Ophthalmic Drugs Market Snapshot, 2023 & 2033 (US$ billion, CAGR %)
Table 2 Ophthalmic Drugs Market, Product Pipeline
Table 3 Ophthalmic Drugs Market by Region, 2023-2033 (US$ bn, AGR (%), CAGR(%)): “V” Shaped Recovery Scenario
Table 4 Ophthalmic Drugs Market Forecast by Region 2023-2033 (US$ bn, AGR%): "U" Shaped Recovery
Table 5 Ophthalmic Drugs Market Forecast by Region 2023-2033 (US$ Mn, AGR%): "W" Shaped Recovery
Table 6 Ophthalmic Drugs Market Forecast by Region 2023-2033 (US$ Mn, AGR%): "L" Shaped Recovery
Table 7 Ophthalmic Drugs Market Forecast by Type, 2023-2033 (US$ bn, AGR%, CAGR%)
Table 8 Prescription Drugs Market Forecast by Region, 2023-2033 (US$ bn, AGR%, CAGR%)
Table 9 OTC Drugs Market Forecast by Region, 2023-2033 (US$ bn, AGR%, CAGR%)
Table 10 Ophthalmic Drugs Market Forecast by Distribution Channel, 2023-2033 (US$ bn, AGR%, CAGR%)
Table 11 Hospital Pharmacies Market Forecast by Region, 2023-2033 (US$ bn, AGR%, CAGR%)
Table 12 Drug Stores Market Forecast by Region, 2023-2033 (US$ bn, AGR%, CAGR%)
Table 13 Online Pharmacies Market Forecast by Region, 2023-2033 (US$ bn, AGR%, CAGR%)
Table 14 Ophthalmic Drugs Market Forecast by Indications, 2023-2033 (US$ bn, AGR%, CAGR%)
Table 15 Retinal Disorders Market Forecast by Region, 2023-2033 (US$ bn, AGR%, CAGR%)
Table 16 Global Retinal Disorders in Ophthalmic Drugs Market Forecast by Brands, 2023-2033 (US$ bn, AGR%, CAGR%)
Table 17 Infection/Inflammation/Allergy Market Forecast by Region, 2023-2033 (US$ bn, AGR%, CAGR%)
Table 18 Global Infection/Inflammation/Allergy in Ophthalmic Drugs Market Forecast by Brands, 2023-2033 (US$ bn, AGR%, CAGR%)
Table 19 Dry Eye Market Forecast by Region, 2023-2033 (US$ bn, AGR%, CAGR%)
Table 20 Global Dry Eye in Ophthalmic Drugs Market Forecast by Brands, 2023-2033 (US$ bn, AGR%, CAGR%)
Table 21 Glaucoma Market Forecast by Region, 2023-2033 (US$ bn, AGR%, CAGR%)
Table 22 Global Glaucoma in Ophthalmic Drugs Market Forecast by Brands, 2023-2033 (US$ bn, AGR%, CAGR%)
Table 23 Ophthalmic Drugs Market Forecast by Route of Administration, 2023-2033 (US$ bn, AGR%, CAGR%)
Table 24 Topical Market Forecast by Region, 2023-2033 (US$ bn, AGR%, CAGR%)
Table 25 Parenteral Market Forecast by Region, 2023-2033 (US$ bn, AGR%, CAGR%)
Table 26 Ophthalmic Drugs Market Forecast by Region, 2023-2033 (US$ bn, AGR%, CAGR%)
Table 27 Ophthalmic Drugs Market by Region, 2023-2033 (US$ bn, AGR (%), CAGR(%)):
“V” Shaped Recovery Scenario
Table 28 Ophthalmic Drugs Market Forecast by Region 2023-2033 (US$ bn, AGR%): "U" Shaped Recovery
Table 29 Ophthalmic Drugs Market Forecast by Region 2023-2033 (US$ Mn, AGR%): "W" Shaped Recovery
Table 30 Ophthalmic Drugs Market Forecast by Region 2023-20323(US$ Mn, AGR%): "L" Shaped Recovery
Table 31 North America Ophthalmic Drugs Market Forecast by Country, 2023-2033 (US$ bn, AGR%, CAGR%)
Table 32 North America Ophthalmic Drugs Market Forecast by Type, 2023-2033 (US$ bn, AGR%, CAGR%)
Table 33 North America Ophthalmic Drugs Market Forecast by Distribution Channel, 2023-2033 (US$ bn, AGR%, CAGR%)
Table 34
Table 35 North America Ophthalmic Drugs Market Forecast by Indications, 2023-2033 (US$ bn, AGR%, CAGR%)
Table 36 North America Ophthalmic Drugs Market Forecast by Route of Administration, 2023-2033 (US$ bn, AGR%, CAGR%)
Table 37 U.S. Ophthalmic Drugs Market Forecast, 2023-2033 (US$ bn, AGR%, CAGR%)
Table 38 Canada Ophthalmic Drugs Market Forecast, 2023-2033 (US$ bn, AGR%, CAGR%)
Table 39 Europe Ophthalmic Drugs Market Forecast by Country, 2023-2033 (US$ bn, AGR%, CAGR%)
Table 40 Europe Ophthalmic Drugs Market Forecast by Type, 2023-2033 (US$ bn, AGR%, CAGR%)
Table 41 Europe Ophthalmic Drugs Market Forecast by Distribution Channel, 2023-2033 (US$ bn, AGR%, CAGR%)
Table 42 Europe Ophthalmic Drugs Market Forecast by Indications, 2023-2033 (US$ bn, AGR%, CAGR%)
Table 43 Europe Ophthalmic Drugs Market Forecast by Route of Administration, 2023-2033 (US$ bn, AGR%, CAGR%)
Table 44 Germany Ophthalmic Drugs Market Forecast, 2023-2033 (US$ bn, AGR%, CAGR%)
Table 45 France Ophthalmic Drugs Market Forecast, 2023-2033 (US$ bn, AGR%, CAGR%)
Table 46 U.K. Ophthalmic Drugs Market Forecast, 2023-2033 (US$ bn, AGR%, CAGR%)
Table 47 Italy Ophthalmic Drugs Market Forecast, 2023-2033 (US$ bn, AGR%, CAGR%)
Table 48 Spain Ophthalmic Drugs Market Forecast, 2023-2033 (US$ bn, AGR%, CAGR%)
Table 49 Rest of Europe Ophthalmic Drugs Market Forecast, 2023-2033 (US$ bn, AGR%, CAGR%)
Table 50 Asia-Pacific Ophthalmic Drugs Market Forecast by Country, 2023-2033 (US$ bn, AGR%, CAGR%)
Table 51 Asia-Pacific Ophthalmic Drugs Market Forecast by Type, 2023-2033 (US$ bn, AGR%, CAGR%)
Table 52 Asia-Pacific Ophthalmic Drugs Market Forecast by Distribution Channel, 2023-2033 (US$ bn, AGR%, CAGR%)
Table 53 Asia-Pacific Ophthalmic Drugs Market Forecast by Indications, 2023-2033 (US$ bn, AGR%, CAGR%)
Table 54 Asia-Pacific Ophthalmic Drugs Market Forecast by Route of Administration, 2023-2033 (US$ bn, AGR%, CAGR%)
Table 55 Japan Ophthalmic Drugs Market Forecast, 2023-2033 (US$ bn, AGR%, CAGR%)
Table 56 China Ophthalmic Drugs Market Forecast, 2023-2033 (US$ bn, AGR%, CAGR%)
Table 57 India Ophthalmic Drugs Market Forecast, 2023-2033 (US$ bn, AGR%, CAGR%)
Table 58 Australia Ophthalmic Drugs Market Forecast, 2023-2033 (US$ bn, AGR%, CAGR%)
Table 59 South Korea Ophthalmic Drugs Market Forecast, 2023-2033 (US$ bn, AGR%, CAGR%)
Table 60 Asia-Pacific Ophthalmic Drugs Market Forecast, 2023-2033 (US$ bn, AGR%, CAGR%)
Table 61 Latin America Ophthalmic Drugs Market Forecast by Country, 2023-2033 (US$ bn, AGR%, CAGR%)
Table 62 Latin America Ophthalmic Drugs Market Forecast by Type, 2023-2033 (US$ bn, AGR%, CAGR%)
Table 63 Latin America Ophthalmic Drugs Market Forecast by Distribution Channel, 2023-2033 (US$ bn, AGR%, CAGR%)
Table 64 Latin America Ophthalmic Drugs Market Forecast by Indications, 2023-2033 (US$ bn, AGR%, CAGR%)
Table 65 Latin America Ophthalmic Drugs Market Forecast by Route of Administration, 2023-2033 (US$ bn, AGR%, CAGR%)
Table 66 Brazil Ophthalmic Drugs Market Forecast, 2023-2033 (US$ bn, AGR%, CAGR%)
Table 67 Mexico Ophthalmic Drugs Market Forecast, 2023-2033 (US$ bn, AGR%, CAGR%)
Table 68 Rest of Latin America Ophthalmic Drugs Market Forecast, 2023-2033 (US$ bn, AGR%, CAGR%)
Table 69 MEA Ophthalmic Drugs Market Forecast by Country, 2023-2033 (US$ bn, AGR%, CAGR%)
Table 70 MEA Ophthalmic Drugs Market Forecast by Type, 2023-2033 (US$ bn, AGR%, CAGR%)
Table 71 MEA Ophthalmic Drugs Market Forecast by Distribution Channel, 2023-2033 (US$ bn, AGR%, CAGR%)
Table 72 MEA Ophthalmic Drugs Market Forecast by Indications, 2023-2033 (US$ bn, AGR%, CAGR%)
Table 73 MEA Ophthalmic Drugs Market Forecast by Route of Administration, 2023-2033 (US$ bn, AGR%, CAGR%)
Table 74 GCC Ophthalmic Drugs Market Forecast, 2023-2033 (US$ bn, AGR%, CAGR%)
Table 75 South Africa Ophthalmic Drugs Market Forecast, 2023-2033 (US$ bn, AGR%, CAGR%)
Table 76 Rest of MEA Ophthalmic Drugs Market Forecast, 2023-2033 (US$ bn, AGR%, CAGR%)
Table 77 Novartis AG: Key Details, (CEO, HQ, Revenue, Founded, No. of Employees, Company Type, Website, Business Segment)
Table 78 Novartis AG: Product Benchmarking
Table 79 Novartis AG: Strategic Outlook
Table 80 Bayer AG: Key Details, (CEO, HQ, Revenue, Founded, No. of Employees, Company Type, Website, Business Segment)
Table 81 Bayer AG: Product Benchmarking
Table 82 Bayer AG: Strategic Outlook
Table 83 Pfizer Inc.: Key Details, (CEO, HQ, Revenue, Founded, No. of Employees, Company Type, Website, Business Segment)
Table 84 Pfizer Inc.: Product Benchmarking
Table 85 Bausch & Lomb Incorporated : Key Details, (CEO, HQ, Revenue, Founded, No. of Employees, Company Type, Website, Business Segment)
Table 86 Bausch & Lomb Incorporated : Product Benchmarking
Table 87 Bausch & Lomb Incorporated : Strategic Outlook
Table 88 Santen Pharmaceutical Co., Ltd.: Key Details, (CEO, HQ, Revenue, Founded, No. of Employees, Company Type, Website, Business Segment)
Table 89 Santen Pharmaceutical Co., Ltd.: Product Benchmarking
Table 90 Santen Pharmaceutical Co., Ltd.: Strategic Outlook
Table 91 Johnson & Johnson Private Limited: Key Details, (CEO, HQ, Revenue, Founded, No. of Employees, Company Type, Website, Business Segment)
Table 92 Johnson & Johnson Private Limited: Product Benchmarking
Table 93 Johnson & Johnson Private Limited: Strategic Outlook
Table 94 Regeneron Pharmaceuticals Inc.: Key Details, (CEO, HQ, Revenue, Founded, No. of Employees, Company Type, Website, Business Segment)
Table 95 Regeneron Pharmaceuticals Inc.: Product Benchmarking
Table 96 AbbVie Inc.: Key Details, (CEO, HQ, Revenue, Founded, No. of Employees, Company Type, Website, Business Segment)
Table 97 AbbVie Inc.: Product Benchmarking
Table 98 AbbVie Inc.: Strategic Outlook
Table 99 F. Hoffmann-La Roche Ltd: Key Details, (CEO, HQ, Revenue, Founded, No. of Employees, Company Type, Website, Business Segment)
Table 100 F. Hoffmann-La Roche Ltd: Product Benchmarking
Table 101 F. Hoffmann-La Roche Ltd: Strategic Outlook
Table 102 Teva Pharmaceutical Industries Ltd.: Key Details, (CEO, HQ, Revenue, Founded, No. of Employees, Company Type, Website, Business Segment)
Table 103 Teva Pharmaceutical Industries Ltd.: Product Benchmarking
Table 104 Teva Pharmaceutical Industries Ltd.: Strategic Outlook
List of Figures
Figure 1 Ophthalmic Drugs Market Segmentation
Figure 2 Ophthalmic Drugs Market by Type: Market Attractiveness Index
Figure 3 Ophthalmic Drugs Market Forecast by Distribution Channel: Market Attractiveness Index
Figure 4 Ophthalmic Drugs Market Forecast by Indications: Market Attractiveness Index
Figure 5 Ophthalmic Drugs Market Forecast by Route of Administration: Market Attractiveness Index
Figure 6 Ophthalmic Drugs Market Attractiveness Index by Region
Figure 7 Ophthalmic Drugs Market: Market Dynamics
Figure 8 Global COVID Impact Analysis: Ophthalmic Drugs Market Recovery Scenarios
Figure 9 Ophthalmology drugs market by Region, 2023-2033 (US$ bn, AGR %): “V” Shaped Recovery
Figure 10 Ophthalmology drugs market by Region, 2023-2033 (US$ bn, AGR (%), CAGR (%)): “U” Shaped Recovery
Figure 11 Ophthalmology drugs market by Region, 2023-2033 (US$ bn, AGR (%), CAGR (%)): “W” Shaped Recovery
Figure 12 Ophthalmology drugs market by Region, 2023-2033 (US$ bn, AGR (%), CAGR (%)): “L” Shaped Recovery
Figure 13 Ophthalmic Drugs Market: Porter’s Five Forces Analysis
Figure 14 Ophthalmic Drugs Market: PEST Analysis
Figure 15 Ophthalmic Drugs Market Forecast by Type: Market Attractiveness Index
Figure 16 Ophthalmic Drugs Market Forecast By Type, 2023-2033 (US$ billion)
Figure 17 Ophthalmic Drugs Market Share Forecast by Type, 2023, 2028, 2033 (%)
Figure 18 Prescription Drugs Market Forecast by Region, 2023-2033 (US$ billion)
Figure 19 Prescription Drugs Market Share Forecast by Region, 2023 & 2033 (%)
Figure 20 OTC Market Forecast by Region, 2023-2033 (US$ billion)
Figure 21 OTC Market Share Forecast by Region, 2023 & 2033 (%)
Figure 22 Ophthalmic Drugs Market Forecast by Distribution Channel: Market Attractiveness Index
Figure 23 Ophthalmic Drugs Market Forecast By Distribution Channel, 2023-2033 (US$ billion)
Figure 24 Ophthalmic Drugs Market Share Forecast by Distribution Channel, 2023, 2028, 2033 (%)
Figure 25 Hospital Pharmacies Market Forecast by Region, 2023-2033 (US$ billion)
Figure 26 Hospital Pharmacies Market Share Forecast by Region, 2023 & 2033 (%)
Figure 27 Drug Stores Market Forecast by Region, 2023-2033 (US$ billion)
Figure 28 Drug Stores Market Share Forecast by Region, 2023 & 2033 (%)
Figure 29 Online Pharmacies Market Forecast by Region, 2023-2033 (US$ billion)
Figure 30 Online Pharmacies Market Share Forecast by Region, 2023 & 2033 (%)
Figure 31 Ophthalmic Drugs Market Forecast by Indications: Market Attractiveness Index
Figure 32 Ophthalmic Drugs Market Forecast By Indications, 2023-2033 (US$ billion)
Figure 33 Ophthalmic Drugs Market Share Forecast by Indications, 2023, 2028, 2033 (%)
Figure 34 Retinal Disorders Market Forecast by Region, 2023-2033 (US$ billion)
Figure 35 Retinal Disorders Market Share Forecast by Region, 2023 & 2033 (%)
Figure 36 Retinal Disorders Market Forecast by Brands, 2023-2033 (US$ billion)
Figure 37 Infection/Inflammation/Allergy Market Forecast by Region, 2023-2033 (US$ billion)
Figure 38 Infection/Inflammation/Allergy Market Share Forecast by Region, 2023 & 2033 (%)
Figure 39 Infection/Inflammation/Allergy Market Forecast by Brands, 2023-2033 (US$ billion)
Figure 40 Dry Eye Market Forecast by Region, 2023-2033 (US$ billion)
Figure 41 Dry Eye Market Share Forecast by Region, 2023 & 2033 (%)
Figure 42 Dry Eye Market Forecast by Brands, 2023-2033 (US$ billion)
Figure 43 Glaucoma Market Forecast by Region, 2023-2033 (US$ billion)
Figure 44 Glaucoma Market Share Forecast by Region, 2023 & 2033 (%)
Figure 45 Glaucoma Market Forecast by Brands, 2023-2033 (US$ billion)
Figure 46 Ophthalmic Drugs Market Forecast by Route of Administration: Market Attractiveness Index
Figure 47 Ophthalmic Drugs Market Forecast By Route of Administration, 2023-2033 (US$ billion)
Figure 48 Ophthalmic Drugs Market Share Forecast by Route of Administration, 2023, 2028, 2033 (%)
Figure 49 Topical Market Forecast by Region, 2023-2033 (US$ billion)
Figure 50 Topical Market Share Forecast by Region, 2023 & 2033 (%)
Figure 51 Parenteral Market Forecast by Region, 2023-2033 (US$ billion)
Figure 52 Parenteral Market Share Forecast by Region, 2023 & 2033 (%)
Figure 53 Ophthalmic Drugs Market Forecast by Region 2023, 2028, 2033 (Revenue, CAGR%)
Figure 54 Ophthalmic Drugs Market Share Forecast by Region 2023, 2028, 2033(%)
Figure 55 Ophthalmic Drugs Market by Region, 2023-2033 (US$ bn)
Figure 56 Ophthalmic Drugs Market by Region, 2023-2033 (US$ bn, AGR %): “V” Shaped Recovery
Figure 57 Ophthalmic Drugs Market by Region, 2023-2033 (US$ bn, AGR (%): “U” Shaped Recovery
Figure 58 Ophthalmic Drugs Market by Region, 2023-2033 (US$ bn, AGR (%), CAGR (%)): “W” Shaped Recovery
Figure 59 Ophthalmic Drugs Market by Region, 2023-2033 (US$ bn, AGR (%), CAGR (%)): “L” Shaped Recovery
Figure 60 North America Ophthalmic Drugs Market Attractiveness Index
Figure 61 North America Ophthalmic Drugs Market by Region, 2023, 2028 & 2033 (US$ billion)
Figure 62 North America Ophthalmic Drugs Market Forecast by Country, 2023-2033 (US$ billion)
Figure 63 North America Ophthalmic Drugs Market Share Forecast by Country, 2023 & 2033 (%)
Figure 64 North America Ophthalmic Drugs Market Forecast by Type, 2023-2033 (US$ billion)
Figure 65 North America Ophthalmic Drugs Market Share Forecast by Type, 2023 & 2033 (%)
Figure 66 North America Ophthalmic Drugs Market Forecast by Distribution Channel, 2023-2033 (US$ billion)
Figure 67 North America Ophthalmic Drugs Market Share Forecast by Distribution Channel, 2023 & 2033 (%)
Figure 68 North America Ophthalmic Drugs Market Forecast by Indications, 2023-2033 (US$ billion)
Figure 69 North America Ophthalmic Drugs Market Share Forecast by Indications, 2023 & 2033 (%)
Figure 70 North America Ophthalmic Drugs Market Forecast by Route of Administration, 2023-2033 (US$ billion)
Figure 71 North America Ophthalmic Drugs Market Share Forecast by Route of Administration, 2023 & 2033 (%)
Figure 72 U.S. Ophthalmic Drugs Market Forecast, 2023-2033 (US$ billion, AGR %)
Figure 73 Canada Ophthalmic Drugs Market Forecast, 2023-2033 (US$ billion, AGR %)
Figure 74 Europe Ophthalmic Drugs Market Attractiveness Index
Figure 75 Europe Ophthalmic Drugs Market by Region, 2023, 2028 & 2033 (US$ billion)
Figure 76 Europe Ophthalmic Drugs Market Forecast by Country, 2023-2033 (US$ billion)
Figure 77 Europe Ophthalmic Drugs Market Share Forecast by Country, 2023 & 2033 (%)
Figure 78 Europe Ophthalmic Drugs Market Forecast by Type, 2023-2033 (US$ billion)
Figure 79 Europe Ophthalmic Drugs Market Share Forecast by Type, 2023 & 2033 (%)
Figure 80 Europe Ophthalmic Drugs Market Forecast by Distribution Channel, 2023-2033 (US$ billion)
Figure 81 Europe Ophthalmic Drugs Market Share Forecast by Distribution Channel, 2023 & 2033 (%)
Figure 82 Europe Ophthalmic Drugs Market Forecast by Indications, 2023-2033 (US$ billion)
Figure 83 Europe Ophthalmic Drugs Market Share Forecast by Indications, 2023 & 2033 (%)
Figure 84 Europe Ophthalmic Drugs Market Forecast by Route of Administration, 2023-2033 (US$ billion)
Figure 85 Europe Ophthalmic Drugs Market Share Forecast by Route of Administration, 2023 & 2033 (%)
Figure 86 Germany Ophthalmic Drugs Market Forecast, 2023-2033 (US$ billion, AGR %)
Figure 87 France Ophthalmic Drugs Market Forecast, 2023-2033 (US$ billion, AGR %)
Figure 88 U.K. Ophthalmic Drugs Market Forecast, 2023-2033 (US$ billion, AGR %)
Figure 89 Italy Ophthalmic Drugs Market Forecast, 2023-2033 (US$ billion, AGR %)
Figure 90 Spain Ophthalmic Drugs Market Forecast, 2023-2033 (US$ billion, AGR %)
Figure 91 Rest of Europe Ophthalmic Drugs Market Forecast, 2023-2033 (US$ billion, AGR %)
Figure 92 Asia Pacific Ophthalmic Drugs Market Attractiveness Index
Figure 93 Asia Pacific Ophthalmic Drugs Market by Region, 2023, 2028 & 2033 (US$ billion)
Figure 94 Asia Pacific Ophthalmic Drugs Market Forecast by Country, 2023-2033 (US$ billion)
Figure 95 Asia Pacific Ophthalmic Drugs Market Share Forecast by Country, 2023 & 2033 (%)
Figure 96 Asia-Pacific Ophthalmic Drugs Market Forecast by Type, 2023-2033 (US$ billion)
Figure 97 Asia-Pacific Ophthalmic Drugs Market Share Forecast by Type, 2023 & 2033 (%)
Figure 98 Asia-Pacific Ophthalmic Drugs Market Forecast by Distribution Channel, 2023-2033 (US$ billion)
Figure 99 Asia-Pacific Ophthalmic Drugs Market Share Forecast by Distribution Channel, 2023 & 2033 (%)
Figure 100 Asia-Pacific Ophthalmic Drugs Market Forecast by Indications, 2023-2033 (US$ billion)
Figure 101 Asia-Pacific Ophthalmic Drugs Market Share Forecast by Indications, 2023 & 2033 (%)
Figure 102 Asia-Pacific Ophthalmic Drugs Market Forecast by Route of Administration, 2023-2033 (US$ billion)
Figure 103 Asia-Pacific Ophthalmic Drugs Market Share Forecast by Route of Administration, 2023 & 2033 (%)
Figure 104 Japan Ophthalmic Drugs Market Forecast, 2023-2033 (US$ billion, AGR %)
Figure 105 China Ophthalmic Drugs Market Forecast, 2023-2033 (US$ billion, AGR %)
Figure 106 India Ophthalmic Drugs Market Forecast, 2023-2033 (US$ billion, AGR %)
Figure 107 Australia Ophthalmic Drugs Market Forecast, 2023-2033 (US$ billion, AGR %)
Figure 108 South Korea Ophthalmic Drugs Market Forecast, 2023-2033 (US$ billion, AGR %)
Figure 109 Rest of Asia Pacific Ophthalmic Drugs Market Forecast, 2023-2033 (US$ billion, AGR %)
Figure 110 Latin America Ophthalmic Drugs Market Attractiveness Index
Figure 111 Latin America Ophthalmic Drugs Market by Region, 2023, 2028 & 2033 (US$ billion)
Figure 112 Latin America Ophthalmic Drugs Market Forecast by Country, 2023-2033 (US$ billion)
Figure 113 Latin America Ophthalmic Drugs Market Share Forecast by Country, 2023 & 2033 (%)
Figure 114 Latin America Ophthalmic Drugs Market Forecast by Type, 2023-2033 (US$ billion)
Figure 115 Latin America Ophthalmic Drugs Market Share Forecast by Type, 2023 & 2033 (%)
Figure 116 Latin America Ophthalmic Drugs Market Forecast by Distribution Channel, 2023-2033 (US$ billion)
Figure 117 Latin America Ophthalmic Drugs Market Share Forecast by Distribution Channel, 2023 & 2033 (%)
Figure 118 Latin America Ophthalmic Drugs Market Forecast by Indications, 2023-2033 (US$ billion)
Figure 119 Latin America Ophthalmic Drugs Market Share Forecast by Indications, 2023 & 2033 (%)
Figure 120 Latin America Ophthalmic Drugs Market Forecast by Route of Administration, 2023-2033 (US$ billion)
Figure 121 Latin America Ophthalmic Drugs Market Share Forecast by Route of Administration, 2023 & 2033 (%)
Figure 122 Brazil Ophthalmic Drugs Market Forecast, 2023-2033 (US$ billion, AGR %)
Figure 123 Mexico Ophthalmic Drugs Market Forecast, 2023-2033 (US$ billion, AGR %)
Figure 124 Rest of Latin America Ophthalmic Drugs Market Forecast, 2023-2033 (US$ billion, AGR %)
Figure 125 MEA Ophthalmic Drugs Market Attractiveness Index
Figure 126 MEA Ophthalmic Drugs Market by Region, 2023, 2028 & 2033 (US$ billion)
Figure 127 MEA Ophthalmic Drugs Market Forecast by Country, 2023-2033 (US$ billion)
Figure 128 MEA Ophthalmic Drugs Market Share Forecast by Country, 2023 & 2033 (%)
Figure 129 MEA Ophthalmic Drugs Market Forecast by Type, 2023-2033 (US$ billion)
Figure 130 MEA Ophthalmic Drugs Market Share Forecast by Type, 2023 & 2033 (%)
Figure 131 MEA Ophthalmic Drugs Market Forecast by Distribution Channel, 2023-2033 (US$ billion)
Figure 132 MEA Ophthalmic Drugs Market Share Forecast by Distribution Channel, 2023 & 2033 (%)
Figure 133 MEA Ophthalmic Drugs Market Forecast by Indications, 2023-2033 (US$ billion)
Figure 134 MEA Ophthalmic Drugs Market Share Forecast by Indications, 2023 & 2033 (%)
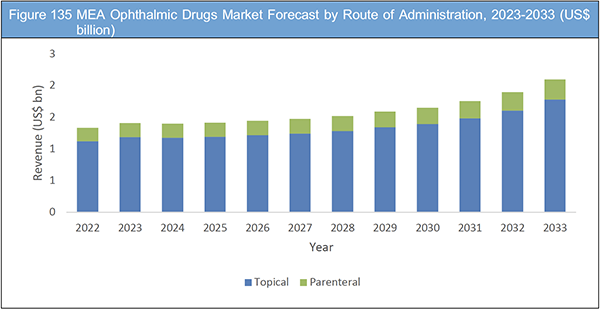
Figure 135 MEA Ophthalmic Drugs Market Forecast by Route of Administration, 2023-2033 (US$ billion)
Figure 136 MEA Ophthalmic Drugs Market Share Forecast by Route of Administration, 2023 & 2033 (%)
Figure 137 GCC Ophthalmic Drugs Market Forecast, 2023-2033 (US$ billion, AGR %)
Figure 138 South Africa Ophthalmic Drugs Market Forecast, 2023-2033 (US$ billion, AGR %)
Figure 139 Rest of MEA Ophthalmic Drugs Market Forecast, 2023-2033 (US$ billion, AGR %)
Figure 140 Ophthalmic Drugs Market: Company Share/Ranking, 2021
Figure 141 Novartis AG: Revenue, 2017-2021 (US$ million, AGR%)
Figure 142 Novartis AG: Regional Market Shares, 2021 (%)
Figure 143 Bayer AG: Net Sales, 2017-2021 (US$ million, AGR%)
Figure 144 Bayer AG: R&D Expenses, 2017-2021 (US$ million, AGR%)
Figure 145 Bayer AG: Regional Market Shares, 2021 (%)
Figure 146 Pfizer Inc.: Revenue, 2017-2021 (US$ million, AGR%)
Figure 147 Pfizer Inc.: Net Income, 2017-2021 (US$ million, AGR%)
Figure 148 Pfizer Inc.: Regional Market Shares, 2021 (%)
Figure 149 Bausch & Lomb Incorporated : Net Sales, 2017-2021 (US$ million, AGR%)
Figure 150 Bausch & Lomb Incorporated : R&D Expenses, 2017-2021 (US$ million, AGR%)
Figure 151 Bausch & Lomb Incorporated : Regional Market Shares, 2021 (%)
Figure 152 Santen Pharmaceutical Co., Ltd.: Revenue, 2017-2021 (US$ million, AGR%)
Figure 153 Santen Pharmaceutical Co., Ltd.: Net Income, 2017-2021 (US$ million, AGR%)
Figure 154 Santen Pharmaceutical Co., Ltd.: Business Segment Shares, 2021 (%)
Figure 155 Johnson & Johnson Private Limited: Revenue, 2017-2021 (US$ million, AGR%)
Figure 156 Johnson & Johnson Private Limited: R&D, 2017-2021 (US$ million, AGR%)
Figure 157 Johnson & Johnson Private Limited: Regional Market Shares, 2021 (%)
Figure 158 Regeneron Pharmaceuticals Inc.: Revenue, 2017-2021 (US$ million, AGR%)
Figure 159 Regeneron Pharmaceuticals Inc.: R&D, 2017-2021 (US$ million, AGR%)
Figure 160 AbbVie Inc.: Revenue, 2017-2021 (US$ million, AGR%)
Figure 161 AbbVie Inc.: R&D, 2017-2021 (US$ million, AGR%)
Figure 162 AbbVie Inc.: Regional Market Shares, 2021 (%)
Figure 163 F. Hoffmann-La Roche Ltd: Revenue, 2017-2021 (US$ million, AGR%)
Figure 164 F. Hoffmann-La Roche Ltd: R&D Expenses, 2017-2021 (US$ million, AGR%)
Figure 165 F. Hoffmann-La Roche Ltd: Regional Market Shares, 2021 (%)
Figure 166 Teva Pharmaceutical Industries Ltd.: Revenue, 2017-2021 (US$ million, AGR%)
Figure 167 Teva Pharmaceutical Industries Ltd.: R&D, 2017-2021 (US$ million, AGR%)
Figure 168 Teva Pharmaceutical Industries Ltd.: Regional Market Shares, 2021 (%)
List of Companies Profiled in the report
AbbVie Inc.
Bausch & Lomb Incorporated
Bayer AG
F. Hoffmann-La Roche Ltd
Johnson & Johnson Services, Inc.
Novartis AG
Pfizer Inc.
Regeneron Pharmaceuticals Inc.
Santen Pharmaceutical Co., Ltd.
Teva Pharmaceutical Industries Ltd.
List of Other Companies Mentioned in the report
Aerie Pharmaceuticals
Beximco
Carl Zeiss Meditec AG
Chengdu Kanghong Pharmaceutical
Coopervision Company
Edwards Lifesciences Corp
Essilor International S.A.
Gensight Biologics
Glaukos Corporation
Hoya Corporation
Kodiak Sciences Inc
Kubota Pharmaceutical Holdings Co Ltd
Menicon co ltd.
Neurotech
Omeros
OphthaliX /Wize Pharma
Otsuka Pharmaceutical
Phio Pharmaceuticals Corp
Recipharm AB
Staar Surgicals
Topcon Corporation
Veeva System Inc
List of Associations Mentioned in the Report
Central Drugs Standard Control Organization (CDSCO)
Department of Health and Family Welfare
European Commission
European Medicines Agency (EMA)
Food and Drug Administration (US FDA)
Indian Drug Manufacturer's Association (IDMA)
International Diabetes Federation (IDF)
Ministry of Health (MOH)
Ministry of Health, Labor and Welfare (MHLW)
Pharmaceutical and Medical Devices Agency (PMDA)
World Health Organization (WHO)