The Ophthalmic Devices Market Report 2023-2033: This report will prove invaluable to leading firms striving for new revenue pockets if they wish to better understand the industry and its underlying dynamics. It will be useful for companies that would like to expand into different industries or to expand their existing operations in a new region.
Ageing Population and Technological Advances Boosting Volume of Cataract Surgeries Globally
There has been a significant rise in the cataract surgeries in the past decade globally. Growing awareness and insurance coverage have been the primary factors boosting the cataract surgery volumes. Additionally, rise in ageing population and increased life expectancy are further anticipated to trigger the demand for cataract surgeries in developed as well as emerging countries. According to CDC in 2022, approximately 17.2 percent of the U.S. citizens above 40 years of age reported to have been detected of cataract at least in one eye which is approximately 20.5 million people of which only 6.1 million Americans had performed cataract surgery and replaced with new lenses, thus depicting huge market potential for cataract surgeries.
Moreover, CDC predicts that approximately 30 million people will be diagnosed with cataract by 2028. As per WHO (World Health Organization) 2022 report, presently 94 million people above 50 years of age have vision impairment which can be corrected through cataract surgery. Our study also shows a growing trend in demand for technologically advanced methods of conducting the cataract surgeries especially in developed countries. There has been growing preferences for office-based cataract suite coupled with adoption of softer techniques of cataract removal such as FLACS (Femtosecond Laser Assisted Cataract Surgery) and Phaco-aspiration which would replace Phaco-emulsification procedures for safer and faster outcomes. With growing affluent ageing population in countries such as Japan, China, U.S. and Korea, there has been complimentary growth in demand for premium IOLs.
Growing public awareness of premium cataract surgeries, rise in surgery centres conducting premium cataract surgeries, supportive reimbursement policies along with presence of OEMs in the country helps U.S., to continue its domination in premium cataract surgery market. However, there will be growing penetration of these premium procedures witnessed in countries such as Germany, France, Italy, U.K., India, Canada, China and Brazil during the forecast period.
What Questions Should You Ask before Buying a Market Research Report?
• How is the ophthalmic devices market evolving?
• What is driving and restraining the ophthalmic devices market?
• How will each ophthalmic devices submarket segment grow over the forecast period and how much revenue will these submarkets account for in 2033?
• How will the market shares for each ophthalmic devices submarket develop from 2023 to 2033?
• What will be the main driver for the overall market from 2023 to 2033?
• Will leading ophthalmic devices markets broadly follow the macroeconomic dynamics, or will individual national markets outperform others?
• How will the market shares of the national markets change by 2033 and which geographical region will lead the market in 2033?
• Who are the leading players and what are their prospects over the forecast period?
• What are the ophthalmic devices projects for these leading companies?
• How will the industry evolve during the period between 2023 and 2033? What are the implications of
ophthalmic devices projects taking place now and over the next 10 years?
• Is there a greater need for product commercialisation to further scale the ophthalmic devices market?
• Where is the ophthalmic devices market heading and how can you ensure you are at the forefront of the market?
• What are the best investment options for new product and service lines?
• What are the key prospects for moving companies into a new growth path and C-suite?
You need to discover how this will impact the ophthalmic devices market today, and over the next 10 years:
• Our 519-page report provides 166 tables and 243 charts/graphs exclusively to you.
• The report highlights key lucrative areas in the industry so you can target them – NOW.
• It contains in-depth analysis of global, regional and national sales and growth.
• It highlights for you the key successful trends, changes and revenue projections made by your competitors.
This report tells you TODAY how the ophthalmic devices market will develop in the next 10 years, and in line with the variations in COVID-19 economic recession and bounce. This market is more critical now than at any point over the last 10 years.
Forecasts to 2033 and other analyses reveal commercial prospects
• In addition to revenue forecasting to 2033, our new study provides you with recent results, growth rates, and market shares.
• You will find original analyses, with business outlooks and developments.
• Discover qualitative analyses (including market dynamics, drivers, opportunities, and restraints), Porter’s Five Forces Analysis, PEST Analysis and recent developments.
This report includes data analysis and invaluable insight into how COVID-19 will affect the industry and your company. Four COVID-19 recovery patterns and their impact, namely, “V”, “L”, “W” and “U” are discussed in this report.
Segments Covered in the Report
Vision Care Devices
• Spectacle Lenses
• Contact Lenses
Diagnostics Care & Monitoring Devices
• Specular Microscope
• Fundus Cameras
• Optical Coherence Tomography Scanner
• Perimeter
• Optical Biometer
• Slit Lamps
• Auto-Refractor
• Tonometer
• Ophthalmic Ultrasound Imaging Systems
• Ophthalmoscope
• Chart Projectors
• Corneal Topography Systems
• Lensometers
• Wave Front Aberrometers
• Others
Surgical Devices
• Cataract Surgery Devices
– Intraocular Lenses
– IOL Injectors
– Ophthalmic Viscoelastic Devices
– Femto-second Laser Cataract Systems
– Nd: Yag Lasers
– Phaco-emulsification Devices
• Refractive Surgery Devices
– Femto-second Laser
– Excimer Laser
– Phakic IOL
– Refractive Lens Exchange Mechanical Keratome
– Others
• Vitreoretinal Surgery Devices
– Vitrectomy Probes
– Retinal Implants
– Vitrectomy Machines
– Vitrectomy Packs
– Photo-coagulation Lasers
– Illumination Devices
• Glaucoma Surgery Devices
– Lasers
– Trab Adjunctive Devices
– Canal Surgery Devices
– Microstents
– Tube Shunts
– Sub-conjunctival Stents
• Ophthalmic OR Microscope
• Others
End-users
• Hospitals
• Diagnosis Clinics
• Franchise Optical Stores
• Eye Research Institutes
• Government Agencies
• Academics

In addition to the revenue predictions for the overall world market and segments, you will also find revenue forecasts for five regional and 20 leading national markets:
North America
• U.S.
• Canada
Europe
• Germany
• UK
• France
• Italy
• Spain
• Rest of Europe
Asia Pacific
• Japan
• China
• India
• Australia
• South Korea
• Rest of Asia Pacific
Latin America
• Brazil
• Mexico
• Rest of Latin America
MEA
• GCC
• South Africa
• Rest of MEA
Need industry data? Please contact us today.
The report also includes profiles and for some of the leading companies in the Ophthalmic Devices Market, 2023 to 2033, with a focus on this segment of these companies’ operations.
Leading companies and the potential for market growth
• Alcon
• CooperVision
• Carl Zeiss Meditec
• EssilorLuxottica
• Glaukos Corporation
• HAAG-STREIT GROUP
• HEINE Optotechnik GmbH & Co. KG
• Johnson & Johnson Vision
• LENSAR, Inc.
• Lumenis Be Ltd.
• NIDEK CO., LTD.
• Ophtec BV
• Sight Sciences
• Sonomed Escalon
• STAAR SURGICAL
• Visionix
• Ziemer Ophthalmic Systems AG
Overall world revenue for Ophthalmic Devices Market, 2023 to 2033 in terms of value the market will surpass US$64,442 million in 2023, our work calculates. We predict strong revenue growth through to 2033. Our work identifies which organizations hold the greatest potential. Discover their capabilities, progress, and commercial prospects, helping you stay ahead.
How will the Ophthalmic Devices Market, 2023 to 2033 report help you?
In summary, our 510+ page report provides you with the following knowledge:
• Revenue forecasts to 2033 for Ophthalmic Devices Market, 2023 to 2033 Market, with forecasts for vision care devices, diagnostics care & monitoring devices, surgical devices, end-users, each forecast at a global and regional level – discover the industry’s prospects, finding the most lucrative places for investments and revenues.
• Revenue forecasts to 2033 for five regional and 20 key national markets – See forecasts for the Ophthalmic Devices Market, 2023 to 2033 market in North America, Europe, Asia-Pacific, Latin America, and MEA. Also forecasted is the market in the US, Canada, Mexico, Brazil, Germany, France, UK, Italy, China, India, Japan, and Australia among other prominent economies.
• Prospects for established firms and those seeking to enter the market – including company profiles for 17 of the major companies involved in the Ophthalmic Devices Market, 2023 to 2033.
Find quantitative and qualitative analyses with independent predictions. Receive information that only our report contains, staying informed with invaluable business intelligence.
Information found nowhere else
With our new report, you are less likely to fall behind in knowledge or miss out on opportunities. See how our work could benefit your research, analyses, and decisions. Visiongain’s study is for everybody needing commercial analyses for the Ophthalmic Devices Market, 2023 to 2033, market-leading companies. You will find data, trends and predictions.
To access the data contained in this document please email contactus@visiongain.com
Buy our report today Ophthalmic Devices Market Report 2023-2033: Forecasts by Vision Care Devices (Spectacle Lenses, Contact Lenses), by Diagnostics Care & Monitoring Devices (Specular Microscope, Fundus Cameras, Optical Coherence Tomography Scanner, Perimeter, Optical Biometer, Slit Lamps, Auto-Refractor, Tonometer, Ophthalmic Ultrasound Imaging Systems, Ophthalmoscope, Chart Projectors, Corneal Topography Systems, Lensometers, Wave Front Aberrometers, Others), by Surgical Devices (Cataract Surgery Devices (Intraocular Lenses, IOL Injectors, Ophthalmic Viscoelastic Devices, Femto-second Laser Cataract Systems, Nd: Yag Lasers, Phaco-emulsification Devices)), Refractive Surgery Devices (Femto-second Laser, Excimer Laser, Phakic IOL, Refractive Lens Exchange Mechanical Keratome, Others), Vitreoretinal Surgery Devices (Vitrectomy Probes, Retinal Implants, Vitrectomy Machines, Vitrectomy Packs, Photo-coagulation Lasers, Illumination Devices), Glaucoma Surgery Devices (Lasers, Trab Adjunctive Devices, Canal Surgery Devices, Microstents, Tube Shunts, Sub-conjunctival Stents), Ophthalmic OR Microscope, Others)), by End-users (Hospitals, Diagnosis Clinics, Franchise Optical Stores, Eye Research Institutes, Government Agencies, Academics) AND Regional and Leading National Market Analysis PLUS Analysis of Leading Companies AND COVID-19 Impact and Recovery Pattern Analysis. Avoid missing out by staying informed – order our report now.
Visiongain is a trading partner with the US Federal Government
CCR Ref number: KD4R6
Do you have any custom requirements we can help you with? Any need for a specific country, geo region, market segment or specific company information? Contact us today, we can discuss your needs and see how we can help: contactus@visiongain.com
1 Report Overview
1.1 Objectives of the Study
1.2 Introduction to Ophthalmic Devices Market
1.3 What This Report Delivers
1.4 Why You Should Read This Report
1.5 Key Questions Answered by This Analytical Report
1.6 Who is This Report for?
1.7 Methodology
1.7.1 Market Definitions
1.7.2 Market Evaluation & Forecasting Methodology
1.7.3 Data Validation
1.7.3.1 Primary Research
1.7.3.2 Secondary Research
1.8 Frequently Asked Questions (FAQs)
1.9 Associated Visiongain Reports
1.10 About Visiongain
2 Executive Summary
3 Market Overview
3.1 Key Findings
3.2 Market Dynamics
3.2.1 Market Driving Factors
3.2.1.1 Rise in ageing population and technological advances boosting volume of cataract surgeries globally
3.2.1.2 Accelerating myopia in children and high myopia prevalence
3.2.1.3 Technological innovations are boosting the market growth
3.2.1.4 Private Equity model to consolidate the Eye Care Services
3.2.1.5 Telemedicine and Artificial Intelligence Revolutionizing Ophthalmic Diagnostics
3.2.1 Market Restraining Factors
3.2.1.1 High Costs of Ophthalmic Devices restrains the market growth
3.2.1.2 The recent change in Medicare surgery reimbursement may not be sufficient for some patients
3.2.1.3 The great resignation wave and perpetual shortage of skilled labour
3.2.2 Market Opportunities
3.2.2.1 Large and Mid-size ophthalmic medical device manufacturers seizing the market opportunity for dry eye disease treatment
3.2.2.2 Untapped Potential of Emerging Markets
3.2.2.3 Contact Lens based sensors for disease diagnosis and treatment presents an immense opportunity
3.3 COVID-19 Impact Analysis
3.4 Porter’s Five Forces Analysis
3.4.1 Bargaining Power of Suppliers
3.4.2 Bargaining Power of Buyers
3.4.3 Competitive Rivalry
3.4.4 Threat from Substitutes
3.4.5 Threat of New Entrants
3.5 PEST Analysis
4 Ophthalmic Vision Care Devices Market Analysis
4.1 Key Findings
4.2 Ophthalmic Vision Care Segment: Market Attractiveness Index
4.3 Ophthalmic Vision Care Devices by Market Share Analysis
4.4 Ophthalmic Vision Care Devices by Type
4.4.1 Spectacle Lenses
4.4.1.1 Market Size by Region, 2023-2033 (US$ Million)
4.4.1.2 Market Share by Region, 2023 & 2033 (%)
4.4.2 Contact Lenses
4.4.2.1 Market Size by Region, 2023-2033 (US$ Million)
4.4.2.2 Market Share by Region, 2023 & 2033 (%)
4.4.2.3 Market Size by Types, 2023-2033 (US$ Million)
4.4.2.3.1 Spherical Contact Lenses
4.4.2.3.2 Toric Contact Lenses
4.4.2.3.3 Multifocal Contact Lenses
5 Ophthalmic Diagnostics Care & Monitoring Devices Market Analysis
5.1 Key Findings
5.2 Ophthalmic Diagnostics Care & Monitoring Devices Segment: Market Attractiveness Index
5.3 Ophthalmic Diagnostic Care & Monitoring Market by Market Share Analysis
5.4 Regional Market Size Estimation and Forecast
5.5 Ophthalmic Diagnostics Care & Monitoring Devices Segment by Type
5.5.1 Specular Microscope
5.5.1.1 Market Size by Region, 2023-2033 (US$ Million)
5.5.1.2 Market Share by Region, 2023 & 2033 (%)
5.5.2 Fundus Cameras
5.5.2.1 Market Size by Region, 2023-2033 (US$ Million)
5.5.2.2 Market Share by Region, 2023 & 2033 (%)
5.5.3 Optical Coherence Tomography Scanner Market (OCT)
5.5.3.1 Market Size by Region, 2023-2033 (US$ mn)
5.5.3.2 Market Share by Region, 2023 & 2033 (%)
5.5.4 Perimeter
5.5.4.1 Market Size by Region, 2023-2033 (US$ Million)
5.5.4.2 Market Share by Region, 2023 & 2033 (%)
5.5.5 Optical Biometer
5.5.5.1 Market Size by Region, 2023-2033 (US$ Million)
5.5.5.2 Market Share by Region, 2023 & 2033 (%)
5.5.6 Slit Lamps
5.5.6.1 Market Size by Region, 2023-2033 (US$ Million)
5.5.6.2 Market Share by Region, 2023 & 2033 (%)
5.5.7 Auto-Refractor
5.5.7.1 Market Size by Region, 2023-2033 (US$ Million)
5.5.7.2 Market Share by Region, 2023 & 2033 (%)
5.5.8 Tonometer
5.5.8.1 Market Size by Region, 2023-2033 (US$ Million)
5.5.8.2 Market Share by Region, 2023 & 2033 (%)
5.5.9 Ophthalmic Ultrasound Imaging Systems
5.5.9.1 Market Size by Region, 2023-2033 (US$ Million)
5.5.9.2 Market Share by Region, 2023 & 2033 (%)
5.5.10 Ophthalmoscope
5.5.10.1 Market Size by Region, 2023-2033 (US$ Million)
5.5.10.2 Market Share by Region, 2023 & 2033 (%)
5.5.11 Chart Projectors
5.5.11.1 Market Size by Region, 2023-2033 (US$ Million)
5.5.11.2 Market Share by Region, 2023 & 2033 (%)
5.5.12 Corneal Topography Systems
5.5.12.1 Market Size by Region, 2023-2033 (US$ Million)
5.5.12.2 Market Share by Region, 2023 & 2033 (%)
5.5.13 Lensometer
5.5.13.1 Market Size by Region, 2023-2033 (US$ Million)
5.5.13.2 Market Share by Region, 2023 & 2033 (%)
5.5.14 Wave Front aberrometers
5.5.14.1 Market Size by Region, 2023-2033 (US$ Million)
5.5.14.2 Market Share by Region, 2023 & 2033 (%)
5.5.15 Others
5.5.15.1 Market Size by Region, 2023-2033 (US$ Million)
5.5.15.2 Market Share by Region, 2023 & 2033 (%)
6 Ophthalmic Surgical Devices Market Analysis
6.1 Key Findings
6.2 Ophthalmic Surgical Devices Segment: Market Attractiveness Index
6.3 Ophthalmic Surgical Devices by Market Share Analysis
6.4 Market Size by Region, 2023-2033 (US$ Million)
6.5 Ophthalmic Surgical Devices Market Size Estimation and Forecast by Type
6.5.1 Cataract Surgery
6.5.1.1 Market Size by Region, 2023-2033 (US$ Million)
6.5.1.2 Market Share by Region, 2023 & 2033 (%)
6.5.1.3 Market by Type, 2023 -2033 (US$ Million)
6.5.1.3.1 Intraocular Lens Market (IOLs)
6.5.1.3.2 Intraocular Injectors Market
6.5.1.3.3 Viscoelastic Devices (OVDs)
6.5.1.3.4 Femtosecond Laser Cataract Systems (FLACS)
6.5.1.3.5 Nd: YAG Lasers
6.5.1.3.6 Phacoemulsification Devices
6.5.2 Vitreoretinal Surgery Devices
6.5.2.1 Market Size by Region, 2023-2033 (US$ Million)
6.5.2.2 Market Size by Region, 2023-2033 (%)
6.5.2.3 Market by Type, 2023 -2033 (US$ Million)
6.5.2.3.1 Vitrectomy Probes
6.5.2.3.2 Retinal Implants (IOLs)
6.5.2.3.3 Vitrectomy Machines
6.5.2.3.4 Vitrectomy Packs
6.5.2.3.5 Photocoagulation Lasers
6.5.2.3.6 Illumination Devices
6.5.3 Refractive Surgery
6.5.3.1 Market Size by Region, 2023-2033 (US$ Million)
6.5.3.2 Market Share by Region, 2023 & 2033 (%)
6.5.3.3 Market Size by Type, 2023-2033 (US$ Million)
6.5.3.3.1 Femtosecond Laser
6.5.3.3.2 Excimer Laser
6.5.3.3.3 Phakic IOLs
6.5.3.3.4 Refractive Lens Exchange (RLE)
6.5.3.3.5 Mechanical Keratome
6.5.3.3.6 Others
6.5.4 Glaucoma Surgery Devices
6.5.4.1 Market Size by Region, 2023-2033 (US$ Million)
6.5.4.2 Market Share by Region, 2023 & 2033 (%)
6.5.4.3 Market Size by Type, 2023-2033 (US$ Million)
6.5.4.3.1 Glaucoma Laser
6.5.4.3.2 Trab Adjunctive Devices
6.5.4.3.3 Canal Surgical Devices
6.5.4.3.4 Subconjunctival Shunts
6.5.4.3.5 Tube Shunts
6.5.4.3.6 Microstents (MIGS)
6.5.5 Ophthalmic Operating Room (OR) Microscope
6.5.5.1 Market Size by Region, 2023-2033 (US$ Million)
6.5.5.2 Market Share by Region, 2023 & 2033 (%)
6.5.6 Other Surgical Devices
6.5.6.1 Market Size by Region, 2023-2033 (US$ Million)
6.5.6.2 Market Share by Region, 2023 & 2033 (%)
7 Ophthalmic Devices Market, By End-Users
7.1 Key Findings
7.2 Ophthalmic Devices Segment, By End-users: Market Attractiveness Index
7.3 Ophthalmic Surgical Devices Market Size Estimation and Forecast by End-users
7.4 Regional Market Size Estimation and Forecast
7.5 Hospitals
7.5.1 Market Size by Region, 2023-2033 (US$ Million)
7.5.2 Market Share by Region, 2023 & 2033 (%)
7.6 Diagnosis Clinics
7.6.1 Market Size by Region, 2023-2033 (US$ Million)
7.6.2 Market Share by Region, 2023 & 2033 (%)
7.7 Franchise Optical Stores
7.7.1 Market Share by Region, 2023 & 2033 (%)
7.7.2 Market Size by Region, 2023-2033 (US$ Million)
7.8 Eye Research Institutes
7.8.1 Market Size by Region, 2023-2033 (US$ Million)
7.8.2 Market Share by Region, 2023 & 2033 (%)
7.9 Government Agencies
7.9.1 Market Size by Region, 2023-2033 (US$ Million)
7.9.2 Market Share by Region, 2023 & 2033 (%)
7.10 Academics
7.10.1 Market Size by Region, 2023-2033 (US$ Million)
7.10.2 Market Share by Region, 2023 & 2033 (%)
8 Ophthalmic Devices Market Analysis by Region
8.1 Key Findings
8.2 Regional Market Size Estimation and Forecast
9 North America Ophthalmic Devices Market Analysis
9.1 Key Findings
9.2 North America Ophthalmic Devices Market Attractiveness Index
9.3 North America Ophthalmic Devices Market by Country, 2023, 2028 & 2033 (US$ Million)
9.4 North America Ophthalmic Devices Market Size Estimation and Forecast by Country
9.5 North America Ophthalmic Devices Market Size Estimation and Forecast by Type
9.6 North America Vision Care Devices Market Size Estimation and Forecast by Type
9.7 North America Diagnostics Care & Monitoring Market Devices Size Estimation and Forecast by Type
9.8 North America Surgical Devices Market Size Estimation and Forecast by Type
9.9 North America Ophthalmic Devices Market Size Estimation and Forecast by End-Users Market
9.10 U.S. Ophthalmic Devices Market Analysis
9.11 Canada Ophthalmic Devices Market Analysis
10 Europe Ophthalmic Devices Market Analysis
10.1 Key Findings
10.2 Europe Ophthalmic Devices Market Attractiveness Index
10.3 Europe Ophthalmic Devices Market by Country, 2023, 2028 & 2033 (US$ Million)
10.4 Europe Ophthalmic Devices Market Size Estimation and Forecast by Country
10.5 Europe Ophthalmic Devices Market Size Estimation and Forecast by Type
10.6 Europe Vision Care Devices Market Size Estimation and Forecast by Type
10.7 Europe Diagnostics Care & Monitoring Devices Market Size Estimation and Forecast by Type
10.8 Europe Surgical Devices Market Size Estimation and Forecast by Type
10.9 Europe Ophthalmic Devices Market Size Estimation and Forecast by End-Users Market
10.10 Germany Ophthalmic Devices Market Analysis
10.11 UK Ophthalmic Devices Market Analysis
10.12 France Ophthalmic Devices Market Analysis
10.13 Italy Ophthalmic Devices Market Analysis
10.14 Spain Ophthalmic Devices Market Analysis
10.15 Rest of Europe (ROE) Ophthalmic Devices Market Analysis
11 Asia Ophthalmic Devices Market Analysis
11.1 Key Findings
11.2 Asia Ophthalmic Devices Market Attractiveness Index
11.3 Asia Ophthalmic Devices Market by Country, 2023, 2028 & 2033 (US$ Million)
11.4 Asia Ophthalmic Devices Market Size Estimation and Forecast by Country
11.5 Asia Ophthalmic Devices Market Size Estimation and Forecast by Type
11.6 Asia Vision Care Devices Market Size Estimation and Forecast by Type
11.7 Asia Diagnostics Care & Monitoring Devices Market Size Estimation and Forecast by Type
11.8 Asia Surgical Devices Market Size Estimation and Forecast by Type
11.9 Asia Ophthalmic Devices Market Size Estimation and Forecast by End-Users Market
11.10 Japan Ophthalmic Devices Market Analysis
11.11 China Ophthalmic Devices Market Analysis
11.12 India Ophthalmic Devices Market Analysis
11.13 South Korea Ophthalmic Devices Market Analysis
11.14 Australia Ophthalmic Devices Market Analysis
11.15 Rest of Asia Pacific Ophthalmic Devices Market Analysis
12 Latin America Ophthalmic Devices Market Analysis
12.1 Key Findings
12.2 Latin America Ophthalmic Devices Market Attractiveness Index
12.3 Latin America Ophthalmic Devices Market by Country, 2023, 2028 & 2033 (US$ Million)
12.4 Latin America Ophthalmic Devices Market Size Estimation and Forecast by Country
12.5 Latin America Ophthalmic Devices Market Size Estimation and Forecast by Type
12.6 Latin America Vision Care Devices Market Size Estimation and Forecast by Type
12.7 Latin America Diagnostics Care & Monitoring Devices Market Size Estimation and Forecast by Type
12.8 Latin America Surgical Devices Market Size Estimation and Forecast by Type
12.9 Latin America Ophthalmic Devices Market Size Estimation and Forecast by End-Users Market
12.10 Brazil Ophthalmic Devices Market Analysis
12.11 Mexico Ophthalmic Devices Market Analysis
12.12 Rest of Latin America Ophthalmic Devices Market Analysis
13 Middle East & Africa Ophthalmic Devices Market Analysis
13.1 Key Findings
13.2 Middle East & Africa Ophthalmic Devices Market Attractiveness Index
13.3 Middle East & Africa Ophthalmic Devices Market by Country, 2023, 2028 & 2033 (US$ Million)
13.4 Middle East & Africa Ophthalmic Devices Market Size Estimation and Forecast by Country
13.5 Middle East & Africa Ophthalmic Devices Market Size Estimation and Forecast by Type
13.6 Middle East & Africa Vision Care Devices Market Size Estimation and Forecast by Type
13.7 Middle East & Africa Diagnostics Care & Monitoring Devices Market Size Estimation and Forecast by Type
13.8 Middle East & Africa Surgical Devices Market Size Estimation and Forecast by Type
13.9 Middle East & Africa Ophthalmic Devices Market Size Estimation and Forecast by End-Users Market
13.10 GCC Ophthalmic Devices Market Analysis
13.11 South Africa Ophthalmic Devices Market Analysis
13.12 Rest of MEA Ophthalmic Devices Market Analysis
14 Company Profiles
14.1 Competitive Landscape, 2022
14.2 Strategic Outlook
14.3 Alcon
14.3.1 Company Snapshot
14.3.2 Company Overview
14.3.3 Financial Analysis
14.3.3.1 Net Revenue, 2017-2022
14.3.3.2 R&D, 2017-2022
14.3.3.3 Regional Market Shares, 2022
14.3.3.4 Segmental Revenues, 2017-2022
14.3.4 Product Benchmarking
14.3.5 Strategic Outlook
14.4 Glaukos Corporation
14.4.1 Company Snapshot
14.4.2 Company Overview
14.4.3 Financial Analysis
14.4.3.1 Net Revenue, 2017-2022
14.4.3.2 R&D, 2017-2022
14.4.3.3 Regional Market Shares, 2022
14.4.3.4 Segmental Revenues, 2017-2022
14.4.4 Product Benchmarking
14.4.5 Strategic Outlook
14.5 STAAR SURGICAL
14.5.1 Company Snapshot
14.5.2 Company Overview
14.5.3 Financial Analysis
14.5.3.1 Net Revenue, 2017-2022
14.5.3.2 R&D, 2017-2022
14.5.3.3 Regional Market Shares, 2022
14.5.4 Product Benchmarking
14.5.5 Strategic Outlook
14.6 Ziemer Ophthalmic Systems AG
14.6.1 Company Snapshot
14.6.2 Company Overview
14.6.3 Product Benchmarking
14.6.4 Strategic Outlook
14.7 Lumenis Be Ltd.
14.7.1 Company Snapshot
14.7.2 Company Overview
14.7.3 Product Benchmarking
14.7.4 Strategic Outlook
14.8 Ophtec BV
14.8.1 Company Snapshot
14.8.2 Company Overview
14.8.3 Product Benchmarking
14.8.4 Strategic Outlook
14.9 Carl Zeiss Meditec AG
14.9.1 Company Snapshot
14.9.2 Company Overview
14.9.3 Financial Analysis
14.9.3.1 Net Revenue, 2017-2022
14.9.3.2 R&D, 2017-2022
14.9.3.3 Regional Market Shares, 2022
14.9.4 Product Benchmarking
14.9.5 Strategic Outlook
14.10 Johnson & Johnson Vision
14.10.1 Company Snapshot
14.10.2 Company Overview
14.10.3 Financial Analysis
14.10.3.1 Net Revenue, 2017-2022
14.10.3.2 R&D, 2017-2022
14.10.3.3 Regional Market Shares, 2022
14.10.3.4 Segmental Revenues, 2017-2022
14.10.4 Product Benchmarking
14.10.5 Strategic Outlook
14.11 CooperVision
14.11.1 Company Snapshot
14.11.2 Company Overview
14.11.3 Financial Analysis
14.11.3.1 Net Revenue, 2017-2022
14.11.3.2 R&D, 2017-2022
14.11.3.3 Regional Market Share, 2022
14.11.4 Product Benchmarking
14.11.5 Strategic Outlook
14.12 NIDEK CO., LTD.
14.12.1 Company Snapshot
14.12.2 Company Overview
14.12.3 Financial Analysis
14.12.3.1 Segmental Revenues, 2017-2022
14.12.3.2 R&D, 2017-2022
14.12.4 Product Benchmarking
14.12.5 Strategic Outlook
14.13 Sonomed Escalon
14.13.1 Company Snapshot
14.13.2 Company Overview
14.13.3 Financial Analysis
14.13.3.1 Net Revenue, 2017-2022
14.13.3.2 R&D, 2017-2022
14.13.3.3 Regional Market Shares, 2022
14.13.4 Product Benchmarking
14.13.5 Strategic Outlook
14.14 HAAG-STREIT GROUP
14.14.1 Company Snapshot
14.14.2 Company Overview
14.14.3 Product Benchmarking
14.14.4 Strategic Outlook
14.15 HEINE Optotechnik GmbH & Co. KG
14.15.1 Company Snapshot
14.15.2 Company Overview
14.15.3 Product Benchmarking
14.15.4 Strategic Outlook
14.16 Visionix
14.16.1 Company Snapshot
14.16.2 Company Overview
14.16.3 Product Benchmarking
14.16.4 Strategic Outlook
14.17 Sight Sciences
14.17.1 Company Snapshot
14.17.2 Company Overview
14.17.3 Financial Analysis
14.17.3.1 Net Revenue, 2017-2022
14.17.3.2 R&D, 2017-2022
14.17.4 Product Benchmarking
14.17.5 Strategic Outlook
14.18 LENSAR, Inc.
14.18.1 Company Snapshot
14.18.2 Company Overview
14.18.3 Financial Analysis
14.18.3.1 Net Revenue, 2017-2022
14.18.3.2 R&D, 2017-2022
14.18.3.3 Regional Market Shares, 2022
14.18.4 Product Benchmarking
14.18.5 Strategic Outlook
14.19 EssilorLuxottica
14.19.1 Company Snapshot
14.19.2 Company Overview
14.19.3 Financial Analysis
14.19.3.1 Net Revenue, 2017-2022
14.19.3.2 R&D, 2017-2022
14.19.3.3 Regional Market Shares, 2022
14.19.4 Product Benchmarking
14.19.5 Strategic Outlook
15 Conclusion and Recommendations
15.1 Concluding Remarks from Visiongain
15.2 Recommendations for Market Players
List of Tables
Table 1 Ophthalmic Devices Market Snapshot, 2023 & 2033 (US$ Million, CAGR %)
Table 2 Ophthalmic Devices: Recent Major Mergers/Acquisitions & Funding
Table 3 Ophthalmic Instruments : Pricing List (US$)
Table 4 Global Ophthalmologic Devices Market Forecast by Region 2022-2032 (US$ Mn, AGR%, CAGR%): "V" Shaped Recovery
Table 5 Ophthalmic Devices Market Forecast by Region 2022-2032 (US$ Million, AGR%, CAGR%): "U" Shaped Recovery
Table 6 Global Ophthalmologic Devices Market Forecast by Region 2022-2032 (US$ Million, AGR%, CAGR%): "W" Shaped Recovery
Table 7 Global Ophthalmic Devices Market Forecast by Region 2022-2032 (US$ Million, AGR%, CAGR%): "L" Shaped Recovery
Table 8 Ophthalmic Devices Market Forecast by Vision Care by Type, 2023-2033 (US$ Million, AGR%, CAGR %)
Table 9 Spectacles Lenses Market Forecast by Region, 2023-2033 (US$ Million, AGR%, CAGR %)
Table 10 Contact Lenses Market Forecast by Region, 2023-2033 (US$ Million, AGR%, CAGR %)
Table 11 Contact Lenses Market Forecast by Type, 2023-2033 (US$ Million, AGR%, CAGR %)
Table 12 Ophthalmic Diagnostics & Monitoring Devices Market Forecast by Region, 2023-2033 (US$ Million, AGR%, CAGR %)
Table 13 Diagnostic Care & Monitoring Market Forecast by Type, 2023-2033 (US$ Million, AGR%, CAGR %)
Table 14 Specular Microscope Market Forecast by Region, 2023-2033 (US$ Million, AGR%, CAGR %)
Table 15 Fundus Camera Market Forecast by Region, 2023-2033 (US$ Million, AGR%, CAGR %)
Table 16 Major Players of OCT and OCT Imaging Systems
Table 17 Optical Coherence Tomography Scanner Market Forecast by Region, 2023-2033 (US$ Million, AGR%, CAGR %)
Table 18 Major Players of Visual Field Analyzers/ Perimeter
Table 19 Perimeter Market Forecast by Region, 2023-2033, (US$ Million, AGR%, CAGR %)
Table 20 Major Players of Optimeter and Optometry Systems
Table 21 Optical Biometer Market Forecast, By Region 2023-2033 (US$ Million, AGR%, CAGR %)
Table 22 Slit Lamps Market Forecast by Region, 2023-2033 (US$ Million, AGR%, CAGR %)
Table 23 Major Players of Auto-Refractometer and Auto-Refractometer Models
Table 24 Auto-Refractor Market Forecast by Region 2023-2033 (US$ Million, AGR%, CAGR %)
Table 25 Major Players of Tonometer and Tonometer Systems
Table 26 Tonometer Market Forecast by Region 2023-2033, (US$ Million, AGR%, CAGR %)
Table 27 Major Players of AB Ultrasound Systems
Table 28 Ophthalmic Ultrasound Imaging Systems Market Forecast, By Region, 2023-2033 (US$ Million, AGR%, CAGR %)
Table 29 Ophthalmoscope Market Forecast by Region 2023-2033, (US$ Million, AGR%, CAGR %)
Table 30 Chart Projectors Market by Region, 2023-2033 (US$ Million, AGR%, CAGR %)
Table 31 Major Players of corneal Topography Systems & Models
Table 32 Corneal Topography Systems Market, 2023-2033, By Region (US$ Million, AGR%, CAGR %)
Table 33 Major Players of Lensometer & Models
Table 34 Global Lensometers Market, 2023-2033, By Region (US$ Million, AGR%, CAGR %)
Table 35 Major Players of Wavefront/ Aberrometers & Models
Table 36 Wave Front Aberrometers Market Forecast by Region, 2023-2033 (US$ Million, AGR%, CAGR %)
Table 37 Other Ophthalmic Diagnostic Device Market, 2023-2033, By Region (US$ Million, AGR%, CAGR %)
Table 38 Ophthalmic Surgical Devices Market Forecast by Region, 2023-2033 (US$ Million, AGR%, CAGR %)
Table 39 Ophthalmic Surgical Devices Market Forecast by Type, 2023-2033 (US$ Million, AGR%, CAGR %)
Table 40 Cataract Surgery Devices Market, 2023-2033 (US$ Million, AGR%, CAGR %)
Table 41 Cataract Surgical Devices Forecast Market by Type, 2023-2033 (US$ Million, AGR%, CAGR %)
Table 42 Major Players of Cataract IOLs & IOLs (including. Pipeline IOLs)
Table 43 Major Players of OVDs & Commercial OVDs
Table 44 Major Players of YAG systems & Commercial YAG systems
Table 45 Vitrectomy Surgery Market Forecast by Region, 2023-2033, (US$ Million, AGR%, CAGR %)
Table 46 Vitreoretinal Surgery Devices Market Forecast by Type, 2023-2033 (US$ Million, AGR%, CAGR %)
Table 47 Refractive Surgery Devices Market Forecast by Region 2023-2033 (US$ Million, AGR%, CAGR %)
Table 48 Refractive Surgery Devices Forecast by Type, 2023-2033 (US$ Million, AGR%, CAGR %)
Table 49 Glaucoma Surgical Devices Market, 2023-2033 (US$ Million, AGR%, CAGR %)
Table 50 Glaucoma Surgical Devices Market Forecast by Type, 2023-2033 (US$ Million, AGR%, CAGR %)
Table 51 Major Players of Glaucoma Laser Systems & the Laser Technique
Table 52 Major Players of Glaucoma Tube Shunts & Models
Table 53 Ophthalmic OR Microscope Market Forecast by Region, 2023-2033 (US$ Million, AGR%, CAGR %)
Table 54 Major Players of Optimeter and Optometry Systems
Table 55 Other Surgical Devices Market Forecast by Region, 2023-2033 (US$ Million, AGR%, CAGR %)
Table 56 Global Ophthalmic Devices Market Forecast by End-Users, 2023-2033 (US$ Million, AGR%, CAGR %)
Table 57 Global Ophthalmic Devices End-Users Market Forecast by Region, 2023-2033 (US$ Million, AGR%, CAGR %)
Table 58 Hospitals Market Forecast by Region, 2023-2033 (US$ Million, AGR%, CAGR %)
Table 59 Diagnostic Clinics Market Forecast by Region, 2023-2033 (US$ Million, AGR%, CAGR %)
Table 60 Franchise Optical Stores Market Forecast by Region, 2023-2033 (US$ Million, AGR%, CAGR %)
Table 61 Eye Research Institutes Market Forecast by Region, 2023-2033 (US$ Million, AGR%, CAGR %)
Table 62 Government Agencies Market Forecast by Region, 2023-2033 (US$ Million, AGR%, CAGR %)
Table 63 Academics Market Forecast by Region, 2023-2033 (US$ Million, AGR%, CAGR %)
Table 64 Ophthalmic Devices Market Forecast by Region 2023-2033 (US$ Million, AGR%, CAGR %)
Table 65 North America Ophthalmic Devices Market Forecast by Country, 2023-2033 (US$ Million, AGR%, CAGR %)
Table 66 North America Ophthalmic Devices Market Forecast by Type, 2023-2033 (US$ Million, AGR%, CAGR %)
Table 67 North America Vision Care Devices Market Forecast by Type, 2023-2033 (US$ Million, AGR%, CAGR %)
Table 68 North America Diagnostic Care & Monitoring Devices Market Forecast by Type, 2023-2033 (US$ Million, AGR%, CAGR %)
Table 69 North America Surgical Devices Market Forecast by Type, 2023-2033 (US$ Mn, AGR%, CAGR %)
Table 70 North America Ophthalmic Devices Market Forecast by End-Users, 2023-2033 (US$ Million, AGR%, CAGR %)
Table 71 U.S. Ophthalmic Devices Market Forecast, 2023-2033 (US$ Million, AGR%, CAGR %)
Table 72 Canada Ophthalmic Devices Market Forecast, 2023-2033 (US$ Million, AGR%, CAGR %)
Table 73 Europe Ophthalmic Devices Market Forecast by Country, 2023-2033 (US$ Mn, AGR%, CAGR %)
Table 74 Europe Ophthalmic Devices Market Forecast by Type, 2023-2033 (US$ Million, AGR%, CAGR %)
Table 75 Europe Vision Care Devices Market Forecast by Type, 2023-2033 (US$ Million, AGR%, CAGR %)
Table 76 Europe Diagnostic Care & Monitoring Devices Market Forecast by Type, 2023-2033 (US$ Million, AGR%, CAGR %)
Table 77 Europe Surgical Devices Market Forecast by Type, 2023-2033 (US$ Million, AGR%, CAGR %)
Table 78 Europe Ophthalmic Devices Market Forecast by End-Users, 2023-2033 (US$ Million, AGR%, CAGR %)
Table 79 Germany Ophthalmology Market Forecast, 2023-2033 (US$ Million, AGR%, CAGR %)
Table 80 UK Ophthalmology Market Forecast, 2023-2033 (US$ Mn, AGR%, CAGR %)
Table 81 France Ophthalmology Market Forecast, 2023-2033 (US$ Million, AGR%, CAGR %)
Table 82 Italy Ophthalmology Market Forecast, 2023-2033 (US$ Million, AGR%, CAGR %)
Table 83 Spain Ophthalmology Market Forecast, 2023-2033 (US$ Million, AGR%, CAGR %)
Table 84 Rest of Europe Ophthalmology Market Forecast, 2022-2032 (US$ Million, AGR%, CAGR %)
Table 85 Asia Pacific Ophthalmic Devices Market Forecast by Country, 2023-2033 (US$ Million, AGR%, CAGR %)
Table 86 Asia Pacific Ophthalmic Devices Market Forecast by Type, 2023-2033 (US$ Million, AGR%, CAGR %)
Table 87 Asia Pacific Vision Care Devices Market Forecast by Type, 2023-2033 (US$ Million, AGR%, CAGR %)
Table 88 Asia Pacific Diagnostic Care & Monitoring Devices Market Forecast by Type, 2023-2033 (US$ Million, AGR%, CAGR %)
Table 89 Asia Pacific Surgical Devices Market Forecast by Type, 2023-2033 (US$ Million, AGR%, CAGR %)
Table 90 Asia Pacific Ophthalmic Devices Market Forecast by End-Users, 2023-2033 (US$ Million, AGR%, CAGR %)
Table 91 Japan Ophthalmic Devices Market Forecast, 2023-2033 (US$ Million, AGR%, CAGR %)
Table 92 China Ophthalmology Market Forecast, 2023-2033 (US$ Million, AGR%, CAGR %)
Table 93 India Ophthalmology Market Forecast, 2023-2033 (US$ Million, AGR%, CAGR %)
Table 94 South Korea Ophthalmic Devices Market Forecast, 2023-2033 (US$ Million, AGR%, CAGR %)
Table 95 Australia Ophthalmologic Devices Market Forecast, 2023-2033 (US$ Million, AGR%, CAGR %)
Table 96 Rest of Asia Pacific Ophthalmology Market Forecast, 2023-2033 (US$ Million, AGR%, CAGR %)
Table 97 Latin America Ophthalmic Devices Market Forecast by Country, 2023-2033 (US$ Million, AGR%, CAGR %)
Table 98 Latin America Ophthalmic Devices Market Forecast by Type, 2023-2033 (US$ Million, AGR%, CAGR %)
Table 99 Latin America Vision Care Devices Market Forecast by Type, 2023-2033 (US$ Million, AGR%, CAGR %)
Table 100 Latin America Diagnostic Care & Monitoring Market Forecast by Type, 2023-2033 (US$ Million, AGR%, CAGR %)
Table 101 Latin America Surgical Devices Market Forecast by Type, 2023-2033 (US$ Million, AGR%, CAGR %)
Table 102 Latin America Ophthalmic Devices Market Forecast by End-Users, 2023-2033 (US$ Million, AGR%, CAGR %)
Table 103 Brazil Ophthalmic Devices Market Forecast, 2023-2033 (US$ Million, AGR%, CAGR %)
Table 104 Mexico Ophthalmologic Devices Market Forecast, 2023-2033 (US$ Million, AGR%, CAGR %)
Table 105 Rest of Latin America Ophthalmic Devices Market Forecast, 2023-2033 (US$ Million, AGR%, CAGR %)
Table 106 Middle East & Africa Ophthalmic Devices Market Forecast by Country, 2023-2033 (US$ Mn, AGR%, CAGR %)
Table 107 Middle East & Africa Ophthalmic Devices Market Forecast by Type, 2023-2033 (US$ Million, AGR%, CAGR %)
Table 108 Middle East & Africa Vision Care Devices Market Forecast by Type, 2023-2033 (US$ Million, AGR%, CAGR %)
Table 109 Middle East & Africa Diagnostic Care & Monitoring Devices Market Forecast by Type, 2023-2033 (US$ Million, AGR%, CAGR %)
Table 110 Middle East & Africa Surgical Devices Market Forecast by Type, 2023-2033 (US$ Mn, AGR%, CAGR %)
Table 111 Middle East & Africa Ophthalmic Devices Market Forecast by End-Users, 2023-2033 (US$ Million, AGR%, CAGR %)
Table 112 GCC Ophthalmic Devices Market Forecast, 2023-2033 (US$ Million, AGR%, CAGR %)
Table 113 South Africa Ophthalmic Devices Market Forecast, 2023-2033 (US$ Million, AGR%, CAGR %)
Table 114 Rest of MEA Ophthalmic Devices Market Forecast, 2023-2033 (US$ Mn, AGR%, CAGR %)
Table 115 Strategic Outlook
Table 116 Alcon: Key Details, (CEO, HQ, Revenue, Founded, No. of Employees, Company Type, Website, Business Segment)
Table 117 Alcon: Product Benchmarking
Table 118 Alcon: Strategic Outlook
Table 119 Glaukos Corporation: Key Details, (CEO, HQ, Revenue, Founded, No. of Employees, Company Type, Website, Business Segment)
Table 120 Glaukos Corp: Product Benchmarking
Table 121 Glaukos Corporation: Strategic Outlook
Table 122 STAAR SURGICAL: Key Details, (CEO, HQ, Revenue, Founded, No. of Employees, Company Type, Website, Business Segment)
Table 123 STAAR SURGICAL: Product Benchmarking
Table 124 STAAR SURGICAL: Strategic Outlook
Table 125 Ziemer Ophthalmic Systems AG: Key Details, (CEO, HQ, Revenue, Founded, No. of Employees, Company Type, Website, Business Segment)
Table 126 Ziemer Ophthalmic Systems AG: Product Benchmarking
Table 127 Ziemer Ophthalmic Systems AG: Strategic Outlook
Table 128 Lumenis Be Ltd.: Key Details, (CEO, HQ, Revenue, Founded, No. of Employees, Company Type, Website, Business Segment)
Table 129 Lumenis Be Ltd.: Product Benchmarking
Table 130 Lumenis Be Ltd.: Strategic Outlook
Table 131 Ophtec BV: Key Details, (CEO, HQ, Revenue, Founded, No. of Employees, Company Type, Website, Business Segment)
Table 132 Ophtec BV: Product Benchmarking
Table 133 Ophtec BV: Strategic Outlook
Table 134 Carl Zeiss Meditec AG: Key Details, (CEO, HQ, Revenue, Founded, No. of Employees, Company Type, Website, Business Segment)
Table 135 Carl Zeiss Meditec AG: Product Benchmarking
Table 136 Carl Zeiss Meditec AG: Strategic Outlook
Table 137 Johnson & Johnson Vision: Key Details, (CEO, HQ, Revenue, Founded, No. of Employees, Company Type, Website, Business Segment)
Table 138 Johnson & Johnson Vision: Product Benchmarking
Table 139 Johnson & Johnson Vision: Strategic Outlook
Table 140 CooperVision: Key Details, (CEO, HQ, Revenue, Founded, No. of Employees, Company Type, Website, Business Segment)
Table 141 CooperVision: Product Benchmarking
Table 142 CooperVision: Strategic Outlook
Table 143 NIDEK CO., LTD.: Key Details, (CEO, HQ, Revenue, Founded, No. of Employees, Company Type, Website, Business Segment)
Table 144 NIDEK CO., LTD.: Product Benchmarking
Table 145 NIDEK CO., LTD.: Strategic Outlook
Table 146 Sonomed Escalon : Key Details, (CEO, HQ, Revenue, Founded, No. of Employees, Company Type, Website, Business Segment)
Table 147 Sonomed Escalon: Product Benchmarking
Table 148 Sonomed Escalon: Strategic Outlook
Table 149 HAAG-STREIT GROUP: Key Details, (CEO, HQ, Revenue, Founded, No. of Employees, Company Type, Website, Business Segment)
Table 150 HAAG-STREIT Group: Product Benchmarking
Table 151 HAAG-STREIT Group: Strategic Outlook
Table 152 HEINE Optotechnik GmbH & Co. KG: Key Details, (CEO, HQ, Revenue, Founded, No. of Employees, Company Type, Website, Business Segment)
Table 153 HEINE Optotechnik GmbH & Co. KG: Product Benchmarking
Table 154 HEINE Optotechnik GmbH & Co. KG: Strategic Outlook
Table 155 Visionix: Key Details, (CEO, HQ, Revenue, Founded, No. of Employees, Company Type, Website, Business Segment)
Table 156 Visionix: Product Benchmarking
Table 157 Visionix: Strategic Outlook
Table 158 Sight Sciences: Key Details, (CEO, HQ, Revenue, Founded, No. of Employees, Company Type, Website, Business Segment)
Table 159 Sight Sciences: Product Benchmarking
Table 160 Sight Sciences: Strategic Outlook
Table 161 LENSAR, Inc.: Key Details, (CEO, HQ, Revenue, Founded, No. of Employees, Company Type, Website, Business Segment)
Table 162 LENSAR, Inc.: Product Benchmarking
Table 163 LENSAR, Inc.: Strategic Outlook
Table 164 EssilorLuxottica: Key Details, (CEO, HQ, Revenue, Founded, No. of Employees, Company Type, Website, Business Segment)
Table 165 EssilorLuxottica: Product Benchmarking
Table 166 EssilorLuxottica: Strategic Outlook
List of Figures
Figure 1 Ophthalmic Devices Market Segmentation
Figure 2 Ophthalmic Vision Care Devices by Type : Market Attractiveness Index
Figure 3 Ophthalmic Diagnostics Care & Monitoring Devices by Type: Market Attractiveness Index
Figure 4 Ophthalmic Surgical Devices by Type: Market Attractiveness Index
Figure 5 Ophthalmic Devices Market Attractiveness Index by End-users
Figure 6 Ophthalmic Devices Market Attractiveness Index by Region
Figure 7 Ophthalmic Devices Market: Market Dynamics
Figure 8 Ophthalmic Devices Market by Region, 2023-2033 (US$ Million, AGR (%), CAGR (%)): “V” Shaped Recovery
Figure 9 Ophthalmic Devices Market by Region, 2023-2033 (US$ Million, AGR% ,CAGR %): “U” Shaped Recovery
Figure 10 Ophthalmic Devices Market by Region, 2023-2033 (US$ Million, AGR %, CAGR %): “W” Shaped Recovery
Figure 11 Ophthalmic Devices Market by Region, 2023-2033 (US$ Million, AGR %, CAGR %): “L” Shaped Recovery
Figure 12 Ophthalmic Devices : Market: Porter’s Five Forces Analysis
Figure 13 Global Ophthalmic Market: PEST Analysis
Figure 14 Ophthalmic Vision Care Devices: Market Attractiveness Index
Figure 15 Spectacle Lenses Market Share, 2022 (%)
Figure 16 Contact Lenses Market Share Analysis, 2022 (%)
Figure 17 Ophthalmic Vision Care Devices Market Forecast by Type, 2023-2033 (US$ Million, AGR %)
Figure 18 Ophthalmic Vision Care Devices Market Share Forecast by Type, 2023, 2028, 2033 (%)
Figure 19 Spectacle Lenses Market Forecast by Region, 2023-2033 (US$ Million, AGR %)
Figure 20 Spectacle Lenses Market Forecast by Region, 2023 &2033 (%)
Figure 21 Contact Lenses Market Forecast by Region, 2023-2033 (US$ Million, AGR %)
Figure 22 Contact Lenses Market Forecast by Region, 2023 & 2033 (%)
Figure 23 Spherical Contact Lenses Market Forecast by Region, 2023-2033 (US$ Million, AGR %)
Figure 24 Toric Contact Lenses Market Forecast by Region, 2023-2033 (US$ Million, AGR %)
Figure 25 Multifocal Contact Lenses Market Forecast by Region, 2023-2033 (US$ Million, AGR %)
Figure 26 Ophthalmic Diagnostics Care & Monitoring Devices: Market Attractiveness Index
Figure 27 Ophthalmic Diagnostics & Monitoring Devices Market, By Market Share, 2022 (%)
Figure 28 Ophthalmic Diagnostics & Monitoring Devices Market Forecast by Region, 2023-2033 (US$ Million, AGR %)
Figure 29 Diagnostic Care & Monitoring Market Forecast by Type, 2023-2033 (US$ Million, AGR %)
Figure 30 Diagnostic Care & Monitoring Market Share Forecast by Type, 2023, 2028, 2033 (%)
Figure 31 Specular Microscope Market Forecast by Region, 2023-2033 (US$ Million, AGR %)
Figure 32 Specular Microscope Market by Region, 2023 & 2033 (%)
Figure 33 Fundus Cameras Market Forecast by Region, 2023-2033 (US$ Million, AGR %)
Figure 34 Fundus Camera Market by Region, 2023 & 2033 (%)
Figure 35 Optical Coherence Tomography Scanner Market Forecast by Region, 2023-2033 (US$ million, AGR %)
Figure 36 Optical Coherence Tomography Scanner Share Forecast by Region, 2023 & 2033 (%)
Figure 37 Perimeter Market Forecast by Region, 2023-2033 (US$ Million, AGR %)
Figure 38 Perimeter Market Share Forecast by Region, 2023 & 2033 (%)
Figure 39 Optical Biometer Market Forecast by Region, 2023-2033 (US$ million, AGR %)
Figure 40 Optical Biometer Market Share Forecast by Region, 2023 & 2033 (%)
Figure 41 Slit Lamps Market Forecast by Region, 2023-2033 (US$ Million, AGR %)
Figure 42 Slit Lamps Market Share Forecast by Region, 2023 & 2033 (%)
Figure 43 Auto-Refractor Market Forecast by Region, 2023-2033 (US$ Million, AGR %)
Figure 44 Auto-Refractor Market Share Forecast by Region, 2023 & 2033 (%)
Figure 45 Tonometer Market Forecast by Region, 2023-2033 (US$ Million, AGR %)
Figure 46 Tonometer Market Share Forecast by Region, 2023 & 2033 (%)
Figure 47 Ophthalmic Ultrasound Imaging Systems Market Forecast by Region, 2023-2033 (US$ Million, AGR %)
Figure 48 Ophthalmic Ultrasound Imaging Systems Market Share Forecast by Region, 2023 & 2033 (%)
Figure 49 Ophthalmoscope Market Forecast by Region, 2023-2033 (US$ Million, AGR %)
Figure 50 Ophthalmoscope Market Share Forecast by Region, 2023 & 2033 (%)
Figure 51 Chart Projectors Market Forecast by Region, 2023-2033 (US$ Million, AGR %)
Figure 52 Chart Projectors Market Share Forecast by Region, 2023 & 2033 (%)
Figure 53 Corneal Topography Systems Market Forecast by Region, 2023-2033 (US$ Million, AGR %)
Figure 54 Corneal Topography Systems Market Share Forecast by Region, 2023 & 2033 (%)
Figure 55 Lensometer Market Forecast by Region, 2023-2033 (US$ Million, AGR %)
Figure 56 Lensometer Market Share Forecast by Region, 2023 & 2033 (%)
Figure 57 Wave Front Aberrometers Market Forecast by Region, 2023-2033 (US$ Million, AGR %)
Figure 58 Wave Front Aberrometers Market Share Forecast by Region, 2023 & 2033 (%)
Figure 59 Others Market Forecast by Region, 2023-2033 (US$ Million, AGR %)
Figure 60 Others Market Share Forecast by Region, 2023 & 2033 (%)
Figure 61 Ophthalmic Surgical Devices: Market Attractiveness Index
Figure 62 Ophthalmic Surgical Devices Market, By Market Share, 2022 (%)
Figure 63 Ophthalmic Surgical Devices Market Forecast by Region, 2023-2033 (US$ Million, AGR %)
Figure 64 Ophthalmic Surgical Devices Market Forecast by Type, 2023-2033 (US$ Million, AGR%, CAGR %)
Figure 65 Ophthalmic Surgical Devices Market Share Forecast by Type, 2023, 2028, 2033 (%)
Figure 66 Cataract Surgery Market Forecast by Region, 2023-2033(US$ Million, AGR %)
Figure 67 Cataract Surgery Market by Region, 2023 & 2033 (%)
Figure 68 Cataract IOLs Market Forecast by Region, 2023-2033(US$ Million, AGR%)
Figure 69 IOLs Injectors Market Forecast by Region, 2023-2033(US$ Million, AGR %)
Figure 70 OVDs Market Forecast by Region, 2023-2033(US$ Million, AGR %)
Figure 71 Femtosecond Laser Cataract System (FLACS) Market Forecast by Region, 2023-2033(US$ Million, AGR %)
Figure 72 Nd: YAG Laser System Market Forecast by Region, 2023-2033(US$ Million, AGR %)
Figure 73 Phacoemulsification Devices Market Forecast by Region, 2023-2033(US$ Million, AGR%)
Figure 74 Vitrectomy Surgery Market Forecast by Region, 2023-2033(US$ million)
Figure 75 Vitrectomy Surgery Market Share Forecast by Region (%)
Figure 76 Vitrectomy Probes Market Forecast by Region, 2023-2033(US$ Million)
Figure 77 Retinal Implants (IOLs) Market Forecast by Region, 2023-2033 (US$ Million, AGR %)
Figure 78 Vitrectomy Machines Market Forecast by Region, 2023-2033 (US$ Million, AGR %)
Figure 79 Vitrectomy Packs Market Forecast by Region, 2023-2033(US$ Million, AGR %)
Figure 80 Photocoagulation Lasers Market Forecast by Region, 2023-2033(US$ Million, AGR %)
Figure 81 Illumination Devices Market Forecast by Region, 2023-2033(US$ Million, AGR %)
Figure 82 Refractive Surgery Devices Market Forecast by Region, 2023-2033 (US$ Million, AGR %)
Figure 83 Refractive Surgery Devices Market Forecast by Region, 2023 & 2033 (%)
Figure 84 Femtosecond Laser Refractive Surgery Devices Market Forecast by Region, 2023-2033(US$ Million, AGR %)
Figure 85 Excimer Laser Refractive Surgery Devices Market Forecast by Region, 2023-2033(US$ Million, AGR %)
Figure 86 Phakic IOLs Market Forecast by Region, 2023-2033(US$ Million, AGR %)
Figure 87 Refractive Lens Exchange (RLE) Market Forecast by Region, 2023-2033(US$ million)
Figure 88 Mechanical Keratome Market Forecast by Region, 2023-2033(US$ Million, AGR %)
Figure 89 Other Refractive Surgery Devices Market Forecast by Region, 2023-2033(US$ Million, AGR %)
Figure 90 Glaucoma Surgical Devices Market Forecast by Region, 2023-2033(US$ Million, AGR %)
Figure 91 Glaucoma Surgical Devices Market Forecast by Region, 2023 & 2033 (%)
Figure 92 Glaucoma Laser Surgical Devices Market Forecast by Region, 2023-2033(US$ Million, AGR %)
Figure 93 Trab Adjunctive Devices Market Forecast by Region, 2023-2033(US$ Million)
Figure 94 Canal Surgical Devices Market Forecast by Region, 2023-2033(US$ Million, AGR %)
Figure 95 Subconjunctival shunts Market Forecast by Region, 2023-2033(US$ Million, AGR %)
Figure 96 Tube Shunts Devices Market Forecast by Region, 2023-2033(US$ Million, AGR %)
Figure 97 Microstents (MIGS) Market Forecast by Region, 2023-2033 (US$ Million, AGR %)
Figure 98 Ophthalmic OR Microscope Market Forecast by Region, 2023-2033 (US$ Million, AGR %)
Figure 99 Ophthalmic OR Microscope Market Share Forecast by Region, 2023 & 2033 (%)
Figure 100 Other Surgical Devices Market Forecast by Region, 2023-2033 (US$ Million, AGR %)
Figure 101 Other Surgical Devices Market Share Forecast by Region, 2023 & 2033 (%)
Figure 102 Ophthalmic Devices Market, By End -users: Market Attractiveness Index
Figure 103 Ophthalmic Devices End-Users Market Forecast by Region, 2023-2033 (US$ Million, AGR %)
Figure 104 Hospitals Market Forecast by Region, 2023-2033 (US$ Million, AGR %)
Figure 105 Hospital Market Share Forecast by Region, 2023 & 2033 (%)
Figure 106 Diagnostic Clinics Market Forecast by Region, 2023-2033 (US$ Million, AGR %)
Figure 107 Diagnostic Clinics Forecast by Region, 2023 & 2033 (%)
Figure 108 Franchise Optical Stores Market Share Forecast by Region, 2023 & 2033 (%)
Figure 109 Franchise Optical Stores Market Forecast by Region, 2023-2033 (US$ Million, AGR %)
Figure 110 Eye Research Institutes Market Forecast by Region, 2023-2033 (US$ Million, AGR %)
Figure 111 Franchise Optical Stores Forecast by Region, 2023 & 2033 (%)
Figure 112 Government Agencies Market Forecast by Region, 2023-2033 (US$ Million, AGR %)
Figure 113 Government Institutes Market Share Forecast by Region, 2023 & 2033 (%)
Figure 114 Academics Market Share Forecast by Region, 2023 & 2033 (%)
Figure 115 Ophthalmic Devices Market Forecast by Region 2023 and 2033 (Revenue, CAGR %)
Figure 116 Ophthalmic Devices Market Share Forecast by Region 2023, 2028, 2033 (%)
Figure 117 Ophthalmic Devices Market Forecast by Region, 2023-2033 (US$ Million, AGR %)
Figure 118 North America Ophthalmic Devices Market Attractiveness Index
Figure 119 North America Ophthalmic Devices Market by Country, 2023, 2028 & 2033 (US$ Million)
Figure 120 North America Ophthalmic Devices Market Forecast by Country, 2023-2033 (US$ Million, AGR %)
Figure 121 North America Ophthalmic Devices Market Share Forecast by Country, 2023 & 2033 (%)
Figure 122 North America Ophthalmic Devices Market Forecast by Type, 2023-2033 (US$ Million, AGR %)
Figure 123 North America Ophthalmic Devices Market Share Forecast by Type, 2023 & 2033 (%)
Figure 124 North America Vision Care Devices Market Forecast by Type, 2023-2033 (US$ Million, AGR %)
Figure 125 North America Vision Care Devices Market Share Forecast by Type, 2023 & 2033 (%)
Figure 126 North America Diagnostic Care & Monitoring Devices Market Forecast by Type, 2023-2033 (US$ Million, AGR %)
Figure 127 North America Diagnostic Care & Monitoring Devices Market Share Forecast by Type, 2023 & 2033 (%)
Figure 128 North America Surgical Devices Market Share Forecast by Type, 2023 & 2033 (%)
Figure 129 North America Ophthalmic Devices Market Forecast by End-Users, 2023-2033 (US$ Million, AGR %)
Figure 130 North America Ophthalmic Devices Market Share Forecast by End-Users, 2023 & 2033 (%)
Figure 131 U.S. Ophthalmic Devices Market Forecast, 2023-2033 (US$ Million, AGR %)
Figure 132 Canada Ophthalmic Devices Market Forecast, 2023-2033 (US$ Million, AGR %)
Figure 133 Europe Ophthalmic Devices Market Attractiveness Index
Figure 134 Europe Ophthalmic Devices Market by Country, 2023, 2028 & 2033 (US$ Million)
Figure 135 Europe Ophthalmic Devices Market Forecast by Country, 2023-2033 (US$ Million, AGR %)
Figure 136 Europe Ophthalmic Devices Market Share Forecast by Country, 2023 & 2033 (%)
Figure 137 Europe Ophthalmic Devices Market Forecast by Type, 2023-2033 (US$ Million, AGR %)
Figure 138 Europe Ophthalmic Devices Market Share Forecast by Type, 2023 & 2033 (%)
Figure 139 Europe Vision Care Devices Market Forecast by Type, 2023-2033 (US$ Million, AGR %)
Figure 140 Europe Ophthalmic Vision Care Devices Market Share Forecast by Type, 2023 & 2033 (%)
Figure 141 Europe Diagnostic Care & Monitoring Devices Market Forecast by Type, 2023-2033 (US$ Million, AGR %)
Figure 142 Europe Diagnostic Care & Monitoring Devices Market Share Forecast by Type, 2023 & 2033 (%)
Figure 143 Europe Surgical Devices Market Forecast by Type, 2023-2033 (US$ Million, AGR %)
Figure 144 Europe Surgical Devices Market Share Forecast by Type, 2023 & 2033 (%)
Figure 145 Europe Ophthalmic Devices Market Forecast by End-Users, 2023-2033 (US$ Million, AGR %)
Figure 146 Europe Ophthalmic Devices Market Share Forecast by End-Users, 2023 & 2033 (%)
Figure 147 Germany Ophthalmic Devices Market Forecast, 2023-2033 (US$ Million, AGR %)
Figure 148 UK Ophthalmic Devices Market Forecast, 2023-2033 (US$ Million, AGR %)
Figure 149 France Ophthalmic Devices Market Forecast, 2023-2033 (US$ Million, AGR %)
Figure 150 Italy Ophthalmic Devices Market Forecast, 2023-2033 (US$ Million, AGR %)
Figure 151 Spain Ophthalmic Devices Market Forecast, 2023-2033 (US$ Million, AGR %)
Figure 152 Rest of Europe Ophthalmic Devices Market Forecast, 2023-2033 (US$ Million, AGR %)
Figure 153 Asia Ophthalmic Devices Market Attractiveness Index
Figure 154 Asia Ophthalmic Devices Market by Country, 2023, 2028 & 2033 (US$ Million)
Figure 155 Asia Pacific Ophthalmic Devices Market Forecast by Country, 2023-2033 (US$ Million, AGR %)
Figure 156 Asia Pacific Ophthalmic Devices Market Share Forecast by Country, 2023 & 2033 (%)
Figure 157 Asia Ophthalmic Devices Market Forecast by Type, 2023-2033 (US$ Million, AGR %)
Figure 158 Asia Ophthalmic Devices Market Share Forecast by Type, 2023 & 2033 (%)
Figure 159 Asia Ophthalmic Vision Care Devices Market Forecast by Type, 2023-2033 (US$ Million, AGR %)
Figure 160 Asia Vision Care Devices Market Share Forecast by Type, 2023 & 2033 (%)
Figure 161 Asia Diagnostic Care & Monitoring Devices Market Forecast by Type, 2023-2033 (US$ Million, AGR %)
Figure 162 Asia Ophthalmic Diagnostic Care & Monitoring Devices Market Share Forecast by Type, 2023 & 2033 (%)
Figure 163 Asia Surgical Devices Market Forecast by Type, 2023-2033 (US$ Million, AGR %)
Figure 164 Asia Surgical Devices Market Share Forecast by Type, 2023 & 2033 (%)
Figure 165 Asia Ophthalmic Devices Market Forecast by End-Users, 2023-2033 (US$ Million, AGR %)
Figure 166 Asia Ophthalmic Devices Market Share Forecast by End-Users, 2023 & 2033 (%)
Figure 167 Japan Ophthalmic Devices Market Forecast, 2023-2033 (US$ Million, AGR %)
Figure 168 China Ophthalmic Devices Market Forecast, 2023-2033 (US$ Million, AGR %)
Figure 169 India Ophthalmic Devices Market Forecast, 2023-2033 (US$ Million, AGR %)
Figure 170 South Korea Ophthalmic Devices Market Forecast, 2023-2033 (US$ Million, AGR %)
Figure 171 Australia Ophthalmic Devices Market Forecast, 2023-2033 (US$ Million, AGR %)
Figure 172 Rest of Asia Pacific Ophthalmic Devices Market Forecast, 2023-2033 (US$ Million, AGR %)
Figure 173 Latin America Ophthalmic Devices Market Attractiveness Index
Figure 174 Latin America Ophthalmic Devices Market by Country, 2023, 2028 & 2033 (US$ Million)
Figure 175 Latin America Ophthalmic Devices Market Forecast by Country, 2023-2033 (US$ Million, AGR %)
Figure 176 Latin America Ophthalmic Devices Market Share Forecast by Country, 2023 & 2033 (%)
Figure 177 Latin America Ophthalmic Devices Market Forecast by Type, 2023-2033 (US$ Million, AGR %)
Figure 178 Latin America Ophthalmic Devices Market Share Forecast by Type, 2023 & 2033 (%)
Figure 179 Latin America Vision Care Devices Market Forecast by Type, 2023-2033 (US$ Million, AGR %)
Figure 180 Latin America Vision Care Devices Market Share Forecast by Type, 2023 & 2033 (%)
Figure 181 Latin America Ophthalmic Devices Market Forecast by Diagnostic Care & Monitoring, By Type, 2023-2033 (US$ Million, AGR %)
Figure 182 Latin America Diagnostic Care & Monitoring Devices Market Share Forecast by Type, 2023 & 2033 (%)
Figure 183 Latin America Surgical Devices Market Forecast by Type, 2023-2033 (US$ Million, AGR %)
Figure 184 Latin America Surgical Devices Market Share Forecast by Type, 2023 & 2033 (%)
Figure 185 Latin America Ophthalmic Devices Market Forecast by End-Users, 2023-2033 (US$ Million, AGR %)
Figure 186 Latin America Ophthalmic Devices Market Share Forecast by End-Users, 2023 & 2033 (%)
Figure 187 Brazil Ophthalmic Devices Market Forecast, 2023-2033 (US$ Million, AGR %)
Figure 188 Mexico Ophthalmic Devices Market Forecast, 2023-2033 (US$ Million, AGR %)
Figure 189 Rest of Latin America Ophthalmic Devices Market Forecast, 2023-2033 (US$ Million, AGR %)
Figure 190 Middle East & Africa Ophthalmic Devices Market Attractiveness Index
Figure 191 Middle East & Africa Ophthalmic Devices Market by Country, 2023, 2028 & 2033 (US$ Million)
Figure 192 Middle East & Africa Ophthalmic Devices Market Forecast by Country, 2023-2033 (US$ Million, AGR %)
Figure 193 Middle East & Africa Ophthalmic Devices Market Share Forecast by Country, 2023 & 2033 (%)
Figure 194 Middle East & Africa Ophthalmic Devices Market Forecast by Type, 2023-2033 (US$ Million, AGR %)
Figure 195 Middle East & Africa Ophthalmic Devices Market Share Forecast by Type, 2023 & 2033 (%)
Figure 196 Middle East & Africa Vision Care Devices Market Forecast by Type, 2023-2033 (US$ Million, AGR %)
Figure 197 Middle East & Africa Vision Care Devices Market Share Forecast by Type, 2023 & 2033 (%)
Figure 198 Middle East & Africa Diagnostic Care & Monitoring, Devices Market Forecast by Type, 2023-2033 (US$ Million, AGR %)
Figure 199 Middle East & Africa Diagnostic Care & Monitoring Devices Market Share Forecast by, Type, 2023 & 2033 (%)
Figure 200 Middle East & Africa Surgical Devices Market Forecast by Type, 2023-2033 (US$ Million, AGR %)
Figure 201 Middle East & Africa Surgical Devices Market Share Forecast by Type, 2023 & 2033 (%)
Figure 202 Middle East & Africa Ophthalmic Devices Market Forecast by End-Users, 2023-2033 (US$ Million, AGR %)
Figure 203 Middle East & Africa Ophthalmic Devices Market Share Forecast by End-Users, 2023 & 2033 (%)
Figure 204 GCC Ophthalmic Devices Market Forecast, 2023-2033 (US$ Million, AGR %)
Figure 205 South Africa Ophthalmic Devices Market Forecast, 2023-2033 (US$ Million, AGR %)
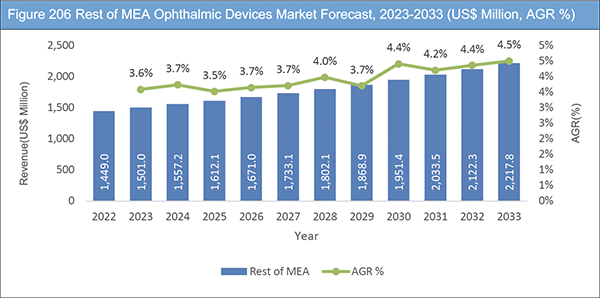
Figure 206 Rest of MEA Ophthalmic Devices Market Forecast, 2023-2033 (US$ Million, AGR %)
Figure 207 Ophthalmic Devices Market: Company Share, 2022
Figure 208 Alcon: Net Revenue, 2017-2022 (US$ Million, AGR %)
Figure 209 Alcon: R&D, 2017-2022 (US$ Million, AGR %)
Figure 210 Alcon: Regional Market Shares, 2022
Figure 211 Alcon: Surgical Vision Care Revenues, 2017-2022 (US$ Million, AGR %)
Figure 212 Alcon: Vision Care Revenues, 2017-2022 (US$ Million, AGR %)
Figure 213 Glaukos Corporation: Net Revenue, 2017-2022 (US$ Million, AGR %)
Figure 214 Glaukos Corporation: R&D, 2017-2022 (US$ Million, AGR %)
Figure 215 Glaukos Corporation: Regional Market Shares, 2022
Figure 216 Glaukos Corporation: Segmental Revenues, 2017-2022 (US$ Million, AGR %)
Figure 217 STAAR SURGICAL: Net Revenue, 2017-2022 (US$ Million, AGR %)
Figure 218 STAAR SURGICAL: R&D, 2017-2022 (US$ Million, AGR %)
Figure 219 STAAR SURGICAL: Regional Market Shares, 2022
Figure 220 Carl Zeiss Meditec AG: Company Revenue 2017-2022 (US$ Million, AGR %)
Figure 221 Carl Zeiss Meditec AG: R&D 2017-2022 (US$ Million, AGR %)
Figure 222 Carl Zeiss Meditec AG: Regional Market Shares, 2022
Figure 223 Johnson & Johnson Vision: Company Revenue 2017-2022 (US$ Million, AGR %)
Figure 224 Johnson & Johnson Vision: R&D 2017-2022 (US$ Million, AGR %)
Figure 225 Johnson & Johnson Vision: Regional Market Shares, 2022
Figure 226 Johnson & Johnson Vision: Segmental Revenue 2017-2022 (US$ Million, AGR %)
Figure 227 Johnson & Johnson Vision: Company Revenue 2017-2022 (US$ Million, AGR %)
Figure 228 CooperVision: Company Revenue 2017-2022 (US$ Million, AGR %)
Figure 229 CooperVision: R&D 2017-2022 (US$ Million, AGR %)
Figure 230 CooperVision: Regional Market Shares, 2022
Figure 231 NIDEK CO., LTD.: Company Revenue 2017-2022 (US$ Million, AGR %)
Figure 232 NIDEK CO., LTD.: Regional Market Share 2022 (%)
Figure 233 Sonomed Escalon: Company Revenue 2017-2022 (US$ Million, AGR %)
Figure 234 Sonomed Escalon.: R&D 2017-2022 (US$ Million, AGR %)
Figure 235 Sonomed Escalon: Regional Market Shares, 2022
Figure 236 Sight Sciences: Net Revenue, 2018-2022 (US$ Million, AGR %)
Figure 237 Sight Sciences: R&D Expenses, 2018-2022 (US$ Million, AGR %)
Figure 238 LENSAR, Inc.: Net Revenue, 2019-2022 (US$ Million, AGR %)
Figure 239 LENSAR Inc.: R&D Expenses, 2018-2022 (US$ Million, AGR %)
Figure 240 LENSAR Inc.: Regional Market Shares, 2022
Figure 241 EssilorLuxottica: Net Revenue, 2017-2022 (US$ Million, AGR %)
Figure 242 EssilorLuxottica: R&D, 2017-2022 (US$ Million, AGR %)
Figure 243 EssilorLuxottica Inc.: Regional Market Shares, 2022
List of Companies Profiled in the Report
Alcon
CooperVision
Carl Zeiss Meditec
EssilorLuxottica
Glaukos Corporation
HAAG-STREIT GROUP
HEINE Optotechnik GmbH & Co. KG
Johnson & Johnson Vision
LENSAR, Inc.
Lumenis Be Ltd.
NIDEK CO., LTD.
Ophtec BV
Sight Sciences
Sonomed Escalon
STAAR SURGICAL
Visionix
Ziemer Ophthalmic Systems AG
List of Other Companies Mentioned in the Report
AcuSurgical
Airui Technology
Aisei Co. Ltd.
Albomed
Alliance Care Technologies
Baxter
Belkin Vision
BelphEx LLC
Canon Medical Systems
Envision Diagnostics, Inc.
Epipole
Eurazeo
EyeBright
Eyenuk
Grafton Optical
Holbar Medical Products (EyeXPress)
iCare Company
Katalyst Surgical
Keeler Instruments
Kogent Surgical
Kowa Optimed, Inc.
LADARVision
Meda Co Ltd.
Menicon Co. Ltd.
MicroOptx
Occuity
Oculight
Optopol Technologies
ReFocus Eye Health
Reichert Technologies
Rheon Medical Watch
Seiko Opticals
SurgiVision
Svision
VediVision
VIAlase
VISIA Imaging
Walmart
List of Associations Mentioned in the Report
Association for Ophthalmic Cooperation in Asia (AOCA)
Centers for Disease Control and Prevention (CDC)
European Society of Cataract and Refractive Surgeons
European Society of Ophthalmology (ESC)
India Ophthalmology Society
National Institutes of Health's National Eye Institute (NEI)
National Center for Biotechnology Information (NCBI)
Occupational Safety and Health Administration (OSHA)
Organization for Pharmaceutical Safety and Research (OPSR)
Pharmaceutical and Food Safety Bureau (PFSB)
Pharmaceuticals and Medical Devices Agency
Pharmaceuticals and Medical Devices Evaluation Center (PMDEC)
U.S. Food and Drug Administration (FDA)
World Health Organization (WHO)