The Bionic Devices Market Report 2023-2033: This report will prove invaluable to leading firms striving for new revenue pockets if they wish to better understand the industry and its underlying dynamics. It will be useful for companies that would like to expand into different industries or to expand their existing operations in a new region.
Continuous Research and Development Efforts in the Area of Bionic Devices Projected to Spur Industry Growth
Market growth in the field of bionic devices is significantly driven by continuous research and development efforts. Companies, academic institutions, and healthcare organizations are heavily investing in research to create innovative technologies, improve existing devices, and expand the applications of bionic devices. These advancements foster innovation and broaden the array of solutions available to patients. One of the primary focuses of bionic device companies is to develop technologies that restore or enhance sensory functions, such as vision, hearing, and touch. For instance, they are working on retinal implants to restore vision, cochlear implants to improve hearing, and haptic interfaces that provide tactile feedback to amputees, enhancing their sensory experiences.
For instance, in December 2022, Pixium Vision SA announced the successful completion of implantations in all patients enrolled in the PRIMAvera European pivotal trial. This trial targets atrophic dry age-related macular degeneration (dry AMD aiming to restore vision and improve the quality of life for affected individuals through their retinal implant technology.
High Cost of Bionic Devices Likely to Challenge Industry Growth
Bionic devices are often expensive due to the intricate technology, extensive research, and development involved in their creation. The high costs associated with bionic devices can present significant challenges, limiting their accessibility and affordability for certain patients. This becomes a particular concern in regions with limited healthcare resources and inadequate insurance coverage. For instance, the basic prosthetic limbs without advanced functionalities may start at around $5,000, while more advanced bionic prosthetic limbs equipped with motorized joints, sensory feedback, and advanced control systems can cost between $10,000 and $100,000 or even more. Also, cochlear implant systems typically come with a price tag between $30,000 and $60,000 per ear, covering expenses for the surgery, the implant device, and post-operative care.
What Questions Should You Ask before Buying a Market Research Report?
• How is the bionic devices market evolving?
• What is driving and restraining the bionic devices market?
• How will each bionic devices submarket segment grow over the forecast period and how much revenue will these submarkets account for in 2033?
• How will the market shares for each bionic devices submarket develop from 2023 to 2033?
• What will be the main driver for the overall market from 2023 to 2033?
• Will leading bionic devices markets broadly follow the macroeconomic dynamics, or will individual national markets outperform others?
• How will the market shares of the national markets change by 2033 and which geographical region will lead the market in 2033?
• Who are the leading players and what are their prospects over the forecast period?
• What are the bionic devices projects for these leading companies?
• How will the industry evolve during the period between 2023 and 2033? What are the implications of bionic devices projects taking place now and over the next 10 years?
• Is there a greater need for product commercialisation to further scale the bionic devices market?
• Where is the bionic devices market heading and how can you ensure you are at the forefront of the market?
• What are the best investment options for new product and service lines?
• What are the key prospects for moving companies into a new growth path and C-suite?
You need to discover how this will impact the bionic devices market today, and over the next 10 years:
• Our 279-page report provides 114 tables and 181 charts/graphs exclusively to you.
• The report highlights key lucrative areas in the industry so you can target them – NOW.
• It contains in-depth analysis of global, regional and national sales and growth.
• It highlights for you the key successful trends, changes and revenue projections made by your competitors.
This report tells you TODAY how the bionic devices market will develop in the next 10 years, and in line with the variations in COVID-19 economic recession and bounce. This market is more critical now than at any point over the last 10 years.
Forecasts to 2033 and other analyses reveal commercial prospects
• In addition to revenue forecasting to 2033, our new study provides you with recent results, growth rates, and market shares.
• You will find original analyses, with business outlooks and developments.
• Discover qualitative analyses (including market dynamics, drivers, opportunities, restraints and challenges), cost structure, impact of rising bionic devices prices and recent developments.
This report includes data analysis and invaluable insight into how COVID-19 will affect the industry and your company. Four COVID-19 recovery patterns and their impact, namely, “V”, “L”, “W” and “U” are discussed in this report.
Segments Covered in the Report
Fixation Outlook
• Implantable Bionics
• External Bionics
Type
• Cochlear Implants
• Heart Bionics
• Orthopaedic Bionics
• Exoskeleton Bionics
• Neural Bionics
• Others
Technology
• Electronic Bionics
• Mechanical Bionics
End-users
• Hospitals & Clinics
• Ambulatory Surgical Centres (ASCs)
• Others

In addition to the revenue predictions for the overall world market and segments, you will also find revenue forecasts for five regional and 22 leading national markets:
North America
• U.S.
• Canada
Europe
• Germany
• UK
• France
• Spain
• Italy
• Russia
• Rest of Europe
Asia Pacific
• China
• Japan
• India
• Australia
• South Korea
• Rest of Asia Pacific
Latin America
• Brazil
• Mexico
• Argentina
• Rest of Latin America
MEA
• GCC
• South Africa
• Rest of MEA
Need industry data? Please contact us today.
The report also includes profiles and for some of the leading companies in the Bionic Devices Market, 2023 to 2033, with a focus on this segment of these companies’ operations.
Leading companies and the potential for market growth
• Abbott Laboratories
• Boston Scientific Corporation
• Cochlear Ltd.
• Demant A/S
• Ekso Bionics
• Johnson & Johnson
• LivaNova, PLC
• Medtronic PLC
• Össur
• Ottobock (BionX Medical Technologies, Inc.)
• PIXIUM VISION
• Sonova
• SynCardia Systems, LLC
• Zimmer Biomet
Overall world revenue for Bionic Devices Market, 2023 to 2033 in terms of value the market will surpass US$20 billion in 2023, our work calculates. We predict strong revenue growth through to 2033. Our work identifies which organizations hold the greatest potential. Discover their capabilities, progress, and commercial prospects, helping you stay ahead.
How will the Bionic Devices Market, 2023 to 2033 report help you?
In summary, our 270+ page report provides you with the following knowledge:
• Revenue forecasts to 2033 for Bionic Devices Market, 2023 to 2033 Market, with forecasts for fixation, type, technology, and end-users, each forecast at a global and regional level – discover the industry’s prospects, finding the most lucrative places for investments and revenues.
• Revenue forecasts to 2033 for five regional and 22 key national markets – See forecasts for the Bionic Devices Market, 2023 to 2033 market in North America, Europe, Asia-Pacific, Latin America, and MEA. Also forecasted is the market in the US, Canada, Mexico, Brazil, Germany, France, UK, Italy, China, India, Japan, and Australia among other prominent economies.
• Prospects for established firms and those seeking to enter the market – including company profiles for 14 of the major companies involved in the Bionic Devices Market, 2023 to 2033.
Find quantitative and qualitative analyses with independent predictions. Receive information that only our report contains, staying informed with invaluable business intelligence.
Information found nowhere else
With our new report, you are less likely to fall behind in knowledge or miss out on opportunities. See how our work could benefit your research, analyses, and decisions. Visiongain’s study is for everybody needing commercial analyses for the Bionic Devices Market, 2023 to 2033, market-leading companies. You will find data, trends and predictions.
To access the data contained in this document please email contactus@visiongain.com
Buy our report today Bionic Devices Market Report 2023-2033: Forecasts by Fixation (Implantable Bionics, External Bionics), by Type (Heart Bionics, Neural Bionics, Cochlear Implants, Orthopaedic Bionics, Exoskeleton Bionics, Others), by Technology (Electronic Bionics, Mechanical Bionics), by End-user (Hospitals, Ambulatory Surgical Centers (ASCs), Others) AND Regional and Leading National Market Analysis PLUS Analysis of Leading Companies AND COVID-19 Impact and Recovery Pattern Analysis. Avoid missing out by staying informed – order our report now.
Visiongain is a trading partner with the US Federal Government
CCR Ref number: KD4R6
Do you have any custom requirements we can help you with? Any need for a specific country, geo region, market segment or specific company information? Contact us today, we can discuss your needs and see how we can help: contactus@visiongain.com
1 Report Overview
1.1 Objectives of the Study
1.2 Introduction to Bionic Devices Market
1.3 What This Report Delivers
1.4 Why You Should Read This Report
1.5 Key Questions Answered by This Analytical Report
1.6 Who is This Report for?
1.7 Methodology
1.7.1 Market Definitions
1.7.2 Market Evaluation & Forecasting Methodology
1.7.3 Data Validation
1.7.3.1 Primary Research
1.7.3.2 Secondary Research
1.8 Frequently Asked Questions (FAQs)
1.9 Associated Visiongain Reports
1.10 About Visiongain
2 Executive Summary
3 Market Overview
3.1 Key Findings
3.2 Market Dynamics
3.2.1 Market Driving Factors
3.2.1.1 Technological Advancements is Driving the Market Growth
3.2.1.2 Increasing Prevalence of Chronic Diseases and Disabilities
3.2.1.3 Growing Aging Population is Expected to boost the Demand for Bionic Devices
3.2.1.4 Growing Emphasis on Rehabilitation and Functional Recovery in Healthcare
3.2.2 Market Restraining Factors
3.2.2.1 High Cost of Bionic Devices
3.2.2.2 Limited Reimbursement Coverage
3.2.2.3 Limited Awareness and Education
3.2.2.4 Need for Device Longevity and Maintenance could Hinder the Market Growth
3.2.3 Market Opportunities
3.2.3.1 Expansion into Emerging Markets
3.2.3.2 Collaboration with Other Bionic Devices Companies and Healthcare Providers
3.2.3.3 Ongoing Research and Development
3.3 Harnessing the Power of Artificial Intelligence in Prosthetic Technology
3.4 COVID-19 Impact Analysis
3.5 Porter’s Five Forces Analysis
3.5.1 Bargaining Power of Suppliers
3.5.2 Bargaining Power of Buyers
3.5.3 Competitive Rivalry
3.5.4 Threat from Substitutes
3.5.5 Threat of New Entrants
3.6 PEST Analysis
4 Bionic Devices Market Analysis by Fixation
4.1 Key Findings
4.2 Fixation Segment: Market Attractiveness Index
4.3 Bionic Devices Market Size Estimation and Forecast by Fixation
4.4 Implantable Bionics
4.4.1 Market Size by Region, 2023-2033 (US$ Billion)
4.4.2 Market Share by Region, 2023 & 2033 (%)
4.5 External Bionics
4.5.1 Market Size by Region, 2023-2033 (US$ Billion)
4.5.2 Market Share by Region, 2023 & 2033 (%)
5 Bionic Devices Market Analysis by Type
5.1 Key Findings
5.2 Type Segment: Market Attractiveness Index
5.3 Bionic Devices Market Size Estimation and Forecast by Type
5.4 Heart Bionics
5.4.1 Market Size by Region, 2023-2033 (US$ Billion)
5.4.2 Market Share by Region, 2023 & 2033 (%)
5.5 Neural Bionics
5.5.1 Market Size by Region, 2023-2033 (US$ Billion)
5.5.2 Market Share by Region, 2023 & 2033 (%)
5.6 Cochlear Implants
5.6.1 Market Size by Region, 2023-2033 (US$ Billion)
5.6.2 Market Share by Region, 2023 & 2033 (%)
5.7 Orthopaedic Bionics
5.7.1 Market Size by Region, 2023-2033 (US$ Billion)
5.7.2 Market Share by Region, 2023 & 2033 (%)
5.8 Exoskeleton Bionics
5.8.1 Market Size by Region, 2023-2033 (US$ Billion)
5.8.2 Market Share by Region, 2023 & 2033 (%)
5.9 Others
5.9.1 Market Size by Region, 2023-2033 (US$ Billion)
5.9.2 Market Share by Region, 2023 & 2033 (%)
6 Bionic Devices Market Analysis by Technology
6.1 Key Findings
6.2 Technology Segment: Market Attractiveness Index
6.3 Bionic Devices Market Size Estimation and Forecast by Technology
6.4 Electronic Bionics
6.4.1 Market Size by Region, 2023-2033 (US$ Billion)
6.4.2 Market Share by Region, 2023 & 2033 (%)
6.5 Mechanical Bionics
6.5.1 Market Size by Region, 2023-2033 (US$ Billion)
6.5.2 Market Share by Region, 2023 & 2033 (%)
7 Bionic Devices Market Analysis by End-users
7.1 Key Findings
7.2 End-users Segment: Market Attractiveness Index
7.3 Bionic Devices Market Size Estimation and Forecast by End-users
7.4 Hospitals
7.4.1 Market Size by Region, 2023-2033 (US$ Billion)
7.4.2 Market Share by Region, 2023 & 2033 (%)
7.5 ASCs
7.5.1 Market Size by Region, 2023-2033 (US$ Billion)
7.5.2 Market Share by Region, 2023 & 2033 (%)
7.6 Others
7.6.1 Market Size by Region, 2023-2033 (US$ Billion)
7.6.2 Market Share by Region, 2023 & 2033 (%)
8 Bionic Devices Market Analysis by Region
8.1 Key Findings
8.2 Regional Market Size Estimation and Forecast
9 North America Bionic Devices Market Analysis
9.1 Key Findings
9.2 North America Bionic Devices Market Attractiveness Index
9.3 North America Bionic Devices Market by Country, 2023, 2028 & 2033 (US$ Billion)
9.4 North America Bionic Devices Market Size Estimation and Forecast by Country
9.5 North America Bionic Devices Market Size Estimation and Forecast by Fixation
9.6 North America Bionic Devices Market Size Estimation and Forecast by Type
9.7 North America Bionic Devices Market Size Estimation and Forecast by Technology
9.8 North America Bionic Devices Market Size Estimation and Forecast by End-users
9.9 U.S. Bionic Devices Market Analysis
9.10 Canada Bionic Devices Market Analysis
10 Europe Bionic Devices Market Analysis
10.1 Key Findings
10.2 Europe Bionic Devices Market Attractiveness Index
10.3 Europe Bionic Devices Market by Country, 2023, 2028 & 2033 (US$ Billion)
10.4 Europe Bionic Devices Market Size Estimation and Forecast by Country
10.5 Europe Bionic Devices Market Size Estimation and Forecast by Fixation
10.6 Europe Bionic Devices Market Size Estimation and Forecast by Type
10.7 Europe Bionic Devices Market Size Estimation and Forecast by Technology
10.8 Europe Bionic Devices Market Size Estimation and Forecast by End-users
10.9 Germany Bionic Devices Market Analysis
10.10 UK Bionic Devices Market Analysis
10.11 France Bionic Devices Market Analysis
10.12 Italy Bionic Devices Market Analysis
10.13 Spain Bionic Devices Market Analysis
10.14 Russia Bionic Devices Market Analysis
10.15 Rest of Europe Bionic Devices Market Analysis
11 Asia Bionic Devices Market Analysis
11.1 Key Findings
11.2 Asia Bionic Devices Market Attractiveness Index
11.3 Asia Bionic Devices Market by Country, 2023, 2028 & 2033 (US$ Billion)
11.4 Asia Bionic Devices Market Size Estimation and Forecast by Country
11.5 Asia Pacific Bionic Devices Market Size Estimation and Forecast by Fixation
11.6 Asia Pacific Bionic Devices Market Size Estimation and Forecast by Type
11.7 Asia Pacific Bionic Devices Market Size Estimation and Forecast by Technology
11.8 Asia Pacific Bionic Devices Market Size Estimation and Forecast by End-users
11.9 Japan Bionic Devices Market Analysis
11.10 China Bionic Devices Market Analysis
11.11 India Bionic Devices Market Analysis
11.12 Australia Bionic Devices Market Analysis
11.13 South Korea Bionic Devices Market Analysis
11.14 Rest of Asia Bionic Devices Market Analysis
12 Latin America Bionic Devices Market Analysis
12.1 Key Findings
12.2 Latin America Bionic Devices Market Attractiveness Index
12.3 Latin America Bionic Devices Market by Country, 2023, 2028 & 2033 (US$ Billion)
12.4 Latin America Bionic Devices Market Size Estimation and Forecast by Country
12.5 Latin America Bionic Devices Market Size Estimation and Forecast by Fixation
12.6 Latin America Bionic Devices Market Size Estimation and Forecast by Type
12.7 Latin America Bionic Devices Market Size Estimation and Forecast by Technology
12.8 Latin America Bionic Devices Market Size Estimation and Forecast by End-users
12.9 Brazil Bionic Devices Market Analysis
12.10 Mexico Bionic Devices Market Analysis
12.11 Argentina Bionic Devices Market Analysis
12.12 Rest of Latin America Bionic Devices Market Analysis
13 MEA Bionic Devices Market Analysis
13.1 Key Findings
13.2 MEA Bionic Devices Market Attractiveness Index
13.3 MEA Bionic Devices Market by Country, 2023, 2028 & 2033 (US$ Billion)
13.4 MEA Bionic Devices Market Size Estimation and Forecast by Country
13.5 MEA Bionic Devices Market Size Estimation and Forecast by Fixation
13.6 MEA Bionic Devices Market Size Estimation and Forecast by Type
13.7 MEA Bionic Devices Market Size Estimation and Forecast by Technology
13.8 MEA Bionic Devices Market Size Estimation and Forecast by End-users
13.9 GCC Bionic Devices Market Analysis
13.10 South Africa Bionic Devices Market Analysis
13.11 Rest of MEA Bionic Devices Market Analysis
14 Company Profiles
14.1 Company Share Analysis, 2022
14.2 Strategic Outlook
14.3 Ekso Bionics
14.3.1 Company Snapshot
14.3.2 Company Overview
14.3.3 Financial Analysis
14.3.3.1 Net Revenue, 2018-2022
14.3.3.2 R&D, 2018-2022
14.3.3.3 Regional Market Shares, 2022
14.3.3.4 Segment Market Shares, 2022
14.3.4 Product Benchmarking
14.3.5 Strategic Outlook
14.4 Össur
14.4.1 Company Snapshot
14.4.2 Company Overview
14.4.3 Financial Analysis
14.4.3.1 Net Revenue, 2018-2022
14.4.3.2 R&D, 2018-2022
14.4.3.3 Regional Market Shares, 2022
14.4.3.4 Segment Market Shares, 2022
14.4.4 Product Benchmarking
14.4.5 Strategic Outlook
14.5 Cochlear Ltd.
14.5.1 Company Snapshot
14.5.2 Company Overview
14.5.3 Financial Analysis
14.5.3.1 Net Revenue, 2018-2022
14.5.3.2 R&D, 2018-2022
14.5.3.3 Regional Market Shares, 2022
14.5.3.4 Segment Market Shares, 2022
14.5.4 Product Benchmarking
14.5.5 Strategic Outlook
14.6 LivaNova, PLC
14.6.1 Company Snapshot
14.6.2 Company Overview
14.6.3 Financial Analysis
14.6.3.1 Net Revenue, 2018-2022
14.6.3.2 R&D, 2018-2022
14.6.3.3 Regional Market Shares, 2022
14.6.4 Product Benchmarking
14.6.5 Strategic Outlook
14.7 Sonova
14.7.1 Company Snapshot
14.7.2 Company Overview
14.7.3 Financial Analysis
14.7.3.1 Net Revenue, 2018-2022
14.7.3.2 R&D, 2018-2022
14.7.3.3 Regional Market Shares, 2022
14.7.4 Product Benchmarking
14.7.5 Strategic Outlook
14.8 Ottobock (BionX Medical Technologies, Inc.)
14.8.1 Company Snapshot
14.8.2 Company Overview
14.8.3 Financial Analysis
14.8.3.1 Net Revenue, 2018-2022
14.8.3.2 Regional Market Shares, 2022
14.8.4 Product Benchmarking
14.8.5 Strategic Outlook
14.9 Demant A/S
14.9.1 Company Snapshot
14.9.2 Company Overview
14.9.3 Financial Analysis
14.9.3.1 Net Revenue, 2018-2022
14.9.3.2 R&D, 2018-2022
14.9.3.3 Regional Market Shares, 2022
14.9.4 Product Benchmarking
14.9.5 Strategic Outlook
14.10 SynCardia Systems, LLC
14.10.1 Company Snapshot
14.10.2 Company Overview
14.10.3 Product Benchmarking
14.10.4 Strategic Outlook
14.11 PIXIUM VISION
14.11.1 Company Snapshot
14.11.2 Company Overview
14.11.3 Financial Analysis
14.11.3.1 Net Revenue, 2018-2022
14.11.3.2 R&D, 2018-2022
14.11.4 Product Benchmarking
14.11.5 Strategic Outlook
14.12 Boston Scientific Corporation
14.12.1 Company Snapshot
14.12.2 Company Overview
14.12.3 Financial Analysis
14.12.3.1 Net Revenue, 2018-2022
14.12.3.2 R&D, 2018-2022
14.12.3.3 Regional Market Shares, 2022
14.12.4 Product Benchmarking
14.12.5 Strategic Outlook
14.13 Medtronic Plc
14.13.1 Company Snapshot
14.13.2 Company Overview
14.13.3 Financial Analysis
14.13.3.1 Net Revenue, 2018-2023
14.13.3.2 R&D, 2018-2023
14.13.3.3 Regional Market Shares, 2023
14.13.3.4 Segment Market Shares, 2023
14.13.4 Product Benchmarking
14.13.5 Strategic Outlook
14.14 Abbott Laboratories
14.14.1 Company Snapshot
14.14.2 Company Overview
14.14.3 Financial Analysis
14.14.3.1 Net Revenue,2018-2022
14.14.3.2 R&D,2018-2022
14.14.3.3 Regional Market Shares, 2022
14.14.3.4 Segment Market Shares, 2022
14.14.4 Product Benchmarking
14.14.5 Strategic Outlook
14.15 Zimmer Biomet
14.15.1 Company Snapshot
14.15.2 Company Overview
14.15.3 Financial Analysis
14.15.3.1 Net Revenue,2018-2022
14.15.3.2 R&D,2018-2022
14.15.3.3 Regional Market Shares, 2022
14.15.3.4 Segment Market Shares, 2022
14.15.4 Product Benchmarking
14.15.5 Strategic Outlook
14.16 Johnson & Johnson
14.16.1 Company Snapshot
14.16.2 Company Overview
14.16.3 Financial Analysis
14.16.3.1 Net Revenue,2018-2022
14.16.3.2 R&D,2018-2022
14.16.3.3 Regional Market Shares, 2022
14.16.3.4 Segment Market Shares, 2022
14.16.4 Product Benchmarking
14.16.5 Strategic Outlook
15 Conclusion and Recommendations
15.1 Concluding Remarks from Visiongain
15.2 Recommendations for Market Players
List of Tables
Table 1 Bionic Devices Market Snapshot, 2023 & 2033 (US$ Billion, CAGR %)
Table 2 Strategic Outlook
Table 3 Bionic Devices Market Forecast by Region, 2023-2033 (US$ Billion, AGR%, CAGR%): “V” Shaped Recovery
Table 4 Bionic Devices Market Forecast by Region, 2023-2033 (US$ Billion, AGR%, CAGR%): “U” Shaped Recovery
Table 5 Bionic Devices Market Forecast by Region, 2023-2033 (US$ Billion, AGR%, CAGR%): “W” Shaped Recovery
Table 6 Bionic Devices Market Forecast by Region, 2023-2033 (US$ Billion, AGR%, CAGR%): “L” Shaped Recovery
Table 7 Bionic Devices Market Forecast by Fixation, 2023-2033 (US$ Billion, AGR%, CAGR%)
Table 8 Implantable Bionics Segment Market Forecast by Region, 2023-2033 (US$ Billion, AGR%, CAGR%)
Table 9 External Bionics Segment Market Forecast by Region, 2023-2033 (US$ Billion, AGR%, CAGR%)
Table 10 Bionic Devices Market Forecast by Type, 2023-2033 (US$ Billion, AGR%, CAGR%)
Table 11 Heart Bionics Segment Market Forecast by Region, 2023-2033 (US$ Billion, AGR%, CAGR%)
Table 12 Neural Bionics Segment Market Forecast by Region, 2023-2033 (US$ Billion, AGR%, CAGR%)
Table 13 Cochlear Implants Segment Market Forecast by Region, 2023-2033 (US$ Billion, AGR%, CAGR%)
Table 14 Orthopaedic Bionics Segment Market Forecast by Region, 2023-2033 (US$ Billion, AGR%, CAGR%)
Table 15 Exoskeleton Bionics Segment Market Forecast by Region, 2023-2033 (US$ Billion, AGR%, CAGR%)
Table 16 Others Segment Market Forecast by Region, 2023-2033 (US$ Billion, AGR%, CAGR%)
Table 17 Bionic Devices Market Forecast by Technology, 2023-2033 (US$ Billion, AGR%, CAGR%)
Table 18 Electronic Bionics Segment Market Forecast by Region, 2023-2033 (US$ Billion, AGR%, CAGR%)
Table 19 Mechanical Bionics Segment Market Forecast by Region, 2023-2033 (US$ Billion, AGR%, CAGR%)
Table 20 Bionic Devices Market Forecast by End-users, 2023-2033 (US$ Billion, AGR%, CAGR%)
Table 21 Hospitals Segment Market Forecast by Region, 2023-2033 (US$ Billion, AGR%, CAGR%)
Table 22 ASCs Segment Market Forecast by Region, 2023-2033 (US$ Billion, AGR%, CAGR%)
Table 23 Others Segment Market Forecast by Region, 2023-2033 (US$ Billion, AGR%, CAGR%)
Table 24 Bionic Devices Market Forecast by Region, 2023-2033 (US$ Billion, AGR%, CAGR%)
Table 25 North America Bionic Devices Market Forecast by Country, 2023-2033 (US$ Billion, AGR%, CAGR%)
Table 26 North America Bionic Devices Market Forecast by Fixation, 2023-2033 (US$ Billion, AGR%, CAGR%)
Table 27 North America Bionic Devices Market Forecast by Type, 2023-2033 (US$ Billion, AGR%, CAGR%)
Table 28 North America Bionic Devices Market Forecast by Technology, 2023-2033 (US$ Billion, AGR%, CAGR%)
Table 29 Bionic Devices Market Forecast by End-users, 2023-2033 (US$ Billion, AGR%, CAGR%)
Table 30 U.S. Bionic Devices Market Forecast, 2023-2033 (US$ Billion, AGR%, CAGR%)
Table 31 Canada Bionic Devices Market Forecast, 2023-2033 (US$ Billion, AGR%, CAGR%)
Table 32 Europe Bionic Devices Market Forecast by Country, 2023-2033 (US$ Billion, AGR%, CAGR%)
Table 33 Europe Bionic Devices Market Forecast by Fixation, 2023-2033 (US$ Billion, AGR%, CAGR%)
Table 34 Europe Bionic Devices Market Forecast by Type, 2023-2033 (US$ Billion, AGR%, CAGR%)
Table 35 Europe Bionic Devices Market Forecast by Technology, 2023-2033 (US$ Billion, AGR%, CAGR%)
Table 36 Bionic Devices Market Forecast by End-users, 2023-2033 (US$ Billion, AGR%, CAGR%)
Table 37 Germany Bionic Devices Market Forecast, 2023-2033 (US$ Billion, AGR%, CAGR%)
Table 38 UK Bionic Devices Market Forecast, 2023-2033 (US$ Billion, AGR%, CAGR%)
Table 39 France Bionic Devices Market Forecast, 2023-2033 (US$ Billion, AGR%, CAGR%)
Table 40 Italy Bionic Devices Market Forecast, 2023-2033 (US$ Billion, AGR%, CAGR%)
Table 41 Spain Bionic Devices Market Forecast, 2023-2033 (US$ Billion, AGR%, CAGR%)
Table 42 Russia Bionic Devices Market Forecast, 2023-2033 (US$ Billion, AGR%, CAGR%)
Table 43 Rest of Europe Bionic Devices Market Forecast, 2023-2033 (US$ Billion, AGR%, CAGR%)
Table 44 Asia Bionic Devices Market Forecast by Country, 2023-2033 (US$ Billion, AGR%, CAGR%)
Table 45 Asia Pacific Bionic Devices Market Forecast by Fixation, 2023-2033 (US$ Billion, AGR%, CAGR%)
Table 46 Asia Pacific Bionic Devices Market Forecast by Type, 2023-2033 (US$ Billion, AGR%, CAGR%)
Table 47 Asia Pacific Bionic Devices Market Forecast by Technology, 2023-2033 (US$ Billion, AGR%, CAGR%)
Table 48 Bionic Devices Market Forecast by End-users, 2023-2033 (US$ Billion, AGR%, CAGR%)
Table 49 Japan Bionic Devices Market Forecast, 2023-2033 (US$ Billion, AGR%, CAGR%)
Table 50 China Bionic Devices Market Forecast, 2023-2033 (US$ Billion, AGR%, CAGR%)
Table 51 India Bionic Devices Market Forecast, 2023-2033 (US$ Billion, AGR%, CAGR%)
Table 52 Australia Bionic Devices Market Forecast, 2023-2033 (US$ Billion, AGR%, CAGR%)
Table 53 South Korea Bionic Devices Market Forecast, 2023-2033 (US$ Billion, AGR%, CAGR%)
Table 54 Rest of Asia Bionic Devices Market Forecast, 2023-2033 (US$ Billion, AGR%, CAGR%)
Table 55 Latin America Bionic Devices Market Forecast by Country, 2023-2033 (US$ Billion, AGR%, CAGR%)
Table 56 Latin America Bionic Devices Market Forecast by Fixation, 2023-2033 (US$ Billion, AGR%, CAGR%)
Table 57 Latin America Bionic Devices Market Forecast by Type, 2023-2033 (US$ Billion, AGR%, CAGR%)
Table 58 Latin America Bionic Devices Market Forecast by Technology, 2023-2033 (US$ Billion, AGR%, CAGR%)
Table 59 Bionic Devices Market Forecast by End-users, 2023-2033 (US$ Billion, AGR%, CAGR%)
Table 60 Brazil Bionic Devices Market Forecast, 2023-2033 (US$ Billion, AGR%, CAGR%)
Table 61 Mexico Bionic Devices Market Forecast, 2023-2033 (US$ Billion, AGR%, CAGR%)
Table 62 Argentina Bionic Devices Market Forecast, 2023-2033 (US$ Billion, AGR%, CAGR%)
Table 63 Rest of Latin America Bionic Devices Market Forecast, 2023-2033 (US$ Billion, AGR%, CAGR%)
Table 64 MEA Bionic Devices Market Forecast by Country, 2023-2033 (US$ Billion, AGR%, CAGR%)
Table 65 MEA Bionic Devices Market Forecast by Fixation, 2023-2033 (US$ Billion, AGR%, CAGR%)
Table 66 MEA Bionic Devices Market Forecast by Type, 2023-2033 (US$ Billion, AGR%, CAGR%)
Table 67 MEA Bionic Devices Market Forecast by Technology, 2023-2033 (US$ Billion, AGR%, CAGR%)
Table 68 Bionic Devices Market Forecast by End-users, 2023-2033 (US$ Billion, AGR%, CAGR%)
Table 69 GCC Bionic Devices Market Forecast, 2023-2033 (US$ Billion, AGR%, CAGR%)
Table 70 South Africa Bionic Devices Market Forecast, 2023-2033 (US$ Billion, AGR%, CAGR%)
Table 71 Rest of MEA Bionic Devices Market Forecast, 2023-2033 (US$ Billion, AGR%, CAGR%)
Table 72 Strategic Outlook
Table 73 Ekso Bionics: Key Details, (CEO, HQ, Revenue, Founded, No. of Employees, Company Type, Website, Business Segment)
Table 74 Ekso Bionics: Product Benchmarking
Table 75 Ekso Bionics Strategic Outlook
Table 76 Össur: Key Details, (CEO, HQ, Revenue, Founded, No. of Employees, Company Type, Website, Business Segment)
Table 77 Össur: Product Benchmarking
Table 78 Össur: Strategic Outlook
Table 79 Cochlear Ltd.: Key Details, (CEO, HQ, Revenue, Founded, No. of Employees, Company Type, Website, Business Segment)
Table 80 Cochlear Ltd.: Product Benchmarking
Table 81 Cochlear Ltd. Strategic Outlook
Table 82 LivaNova, PLC: Key Details, (CEO, HQ, Revenue, Founded, No. of Employees, Company Type, Website, Business Segment)
Table 83 LivaNova, PLC: Product Benchmarking
Table 84 LivaNova, PLC: Strategic Outlook
Table 85 Sonova: Key Details, (CEO, HQ, Revenue, Founded, No. of Employees, Company Type, Website, Business Segment)
Table 86 Sonova: Product Benchmarking
Table 87 Sonova Strategic Outlook
Table 88 Ottobock: Key Details, (CEO, HQ, Revenue, Founded, No. of Employees, Company Type, Website, Business Segment)
Table 89 Ottobock: Product Benchmarking
Table 90 Ottobock Strategic Outlook
Table 91 Demant A/S: Key Details, (CEO, HQ, Revenue, Founded, No. of Employees, Company Type, Website, Business Segment)
Table 92 Demant A/S: Product Benchmarking
Table 93 Demant A/S Strategic Outlook
Table 94 SynCardia Systems, LLC: Key Details, (CEO, HQ, Revenue, Founded, No. of Employees, Company Type, Website, Business Segment)
Table 95 SynCardia Systems, LLC: Product Benchmarking
Table 96 SynCardia Systems: Strategic Outlook
Table 97 PIXIUM VISION: Key Details, (CEO, HQ, Revenue, Founded, No. of Employees, Company Type, Website, Business Segment)
Table 98 PIXIUM VISION: Product Benchmarking
Table 99 PIXIUM VISION Strategic Outlook
Table 100 Boston Scientific Corporation: Key Details, (CEO, HQ, Revenue, Founded, No. of Employees, Company Type, Website, Business Segment)
Table 101 Boston Scientific Corporation: Product Benchmarking
Table 102 Boston Scientific Corporation Strategic Outlook
Table 103 Medtronic Plc: Key Details, (CEO, HQ, Revenue, Founded, No. of Employees, Company Type, Website, Business Segment)
Table 104 Medtronic Plc: Product Benchmarking
Table 105 Medtronic Plc: Strategic Outlook
Table 106 Abbott Laboratories: Key Details, (CEO, HQ, Revenue, Founded, No. of Employees, Company Type, Website, Business Segment)
Table 107 Abbott Laboratories: Product Benchmarking
Table 108 Abbott Laboratories: Strategic Outlook
Table 109 Zimmer Biomet: Key Details, (CEO, HQ, Revenue, Founded, No. of Employees, Company Type, Website, Business Segment)
Table 110 Zimmer Biomet: Product Benchmarking
Table 111 Zimmer Biomet: Strategic Outlook
Table 112 Johnson & Johnson: Key Details, (CEO, HQ, Revenue, Founded, No. of Employees, Company Type, Website, Business Segment)
Table 113 Johnson & Johnson: Product Benchmarking
Table 114 Johnson & Johnson: Strategic Outlook
List of Figures
Figure 1 Bionic Devices Market Segmentation
Figure 2 Bionic Devices Market by Fixation: Market Attractiveness Index
Figure 3 Bionic Devices Market by Type: Market Attractiveness Index
Figure 4 Bionic Devices Market by Technology Market Attractiveness Index
Figure 5 Bionic Devices Market by End-users: Market Attractiveness Index
Figure 6 Bionic Devices Market Attractiveness Index by Region
Figure 7 Bionic Devices Market: Market Dynamics
Figure 8 Bionic Devices Market by Region, 2023-2033 (US$ Billion, AGR %): “V” Shaped Recovery
Figure 9 Bionic Devices Market by Region, 2023-2033 (US$ Billion, AGR %): “U” Shaped Recovery
Figure 10 Bionic Devices Market by Region, 2023-2033 (US$ Billion, AGR %): “W” Shaped Recovery
Figure 11 Bionic Devices Market by Region, 2023-2033 (US$ Billion, AGR %): “L” Shaped Recovery
Figure 12 Bionic Devices Market: Porter’s Five Forces Analysis
Figure 13 Bionic Devices Market: PEST Analysis
Figure 14 Bionic Devices Market by Fixation: Market Attractiveness Index
Figure 15 Bionic Devices Market Forecast by Fixation, 2023-2033 (US$ Billion, AGR %)
Figure 16 Cell And Gene Therapy Cold Chain Logistics Share Forecast by Fixation, 2023, 2028, 2033 (%)
Figure 17 Implantable Bionics Segment Market Forecast by Region, 2023-2033 (US$ Billion, AGR %)
Figure 18 Implantable Bionics Segment Market Share Forecast by Region, 2023 & 2033 (%)
Figure 19 External Bionics Segment Market Forecast by Region, 2023-2033 (US$ Billion, AGR %)
Figure 20 External Bionics Segment Market Share Forecast by Region, 2023 & 2033 (%)
Figure 21 Bionic Devices Market by Type: Market Attractiveness Index
Figure 22 Bionic Devices Market Forecast by Type, 2023-2033 (US$ Billion, AGR %)
Figure 23 Cell And Gene Therapy Cold Chain Logistics Share Forecast by Type, 2023, 2028, 2033 (%)
Figure 24 Heart Bionics Segment Market Forecast by Region, 2023-2033 (US$ Billion, AGR %)
Figure 25 Heart Bionics Segment Market Share Forecast by Region, 2023 & 2033 (%)
Figure 26 Neural Bionics Segment Market Forecast by Region, 2023-2033 (US$ Billion, AGR %)
Figure 27 Neural Bionics Segment Market Share Forecast by Region, 2023 & 2033 (%)
Figure 28 Cochlear Implants Segment Market Forecast by Region, 2023-2033 (US$ Billion, AGR %)
Figure 29 Cochlear Implants Segment Market Share Forecast by Region, 2023 & 2033 (%)
Figure 30 Orthopaedic Bionics Segment Market Forecast by Region, 2023-2033 (US$ Billion, AGR %)
Figure 31 Orthopaedic Bionics Segment Market Share Forecast by Region, 2023 & 2033 (%)
Figure 32 Exoskeleton Bionics Segment Market Forecast by Region, 2023-2033 (US$ Billion, AGR %)
Figure 33 Exoskeleton Bionics Segment Market Share Forecast by Region, 2023 & 2033 (%)
Figure 34 Others Segment Market Forecast by Region, 2023-2033 (US$ Billion, AGR %)
Figure 35 Others Segment Market Share Forecast by Region, 2023 & 2033 (%)
Figure 36 Bionic Devices Market by Technology: Market Attractiveness Index
Figure 37 Bionic Devices Market Forecast by Technology, 2023-2033 (US$ Billion, AGR %)
Figure 38 Cell And Gene Therapy Cold Chain Logistics Share Forecast by Technology, 2023, 2028, 2033 (%)
Figure 39 Electronic Bionics Segment Market Forecast by Region, 2023-2033 (US$ Billion, AGR %)
Figure 40 Electronic Bionics Segment Market Share Forecast by Region, 2023 & 2033 (%)
Figure 41 Mechanical Bionics Segment Market Forecast by Region, 2023-2033 (US$ Billion, AGR %)
Figure 42 Mechanical Bionics Segment Market Share Forecast by Region, 2023 & 2033 (%)
Figure 43 Bionic Devices Market by End-users: Market Attractiveness Index
Figure 44 Bionic Devices Market Forecast by End-users, 2023-2033 (US$ Billion, AGR %)
Figure 45 Cell And Gene Therapy Cold Chain Logistics Share Forecast by End-users, 2023, 2028, 2033 (%)
Figure 46 Hospitals Segment Market Forecast by Region, 2023-2033 (US$ Billion, AGR %)
Figure 47 Hospitals Segment Market Share Forecast by Region, 2023 & 2033 (%)
Figure 48 ASCs Segment Market Forecast by Region, 2023-2033 (US$ Billion, AGR %)
Figure 49 ASCs Segment Market Share Forecast by Region, 2023 & 2033 (%)
Figure 50 Others Segment Market Forecast by Region, 2023-2033 (US$ Billion, AGR %)
Figure 51 Others Segment Market Share Forecast by Region, 2023 & 2033 (%)
Figure 52 Bionic Devices Market Forecast by Region 2023 and 2033 (Revenue, CAGR%)
Figure 53 Bionic Devices Market Share Forecast by Region 2023, 2028, 2033 (%)
Figure 54 Bionic Devices Market by Region, 2023-2033 (US$ Billion, AGR %)
Figure 55 North America Bionic Devices Market Attractiveness Index
Figure 56 North America Bionic Devices Market by Region, 2023, 2028 & 2033 (US$ Billion)
Figure 57 North America Bionic Devices Market Forecast by Country, 2023-2033 (US$ Billion, AGR %)
Figure 58 North America Bionic Devices Market Share Forecast by Country, 2023 & 2033 (%)
Figure 59 North America Bionic Devices Market Forecast by Fixation, 2023-2033 (US$ Billion, AGR %)
Figure 60 North America Bionic Devices Market Share Forecast by Fixation, 2023 & 2033 (%)
Figure 61 North America Bionic Devices Market Forecast by Type, 2023-2033 (US$ Billion, AGR %)
Figure 62 North America Bionic Devices Market Share Forecast by Type, 2023 & 2033 (%)
Figure 63 North America Bionic Devices Market Forecast by Technology, 2023-2033 (US$ Billion, AGR %)
Figure 64 North America Bionic Devices Market Share Forecast by Technology, 2023 & 2033 (%)
Figure 65 North America Bionic Devices Market Forecast by End-users, 2023-2033 (US$ Billion, AGR %)
Figure 66 North America Bionic Devices Market Share Forecast by End-users, 2023 & 2033 (%)
Figure 67 U.S. Bionic Devices Market Forecast, 2023-2033 (US$ Billion, AGR %)
Figure 68 Canada Bionic Devices Market Forecast, 2023-2033 (US$ Billion, AGR %)
Figure 69 Europe Bionic Devices Market Attractiveness Index
Figure 70 Europe Bionic Devices Market by Region, 2023, 2028 & 2033 (US$ Billion)
Figure 71 Europe Bionic Devices Market Forecast by Country, 2023-2033 (US$ Billion, AGR %)
Figure 72 Europe Bionic Devices Market Share Forecast by Country, 2023 & 2033 (%)
Figure 73 Europe Bionic Devices Market Forecast by Fixation, 2023-2033 (US$ Billion, AGR %)
Figure 74 Europe Bionic Devices Market Share Forecast by Fixation, 2023 & 2033 (%)
Figure 75 Europe Bionic Devices Market Forecast by Type, 2023-2033 (US$ Billion, AGR %)
Figure 76 Europe Bionic Devices Market Share Forecast by Type, 2023 & 2033 (%)
Figure 77 Europe Bionic Devices Market Forecast by Technology, 2023-2033 (US$ Billion, AGR %)
Figure 78 Europe Bionic Devices Market Share Forecast by Technology, 2023 & 2033 (%)
Figure 79 Europe Bionic Devices Market Forecast by End-users, 2023-2033 (US$ Billion, AGR %)
Figure 80 Europe Bionic Devices Market Share Forecast by End-users, 2023 & 2033 (%)
Figure 81 Germany Bionic Devices Market Forecast, 2023-2033 (US$ Billion, AGR %)
Figure 82 UK Bionic Devices Market Forecast, 2023-2033 (US$ Billion, AGR %)
Figure 83 France Bionic Devices Market Forecast, 2023-2033 (US$ Billion, AGR %)
Figure 84 Italy Bionic Devices Market Forecast, 2023-2033 (US$ Billion, AGR %)
Figure 85 Spain Bionic Devices Market Forecast, 2023-2033 (US$ Billion, AGR %)
Figure 86 Russia Bionic Devices Market Forecast, 2023-2033 (US$ Billion, AGR %)
Figure 87 Rest of Europe Bionic Devices Market Forecast, 2023-2033 (US$ Billion, AGR %)
Figure 88 Asia Bionic Devices Market Attractiveness Index
Figure 89 Asia Bionic Devices Market by Region, 2023, 2028 & 2033 (US$ Billion)
Figure 90 Asia Bionic Devices Market Forecast by Country, 2023-2033 (US$ Billion, AGR %)
Figure 91 Asia Bionic Devices Market Share Forecast by Country, 2023 & 2033 (%)
Figure 92 Asia Pacific Bionic Devices Market Forecast by Fixation, 2023-2033 (US$ Billion, AGR %)
Figure 93 Asia Pacific Bionic Devices Market Share Forecast by Fixation, 2023 & 2033 (%)
Figure 94 Asia Pacific Bionic Devices Market Forecast by Type, 2023-2033 (US$ Billion, AGR %)
Figure 95 Asia Pacific Bionic Devices Market Share Forecast by Type, 2023 & 2033 (%)
Figure 96 Asia Pacific Bionic Devices Market Forecast by Technology, 2023-2033 (US$ Billion, AGR %)
Figure 97 Asia Pacific Bionic Devices Market Share Forecast by Technology, 2023 & 2033 (%)
Figure 98 Asia Pacific Bionic Devices Market Forecast by End-users, 2023-2033 (US$ Billion, AGR %)
Figure 99 Asia Pacific Bionic Devices Market Share Forecast by End-users, 2023 & 2033 (%)
Figure 100 Japan Bionic Devices Market Forecast, 2023-2033 (US$ Billion, AGR %)
Figure 101 China Bionic Devices Market Forecast, 2023-2033 (US$ Billion, AGR %)
Figure 102 India Bionic Devices Market Forecast, 2023-2033 (US$ Billion, AGR %)
Figure 103 Australia Bionic Devices Market Forecast, 2023-2033 (US$ Billion, AGR %)
Figure 104 South Korea Bionic Devices Market Forecast, 2023-2033 (US$ Billion, AGR %)
Figure 105 Rest of Asia Bionic Devices Market Forecast, 2023-2033 (US$ Billion, AGR %)
Figure 106 Latin America Bionic Devices Market Attractiveness Index
Figure 107 Latin America Bionic Devices Market by Region, 2023, 2028 & 2033 (US$ Billion)
Figure 108 Latin America Bionic Devices Market Forecast by Country, 2023-2033 (US$ Billion, AGR %)
Figure 109 Latin America Bionic Devices Market Share Forecast by Country, 2023 & 2033 (%)
Figure 110 Latin America Bionic Devices Market Forecast by Fixation, 2023-2033 (US$ Billion, AGR %)
Figure 111 Latin America Bionic Devices Market Share Forecast by Fixation, 2023 & 2033 (%)
Figure 112 Latin America Bionic Devices Market Forecast by Type, 2023-2033 (US$ Billion, AGR %)
Figure 113 Latin America Bionic Devices Market Share Forecast by Type, 2023 & 2033 (%)
Figure 114 Latin America Bionic Devices Market Forecast by Technology, 2023-2033 (US$ Billion, AGR %)
Figure 115 Latin America Bionic Devices Market Share Forecast by Technology, 2023 & 2033 (%)
Figure 116 Latin America Bionic Devices Market Forecast by End-users, 2023-2033 (US$ Billion, AGR %)
Figure 117 Latin America Bionic Devices Market Share Forecast by End-users, 2023 & 2033 (%)
Figure 118 Brazil Bionic Devices Market Forecast, 2023-2033 (US$ Billion, AGR %)
Figure 119 Mexico Bionic Devices Market Forecast, 2023-2033 (US$ Billion, AGR %)
Figure 120 Argentina Bionic Devices Market Forecast, 2023-2033 (US$ Billion, AGR %)
Figure 121 Rest of Latin America Bionic Devices Market Forecast, 2023-2033 (US$ Billion, AGR %)
Figure 122 MEA Bionic Devices Market Attractiveness Index
Figure 123 MEA Bionic Devices Market by Region, 2023, 2028 & 2033 (US$ Billion)
Figure 124 MEA Bionic Devices Market Forecast by Country, 2023-2033 (US$ Billion, AGR %)
Figure 125 MEA Bionic Devices Market Share Forecast by Country, 2023 & 2033 (%)
Figure 126 MEA Bionic Devices Market Forecast by Fixation, 2023-2033 (US$ Billion, AGR %)
Figure 127 MEA Bionic Devices Market Share Forecast by Fixation, 2023 & 2033 (%)
Figure 128 MEA Bionic Devices Market Forecast by Type, 2023-2033 (US$ Billion, AGR %)
Figure 129 MEA Bionic Devices Market Share Forecast by Type, 2023 & 2033 (%)
Figure 130 MEA Bionic Devices Market Forecast by Technology, 2023-2033 (US$ Billion, AGR %)
Figure 131 MEA Bionic Devices Market Share Forecast by Technology, 2023 & 2033 (%)
Figure 132 MEA Bionic Devices Market Forecast by End-users, 2023-2033 (US$ Billion, AGR %)
Figure 133 MEA Bionic Devices Market Share Forecast by End-users, 2023 & 2033 (%)
Figure 134 GCC Bionic Devices Market Forecast, 2023-2033 (US$ Billion, AGR %)
Figure 135 South Africa Bionic Devices Market Forecast, 2023-2033 (US$ Billion, AGR %)
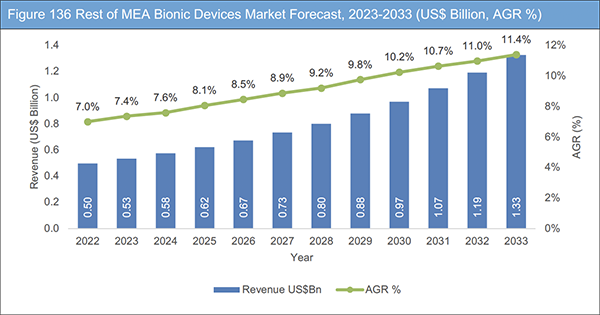
Figure 136 Rest of MEA Bionic Devices Market Forecast, 2023-2033 (US$ Billion, AGR %)
Figure 137 Bionic Devices Market: Company Share Analysis, 2022
Figure 138 Ekso Bionics: Net Revenue, 2018-2022 (US$ Million, AGR%)
Figure 139 Ekso Bionics: Net Revenue, 2018-2022 (US$ Million, AGR%)
Figure 140 Ekso Bionics: Regional Market Shares, 2022
Figure 141 Ekso Bionics: Business Segment Market Shares, 2022
Figure 142 Össur: Net Revenue, 2018-2022 (US$ Million, AGR%)
Figure 143 Össur: Net Revenue, 2018-2022 (US$ Million, AGR%)
Figure 144 Össur: Regional Market Shares, 2022
Figure 145 Össur: Business Segment Market Shares, 2022
Figure 146 Cochlear Ltd.: Net Revenue, 2018-2022 (US$ Million, AGR%)
Figure 147 Cochlear Ltd.: R&D, 2018-2022 (US$ Million, AGR%)
Figure 148 Cochlear Ltd.: Regional Segment Market Shares, 2022
Figure 149 Cochlear Ltd.: Business Segment Market Shares, 2022
Figure 150 LivaNova, PLC: Net Revenue, 2018-2022 (US$ Million, AGR%)
Figure 151 LivaNova, PLC: R&D, 2018-2022 (US$ Million, AGR%)
Figure 152 LivaNova, PLC: Regional Segment Market Shares, 2022
Figure 153 Sonova: Net Revenue, 2018-2022 (US$ Million, AGR%)
Figure 154 Sonova: R&D, 2018-2022 (US$ Million, AGR%)
Figure 155 Sonova: Regional Market Shares, 2022
Figure 156 Ottobock: Net Revenue, 2018-2022 (US$ Million, AGR%)
Figure 157 Ottobock: Regional Market Shares, 2022
Figure 158 Demant A/S: Net Revenue, 2018-2022 (US$ Million, AGR%)
Figure 159 Demant A/S: R&D, 2018-2022 (US$ Million, AGR%)
Figure 160 Demant A/S: Regional Market Shares, 2022
Figure 161 PIXIUM VISION: Net Revenue, 2018-2022 (US$ Million, AGR%)
Figure 162 PIXIUM VISION: R&D, 2018-2022 (US$ Million, AGR%)
Figure 163 Boston Scientific Corporation: Net Revenue, 2018-2022 (US$ Million, AGR%)
Figure 164 Boston Scientific Corporation: R&D, 2018-2022 (US$ Million, AGR%)
Figure 165 Boston Scientific Corporation: Regional Market Shares, 2022
Figure 166 Medtronic Plc: Net Revenue, 2018-2023 (US$ Billion, AGR%)
Figure 167 Medtronic Plc: R&D, 2018-2023 (US$ Billion, AGR%)
Figure 168 Medtronic Plc: Regional Market Shares, 2023
Figure 169 Medtronic Plc: Business Segment Market Shares, 2022
Figure 170 Abbott Laboratories: Net Revenue, 2018-2022 (US$ Million, AGR%)
Figure 171 Abbott Laboratories: R&D, 2018-2022 (US$ Million, AGR%)
Figure 172 Abbott Laboratories: Regional Market Shares, 2022
Figure 173 Abbott Laboratories: Segment Market Shares, 2022
Figure 174 Zimmer Biomet: Net Revenue, 2018-2022 (US$ Million, AGR%)
Figure 175 Zimmer Biomet: R&D, 2018-2022 (US$ Million, AGR%)
Figure 176 Zimmer Biomet: Regional Market Shares, 2022
Figure 177 Zimmer Biomet: Segment Market Shares, 2022
Figure 178 Johnson & Johnson: Net Revenue, 2018-2022 (US$ Million, AGR%)
Figure 179 Johnson & Johnson: R&D, 2018-2022 (US$ Million, AGR%)
Figure 180 Johnson & Johnson: Regional Market Shares, 2022
Figure 181 Johnson & Johnson: Segment Market Shares, 2022
List of Companies Profiled in the Report
Abbott Laboratories
Boston Scientific Corporation
Cochlear Ltd.
Demant A/S
Ekso Bionics
Johnson & Johnson
LivaNova, PLC
Medtronic PLC
Össur
Ottobock (BionX Medical Technologies, Inc.)
PIXIUM VISION
Sonova
SynCardia Systems, LLC
Zimmer Biomet
List of Other Companies Mentioned in the Report
Beta Bionics
BioIntelliSense
Bionic Technology Group
BrainGate
Cephea Valve Technologies
Convatec Group Plc
Curexo, Inc.
Cyberdyne Inc.
Cyborg MedTek
DePuy Synthes
Endolite Chile
Exoprotech
EyRIS
Genium Bionic Prosthetic System
Harmonic Bionics
HYSOUND Group
Japan Lifeline Co., Ltd.
LifeNet International
Limbs 4 Life
Marsi Bionics
MED-EL
Medicrea
MedX
MicroPort Scientific Corporation
Motorica
Neuralink
Neuronix
NeuroRehab
Orthotaxy
Ortoiberica
Oticon Medical
Otto Bock HealthCare
Prime Orthotics & Prosthetics
Psyonic
Retina Implant AG
ReWalk Robotics
Rex Bionics
Rex Bionics
Saluda Medical
Second Sight Medical Products
Stryker Corporation
Touch Bionics
List of Associations Mentioned in the Report
Asia Pacific Heart Rhythm Society (APHRS)
Association for the Physically Disabled of Kenya (APDK)
Bioengineering and Aerospace Engineering Group (BIOSISTEM)
Biomedical Engineering Department at the Monterrey Institute of Technology and Higher Education (ITESM)
BioRobotics Institute
Brazil Innovation Agency
Canadian Bionics Systems Network (CBSN)
Centres for Disease Control and Prevention (CDC)
Centres for Medicare and Medicaid Services (CMS)
Dubai Health Authority (DHA)
European Medicines Agency (EMA)
German Research Center for Artificial Intelligence (DFKI)
German Statutory Health Insurance (GKV)
Institute of Biotechnology and Molecular Medicine (IBIMOL)
Institute of Intelligent Systems and Robotics (ISIR)
International Labour Organization (ILO)
Italian National Health Service (Servizio Sanitario Nazionale)
King Abdullah University of Science and Technology (KAUST)
Medical Research Council (MRC)
National Centre for Biotechnology Information (NCBI)
National Health Service (NHS)
National Institutes of Health (NIH)
Spanish National Health System (Sistema Nacional de Salud)
Technology Innovation Agency (TIA)
U.S. Food and Drug Administration (FDA)
United Nations
United Nations Economic and Social Commission for Asia and the Pacific (ESCAP)
World Health Organization (WHO)